Measurement of Executive Functioning and High Intellectual Ability in Childhood: A Comparative Meta-Analysis


Abstract
:1. Introduction
1.1. Executive Functions and High Intellectual Ability
1.2. Measures of Executive Functions
2. Materials and Methods
2.1. Study Selection Criteria
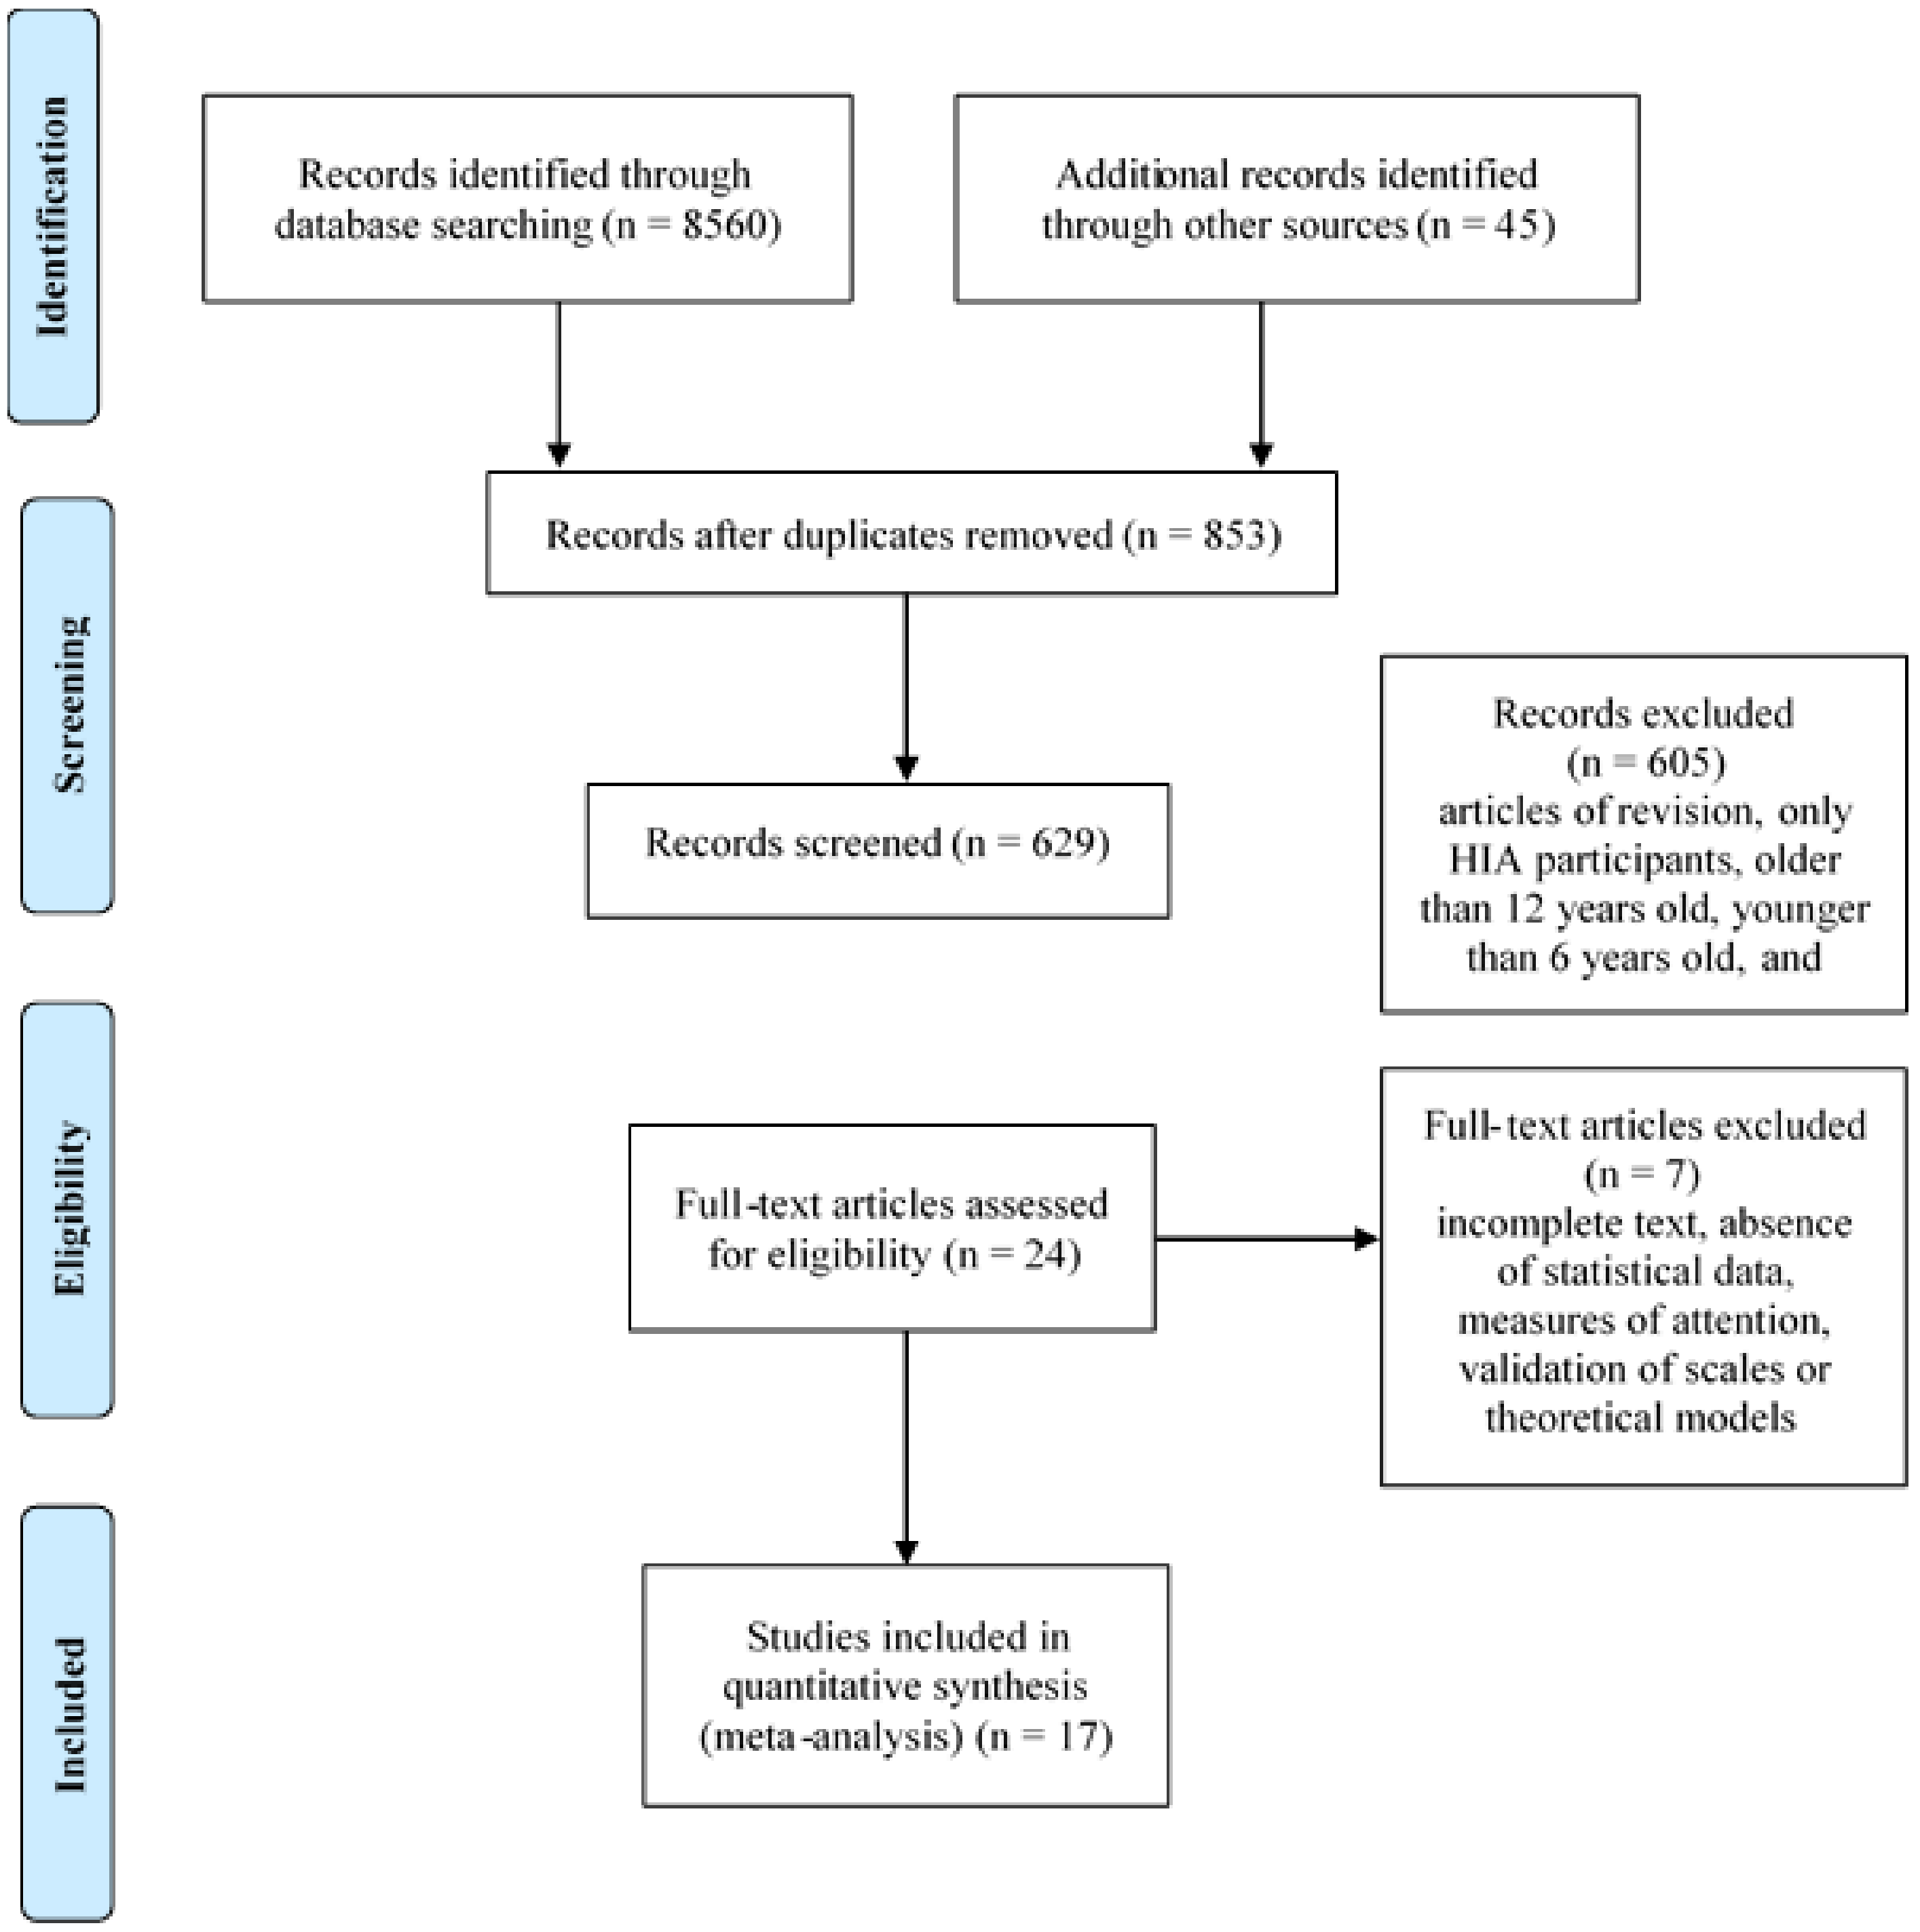
2.2. Identification of Qualifying Studies
2.3. Effect Size Calculation
2.4. Statistical Methods
3. Results
4. Discussion
Author Contributions
Funding
Conflicts of Interest
References
- Sastre-Riba, S. Moduladores de la Alta Capacidad Intelectual. Medicina 2020, 80, 53–57. [Google Scholar] [PubMed]
- Thomas, M.S. A neurocomputational model of developmental trajectories of gifted children under a polygenic model: When are gifted children held back by poor environments? Intelligence 2018, 69, 200–212. [Google Scholar] [CrossRef] [PubMed]
- Sauce, B.; Matzel, L. The Paradox of Intelligence: Heredability and Malleability Coexist in Hidden Gene-Environment Interplay. Psychol Bull. 2018, 144, 27–47. [Google Scholar] [CrossRef] [PubMed]
- Plomin, R.; Deary, I.J. Genetics and intelligence differences: Five special findings. Mol. Psychiatry 2014, 20, 98–108. [Google Scholar] [CrossRef] [PubMed] [Green Version]
- Subotnik, R.F.; Olszewski-Kubilius, P.; Worrell, F.C.; Pfeiffer, S.I.; Shaunessy-Dedrick, E.; Foley-Nicpon, M. Talent development as the most promising focus of giftedness and gifted education. In APA Handbook of Giftedness and Talent; Pfeiffer, S.I., Haugnessy-Dedrick, E., Foley-Nicpon, M., Eds.; American Psychological Association (APA): Washington DC, USA, 2018; pp. 231–245. [Google Scholar] [CrossRef]
- Roebers, C.M. Executive function and metacognition: Towards a unifying framework of cognitive self-regulation. Dev. Rev. 2017, 45, 31–51. [Google Scholar] [CrossRef]
- Diamond, A.; Ling, D.S. Conclusions about interventions, programs, and approaches for improving executive functions that appear justified and those that, despite much hype, do not. Dev. Cogn. Neurosci. 2016, 18, 34–48. [Google Scholar] [CrossRef] [Green Version]
- Miyake, A.; Friedman, N.P.; Emerson, M.J.; Witzki, A.H.; Howerter, A.; Wager, T.D. The Unity and Diversity of Executive Functions and Their Contributions to Complex “Frontal Lobe” Tasks: A Latent Variable Analysis. Cogn. Psychol. 2000, 41, 49–100. [Google Scholar] [CrossRef] [Green Version]
- Diamond, A. Executive functions. Annu. Rev. Psychol. 2012, 64, 135–168. [Google Scholar] [CrossRef] [Green Version]
- Zelazo, P.D. Executive function: Reflection, iterative reprocessing, complexity, and the developing brain. Dev. Rev. 2015, 38, 55–68. [Google Scholar] [CrossRef]
- Metcalfe, J.; Mischel, W. A hot/cool-system analysis of delay of gratification: Dynamics of willpower. Psychol. Rev. 1999, 106, 3–19. [Google Scholar] [CrossRef] [Green Version]
- Rueda, M.R.; Posner, M.I.; Rothbart, M.K. The Development of Executive Attention: Contributions to the Emergence of Self-Regulation. Dev. Neuropsychol. 2005, 28, 573–594. [Google Scholar] [CrossRef] [PubMed]
- Posner, M.I.; DiGirolamo, G.J. Executive attention: Conflict, target detection, and cognitive control. In The Attentive Brain; Parasuraman, R., Ed.; MIT Press: Cambridge, MA, USA, 1998; pp. 401–423. [Google Scholar]
- Diamond, A. Close interrelation of motor development and cognitive development and of the cerebellum and prefrontal cortex. Child Dev. 2000, 71, 44–56. [Google Scholar] [CrossRef] [PubMed]
- Wendelken, C.; Munakata, Y.; Baym, C.; Souza, M.; Bunge, S.A. Flexible rule use: Common neural substrates in children and adults. Dev. Cogn. Neurosci. 2012, 2, 329–339. [Google Scholar] [CrossRef] [PubMed] [Green Version]
- Friedman, N.P.; Miyake, A. Unity and diversity of executive functions: Individual differences as a window on cognitive structure. Cortex 2016, 86, 186–204. [Google Scholar] [CrossRef] [PubMed] [Green Version]
- Finch, M.E.H.; Neumeister, K.S.; Burney, V.H.; Cook, A.L. The Relationship of Cognitive and Executive Functioning with Achievement in Gifted Kindergarten Children. Gift. Child Q. 2014, 58, 167–182. [Google Scholar] [CrossRef]
- National Association for Gifted Children. Redefining Giftedness for a New Century: Shifting the Paradigm. Available online: http://www.nagc.org/index2.aspx?id64 (accessed on 9 March 2020).
- Riba, S.S.; Sáenz, L.V. Funciones ejecutivas y alta capacidad intelectual. Revista de Neurol. 2016, 62, 65. [Google Scholar] [CrossRef]
- Chan, R.C.; Shum, D.; Toulopoulou, T.; Chen, E.Y.H. Assessment of executive functions: Review of instruments and identification of critical issues. Arch. Clin. Neuropsychol. 2008, 23, 201–216. [Google Scholar] [CrossRef] [Green Version]
- Nyongesa, M.K.; Ssewanyana, D.; Mutua, A.M.; Chongwo, E.; Scerif, G.; Newton, C.R.J.C.; Abubakar, A. Assessing Executive Function in Adolescence: A Scoping Review of Existing Measures and Their Psychometric Robustness. Front. Psychol. 2019, 10, 311. [Google Scholar] [CrossRef] [Green Version]
- Verdejo-García, A.; Bechara, A. Neuropsicología de las funciones ejecutivas [Neuropsychology of executive functions]. Psicothema 2010, 22, 227–235. [Google Scholar]
- Blair, C. Developmental Science and Executive Function. Curr. Dir. Psychol. Sci. 2016, 25, 3–7. [Google Scholar] [CrossRef]
- Zelazo, P.D.; Anderson, J.E.; Richler, J.; Beaumont, J.L.; Weintraub, S.; Wallner-Allen, K. II. NIH Toolbox Cognition Battery (CB): Measuring Executive Function and Attention. Monogr. Soc. Res. Child Dev. 2013, 78, 16–33. [Google Scholar] [CrossRef] [PubMed]
- Willoughby, M.T.; Wirth, R.; Blair, C.B. Family Life Project Investigators Executive function in early childhood: Longitudinal measurement invariance and developmental change. Psychol. Assess. 2011, 24, 418–431. [Google Scholar] [CrossRef] [PubMed] [Green Version]
- Hedges, L.V.; Olkin, I. Statistical methods for Meta-Analysis; Academic Press: Cambridge, MA, USA, 1985. [Google Scholar]
- Cohen, J. Statistical Power Analysis for the Behavioral Sciences; Informa UK Limited: Mahwah, NJ, USA, 2013. [Google Scholar]
- Wilson, D. Practical Meta-Analys Effect Size Calculator [Calculadora On-Line]. Available online: https://cebcp.org/practical-meta-analysis-effect-size-calculator/ (accessed on 4 February 2020).
- Hedges, L.V. Distribution Theory for Glass’s Estimator of Effect Size and Related Estimators. J. Educ. Stat. 1981, 6, 107. [Google Scholar] [CrossRef]
- Botella, J.; Sánchez-Meca, J. Meta-análisis en Ciencias Sociales y de la Salud; Síntesis: Madrid, Spain, 2008. [Google Scholar]
- Sánchez-Meca, J.; Botella, J. Revisiones sistemáticas y meta-análisis: Herramientas para la práctica profesional. Pap. del Psicólogo 2010, 31, 7–17. [Google Scholar]
- DerSimonian, R.; Laird, N. Meta-analysis in clinical trials. Control. Clin. Trials 1986, 7, 177–188. [Google Scholar] [CrossRef]
- Borenstein, M.; Hedges, L.; Higgins, J.P.T.; Rothstein, H. Introduction to Meta-Analysis; Wiley: Chichester, UK, 2009. [Google Scholar]
- Lipsey, M.W.; Wilson, D.B. Practical Meta-Analysis; SAGE Publications: Los Angeles, CA, USA, 2001. [Google Scholar]
- Viechtbauer, W. Conducting Meta-Analyses in R with the metafor Package. J. Stat. Softw. 2010, 36, 1–48. [Google Scholar] [CrossRef] [Green Version]
- Alloway, T.P.; Elsworth, M. An investigation of cognitive skills and behavior in high ability students. Learn. Individ. Differ. 2012, 22, 891–895. [Google Scholar] [CrossRef]
- Berg, D.H.; McDonald, P.A. Differences in mathematical reasoning between typically achieving and gifted children. J. Cogn. Psychol. 2018, 30, 281–291. [Google Scholar] [CrossRef]
- Calero, M.D.; García-Martín, M.B.; Jiménez, M.I.; Kazén, M.; Araque, A. Self-regulation advantage for high-IQ children: Findings from a research study. Learn. Individ. Differ. 2007, 17, 328–343. [Google Scholar] [CrossRef]
- Duan, X.; Shi, J.; Wu, J.; Mou, Y.; Cui, H.; Wang, G. Electrophysiological correlates for response inhibition in intellectually gifted children: A Go/NoGo study. Neurosci. Lett. 2009, 457, 45–48. [Google Scholar] [CrossRef]
- Haring, IL. The Predictive Value of Working Memory and Creativity in Average Performing and Gifted Children. Master’s Thesis, Utrecht University, Utrecht, The Netherlands, 2016. [Google Scholar]
- Hoard, M.K.; Geary, D.C.; Byrd-Craven, J.; Nugent, L. Mathematical Cognition in Intellectually Precocious First Graders. Dev. Neuropsychol. 2008, 33, 251–276. [Google Scholar] [CrossRef] [PubMed] [Green Version]
- Johnson, J.; Im-Bolter, N.; Pascual-Leone, J. Development of Mental Attention in Gifted and Mainstream Children: The Role of Mental Capacity, Inhibition, and Speed of Processing. Child Dev. 2003, 74, 1594–1614. [Google Scholar] [CrossRef] [PubMed] [Green Version]
- Fard, E.K.; Keelor, J.L.; Bagheban, A.A.; Keith, R.W. Comparison of the Rey Auditory Verbal Learning Test (RAVLT) and Digit Test among Typically Achieving and Gifted Students. Iran. J. child Neurol. 2016, 10, 26–37. [Google Scholar]
- Kornmann, J.; Zettler, I.; Kammerer, Y.; Gerjets, P.; Trautwein, U. What characterizes children nominated as gifted by teachers? A closer consideration of working memory and intelligence. High Abil. Stud. 2015, 26, 1–18. [Google Scholar] [CrossRef]
- Li, D.; Liu, T.; Zhang, X.; Wang, M.; Wang, D.; Shi, J. Fluid intelligence, emotional intelligence, and the Iowa Gambling Task in children. Intelligence 2017, 62, 167–174. [Google Scholar] [CrossRef]
- Liu, T.; Xiao, T.; Shi, J.; Zhao, D. Response preparation and cognitive control of highly intelligent children: A Go-Nogo event-related potential study. Neuroscience 2011, 180, 122–128. [Google Scholar] [CrossRef]
- Liu, T.; Xiao, T.; Shi, J.; Zhao, L. Sensory gating, inhibition control and child intelligence: An event-related potentials study. Neuroscience 2011, 189, 250–257. [Google Scholar] [CrossRef]
- Montoya-Arenas, D.A.; Trujillo-Orrego, N.; Pineda-Salazar, D.A. Capacidad Intelectual y Función Ejecutiva en Niños Intelectualmente Talentosos y en Niños con Inteligencia Promedio * Intellectual Quotient and Executive Function in Gifted and Average IQ Children. Univ. Psychol. 2010, 9, 737–747. Available online: http://revistas.javeriana.edu.co/index.php/revPsycho/article/viewFile/579/582 (accessed on 16 January 2019). [CrossRef]
- Montoya-Arenas, D.A.; Aguirre-Acevedo, D.C.; Soto, C.M.D.; Salazar, D.A.P. Funciones ejecutivas y alta capacidad intelectual en niños en edad escolar: ¿se superponen por completo? Int. J. Psychol. Res. 2018, 11, 19–32. [Google Scholar] [CrossRef] [Green Version]
- Swanson, H.L. Cognitive processes that underlie mathematical precociousness in young children. J. Exp. Child Psychol. 2006, 93, 239–264. [Google Scholar] [CrossRef]
- Urben, S.; Camos, V.; Habersaat, S.; Stéphan, P. Faces presenting sadness enhance self-control abilities in gifted adolescents. Br. J. Dev. Psychol. 2018, 36, 514–520. [Google Scholar] [CrossRef] [PubMed] [Green Version]
- Vogelaar, B.; Resing, W.C.; Stad, F.E.; Sweijen, S.W. Is planning related to dynamic testing outcomes? Investigating the potential for learning of gifted and average-ability children. Acta Psychol. 2019, 196, 87–95. [Google Scholar] [CrossRef] [PubMed]
- Maddocks, D. Cognitive and Achievement Characteristics of Students from a National Sample Identified as Potentially Twice Exceptional (Gifted With a Learning Disability). Gift. Child Q. 2019, 64, 3–18. [Google Scholar] [CrossRef]
- Wallisch, A.; Little, L.M.; Dean, E.; Dunn, W. Executive Function Measures for Children: A Scoping Review of Ecological Validity. OTJR Occup. Particip. Health 2017, 38. [Google Scholar] [CrossRef] [PubMed] [Green Version]


| Studies | Sample HIA | Sample Average | Age Range | HIA Identification | Intelligence Measure | Components FE | Instruments | |
|---|---|---|---|---|---|---|---|---|
| HIA | Average | |||||||
| Alloway & Elsworth, 2012 [36] | 44 | 38 | 9–11 | NAGC WISC | M = 36.7 SD = 7.58 | M = 99.79 SD = 7.04 | WM verbal WM visual-spatial | Listening Recall Task Spatial Recall Task |
| Berg & McDonald, 2018 [37] | 23 | 28 | 5–8 | WIAT-II Raven | M = 121.74 SD = 10.11 | M = 107.64 SD = 7.62 | Inhibition WM visual-spatial WM verbal Flexibility | Colour Word Inhibition Quantity-digits Inhibition Mapping and Directions Task Visual Matrix Task Auditory Digits Sequence Task Semantic Categorisation Task Making Trail Task |
| Calero et al., 2007 [38] | 24 | 23 | 6–11 | Kaufman Brief Intelligence Test (K-BIT) | Range IQ 136–160 | Range IQ 95–115 | WM verbal | Yuil et al. Task |
| Duan et al., 2009 [39] | 15 | 15 | 11–13 | Raven | M = 54.60 SD = 2.29 | M = 43.20 SD = 3.97 | Inhibition | Go/No-go Task |
| Haring, 2016 [40] | 27 | 41 | 10 | NIO | Range NIO 42–54 | Range NIO 31–38 | WM visual-spatial | Lion Game |
| Hoard et al., 2008 [41] | 46 | 250 | 5–7 | Raven | M = 126 SD = 5 | M = 107 SD = 8 | WM verbal WM visual-spatial | Working Memory Test Battery for Children |
| Jhonson et al., 2003 (older) [42] | 40 | 57 | 8.67–11.92 | WISC-III CCAT | Percentile 97 | ----- | Inhibition | Stroop Trail making Spatial location |
| Jhonson et al., 2003 (younger) [42] | 17 | 35 | 6.75–9.25 | WISC-III CCAT | Percentile 99 | ------ | Inhibition | Stroop Trail making Spatial location |
| Khosravi et al., 2016 [43] | 24 | 24 | 12 | WISC | Range IQ 110–130 | Range IQ 90–110 | WM verbal | Digits (WISC) |
| Kornmann et al., 2015 [44] | 42 | 39 | 8–12 | Teachers’ Giftedness nominations | M = 112.26 SD = 11.68 | M = 11.95 SD = 14.85 | WM verbal WM visual-spatial | Listening Span Task N back task Spatial span |
| Li et al., 2017 [45] | 98 | 125 | 7–12 | Cattell´s Culture Fair Intelligence Test | M = 38.43 SD = 3.26 | M = 27.99 SD = 6.76 | Decision making | IOWA Gambling Task |
| Liu et al., 2011,a [46] | 20 | 21 | 12.6–13.4 | WISC Creativity Observation Cattell´s Culture Fair Intelligence Test | M = 43.2 SD = 1.7 | M = 34.5 SD = 1.9 | Inhibition | Go-no go |
| Liu et al., 2011,b [47] | 15 | 13 | 8.6–10.5 | Standford–Binet Intelligence test Creativity Observation Cattell´s Culture Fair Intelligence Test | M = 47.6 SD = 5.2 | M = 39.8 SD = 1.3 | Inhibition | Go-no go |
| Montoya-Arenas et al., 2010 [48] | 32 | 30 | 7–11 | WISC-III | M = 138.6 SD = 1.3 | M = 101.8 SD = 5.7 | Flexibility Inhibition WM verbal WM visual-spatial Planning | WCST Stroop Oral Word Fluency Semantic/Phonological Desing Fluency Test Tower of Hanoi |
| Montoya-Arenas et al., 2018 [49] | 32 | 43 | 7–11 | WISC-III | M = 138.6 SD = 1.3 | M = 104.5 SD = 6.7 | Flexibility Inhibition WM verbal WM visual-spatial Planning | WCST Stroop Oral Word Fluency Semantic/Phonological Desing Fluency Test Tower of Hanoi |
| Swanson, 2006 [50] | 50 | 77 | 6–9 | WIAT WRAT-III | M = 126.78 SD = 5.25 | M = 99.21 SD = 8.22 | WM verbal WM visual-spatial Inhibition | Backward Digit span (WSIC) Listening/Sentence span Digit/Sentence span Updating Visual Matrix Mapping Randon Letter Generation Randon Number Generation Catagorical Fluency Letter Fluency |
| Urben et al., 2018 [51] | 18 | 20 | 12 | WISC | IQ > 125 | IQ < 95 | Inhibition | Stop-Signal Task |
| Vogelaar et al., 2019 [52] | 24 | 48 | 9–11 | Teachers and parents´ Gifted Nominations Raven | M = 47.58 SD = 5.04 | M = 39.63 SD = 6.59 | Planning | Tower of London |
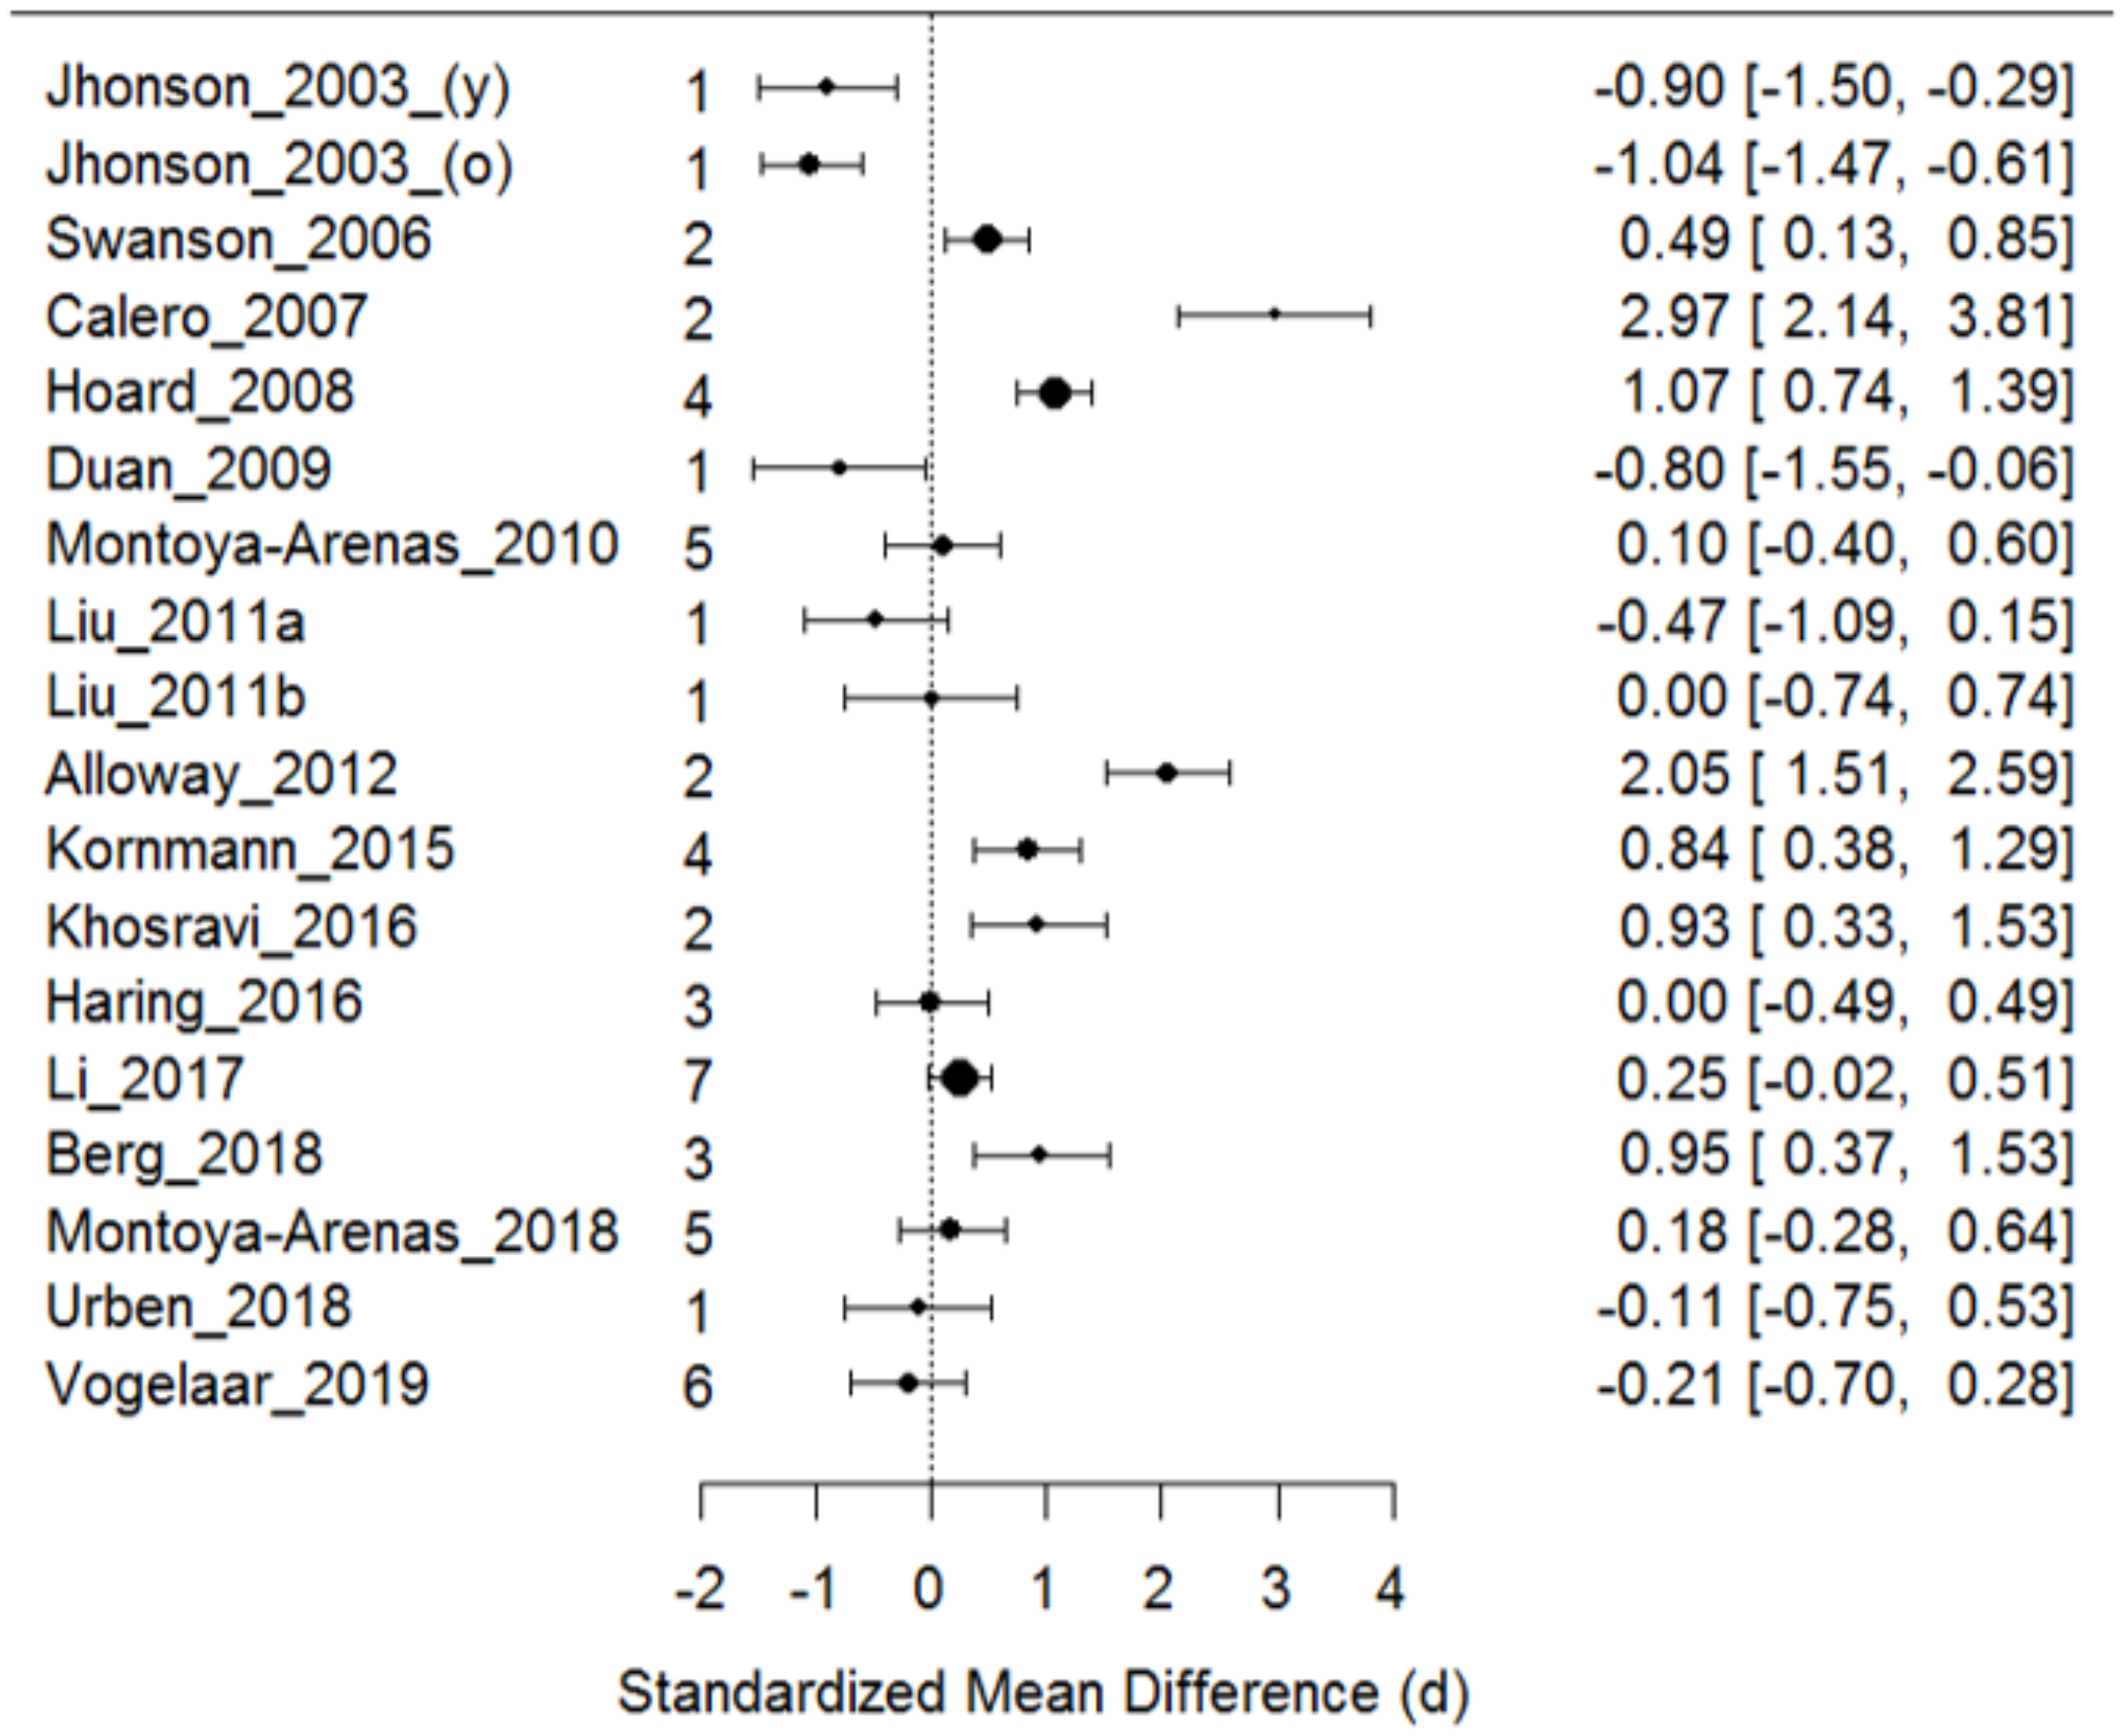
| Component | k | d | CI 95% | Q (p) | τ2 | |
|---|---|---|---|---|---|---|
| UL | LL | |||||
| Inhibition | 10 | −0.014 | −0.342 | 0.314 | 33.609 (0.0001) | 0.1984 |
| WM verbal | 9 | 1.015 | 0.602 | 1.428 | 53.153 (0.000) | 0.3294 |
| WM visual-spatial | 8 | 0.709 | 0.270 | 1.147 | 53.535 (0.0000) | 0.3427 |
| Flexibility | 3 | 0.068 | −0.220 | 0.356 | 0.777 (0.6781) | 0.0000 |
| Planification | 3 | −0.038 | −0.310 | 0.242 | 0.685 (0.7100) | 0.0000 |
© 2020 by the authors. Licensee MDPI, Basel, Switzerland. This article is an open access article distributed under the terms and conditions of the Creative Commons Attribution (CC BY) license (http://creativecommons.org/licenses/by/4.0/).
Share and Cite
Viana-Sáenz, L.; Sastre-Riba, S.; Urraca-Martínez, M.L.; Botella, J. Measurement of Executive Functioning and High Intellectual Ability in Childhood: A Comparative Meta-Analysis. Sustainability 2020, 12, 4796. https://0-doi-org.brum.beds.ac.uk/10.3390/su12114796
Viana-Sáenz L, Sastre-Riba S, Urraca-Martínez ML, Botella J. Measurement of Executive Functioning and High Intellectual Ability in Childhood: A Comparative Meta-Analysis. Sustainability. 2020; 12(11):4796. https://0-doi-org.brum.beds.ac.uk/10.3390/su12114796
Chicago/Turabian StyleViana-Sáenz, Lourdes, Sylvia Sastre-Riba, Maria Luz Urraca-Martínez, and Juan Botella. 2020. "Measurement of Executive Functioning and High Intellectual Ability in Childhood: A Comparative Meta-Analysis" Sustainability 12, no. 11: 4796. https://0-doi-org.brum.beds.ac.uk/10.3390/su12114796