Income or Assets—What Determines the Approach to the Environment among Farmers in A Region in Poland?


Department of Macroeconomics and Agricultural Economics, Institute of Economics, Poznań University of Economics and Business, 61-875 Poznań, Poland
*
Author to whom correspondence should be addressed.
Sustainability 2020, 12(12), 4917; https://0-doi-org.brum.beds.ac.uk/10.3390/su12124917
Submission received: 18 May 2020
/
Revised: 9 June 2020
/
Accepted: 11 June 2020
/
Published: 16 June 2020
(This article belongs to the Collection Sustainable Development of Rural Areas and Agriculture)
Abstract
:The theory about the impact of farm size, income and assets on the environmental approach of farmers is ambiguous. We contribute to the existing discussion in two ways. Firstly, we look for the determinants of the environmental approach. Secondly, we treat farm size as a heterogeneous factor, affected not only by the value of assets but also flows of incomes. The main objective of the article is, therefore, to recognize the impact of assets and income on the environmental approach of agricultural producers. We analyze the results of surveys carried out in 2020 on a group of 120 farms from the Wielkopolska region (Poland), using structural equation modelling (generalized structural equation modelling (GSEM)-multiple indicators and multiple causes (MIMIC) model). Our results indicate that both the income and assets of the agricultural producers have a positive impact on their approach to the environment. However, to a greater extent, the farmer’s approach to the environment is influenced more by income than by assets. This may be influenced by the capitalization of subsidies in the price of agricultural land, which makes this element of farm assets detached from real processes. It is easier for farms with a higher income and assets to realize the orientation towards sustainability.
1. Introduction
The assets of farms as a productive resource determine the possibilities of creating agricultural income. These, in turn, through investments and the accumulation of assets, have an impact on further farm development [1]. This perspective is in line with the classical approach, in which the importance of production factors (in the case of our article, it is the assets) for the functioning of business entities is exposed. In the study, we have extended this approach to the element of the behavioral factor. It is about the approach to the environment among farmers. In this way, the discussed dependencies have a broader research perspective, which is consistent with the current trend of research within complexity economics [2] or sustainable development.
The environmental context of these processes is gaining now in importance in the European Union (EU). This is due to social expectations, changes in the instruments of the EU common agricultural policy (CAP), the increased value of the non-productive functions of agriculture [3,4], as well as the growing interest in sustainable development. The latter has been the main driver for the operation of programs under various EU funds for over two decades. Therefore, the regulations at both the European and the national level are adjusted to this effect in terms of support, but also penalize entities if certain environmental standards are not fulfilled. At this point, it is worth emphasizing that the international situation as regards the relations between the economic and the environmental dimension of the functioning of agricultural holdings is particularly diverse between the EU countries and non-EU countries, as well as with countries with a low level of economic development. This results from the relatively high environmental standards applicable in the EU countries. In the article, we also refer to examples from the results of studies from various other parts of the world. Therefore, a question arises as to the relation of the economic situation (by prism assets, income) and the environmental context of the functioning of agricultural holdings. Due to the fact that the entity acting in the economic and environmental area is an agricultural producer (farm holder), the article refers to his/her environmental approach, which allows to take into account also non-economic contexts (knowledge, environmental awareness, plans). Therefore, the main objective of the article is to recognize the impact of assets and income on the environmental approach of agricultural producers through the example of the Wielkopolska region in Poland (Wielkopolska is one of sixteen voivodeships (regions) in Poland. It is located in the western part of Poland. The region is relatively economically well-developed by Polish standards, especially in terms of agriculture and the agri-food industry. The utilized agricultural area is 11.3% of all Poland, which gives it second place of all regions in Poland in this respect). In this way, the orientation of a given farm for the future in the environmental field will also be approximated. It will allow us to formulate initial assessments of the impact of assets and income on sustainable development.
This problem is important from both a theoretical and an applied perspective. In the first case, it is about examining the impact of income and assets on the environmental approach of the farmers. There are ambiguous opinions in the literature on this matter. On the one hand, it is indicated that small farms, i.e., those with low income and assets, are more environmentally friendly due to, for example, lower environmental pressure [5]. On the other hand, different studies stress that larger units have a better chance for sustainable development and thus there is a positive relationship between the economic and environmental dimensions [6,7,8,9]. In this latter case, the wider financial possibilities that enable the implementation of pro-environmental investments, as well as more efficient use of environmental investments, are emphasized.
The applied dimension of our research concentrates on indicating postulates for the EU CAP regarding the indirect support of sustainable growth of agriculture, through properly directed general programs of support. Should we support economically stronger farms, often with capital-intensive development directions, or rather help smaller units? This issue gains in importance taking into account that smaller farms dominate in Europe and they constitute an important structural element of rural areas. Moreover, the question arises, is there a conflict between the economic (high income, larger assets) and the environmental objectives in agricultural holdings [10]?
We contribute to the existing discussion about the impact of size on farms’ sustainability in two ways. Firstly, we look for the determinants of the environmental approach. This strategy is different from the typical one, where a synthetic measure of the environmental pressure is constructed and regressed. Secondly, we treat farm size as a heterogeneous factor, affected not only by the value of assets but also flows of incomes. Furthermore, we check for the relative importance of these measures. We employ the results of surveys carried out in 2020 on a group of 120 farms from the Wielkopolska region (Poland). Structural equation modelling (with its different types of models) was used in the research on issues on agricultural economics. The article consists of six parts: Introduction, Literature Review, then Materials and Methods, Results, Discussion and Conclusions. In the Introduction, we present the motivation to conduct the research, and hypotheses; in the Literature Review, the current state-of-the-art on the raised issues; then, we explain the methodology used. Afterwards, we analyze the obtained research results, which we compare with other outcomes, and at the end of the article, we present our conclusions, reflections and the implications for policy adjustments.
2. Literature Review
Two main theoretical issues need to be addressed at the very beginning of this study. First are the metrics of farms’ environmental impact, and second are the potential relationships between this impact and the farm’s assets and incomes. Beginning with the problem of the metrics, in the previous studies, a number of indicators were used to investigate the environmental sustainability of agriculture [6,7,11,12]. Moreover, a broader review of environmental indicators (as well economic, social and institutional indicators) was presented by Mukherjee et al. (2016) [13].
There is no simple relation between a farm’s size and its influence on the environment. On the one hand, D’Souza and Ikerd [14] suggested that large (industrial) farms due to their size, mechanization and specialization (and other reasons) tend to decline the sustainability of agriculture, and in this way an environmental approach, while small farms due to the lower intensity of land use and providing of public goods contribute (to a larger extent) to environmental sustainability. Similar conclusions are provided by Kirner and Bartel-Kratochvil [15]. According to their research, small farms, mountain farms and organic farms tend to provide greater environmental services per unit of agricultural land. However, larger farms, non-mountain farms and conventional farms achieve better values for some environmental indicators when these are related to the produced output. On the other hand, [12] stressed the significant effect of the farm size (which is related to income and asset value) on the environmental performance of lowland livestock farms—according to them, the bigger the holding, the better the environmental performance (measured by the Agri-Environmental Footprint Index). They point out that large farms use land less intensively, and provide greater proportions of low-input habitats, increasing the values of land use diversity. In contrast, small livestock farms use more energy and water per ha of utilizable agricultural area (compared with the large farms).
Based on a survey among farmers in the North Central region of the USA, Den Biggelaar and Suvedi [16] distinguished three groups of farmers: conventional, transitional and sustainable farmers. All of them aim to obtain a good quality of life but are using different ways to achieve it. Sustainable agriculture technologies and practices may be profitable alternatives to conventional ways of farming while simultaneously being less environmentally damaging. In Belgium, fruit growers using different farming systems (traditional versus integrated fruit production (IFP)) achieve similar incomes; however, IFP is more environmentally friendly (due to reduced pesticides use). From this point of view, farmers can be profitable with a lower environmental pressure [17]. Ryan et al. [18] proved that the top-performing dairy farms (in economic terms measured using the productivity of labour, land, profitability, market orientation and farm viability) tended to be the best-performing farms from an environmental sustainability perspective (in this particular case: the lowest greenhouse gas emissions per unit of product). In such a situation, growing efficiency and productivity generate increased profits, without growing negative environmental effects. Dolman, Vrolijk and de Boer [19], investigating economic, environmental and societal performance among Dutch fattening pig farms, pointed out that there are agricultural entities which outperform simultaneously in the economic, environmental and societal fields. Similar findings can be found in the article by De Koeijer et al. [10]. According to their research, Dutch sugar beet growers achieve economic and environmental efficiency at the same time, and there is a potential to improve the results without conflicts between economic and environmental goals. Farmers that concentrate on maximizing output given certain inputs may follow the best strategy to combine achieving economic profits and environmental effects. Based on research on fruit farms (apple-growing) in Switzerland, Mouron et al. [20] proved that there is no relation between increasing farm incomes and growing environmental pressure expressed by ecotoxicity, eutrophication and non-renewable energy use. Haileslassie et al. [6], investigating divergent farms in the dryland farming systems in India, pointed out the need to improve the economic performance of farms in order to increase investments in the environment. They found a positive relation between economic and environmental effects in general, but there were differences when taking into account different typologies of farms. The positive relations concerned the following: (1) small and extensive farms; (2) irrigation-based and intensive farms; and (3) small and medium and off-farm-based farms, but there was a trade-off between the mentioned fields of sustainability observed for the following: (1) marginal and off-farm-based farms; and (2) irrigation-based semi-intensive farms.
Higher sustainability of agricultural holdings results from these farms receiving agro-environmental payments, which increases farm income. These payments directly improve the economic and social sustainability as well as environmental sustainability, as these payments are due for the delivery of public goods [7]. According to Tang et al. [21], due to the higher profitability and subsidies under the “Grain for Green” project in China, farm incomes increased significantly. In turn, it resulted in the conversion of almost all sloped farmland into terraces, forest and grassland, which contributed positively to the improvement of the natural environment in the involved regions. Coffee smallholders are applying agro-ecological or agro-forestry practices which among others decrease dependence on agro-chemical inputs (benefit for the environment) and help them to diversify incomes, which is positive in economic terms [22]. The higher the farm’s income from selling agricultural products, the higher the sustainability (overall). Particular impact can be indicated in the socio-economic area [7].
Gomez-Limon and Sanchez-Fernandez [7] indicated that greater sustainability (overall) is characteristic for large farms (with the large agricultural area), because: (a) they achieve economies of scale in their agricultural production, which leads to higher (economic/technical) production efficiency; (b) they generate sufficient income to sustain agricultural activity among farm owners; and (c) they provide more positive environmental externalities (public goods). The advantages of the largest farms (which have bigger assets due to the value of the possessed agricultural land and higher incomes) in the environmental field result from several factors:
- They can better implement techniques which are effective in economic terms and ecologically compatible (minimizing soil cultivation and direct sowing);
- They have a more diversified and extensive range of agricultural products (greater possibilities to spread the work-load over the year);
- They have greater opportunities to participate in agro-environmental programs (because of lower transaction costs, and better adjustment to the requirements of programs).
Similar conclusions can be found in the paper of [23], namely, larger farms are better at implementing environmentally friendly practices (crop rotations, crop diversification, agro-forestry), which involves a more environmentally friendly approach by the farmers. Studies on farming systems on the Chinese Loess Plateau have proven that limited access to capital and lack of technical agronomic support were serious obstacles to the restoration of the environment and in the broader sense, the development of agriculture [21]. Further, Clement et al. [24] noted that not enough capital resources (i.e., potentially lower sustainability in economic terms) limit the potential and interest of a farm to implement eco-friendly agricultural practices.
In practice, it may happen that the objectives of individual cases linked with economic, environmental or social dimensions are contradictory. It can lead to situations in which growing farm income is accompanied by greater pressure on the environment or increasing stratification of incomes and assets among farmers. Current crops could be more beneficial in economic terms (incomes) but not desirable in environmental ones. In this particular case, higher incomes could be achieved while neglecting the environment [25]. Ripoll-Bosch et al. [5], investigating sheep farms (in different farming systems) in north eastern Spain, emphasized a clear trade-off between the economic and environmental goals, which is the higher the economic sustainability, the lower the environmental sustainability.
Bou Dib et al. [26] pointed out that striving for higher incomes in the poor part of Indonesia’s population leads to an increase in the area of oil palm cultivation, which, however, is at the expense of the natural environment and society. The fast expansion of palm oil in Southeast Asia (including Indonesia, Malaysia) may be conducive to negative externalities, especially in the environmental field (tropical deforestation, loss of biodiversity, increasing greenhouse gas emissions) and the social one (land property conflicts, social inequality). Switching from rubber to palm oil may reduce the environmental quality due to usually higher input intensities by the cultivating of the latter product. Similarly, Jezeer et al. [22] indicated that crops like cocoa and coffee (besides palm oil and rubber) improve the economic performance and increase short-term income. In the long-term, however, it is at the expense of the environment. Fernandes and Woodhouse [27] prove that, in the context of the three dimensions of sustainable development, ecological family farms in southern Brazil achieve better environmental and social effects, but worse economic results, resulting from the costs of the marketing of agro-ecological products. This confirms the existence of the trade-off between economic and environmental goals. Increasing the production scale (above a certain level) and farms’ efficiency causes negative effects on the environment, i.e., the risk of land degradation, reduction in biodiversity and pollution of groundwater and air. The risk of the negative impact increases with the growing accumulation and intensification of production [28]. Thus, in the light of the studies referred to, the relationship between the economic dimension connected with income, the value of assets, the productivity of farm operations and the environmental context is complex and ambiguous.
As aforementioned, the goals in the three pillars of the concept of sustainable development can potentially be divergent. The growing and competing claims on biological resources may cause adverse environmental and social effects [29]. Sometimes ecological sustainability is overlooked in official strategies. Bennich et al. [29] suggested that in practice, there is no equality between all three fields in the concept of sustainable development (economic, social and environmental purposes). The other issue is achieving the purposes in these three dimensions in the short- and long-term. Falcone et al. [30] suggested the existence of tensions between these two perspectives, which should be considered both on the level of the whole economy and agriculture (i.e., more profitable monoculture crops in the short-run versus lower income because of a higher diversity of crops but maintaining the viability of land in the long-term).
The environmental approach among farmers in Wielkopolska which we are investigating is strictly connected with the bio-based economy concept, as the core of this idea is to achieve parallel economic and environmental goals. Bennich et al. [29] described a bio-based economy as an opportunity to achieve climate change mitigation, a competitive advantage linked to knowledge generation, novel biomass applications and better and more effective management of resources, especially fossil-based ones. A bio-based economy can support to a greater extent (than other economic systems) the transition towards sustainability [30]. It suggests that the bio-based economy might be a tool to achieve sustainability in the long-term. Sarkar et al. [31] indicated the advantages of a sustainable bioeconomy, which allows for achieving environmental and economic goals at the same time, i.e., to reduce greenhouse gas emissions and to decrease the dependency on non-renewable resources.
3. Materials and Methods
To achieve the goals stated for this research, we decided to follow the procedures of structural equation modelling (SEM). This method has already been used in research on issues of agricultural economics. Among others, we can find SEM applied in the following works: Hadrich and Olson [32] (farm size and farm performance); Jürkenbeck, Heumann and Spiller [33] (consumer acceptance of different vertical farming systems); Li, Mi and Zhang [34] (farmers participation in rural tourism); Mariyono [35] (welfare of farmers’ households in Indonesia); Mariyono [36] (improvement of rural livelihoods through the agribusiness sector in Indonesia); Rezaei, Seidi and Karbasioun [37] (pesticide exposure reduction); Luu et al. [38] (farmers’ intentions for climate change adaptation in agriculture); and Xu and Sun [39] (relative deprivation in the sustainable development of rural tourism).
According to Klein [40], the SEM method can also be described as a covariance structure analysis. The particular feature of this method that has determined its use in this study is the possibility of analyzing the latent variables, which reflect hypothetical constructs or factors, which are explanatory variables presumed to reflect a continuum that is not directly observable. In this research, we try to explain differences in the approach to the environment (env_approach) among farmers, which is this kind of hypothetical construct. In the classical approach to SEM, only continuous variables can be used as the indicators of the latent construct. However, the variables used in this research are also on the binary and ordinal scale. This is why we decided to use the generalized structural equation modelling (GSEM) approach in the configuration proposed by Rabe-Hesketh et al. [41], but without a multilevel component. The main advantage of GSEM over SEM is that it drops the observed variables and latent variables from the joint normality assumption, which is obviously violated in the case of non-continuous variables. However, many of the structural equation modelling statistics are dependent on this assumption, including goodness-of-fit tests [42]. Due to this, they are not applicable in the case of GSEM, which is the main disadvantage of this method. Due to lacks in this aspect, more attention has to be given to the statistics describing single variable significance, such as standard errors. The quality of this parameter depends on the distribution assumption of the errors. To prevent misspecification in this aspect, we assumed that errors, not normality and heteroscedasticity, may be an issue in the case of this study and we used the quasimaximum likelihood (QML) method, where standard errors are adjusted with the Huber/White/sandwich technique. Especially, heteroscedasticity is probable as long as we deal a lot with data concerning incomes, where it is normal for a variance to be higher among the groups of higher incomes.
All of the estimation has been done using the STATA 15 software. In the formal description of the procedures, we base our data on the information provided in the STATA manual [42]. In general, three families of variables have been included in the model. The Bernoulli family refers to binary variables, for which the log pf conditional probability mass function is
where μ is also known as the probability of a success. An example of such a variable is plans, where farmers declare whether or not they plan to invest in renewable energy sources.
log f (y|μ) = y log μ + (1 − y) log(1 − μ),
The ordinal family refers to a variable, where the response Y is assumed to take on one of the k unique values. The actual values are irrelevant except that higher values are assumed to correspond to “higher” outcomes. Assuming that Y takes on the values 1,…,k, the ordinal family with k outcomes has cutpoints κ0, κ1, …, κk, where κ0 = −∞, κy < κy+1, and κk = +∞. Given a linear prediction z, the probability that a random response Y takes the value y is
where Y* is the underlying stochastic component for Y. The distribution for Y* is determined by the link function, which we assumed to be logit. It assigns Y* the extreme value distribution. An example of such a variable is self_assess where farmers evaluate their approach to the environment on a 1–5 Likert-type scale.
Pr(Y = y|z) = Pr(Y* < κy − z) − Pr(Y* < κy−1 − z),
The link function defines the transformation between the mean and the linear prediction for a given response. If Y is the random variable corresponding to an observed response variable y, then the link function performs the transformation
where μ = E(Y) and z is the linear prediction. In practice, the likelihood evaluator function uses the inverse of the link function to map the linear prediction to the mean. The most common logit link function has been assumed for ordinal and Bernoulli family variables and it is
and its inverse is
g(μ) = z,
g(μ) = log μ − log(1 − μ),
μ = g−1(z) = 1/(1 + ez),
The Gaussian family refers to all the continuous variables and is synonymous with the normal distribution. The log of the conditional probability density function is
where d is the dimension of the observed response vector y, μ is the mean of the responses and Σ is the variance matrix of their unexplained errors. An example of such a variable is assets, which represents a logarithm of the value of the farm’s assets.
log f (y|μ, Σ) = −½ {d log2π + log|Σ| + (y − μ)′ Σ−1(y − μ)},
The model is fitted via the maximum likelihood. The likelihood is computed by integrating out the latent variables. Let θ be the vector of the model parameters, y be the vector of the observed response variables, x be the vector of the observed exogenous variables and u be the r × 1 vector of the latent variables. Then, the marginal likelihood looks something like
where R denotes the set of values on the real line in the r-dimensional space, θ is a vector of the unique model parameters, f(∙) is the conditional probability density function for the observed response variables, φ (∙) is the multivariate normal density for u, μu is the expected value of u and Σu is the covariance matrix for u. All auxiliary parameters are fitted directly without any further parameterization, so we simply acknowledge that the auxiliary parameters are among the elements of θ. For a single-level model with n response variables, the conditional joint density function for a given observation is
L(θ) = ∫Rf(y|x, u, θ) φ (u|μu, Σu)∂u
f(y|x, u, θ) = n∏i=1fi(yi|x, u, θ)
Except for the ordinal family, we use the link function to map the conditional mean
to the linear prediction
where βi is the vector of the coefficients and Λi is the matrix of the latent loadings for yi. For notational convenience, we will overload the definitions of f(∙) and fi(∙) so that they are functions of the responses and model parameters through the linear predictions z′ = (z1, …, zn). Thus, f(y|x,u,θ) is equivalently specified as f(y,z,θ), and fi(yi|x,u,θ) is equivalently specified as f(yi,zi,θ). In this new notation, the likelihood is
μi = E(yi|x, u)
zi = x′βi + x′Λiu
L(θ) = ∫Rf(y,z,θ) φ (u|μu, Σu)∂u =
={(2π)r/2(|Σu|)½}−1 ∫R exp{log f(y,z,θ) − ½(u − μu)′ Σu−1(u − μi)}∂u
={(2π)r/2(|Σu|)½}−1 ∫R exp{log f(y,z,θ) − ½(u − μu)′ Σu−1(u − μi)}∂u
Due to the fact that the integral in Equation (11) is generally not tractable, a numerical method for its estimation must be used. We followed here the most common procedure of the Gauss–Hermite quadrature. Its detailed description can be found in [42].
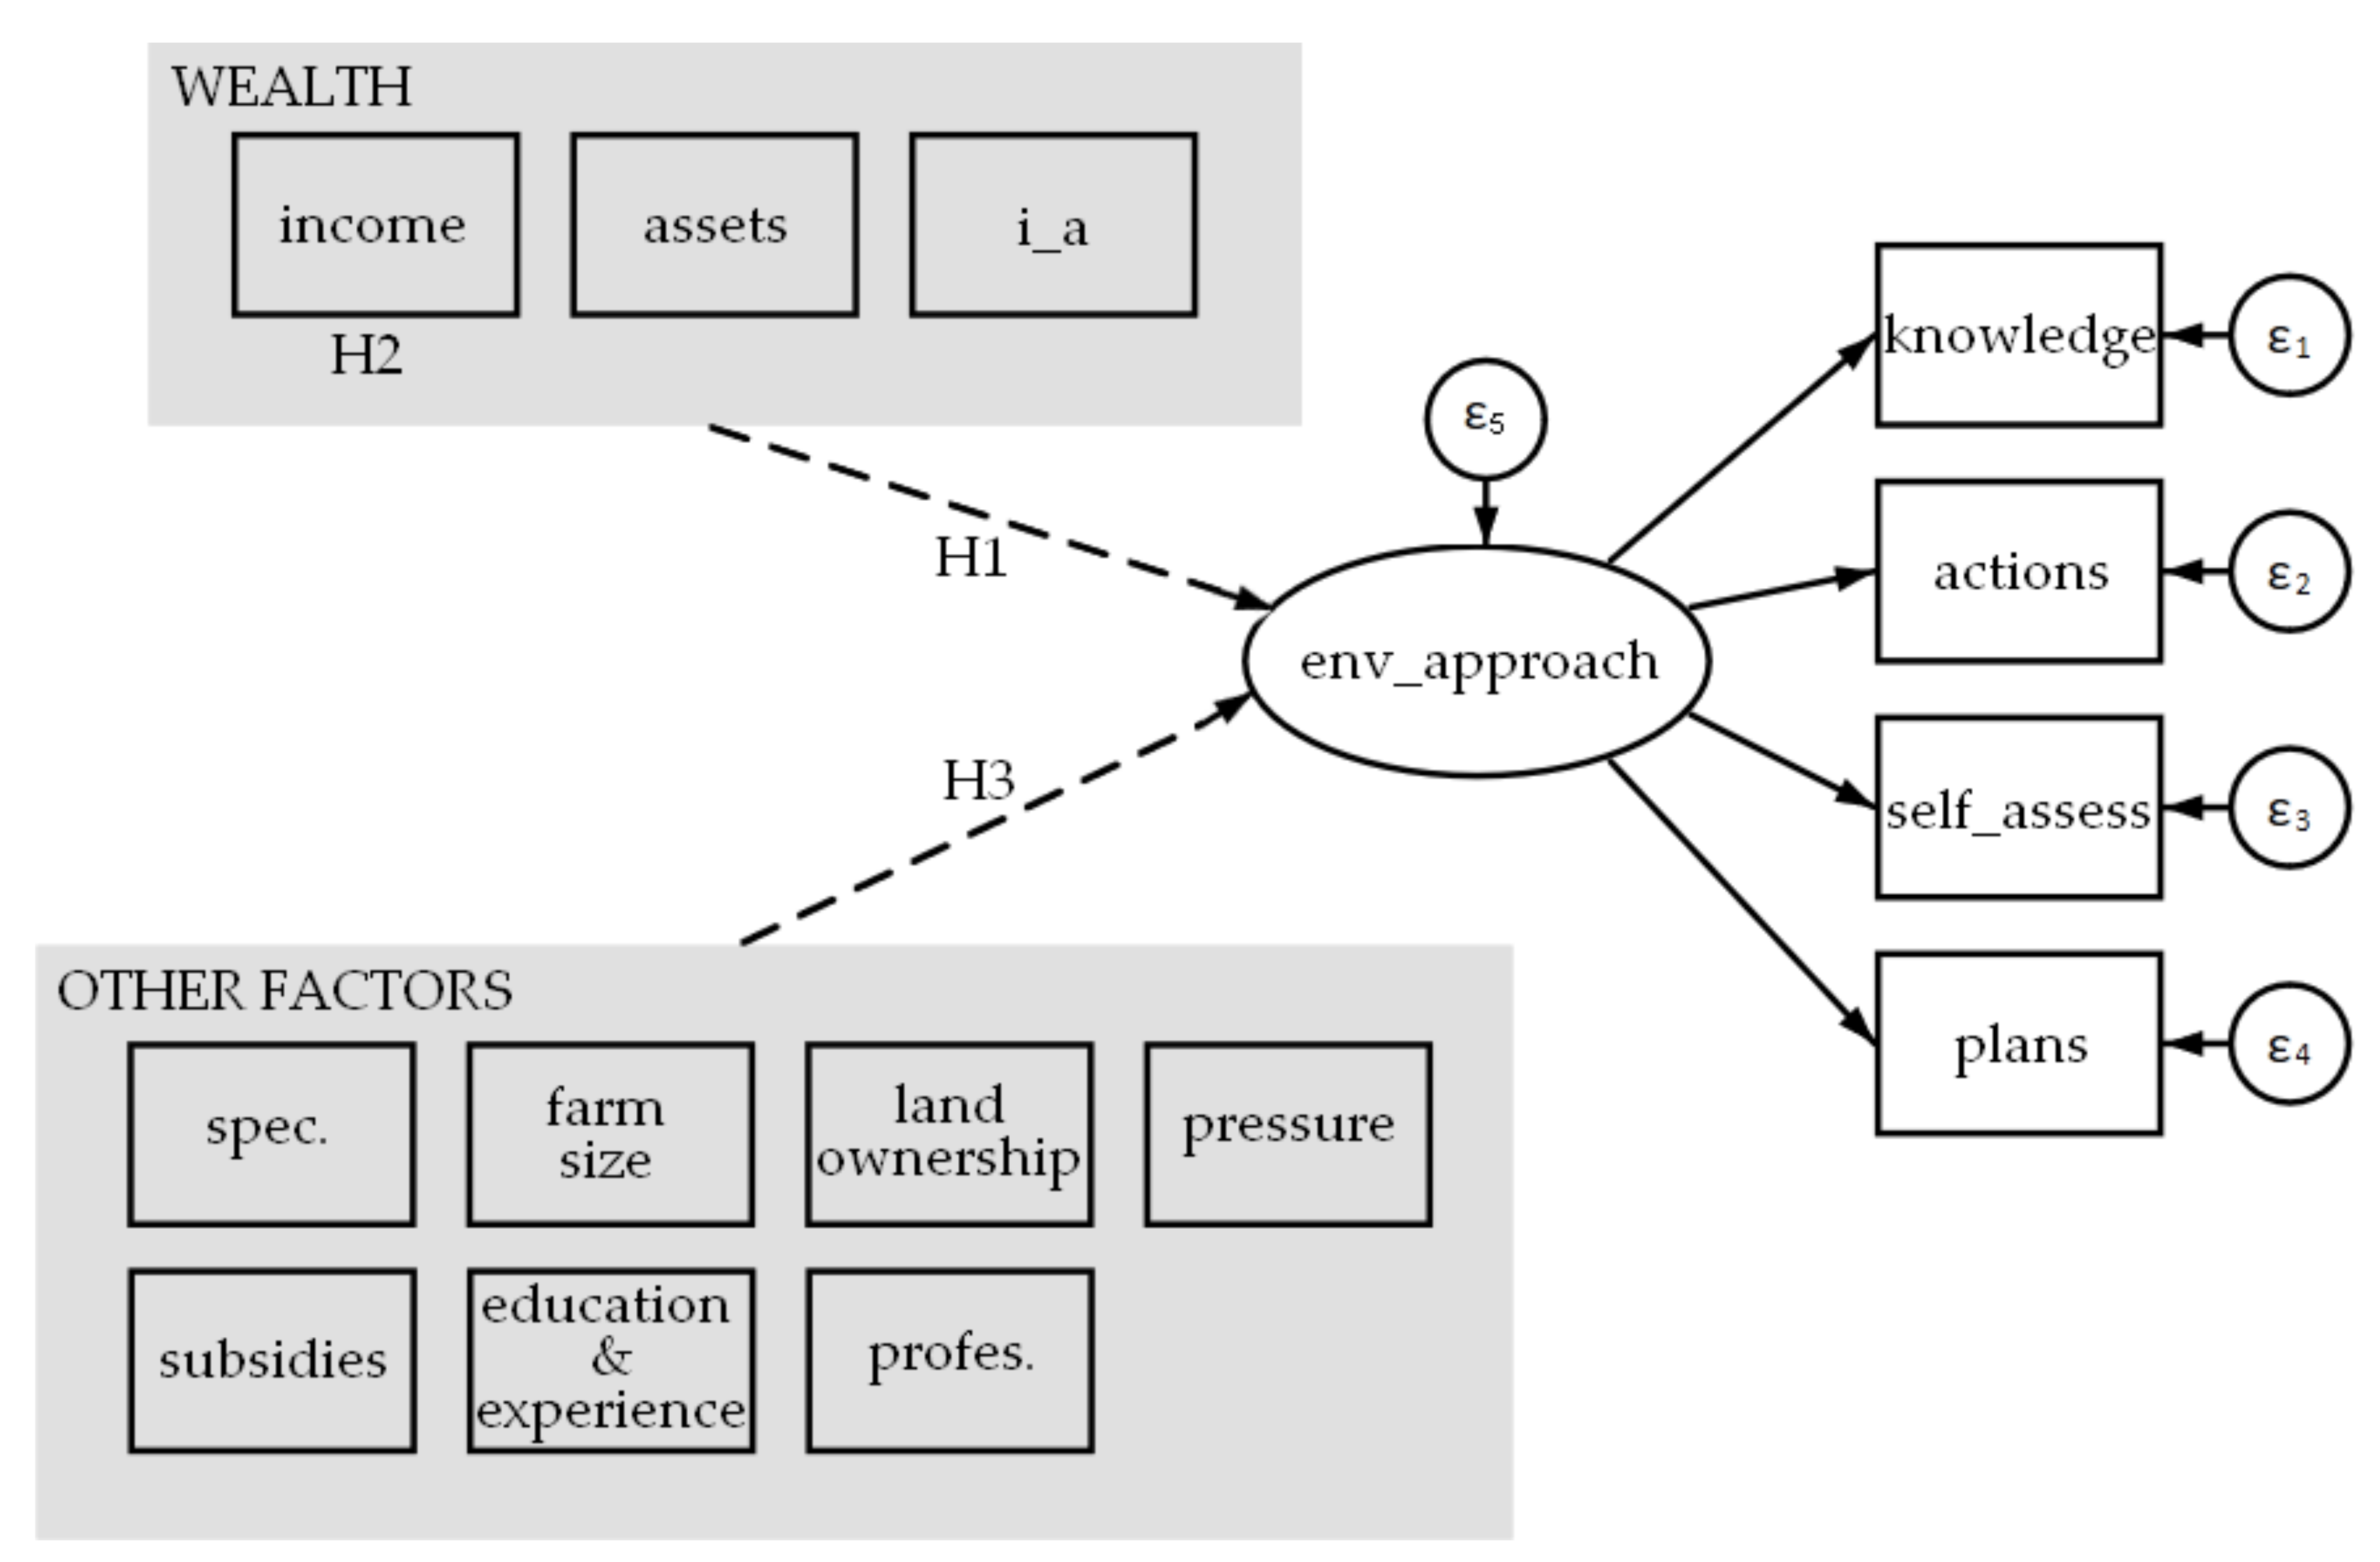
An important advantage of the use of the SEM and GSEM methods is the possibility to present the model in graphical notation, as a path diagram. The diagram of our model is presented in Figure 1. It is of the multiple indicators and multiple causes (MIMIC) type, which means that the observed causes determine a latent variable, which in turn determines multiple indicators. This type of model has two components—a measurement and a structural one. In the measurement component, we distinguish 4 indicators of the environmental approach (env_approach). In the structural part, we analyze the impact of two sets of variables on the farmers’ environmental approach. The first set consists of three variables describing the wealth of the farmer. The second set consists of 23 variables grouped in seven areas which may have an impact on the farmer’s approach to environment specialization, farm size, land ownership, environmental pressure generated by the farm, subsidies, education and experience and professionalization. A detailed description of all variables and the way they were transformed is provided in Table S1 in the Supplementary Materials. Justification of the transformation was threefold. Firstly, in some variables, we identified obvious outliers (value higher or lower than the mean +/− three standard deviations). These observations have been excluded. Secondly, some variables were lacking from the univariate normality. In their case, we used the logarithm function. Thirdly, some variables caused problems with the model’s convergence due to their variance and covariance being relatively high or small (see [36]). They have been multiplied with a proper constant. Descriptive statistics of all the variables are available in Table S2 in the Supplementary Materials. Due to the fact that we analyze not only continuous but also discreet variables, we report not only the Pearson, but also the polychoric correlation. These values have been calculated using the method proposed by Kolenikov and Angels [43].
The context in which we use the SEM procedure is that of the model generation. In this approach, we seek the model configuration which “makes theoretical sense, is reasonably parsimonious and its correspondence to the data is acceptably close” [40]. Common for all our model settings is the measurement component, against which we test different combinations of potential determinants. As the main goal of the paper is to assess the impact of wealth, three variables describing this issue are the base for the three main settings of the model, to which we further added variables describing other factors, seeking the best combination. This procedure leads to the verification of three main hypotheses:
H1.
The wealth (income, the value of farms assets) of the farmer has a significant, positive impact on the farmer’s approach to the environment;
H2.
Income is more important than assets to explain the farmer’s approach to the environment;
H3.
Wealth is the most important factor of the farmer’s approach to the environment.
Due to the fact that for the GSEM models overall goodness-of-fit statistics are unavailable, in comparison, we based our data on the Akaike information criterion (AIC) and the Bayesian information criterion (BIC). In both cases, the lower the value is, the better the model. Another statistic important for the verification of the stated hypotheses would be the standard errors of the exogenous variables. This research strategy is not as straightforward as probably the most obvious approach, to use latent variables describing wealth and other factors instead of one indicator metric. However, taking into account the relatively small sample (N = 120) we analyzed, the reliability of a more complex model would be questionable.
The theoretical justification for the potential determinants of the approach to the environment is presented in Table 1. When it comes to the indicators of the environmental approach of the farmers, they describe four aspects:
- Knowledge—in which proxy is a declaration about being familiar with terms: sustainable agriculture, integrated agriculture, organic agriculture, Codex Alimentarius;
- Actions—in which proxy is a sum of the actions undertaken to improve the environment, such as the reduction in plant protection products, reduction in fertiliser consumption, reduction in stocking density, afforestation and set-aside, among others. The full list is available below, see Table S1;
- Self-assessment—in which proxy is the answer given in the Likert scale 1–5 to the question: “How do you assess your awareness of ecology and sustainable development?”;
- Plans—in which proxy is the answer to the question: “Whether you intend to install an alternative energy source?”.
This combination reflects the most important aspects of the approach to the environment—real and declarative knowledge about the impact of the farmer’s actions to the environment, as well as past and planned future actions to minimize this impact.
As the anchor (reference variable) for env_approach, the variable knowledge has been used, following the suggestion by Klein [40] to use the indicator with the most reliable score. Knowledge was selected as “the most representative”, which means the highest average correlation with other indicators. In this context, it is important to test for the overall score reliability. The most often assessed issue is the internal consistency reliability, which refers to the degree to which responses are consistent across the items within a measure. To measure this issue, the value of Cronbach’s alpha is reported. For the items included in env_approach, the latent variable is α = 0.602, which means that it exceeds the suggested threshold of 0.5 [40].
Due to the fact that each distinguished factor (comp. Figure 1, Table S1) is represented by more than one variable, some reduction was necessary. In Table S3 in the Supplementary Materials, we present the estimates of the models describing the variables and the best fitted control variables of the variables within the specified factors (comp. Figure 1, Table S1). The true number of the models estimated in this research is higher, but their fit was worse than the models presented in the earlier mentioned tables, so we decided not to report them. We will present only those models with control variables “representative” for each of the possible seven distinguished factors influencing the environmental approach of the farmers. The best model was selected, as we have mentioned before, based on the AIC and BIC criteria as well as taking into account the theoretical knowledge of the studied phenomena. A summary of our research strategy is presented in Table 2.
Summing up the proposed research strategy, it is important to underline that, to the best of our knowledge, GSEM is the only method allowing to model latent variables based on non-continuous, not-normally-distributed variables. However, the inclusion of binary and ordinal variables precludes the overall goodness-of-fit tests for the models, which base on the normal distribution assumption, which is one of the limitations of this research, though, basing on the earlier studies implementing this method [50,51], we backed our reasoning on the variables’ standard error statistics. Another limitation we faced in this research was the inability to include latent variables for the control factors (specialization, farm size, etc.) due to the limited sample size. However, we overcame this issue with a multiple step approach in which we identified the most representative variables for each feature (see Table S3). Finally, we faced a limitation common to all SEM, GSEM and non-experimental methods, regarding the possibility of identifying causal relationships [40]. On the other hand, the advantage of this research is the careful examination of alternative models which minimizes the confirmation bias risk, which is usually not well-covered in SEM studies [40].
As a data source, we use the results of surveys carried out in January and February 2020 on a group of 120 farms from the Wielkopolska region in Poland, which are a part of the farm accountancy data network (FADN). The research tool was an interview questionnaire entitled: “Assets and income in agricultural holdings in the paradigm of sustainable development”. The selection of holdings for the research sample was based on the economic size of the farms (ES6). Economic size class is defined as the sum of the standard value of agricultural output, the so-called standard output (SO—the average monetary value of the agricultural output at the farm gate price of each agricultural product crop or livestock in a given region), and is expressed in thousands of EUR. The analyses used the delimitation of six classes of economic sizes: very small farms ES1 (size EUR 2–8 thousand SO), small ES2 (EUR 8–25 thousand SO), medium ES3 (EUR 25–50 thousand SO) medium-large ES4 (EUR 50–100 thousand SO), large ES5 (EUR 100–500 thousand SO) and very large ES6 (over EUR 500 thousand SO), and production types (TF8) (the system for distinguishing eight types of production of agricultural holdings within the framework of the EU FADN agricultural accounting according to the predominant production direction). Due to the relatively low number of holdings from groups ES1 and ES6 which are conducting agricultural accounting in Wielkopolska (respectively 31 and 9), units from groups ES2–ES5 were selected for the research. In the case of the production types of the farms, farms specializing in field production (TF1), milk production (TF5), other grazing livestock (TF6), granivores (TF7) and mixed (TF8) were included. A quota selection of the number of farms for the survey was applied. For this purpose, the assumed number of the surveyed farms (120) was divided proportionally taking into account both the economic size (ES2–ES5) and production type of the farms (TF1, TF5–8), which occurs in the group of farms conducting agricultural accounting according to FADN in Wielkopolska. At the next stage of the study, specific numbers of farms were drawn for the study using the records of the Institute of Agricultural and Food Economics in Warsaw. Next, interviewers were assigned to the selected farms.
With reference to descriptive statistics of the surveyed group of farms (Table 3), it should be stressed that our sample is characterized by economic results better than the average farm in Poland, also than the average FADN farm. This concerns the size of production resources, production intensity, productivity, the value of agricultural production, income level and scale of investments. These characteristics relating to average sizes are comparable to farms from some countries of Southern Europe (Italy, Portugal), more favorable than in Greece and less favorable than in Spain. Of course, the structure of production is different in these countries, and the production of fruit and vegetables (especially grapevine cultivation) is important. In the case of the Wielkopolska region, the production of pigs dominates, the agri-food industry is well-developed (in comparison with Poland as a whole) and farms are strongly linked to the market in comparison with other regions in Poland. Not without significance is also the proximity of sales markets in Germany and the area’s convenient location in Poland. The average, relatively low age of a farm manager is also noteworthy. At the same time, as much as 32% of farm managers in the sample were under 40. In the case of the national sample, it was about 21%, while the average for EU countries is about 12%. This indicates a relatively young group of respondents.
4. Results
In this section, we present the most important results of our estimations. Some of the supplementary estimations have been moved to the Supplementary Materials. However, the numeration of the models is continuous including those in the Supplementary Materials. The first step of the research was to test the pure impact of wealth on the environmental approach. The models describing these issues are presented in Table 4. Four main remarks can be made based on these results. Firstly, both assets and income, included in models (2) and (3), were significant predictors for the env_approach and models with them had generally better (lower) AIC and BIC statistics than the basic model (1). Secondly, their impact is positive, which is in line with the theory. Thirdly, we see that the impact of incomes is more reliable, which is indicated by the lower p-value and seen even better in model (4), where both variables are included. In this setting, assets lost significance and the model became less adequate (in the light of BIC). Fourthly, the best fitted setting is (5)—the one with an interactional variable. Interestingly, the interaction variable has a negative sign. This can be interpreted as the situation in which the relationship between income and the env_approach changes direction under the different levels of assets. When the level of assets is high, higher income has a negative impact on the env_approach. This outcome is symmetrical and we can also say that the positive effect of assets on the env_approach turns to negative under higher levels of income.
On the other hand, for smaller and less profitable farms, an increase in both of these variables has a strictly positive effect on the env_approach. In the “mixed” situations, the total effect is unclear due to the unknown values of marginal effects under different levels of income and assets. Their estimation goes beyond the scope of this study, but is also an interesting area for further research. However, one must be aware that these effects will vary highly depending on the general economic and environmental situation in the analyzed region/country. Besides, it should be noted that the impact of this variable is relatively small compared with the importance of income and wealth and is therefore corrective. This is a premise for extending the spatial scope of our research. One may also argue that the situation of a low income and high value of assets is very unlikely. Higher income is usually a function of higher investments in assets and investments in assets are possible due to higher income. However, this is not so clear in the case of agriculture. In our sample, the correlation between assets and income was only 0.43. In general, farmers who invest a lot do not necessarily have a higher income, due to higher costs on the farms, where an assets-intensive model of production is used. Another reason for this might be the value of the land, which rises independently from the farmers’ actions. In addition to the abovementioned remarks, because assets and income are expressed as a logarithm of a true value, we can compare the impact of both on the environmental approach. From model (2), we can say that the env_approach increases from 0.0104 to a 1% increase in the value of assets. From (3), we know that a 1% increase in income can be associated with a 0.0093 change in the env_approach. In model (5), these figures are respectively 0.039 and 0.085. Knowing that the latent variable scales from −5 to 5 (scale of knowledge), we can assess this impact as not very strong.
The results presented in Table 4 can be a prerequisite to positively verify H1 about the significant, positive impact of wealth on the farmer’s approach to the environment and H2 about the greater significant impact of income than assets. However, to finally accept these hypotheses, we must check for the robustness of the presented model. For this, we use a set of variables describing other theoretically justified factors influencing the farmer’s approach to the environment. We present models explaining the env_approach which include the interaction of assets and income and control variables in Table 5 (and Table S3 in the Supplementary Materials). Basing on them, we can describe this dependence as stable. In Table 5, variables are presented in combinations representing a backward, stepwise regression based on the p-value criterion. The new model (12) contains one control variable which is statistically significant and has a positive impact on the env_approach, which is education (at least the secondary, agricultural education).
Basing on the presented results (Table 4 and Table 5), we can with much more confidence positively verify hypotheses 1–3. The variables referring to wealth (assets, income) definitely had the most stable, significant and robust impact on the environmental approach of farmers in the Wielkopolska region. Including into the model the interaction of assets and income shed new light on the direction of dependence, which generally is positive. During the robustness checks, we identified other potential factors of the environmental approach—the farm size, generated pressure and the fertilizers used per ha of UAA. However, the relation between these variables and the env_approach was not as stable and significant as in the case of wealth, which calls for an interpretation of these conclusions to be approached with due caution.
5. Discussion
The results of the research indicate an important role of both the income from agriculture and the value of farm assets in shaping the env_approach of the agricultural producers in the Wielkopolska region. Their increase, as previously highlighted, has a positive impact on the analyzed latent variable. This could mean that wealthier farmers have a more pro-environmental approach. At the same time, as it was mentioned earlier, if in a certain simplification we identify the env_approach variable with a sustainable orientation, especially in the environmental field, then we can notice that both income and assets are conducive to this orientation. The primary condition for undertaking pro-environmental actions, including environmental investments at the level of farms, is (usually) that of capital. Many times, smaller farms with limited income do not undertake investments related to environmental welfare in the broad sense. It is possible that only when the environmental Kuznets curve [52] is met, according to which it is only met when a certain level of economic development (agriculture) is exceeded, the environment can be valued higher.
The existing pro-environmental trend in the EU’s agricultural policy as well as the growing awareness of agricultural producers, and the growing social pressure associated with it, are also important here. This makes it necessary to take actions in the environmental area (meeting the cross-compliance conditions, or in terms of receiving payments for greening), and on the other hand, there is a growing awareness and knowledge of the social costs of environmental degradation, especially air pollution through low emissions (smog). Therefore, the awareness and knowledge itself would be insufficient without adequate economic incentives, although, according to research, knowledge plays a significant role in improving rural welfare [36]. It should also be stressed here that the higher level of the env_approach does not automatically mean a lower environmental pressure. Research in this area is not unequivocal. For example, Gomez-Limon et al. [53], and Picazo Tadeo et al. [8] pointed out that high levels of environmental pressure (e.g., soil erosion, pesticides risk, water use, fertilizer risk, CO2 emissions) generated at a farm level accompany high levels of farm income. Czyżewski et al. [47] in the study on EU farms at the regional level, indicated that, first, farms are willing to achieve a critical eco-efficiency (in terms of the production/environmental input ratio (mineral fertilizers use, plant protection products use, total use of energy, stock density, woodland area)) level, then, they become more eco-effective (this is the relationship between the value of production and the value of environmental inputs (mineral fertilizers use, plant protection products use, total use of energy, stock density, woodland area)) and, finally, they decrease the environmental pressure. In turn, Gadanakis et al. [48] noted that medium-sized farms are more eco-efficient than small ones. As a rule, farms with higher income and asset values are characterized by a higher production intensity, which leads to an increase in the negative environmental impact [54].
However, according to our research, the higher value of the env_approach variable was accompanied by higher income and assets. This could therefore be seen as a kind of compensation for the increased environmental pressure exerted by these individuals. The env_approach variable itself does not mean environmental pressure. From the perspective of the indicator of material environmental pressure (the indicator of material pressure on the environment enables a comparison of the environmental impact of agricultural holdings using different production means and technologies. In the article, it was determined as a sum of costs expressed in EUR related to the purchase of fertilizers, plant protection products, animal feed and energy per 1 ha of UAA [55]. Its higher values indicate higher environmental pressure from the perspective of material inputs) for the surveyed agricultural holdings, it results that larger units recorded a higher value of these units, while in the case of the surveyed farms with the economic size of EUR 8–25 thousand, the standard production value was 424, and for those with the size of EUR 25–50 thousand, it was 518, for the size of EUR 50–100 thousand, it was 776, while for the size of EUR 100–500 thousand, it was 1106. At the same time, the agricultural income for these groups was at the level respectively of 4.5 thousand, 12.3 thousand, 23.9 thousand and 44.1 thousand, while the value of total assets, respectively, was 143.5 thousand, 260.5 thousand, 389.4 thousand and 607.3 thousand. Put simply, agricultural producers, in parallel with realistically higher environmental input related to the purchase of fertilizers, plant protection products and total use of energy, took appropriate pro-environmental actions, also due to a higher level of ecological awareness. According to our research, the env_approach is significantly influenced by education, and more precisely agricultural education, at least at the secondary level. This is also confirmed by other research results [48,56]. The first of these highlighted that the quality of the education system must be improved if we are to increase the eco-efficiency of farms by supporting environmentally friendly investments.
The other important issue is also the adoption and promotion of best farming techniques, eco-innovation or services that require income, capital and are associated with environmental performance improvement [8,56,57]. As indicated [9], this could however be infeasible, especially on smaller farms with lower income due to higher costs and investments. Gomez-Limon and Sanchez-Fernandez [7] also took a similar view. They stressed that large farms achieve greater sustainability due to the economies of scale effects in agricultural production, higher production efficiency and income, due to higher costs and investments. In this way, farmers can implement eco-innovations or production techniques that are more environmentally friendly but which require capital expenditure [23]. At the same time, investments made by agricultural holdings are increasingly environmentally friendly by reducing the energy intensity of production. On the other hand, investments are most often financed by income and accumulated after time (depending on the type of investment) in production resources (assets). It is also worth noting here that in a situation even of low income, but a relatively high level of farm assets, there are wider possibilities of financing pro-environmental investments through credit, due to greater credit collateral [1]. All in all, however, it is the income that has a stronger impact on the env_approach than the assets, which, moreover, is shown by our models. This can be attributed to the capitalization of subsidies in assets (land) [58]. The point is that through this process, especially in the new EU member states where there are no so-called historical area payment entitlements [59], land prices are rising apart from their utility, creating a spontaneous accumulation of assets, which increases their value. As a result, the impact of the assets is weaker than of the income. However, due to the greater volatility of agricultural income in comparison with assets, in the long run, the impact of assets is likely to increase. However, this would require further research in this area. The importance of state support for the agricultural sector (not only through subsidies), but also through the implementation of various joint initiatives (e.g., public–private partnerships) may be very important and can be an effective tool to implement the projects concerning modern agricultural development (in developing countries), as indicated by Morea and Balzarini [60] and Morea and Balzarini [61].
The research carried out also indicates that economic goals (higher income, the value of assets) do not have to be contradictory to the environment, which is not obvious [5]. Higher incomes are favorable to the agricultural producer in the env_approach, which results from the institutionalization (mainly through the EU CAP instruments, as well as the existing requirements and standards) of farm functioning. This is also confirmed by the results of other studies [10]. Based on the research on Dutch sugar beet growers, there is a possibility for them to achieve economic and environmental goals at the same time.
6. Conclusions
The research confirms the previously formulated research hypotheses. First of all, both the income and the assets of agricultural producers have a positive impact on their approach to the environment. This might be due to the wider possibilities of financing environmental activities (higher income and value of collateral in the case of loans), and greater awareness and knowledge in the environmental area, which also encourages them to install an alternative energy source. Social pressure and the fact that agricultural producers are also consumers, increasingly aware of public goods, seem also important here. To a greater extent, the farmer’s approach to the environment is influenced by income rather than by assets. This may be influenced by the capitalization of subsidies in the price of agricultural land, which makes this element of farm assets detached from real processes. It is a new topic, which should be developed in the future. At the level of agricultural policy, the question arises: is the environmental development of farms stimulated by means of income support? In light of our research, the answer is positive. It is also a problem of treating farm size as a heterogeneous factor, affected not only by the value of assets but also incomes. Thus, flows are more important than resources in shaping this variable even though, in the long run, income is a function of assets.
Among the analyzed indicators from seven groups, the vast majority turned out to be statistically insignificant. This confirms once again the importance of income and assets in the scope of the analyzed dependencies, all the more so because they turned out to be statistically significant, while the models used (from the perspective of control variables) proved to be stable. It also results from the conducted research that it is easier for farms with higher income and assets to realize the orientation towards sustainability, which is a dynamic process. Even if these units exert greater environmental pressure, they have a significant potential to reduce it through the possibilities of pro-environmental investments (use of alternative energy sources, thermal modernization of buildings, replacement of traditional septic tanks for the benefit of the environment or sewage connection; modernization of the place where plant protection products (fertilizers) are stored, use of knowledge and awareness). According to our research, the approach to the environment is, to some extent, influenced also by agricultural education. This means that agricultural knowledge is crucial in shaping pro-environmental attitudes of agricultural producers. At the same time, it should be remembered that higher income favors economic sustainability (the issue of parity income) or, in certain areas, social sustainability (better education). This means that environmental and economic objectives do not have to be antagonistic towards each other. This is an important conclusion which fits into the paradigm of sustainable development and indicates that economic and environmental development can be stimulated simultaneously. Better treatment of the environment by farmers by improving their approach to these issues will help to improve the environment, which can contribute to the transition towards sustainability. This depends, among other things, on the agricultural policy instruments. It would be interesting to repeat this research in another EU region in a country with a higher level of development. The issue of the other dimensions of sustainability, such as the vitality of rural areas, the cultural context, landscape order and biodiversity, remains an open question. This can be explored in future studies. In addition, the prospects for further research related to the impact of income and assets on the environment should be sought in the area of comparative research between countries (regions) using aggregated data or the FADN database. A behavioral approach that takes into account the perception of farmers’ objectives linked to a farm’s operating also seems interesting. However, this is limited by the relatively high costs of such surveys. In the case of the research methods, however, the use of structural equation modelling still seems promising despite some of the limitations that we have mentioned earlier.
In light of the above analyses, CAP support instruments should be more closely linked to environmental investments (a larger envelope to support such investments). This includes measures to mitigate climate change, and the implementation of eco-innovation (new production techniques). As Beltrán-Esteve et al. [62] stated, subsidizing the use of green practices is required to boost attempts to catch up with environmental technologies on farms in Europe. For smaller farms, it would be advisable, on the one hand, to continue the current trend towards the valorization of the public goods provided by these units (LFA payments, set-aside, payments for the development of rural areas, relatively easier to obtain payments under so-called greening). On the other hand, it would be worth considering for these farms a system of grants related to pro-environmental investments. There is also the problem of the capitalization of support (subsidies), which increases the value of assets without having an adequate impact on the environmental issues. In this case, regulatory solutions at the national level concerning the functioning of the agricultural land market seem important. Simultaneously, agricultural education should also be supported to an even greater extent at the level of the Member States. This also concerns the implementation of courses by the relevant advisory services, as well as social advertisements to raise awareness of the environmental limitations of the functioning of economic entities and the related climate change.
Supplementary Materials
The following are available online at https://0-www-mdpi-com.brum.beds.ac.uk/2071-1050/12/12/4917/s1, Tables S1—S3.
Author Contributions
Conceptualization, A.G. and J.S.; methodology, A.G. and J.S.; formal analysis, A.G., J.S. and M.B.; investigation, A.G., J.S. and M.B.; writing—original draft preparation, A.G., J.S. and M.B.; writing—review and editing, A.G., J.S. and M.B.; project administration, A.G.; funding acquisition, A.G. All authors have read and agreed to the published version of the manuscript.
Funding
This article is founded by the National Science Centre in Poland (grant No. 2018/29/B/HS4/01844).
Acknowledgments
This article is founded by the National Science Centre in Poland (grant No. 2018/29/B/HS4/01844).
Conflicts of Interest
The authors declare no conflict of interest.
References
- Kataria, K.; Curtiss, J.; Balmann, A. Drivers of Agricultural Physical Capital Development. Theoretical Framework and Hypotheses. Factor Mark. Work. Pap. 2012, 18. [Google Scholar] [CrossRef]
- Grzelak, A. The problem of complexity in economics on the example of the agricultural sector. Agric. Econ. Czech 2015, 61, 577–586. [Google Scholar] [CrossRef] [Green Version]
- Pretty, J. Agricultural Sustainability: Concepts Principles and Evidence. Philos. Trans. B R. Soc. 2007, 363, 447–465. [Google Scholar] [CrossRef] [PubMed] [Green Version]
- Huylenbroeck, G.; Vandermeulen, V.; Meetepenningen, E.; Verspecht, A. Multifunctionality of Agriculture: A Review of Definitions, Evidence and Instruments. Living Rev. Landsc. Res. 2007, 1, 5–43. [Google Scholar] [CrossRef]
- Ripoll-Bosch, R.; Díez-Unquera, B.; Ruiz, R.; Villalba, D.; Molina, E.; Joy, M.; Olaizola, A.; Bernués, A. An integrated sustainability assessment of mediterranean sheep farms with different degrees of intensification. Agric. Syst. 2012, 105, 46–56. [Google Scholar] [CrossRef]
- Haileslassie, A.; Craufurd, P.; Thiagarajah, R.; Kumar, S.; Whitbread, A.; Rathor, A.; Blummel, M.; Ericsson, P.; Kakumanua, K.R. Empirical evaluation of sustainability of divergent farms in the dryland farming systems of India. Ecol. Indic. 2016, 60, 710–723. [Google Scholar] [CrossRef] [Green Version]
- Gomez-Limon, J.A.; Sanchez-Fernandez, G. Empirical evaluation of agricultural sustainability using composite indicators. Ecol. Econ. 2010, 69, 1062–1075. [Google Scholar] [CrossRef]
- Picazo-Tadeo, A.; Gomez-Limon, J.; Reig-Martínez, E. Assessing farming eco-efficiency: A data envelopment analysis approach. J. Environ. Manag. 2011, 92, 1154–1164. [Google Scholar] [CrossRef]
- Bonfiglio, A.; Arzeni, A.; Bodini, A. Assessing eco-efficiency of arable farms in rural areas. Agric. Syst. 2017, 151, 114–125. [Google Scholar] [CrossRef]
- De Koeijer, T.J.; Wossink, G.A.; Struik, P.C.; Renkema, J.A. Measuring agricultural sustainability in terms of efficiency: The case of Dutch sugar beet growers. J. Environ. Manag. 2002, 66, 9–17. [Google Scholar] [CrossRef]
- Dantsis, T.; Couma, C.; Giourga, C.; Loumou, A.; Polychronaki, E.A. A methodological approach to assess and compare the sustainability level of agricultural plant production systems. Ecol. Indic. 2010, 10, 256–263. [Google Scholar] [CrossRef]
- Westbury, D.B.; Park, J.R.; Mauchline, A.L.; Crane, R.T.; Mortimer, S.R. Assessing the environmental performance of English arable and livestock holdings using data from the Farm Accountancy Data Network (FADN). J. Environ. Manag. 2011, 92, 902–909. [Google Scholar] [CrossRef]
- Mukherjee, A.; Kamarulzaman, N.H.; Vijayan, G.; Vaiappuri, S. Sustainability: A Comprehensive Literature. In Handbook of Research on Global Supply Chain Management; Christiansen, B., Ed.; IGI Global Publishers: Hershey, PA, USA, 2016; pp. 248–268. [Google Scholar] [CrossRef]
- D’Souza, G.; Ikerd, J. Small Farms and Sustainable Development: Is Small More Sustainable? J. Agric. Econ. 1996, 28, 73–83. [Google Scholar] [CrossRef] [Green Version]
- Kirner, V.L.; Bartel-Kratochvil, R. Effect of off farm income; farm size; natural disadvantage and farming system on the sustainability of dairy farming in Austria—An empirical approach on the basis of farm accountancy data (Einfluss von Erwerbsart; Betriebsgröße; natürlicher Erschwernis und Wirtschaftsweise auf die Nachhaltigkeit der österreichischen Milchviehhaltung—Eine empirische Annäherung anhand von Buchführungsdaten). Ber. Über Landwirtsch. 2007, 85, 195–213. [Google Scholar]
- Den Biggelaar, C.; Suvedi, M. Farmers’ definitions; goals; and bottlenecks of sustainable agriculture in the North-Central Region. Agric. Hum. Values 2000, 17, 347–358. [Google Scholar] [CrossRef]
- Van Lierde, D.; Van den Bossche, A. Economical and Environmental Aspects of Integrated Fruit Production in Belgium. Acta Hortic. 2014, 638, 411–417. [Google Scholar] [CrossRef]
- Ryan, M.; Hennessy, T.; Buckley, C.; Dillon, E.J.; Donnellan, T.; Hanrahan, K.; Moran, B. Developing farm-level sustainability indicators for Ireland using the Teagasc National Farm Survey. Ir. J. Agric. Food Res. 2014, 55, 112–125. [Google Scholar] [CrossRef] [Green Version]
- Dolman, M.; Vrolijk, H.C.; de Boer, J.M. Exploring variation in economic; environmental and societal performance among Dutch fattening pig farms. Livest. Sci. 2012, 140, 143–154. [Google Scholar] [CrossRef]
- Mouron, P.; Scholz, R.W.; Nemecek, T.; Weber, O. Life cycle management on Swiss fruit farms: Relating environmental and income indicators for apple-growing. Ecol. Econ. 2006, 58, 561–578. [Google Scholar] [CrossRef]
- Tang, Q.; Bennett, S.J.; Xu, Y.; Li, Y. Agricultural practices and sustainable livelihoods: Rural transformation within the Loess Plateau; China. Appl. Geogr. 2013, 41, 15–23. [Google Scholar] [CrossRef]
- Jezeer, R.E.; Verweij, P.A.; Boot, R.G.; Junginger, M.; Santos, M.J. Influence of livelihood assets; experienced shocks and perceived risks on smallholder coffee farming practices in Peru. J. Environ. Manag. 2019, 242, 496–506. [Google Scholar] [CrossRef] [PubMed] [Green Version]
- Mutyasira, V.; Hoag, D.; Pendell, D.; Manning, D.T.; Berhe, M. Assessing the relative sustainability of smallholder farming systems in Ethiopian highlands. Agric. Syst. 2018, 167, 83–91. [Google Scholar] [CrossRef]
- Clement, F.; Haileslassie, A.; Ishaq, S.; Blummel, M.; Murty, M.V.; Samad, M.; Dey, S.; Das, H.; Khan, M.A. Enhancing Water Productivity for Poverty Alleviation: Role of capitals and institutions in the Ganga Basin. Exp. Agric. 2011, 47, 133–151. [Google Scholar] [CrossRef]
- Mbow, C.; Smith, P.; Skole, D.; Duguma, L.; Bustamante, M. Achieving mitigation and adaptation to climate change through sustainable agroforestry practices in Africa. Curr. Opin. Environ. Sustain. 2014, 6, 8–14. [Google Scholar] [CrossRef] [Green Version]
- Bou Dib, J.; Krishna, V.V.; Alamsyah, Z.; Qaim, M. Land-use change and livelihoods of non-farm households: The role of income from employment in oil palm and rubber in rural Indonesia. Land Use Policy 2018, 76, 828–838. [Google Scholar] [CrossRef] [Green Version]
- Fernandes, L.A.; Woodhouse, P.J. Family farm sustainability in southern Brazil: An application of agri-environmental indicators. Ecol. Econ. 2008, 66, 243–257. [Google Scholar] [CrossRef]
- Van der Ploeg, J. The New Peasantries: Struggles for Autonomy and Sustainability in an Era of Empire and Globalization; Earthscan Dunstan House: London, UK, 2009. [Google Scholar]
- Bennich, T.; Belyazid, S.; Kopainsky, B.; Diemer, A. Understanding the Transition to a Bio-Based Economy: Exploring Dynamics Linked to the Agricultural Sector in Sweden. Sustainability 2018, 10, 1504. [Google Scholar] [CrossRef] [Green Version]
- Falcone, P.M.; Garcia, S.G.; Imbert, E.; Lijo, L.; Moreira, M.T.; Tani, A.; Tartiu, V.E.; Morone, P. Transitioning towards the bio-economy: Assessing the social dimension through a stakeholder lens. Corp. Soc. Responsib. Environ. Manag. 2019, 26, 1135–1153. [Google Scholar] [CrossRef] [Green Version]
- Sarkar, S.F.; Poon, J.S.; Lepage, E.; Bilecki, L.; Girard, B. Enabling a sustainable and prosperous future through science and innovation in the bioeconomy at Agriculture and Agri-Food Canada. New Biotechnol. 2018, 40A, 70–75. [Google Scholar] [CrossRef]
- Hadrich, J.C.; Olson, F. Joint measurement of farm size and farm performance: A confirmatory factor analysis. Agric. Finance Rev. 2011, 71, 295–309. [Google Scholar] [CrossRef]
- Jürkenbeck, K.; Heumann, A.; Spiller, A. Sustainability Matters: Consumer Acceptance of Different Vertical Farming Systems. Sustainability 2019, 11, 52. [Google Scholar] [CrossRef] [Green Version]
- Li, B.; Mi, Z.; Zhang, Z. Willingness of the New Generation of Farmers to Participate in Rural Tourism: The Role of Perceived Impacts and Sense of Place. Sustainability 2020, 12, 766. [Google Scholar] [CrossRef] [Green Version]
- Mariyono, J. Stepping up from subsistence to commercial intensive farming to enhance welfare of farmer households in Indonesia. Asia Pac. Policy Stud. 2018, 6, 246–265. [Google Scholar] [CrossRef] [Green Version]
- Mariyono, J. Micro-credit as catalyst for improving rural livelihoods through agribusiness sector in Indonesia. J. Entrep. Emerg. Econ. 2019, 11, 98–121. [Google Scholar] [CrossRef]
- Rezaei, R.; Seidi, M.; Karbasioun, M. Pesticide exposure reduction: Extending the theory of planned behavior to understand Iranian farmers’ intention to apply personal protective equipment. Saf. Sci. 2019, 120, 527–537. [Google Scholar] [CrossRef]
- Luu, A.; Nguyen, A.T.; Trinh, Q.A.; Van Pham, T.; Le, B.; Nguyen, D.; Hoang, Q.; Pham, H.; Nguyen, K.; Luu, V.; et al. Farmers’ Intention to Climate Change Adaptation in Agriculture in the Red River Delta Biosphere Reserve (Vietnam): A Combination of Structural Equation Modelling (SEM) and Protection Motivation Theory (PMT). Sustainability 2019, 11, 2993. [Google Scholar] [CrossRef] [Green Version]
- Xu, Z.; Sun, B. Influential mechanism of farmers’ sense of relative deprivation in the sustainable development of rural tourism. J. Sustain. Tour. 2020, 28, 110–128. [Google Scholar] [CrossRef]
- Klein, R.B. Principles and Practice of Structural Equation Modelling, 3rd ed.; The Guilford Press: New York, NY, USA, 2011. [Google Scholar]
- Rabe-Hesketh, S.; Skrondal, A.; Pickles, A. Generalized multilevel structural equation modelling. Psychometrika 2004, 69, 167–190. [Google Scholar] [CrossRef]
- StataCorp. STATA: Structural Equation Modelling. Reference Manual; Release 15; Stata Press Publication: College Station, TX, USA, 2017. [Google Scholar]
- Kolenikov, S.; Angeles, G. The Use of Discrete Data in Principal Component Analysis with Applications to Socioeconomic Indices. CPC/Meas. Work. Pap. 2004, 85, 1–59. [Google Scholar]
- Cupo, P.; Di Cerbo, R.A. The determinants of ranking in sustainable efficiency of Italian farms. Rivista Di Studi Sulla Sostenibilita 2016, 2, 141–159. [Google Scholar] [CrossRef]
- Rickard, S. Food security and climate change: The role of sustainable intensification, the importance of scale and the CAP. EuroChoices 2015, 14, 48–53. [Google Scholar] [CrossRef]
- Leonhardt, H.; Penker, M.; Salhofer, K. Do farmers care about rented land? A multi-method study on land tenure and soil conservation. Land Use Policy 2019, 82, 228–239. [Google Scholar] [CrossRef]
- Czyżewski, B.; Matuszczak, A.; Muntean, A. Approaching environmental sustainability of agriculture: Envi-ronmental burden, eco-efficiency or eco-effectiveness. Agric. Econ. Czech 2019, 65, 299–306. [Google Scholar]
- Gadanakis, Y.; Bennett, R.; Park, J.; Areal, F. Evaluating the sustainable intensification of arable farms. J. Environ. Manag. 2015, 150, 288–298. [Google Scholar] [CrossRef] [PubMed] [Green Version]
- Kagan, A. Techniczna i Środowiskowa Efektywność Wielkotowarowych Przedsiębiorstw Rolnych w Polsce (Technical and Environmental Efficiency of Large-Scale Agricultural Enterprises in Poland); IERiGŻ-PIB: Warszawa, Poland, 2014. [Google Scholar]
- Bonanomi, A.; Luppi, F. A European Mixed Methods Comparative Study on NEETs and Their Perceived Environmental Responsibility. Sustainability 2020, 12, 515. [Google Scholar] [CrossRef] [Green Version]
- Zhang, L.; Zhang, J. Perception of small tourism enterprises in Lao PDR regarding social sustainability under the influence of social network. Tour. Manag. 2018, 69, 109–120. [Google Scholar] [CrossRef]
- Kuznets, S. Economic Growth and Income Inequality. Am. Econ. Rev. 1955, 45, 1–28. [Google Scholar]
- Gomez-Limon, J.; Picazo-Tadeo, A.J.; Reig-Martínez, E. Eco-efficiency assessment of olive farms in Andalusia. Land Use Policy 2012, 29, 395–406. [Google Scholar] [CrossRef]
- Rodriguez, E.; Sultan, R.; Hilliker, A. Negative Effects of Agriculture on Our Environment. Traprock 2004, 3, 28–32. [Google Scholar]
- Piekut, K.; Machancki, M. Ocena ekologiczno-ekonomiczna gospodarstw rolnych na podstawie danych FADN (Ecological and economic assessment of farms based on the FADN Data). Woda Środowisko Obsz. Wiej. 2011, 11, 203–219. [Google Scholar]
- Grovermann, C.H.; Wossen, T.; Muller, A.; Nichterlein, K. Eco-efficiency and agricultural innovation systems in developing countries: Evidence from macro-level analysis. PLoS ONE 2019, 14. [Google Scholar] [CrossRef] [PubMed] [Green Version]
- Van Grinsven, H.; Van Eerdt, M.; Westhoek, H.; Kruitwagen, S. Benchmarking eco-Efficiency and footprints of Dutch agriculture in European context and implications for policies for climate and environment. Front. Sustain. Food Syst. 2019. [Google Scholar] [CrossRef] [Green Version]
- Swinnen, J.; Vranken, L. Land & EU Accession. Review of the Transitional Restrictions by New Members States on the Acquisition of Agricultural Real Estate; Centre for the European Policy Studies (CEPS): Brussels, Belgium, 2009. [Google Scholar]
- Van Herck, K.; Vranken, L. Direct payments and land rents: Evidence from new member states. Factor Markets. Work. Pap. 2013, 62. [Google Scholar] [CrossRef] [Green Version]
- Morea, D.; Balzarini, M. Financial sustainability of a public-private partnership for an agricultural development project in Sub-Saharan Africa. Agric. Econ. Czech 2018, 64, 389–398. [Google Scholar] [CrossRef] [Green Version]
- Morea, D.; Balzarini, M. Bankability of a public private partnership in agricultural sector: A project in Sub Saharan Africa. Agric. Econ. Czech 2019, 65, 212–222. [Google Scholar] [CrossRef] [Green Version]
- Beltrán-Esteve, M.; Giménez, V.; Picazo-Tadeo, A.J. Environmental productivity in the European Union: A global Luenberger-metafrontier approach. Sci. Total Environ. 2019, 692, 136–146. [Google Scholar] [CrossRef]
Figure 1.
Conceptual framework of the environmental approach among farmers (explanation of variables in Table S1). Source: own elaboration.
Figure 1.
Conceptual framework of the environmental approach among farmers (explanation of variables in Table S1). Source: own elaboration.


Table 1.
Justification for the factors of the environmental approach included in the research.
| Determinant | Logic | Examples |
|---|---|---|
| wealth | higher income means more resources to be invested in more sustainable production | [12] |
| specialization | animal production generates higher environmental pressure, specialized farms, base more than mixed on external production inputs (i.e., fertilizers, fodder), an excessive specialization is negative for the environment because it leads to a loss of biodiversity | [44] [7] |
| farm size | some environmental solutions are profitable only at a proper scale of production (i.e., precise farming) The bigger farms are able to achieve better environmental performance | [45] [12] |
| land ownership | farmers will care more for the land they own | [46] |
| pressure | farmers generating higher environmental pressure may have more incentive to offset the damage | [47] |
| subsidies | farmers obtaining higher agri-environmental subsidies or direct payments coupled with some environmental requirements should care more, | [7,29] |
| education and experience | farmers with higher educational levels and experience have better managerial skills and can allocate resources better and improve the ratio between economic value added and the environmental pressures generated | [29,48] |
| professionalization | highly commercial farms are more profitable than environmentally oriented | [49] |
Table 2.
Summary of the research strategy.
| Phase | Additional Data | Methods | Results | ||
|---|---|---|---|---|---|
 | 1. Defining the latent variable “environmental approach” | proxies for farmer’s knowledge, actions, plans and self-assessment | generalized structural equation modelling, standard errors | descriptive statistics polychoric correlation, Cronbach’s alpha | Table 3 and Table 4; Tables S1 and S2. |
| 2. Identifying core determinants of the environmental approach | assets, income, interaction of assets and income | Akaike and Bayesian information criteria | |||
| 3. Control variables selection for the models’ robustness check | proxies for specialization, farm size, land ownership, pressure generated by production, subsidies, education and experience, professionalization | Table S3. | |||
| 4. Models’ robustness check | backward stepwise algorithm | Table 5. | |||
Source: own elaboration.
Table 3.
Selected descriptive statistics of the agricultural holdings surveyed in the Wielkopolska region (2020).
Table 3.
Selected descriptive statistics of the agricultural holdings surveyed in the Wielkopolska region (2020).
| Specification | Mean | Min. | Max. | St. dev. |
|---|---|---|---|---|
| age of the manager (years) | 46.96 | 24.00 | 68.00 | 11.46 |
| the area of utilized agricultural area (UAA) (ha) | 28.99 | 4.22 | 151.15 | 22.77 |
| stocking density (LU/ha) | 1.36 | 0.00 | 10.41 | 1.39 |
| share of plant cover on arable land during winter | 49.63 | 0.00 | 100.00 | 26.45 |
| annual work unit (AWU) | 1.98 | 0.40 | 6.28 | 2045.50 |
| value of agricultural output (thousand EUR) | 72.41 | 5.39 | 412.80 | 233.05 |
| agriculture income (thousand EUR) | 19.25 | -3.35 | 102.58 | 90.90 |
| gross investment (thousand EUR) | 10.39 | 0.00 | 140.19 | 109.95 |
| value of assets (thousand EUR) | 327.72 | 30.30 | 1351.30 | 1038.81 |
| total liabilities (thousand EUR) | 19.15 | 0.00 | 443.93 | 242.66 |
| total subsidies (thousand EUR) | 14.49 | 0.82 | 225.47 | 130.68 |
| intensity of fertilization with mineral fertilizers (t/ha) | 0.49 | 0.00 | 2.71 | 0.34 |
| share of arable land on which manure is used (in %) | 47.85 | 0.00 | 100.00 | 33.36 |
Number of observations N = 120; Source: own study based on the questionnaire survey.
Table 4.
Models with wealth (assets, income) indicators only (explanation of variables Table S1).
Table 4.
Models with wealth (assets, income) indicators only (explanation of variables Table S1).
| Model (Number) | 1 | 2 | 3 | 4 | 5 | |
|---|---|---|---|---|---|---|
| Variables | ||||||
| knowledge | 1 | 1 | 1 | 1 | 1 | |
| (constr.) | (constr.) | (constr.) | (constr.) | (constr.) | ||
| actions | 0.393 ** | 0.337 * | 0.415 ** | 0.389 ** | 0.305 * | |
| (0.188) | (0.196) | (0.185) | (0.188) | (0.170) | ||
| self_assess | 0.999 ** | 0.670 ** | 0.970 ** | 0.801 ** | 0.645 * | |
| (0.458) | (0.315) | (0.389) | (0.351) | (0.342) | ||
| plans | 0.537 * | 0.476 | 0.591 ** | 0.563 * | 0.476 | |
| (0.288) | (0.320) | (0.297) | (0.314) | (0.298) | ||
| assets | 1.039 ** | 0.535 | 3.865 * | |||
| (0.486) | (0.438) | (0.237) | ||||
| income | 0.932 *** | 0.797 ** | 8.504 * | |||
| (0.363) | (0.381) | (4.666) | ||||
| i_a | −1.049 * | |||||
| (0.632) | ||||||
| e.env_approach | 2.697 | 3.337 | 2.082 | 2.359 | 2.901 | |
| (1.593) | (2.422) | (1.179) | (1.525) | (2.123) | ||
| log.like | −571.037 | −566.335 | −563.858 | −562.514 | −560.082 | |
| df | 21 | 22 | 22 | 23 | 24 | |
| AIC | 1184.074 | 1176.671 | 1171.716 | 1171.027 | 1168.164 | |
| BIC | 1242.612 | 1237.996 | 1233.041 | 1235.140 | 1235.064 | |
For explanation of the variables, see Table S1; AIC—Akaike information criterion, BIC—Bayesian information criterion, df—degrees of freedom, standard errors in parenthesis, e.env_approach—variance of the latent variable error, variable significant at level: *** p < 0.01, ** p < 0.05, * p < 0.1; detailed description of the variables available in Table S1. Source: own study based on the questionnaire survey.
Table 5.
Models with assets and income, and control variables (explanation of variables in Table S1).
Table 5.
Models with assets and income, and control variables (explanation of variables in Table S1).
| Model (Number) | 6 | 7 | 8 | 9 | 10 | 11 | 12 | |
|---|---|---|---|---|---|---|---|---|
| Variables | ||||||||
| knowledge | 1 | 1 | 1 | 1 | 1 | 1 | 1 | |
| (constr.) | (constr.) | (constr.) | (constr.) | (constr.) | (constr.) | (constr.) | ||
| actions | 0.266 * | 0.270 * | 0.273 * | 0.258 * | 0.233 * | 0.257 * | 0.263 * | |
| (0.147) | (0.152) | (0.150) | (0.146) | (0.132) | (0.146) | (0.146) | ||
| self_assess | 0.564 * | 0.558 * | 0.589 ** | 0.568 * | 0.534 * | 0.555 * | 0.597 * | |
| (0.293) | (0.289) | (0.292) | (0.291) | (0.289) | (0.287) | (0.331) | ||
| plans | 0.454 | 0.442 | 0.466 | 0.453 | 0.397 | 0.470 | 0.386 | |
| (0.312) | (0.298) | (0.307) | (0.312) | (0.267) | (0.319) | (0.242) | ||
| assets | 4.352 * | 4.338 ** | 4.304 ** | 4.402 * | 4.736 * | 4.834 * | 3.759 * | |
| (2.228) | (2.218) | (2.187) | (2.319) | (2.505) * | (2.505) | (2.247) | ||
| income | 9.077 * | 8.985 * | 8.511 * | 8.637 * | 9.570 * | 9.650 * | 8.459 * | |
| (4.950) | (4.901) | (4.599) | (4.855) | (5.181) | (5.133) | (4.692) | ||
| i_a | −1.103 * | −1.086 * | −1.031 * | −1.048 | −1.173 * | −1.186 * | −1.041 | |
| (0.663) | (0.656) | (0.619) | (0.655) | (0.702) | (0.694) | (0.638) | ||
| mixed | −0.525 | −0.548 | −0.546 | |||||
| (0.476) | (0.472) | (0.464) | ||||||
| es | −0.564 | −0.568 | −0.721 * | −0.751 ** | −0.647 * | −0.654 * | ||
| (0.481) | (0.486) | (0.376) | (0.378) | (0.388) | (0.375) | |||
| lease_b | 0.523 | 0.544 | 0.553 | 0.537 | ||||
| (0.443) | (0.444) | (0.431) | (0.434) | |||||
| fert_rate_A | 1.391 | 1.380 | 1.261 | 1.364 | 1.474 | 1.671 * | ||
| (0.912) | (0.913) | (0.829) | (0.873) | (0.935) | (0.958) | |||
| subs_A | 0.269 | 0.270 | ||||||
| (0.410) | (0.410) | |||||||
| edu_B | 0.756 | 0.766 | 0.730 | 0.770 | 0.868 | 1.073 * | ||
| (0.578) | (0.580) | (0.558) | (0.567) | (0.596) | (0.609) | |||
| no_contract | −0.240 | |||||||
| (0.444) | ||||||||
| e.env_approach | 2.561 | 2.610 | 2.476 | 2.666 | 3.147 | 2.878 | 3.217 | |
| (2.198) | (2.208) | (2.046) | (2.316) | (2.661) | (2.458) | (2.345) | ||
| log.like | −552.169 | −552.288 | −552.604 | −553.404 | −554.017 | −555.581 | −557.535 | |
| df | 31 | 30 | 29 | 28 | 27 | 26 | 25 | |
| AIC | 1166.338 | 1164.575 | 1163.209 | 1162.807 | 1162.034 | 1163.162 | 1165.070 | |
| BIC | 1252.750 | 1248.200 | 1244.046 | 1240.857 | 1237.296 | 1235.637 | 1234.757 | |
For explanation of the variables, see Table S1; AIC—Akaike’s information criterion, BIC—Bayesian information criterion, df—degrees of freedom, standard errors in parenthesis, e.env_approach—variance of the latent variable error, variable significant at level: ** −p < 0.05, * −p < 0.1; detailed description of the variables available in Table S1. Source: own study based on the questionnaire survey.
© 2020 by the authors. Licensee MDPI, Basel, Switzerland. This article is an open access article distributed under the terms and conditions of the Creative Commons Attribution (CC BY) license (http://creativecommons.org/licenses/by/4.0/).
Share and Cite
MDPI and ACS Style
Grzelak, A.; Staniszewski, J.; Borychowski, M. Income or Assets—What Determines the Approach to the Environment among Farmers in A Region in Poland? Sustainability 2020, 12, 4917. https://0-doi-org.brum.beds.ac.uk/10.3390/su12124917
AMA Style
Grzelak A, Staniszewski J, Borychowski M. Income or Assets—What Determines the Approach to the Environment among Farmers in A Region in Poland? Sustainability. 2020; 12(12):4917. https://0-doi-org.brum.beds.ac.uk/10.3390/su12124917
Chicago/Turabian StyleGrzelak, Aleksander, Jakub Staniszewski, and Michał Borychowski. 2020. "Income or Assets—What Determines the Approach to the Environment among Farmers in A Region in Poland?" Sustainability 12, no. 12: 4917. https://0-doi-org.brum.beds.ac.uk/10.3390/su12124917
Note that from the first issue of 2016, this journal uses article numbers instead of page numbers. See further details here.