Inequality of Income in Agricultural Holdings in Poland in the Context of Sustainable Agricultural Development


1
Department of Financial Markets and Public Finance, Institute of Economics and Finance, University of Rzeszow, 35-601 Rzeszow, Poland
2
Department of Economics and International Economic Relations, Institute of Economics and Finance, University of Rzeszow, 35-601 Rzeszow, Poland
*
Author to whom correspondence should be addressed.
Sustainability 2020, 12(12), 4963; https://0-doi-org.brum.beds.ac.uk/10.3390/su12124963
Submission received: 30 May 2020
/
Revised: 12 June 2020
/
Accepted: 16 June 2020
/
Published: 18 June 2020
(This article belongs to the Collection Sustainable Development of Rural Areas and Agriculture)
Abstract
:The study investigates the redistributive effects of agricultural policy and the importance of income inequalities among agricultural holdings for sustainable agricultural development based on the intra-sectoral differences of the disposable income of farmer households and the income from family agricultural holdings in Poland in the years 2004–2018. The problem of excessive and growing income inequalities in agriculture has been recognized as an important barrier to the sustainable development of agriculture in Poland. The aim of the study is to establish a relationship between the process of income polarization in agriculture and the process of concentration of production factors in this sector, and the level of budget support. The Gini coefficient, concentration index, and multivariate regression analysis were used as research methods. It was shown that the process of the concentration of land and capital has led to an increase in income disparities in this sector. Budgetary expenditure directed to the sector in the form of subsidies supporting farmer incomes was not able to reverse the process of income polarization, but mitigated the growing inequalities (reducing the scale of income spreads).
1. Introduction
In 1997, sustainable development became a major challenge for the European Union and was included in the Treaty of Amsterdam as the overarching objective of EU policy [1]. Creating a sustainable agricultural development path means improving the quality of life in rural areas, ensuring enough food for present and future generations, and generating sufficient income for farmers. Supporting the sustainable development of agriculture also involves ensuring and maintaining future production capacity and increasing productivity without harming the environment and natural resources [2,3,4,5,6,7]. An analysis of the Common Agricultural Policy (CAP) evolution points to the intensification of the instruments aimed at the sustainability of agriculture and rural areas; however, progress in sustainability differs from societal expectations [8,9]. One of the reasons for this is the income gap between the income of farmers and other socio-occupational groups and the growing income inequalities among farms (intra-sectoral inequalities). The European Commission has, for many years, expressed concerns about the inequitable distribution of income support [10].
Income from an agricultural holding is not only an economic category, but also a social one. It is an indicator of the social status of a farming family. For farmers, it is important not only to reduce income inequalities in relation to other socio-occupational groups, but also to reduce income inequalities in agriculture itself.
Research interest on the issue of agricultural income focuses primarily on the problem of income disparity between farmers and other socio-occupational groups [11,12], as well as on the instability of agricultural income [13]. Much of the literature is also devoted to the impact of agricultural policy instruments, including CAP instruments, on farmers’ income—in particular, their level and stability [14,15,16,17,18,19]. Much less attention has been paid to the problem of income disparities within agriculture [20,21,22]. Furthermore, the impact of the EU and national farm support programs on farmers’ income differences—i.e., the issue of the redistributive effects of agricultural policy—has not been widely discussed in mainstream literature, although in recent years, it has been gaining importance [23,24,25,26,27,28,29]. Instead, the focus has been on an optimal combination of instruments to transfer consumer and taxpayer surpluses to agricultural producers. There is also a literature gap concerning the analysis of the importance of increasing income inequalities among agricultural holdings for sustainable agricultural development [30].
For the above reasons, the subject of this study covers income disparities within the agricultural sector in Poland in the years 2004–2018. The inequality of income of agricultural holdings was analyzed in the context of sustainable agricultural development. A literature review served as a premise for the argument that large and growing intra-sectoral inequalities in farm income are not conducive to sustainable agricultural development, as they hinder the achievement of economic and social order and, in some cases, environmental (ecological) order. In this context, the aim was to discover which factors stimulate and which inhibit the process of polarization of agricultural income.
Attention was paid to two key factors responsible for the differences in farm incomes: changes in the structure of agricultural factors of production or, more specifically, the processes of concentration of land, labor, and capital in the structure of agricultural holdings of different economic strength, and budget expenditure directed to agriculture to support farmers’ income. It is assumed that the processes of concentration of factors of production stimulate an increase in income inequality. As far as agricultural policy is concerned, it is assumed that by means of instruments supporting farmers’ income, the policy leads not only to a reduction in the income gap between farmers and other socio-occupational groups, but also to a reduction in the income gap within the agricultural sector. This results from the fact that there are mechanisms among CAP instruments, which employ degressive support: i.e., decreasing support with the increase in the size of agricultural holdings. During the research, the following hypotheses were formulated:
Hypothesis 1 (H1).
In the years 2004–2018, an increase in the concentration of production factors—i.e., labor, land, and capital in agriculture—accentuated the income inequalities of agricultural holdings.
Hypothesis 2 (H2).
Budget support for agriculture reduced the polarization of income of agricultural holdings.
The study is structured as follows: the first part contains theoretical considerations on the importance of income inequalities for the sustainable development of agriculture and the impact of processes of concentration of production factors and agricultural policy on farmers’ income. This is followed by a discussion of the methodology used for the analysis and a consideration of the research results. The paper concludes with the most important research findings.
2. Income Inequalities and Agricultural Sustainability
Income is the economic result of decisions made by a farmer and, thus, a measurable effect of agricultural activity. An appropriate level of income may lead to a family being “connected” to an agricultural holding, as the income from their family farm secures their basic economic and social expectations and allows for sustainable farm development. An insufficient level of income causes the household to cease playing the role of a central point in a family’s life, forces it to no longer be the primary place of work, and the family will move away from permanently tying their future to it [16].
The amount of income earned, compared not only to other socio-occupational groups, but also to other farmers, is a measure of the standard of living of the agricultural population and is a necessary factor for satisfaction, utility, and well-being. This is not only about the objective, but also about the subjective assessment of prosperity, which has a specific impact on farmers’ decisions regarding agricultural production, additional economic activities, as well as decisions regarding investment and farm development.
Excessive internal income inequalities in agriculture in a given country, as well as a large income gap between farmers from that country and farmers from other countries, can make it difficult to achieve economic, social, and environmental order. This balance is a goal of sustainable development, both at the microeconomic (farms) [6] and the macroeconomic (sectoral) level [31].
With regard to social order, deepening income inequalities within the agricultural sector should be viewed rather negatively (poverty, social exclusion, etc.). It is more difficult, however, to assess the impact of the polarization of farmers’ income on the achievement of economic and environmental order in agriculture. For agriculture, as for any other area of economic activity, differences in income are a natural phenomenon. They result mainly from the disproportion in productivity of the production factors in agriculture [32], but also from the influence of many other variables, such as the level and structure of the production factors involved in agricultural production, its scale and intensity, the quality of agricultural production space, the ability to manage farm resources, etc. Therefore, income inequality is not a negative phenomenon in itself. The problem is excessive income inequality, the level of which is difficult to accept due to its negative economic and social effects (poverty, social exclusion, etc.) [33].
In the case of agriculture, the progressive polarization of income favors commercial and economically strong farms [34]. High incomes tend to be concentrated in farms that are larger in size and economically strong. These farms often increase their production resources, mainly the size of agricultural land, by taking over (through a transfer of ownership or lease) economically weaker farms with declining or even collapsing production. This might have positive, but also negative, economic and social consequences. On the one hand, the progressive polarization of income results in the resource flow within the agricultural sector (from economically weak farms to agricultural holdings with development potential), which contribute to the effective allocation of resources. If the resource flow within the sector, however, is too rapid and large-scale, this can lead to many disadvantages in terms of agricultural sustainability. The negative effects may include, for example, the excessive concentration of assets—including land resources and agricultural production—in large agricultural enterprises, and the displacement of smaller family farms from the market. Moreover, the flow of land resources may result in the pauperization of families who have got rid of agricultural land or their entire farm, and whose labor resources have not found employment in non-agricultural areas of the economy. Such phenomena may occur when the pace of concentration of the agrarian structure is ahead of the development of the non-agricultural sectors of the economy capable of absorbing surplus labor released in agriculture.
Excessive income inequalities can be a barrier to environmental order: for example, because of the increased risk of environmentally unfavorable practices by economically excluded or poor individuals (e.g., use of low-quality fuels for heating buildings, incomplete application of cross-compliance requirements, etc.).
The key to achieving economic and social order is to create an agricultural income that will ensure an appropriate standard of living for the agricultural population [10]. Conversely, social order requires appropriate social acceptance for agricultural producers, the protection of rural cultural heritage, focus on the vitality of rural areas, social cohesion, and the elimination of poverty [35,36].
Wrzaszcz [37] proves that a high level of profitability of work in agriculture is possible both through the implementation of pro-environmental practices and of those generating threats to the ecosystem. In general, however, production that favors public goods and the reduction of negative externalities may be contrary to the economic objective of maximizing income [38]. As a result, economic motivations often prevail over those that are socially and ecologically oriented.
Excessive income disparities between holdings representing different types of agricultural production can result in an unfavorable allocation of resources in the sector, which is detrimental to the sustainability of agriculture. Resources are, at times, directed to those types of production that are more profitable, which will increase the scale of production and concentrate it in some branches at the cost of reducing or abandoning production in others that are important for the public goods provided by agriculture or for food security.
Due to the disharmony of economic, social, and environmental order, the problem is not only to find ways to achieve these individually, but, above all, to balance them. It is recognized that excessive income inequalities, illustrated by a Gini coefficient of more than 0.45, are a hindrance to economic and social sustainability and, to some extent, organic farming.
3. Concentration of Agricultural Factors of Production and Agricultural Budget Expenditure Versus Farm Income Disparities
The communis opinio in the literature follows the conviction about the positive influence of the concentration of production resources on the economic efficiency and eco-efficiency of farms: for example, through the sustainable intensification of agriculture [38,39,40]. Zegar [40] claims that the improvement of the agrarian structure is a sine qua non for increasing the economic production and social efficiency of agriculture in Poland. At the same time, some advanced technological solutions, which may also be environmentally friendly (precision farming), require an appropriate scale of production to maintain profitability [41]. Larger farms have easier access to capital and have greater opportunities to implement innovations, which are the main driving force behind the process of sustainable intensification [42,43].
A structural change that would be conducive to increasing the efficiency of agricultural production through the concentration of resources, especially the size of agricultural land, is desirable from an economic point of view. In many cases, however, it leads to an increase in the scale and intensity of agricultural production and an increase in its ecological footprint, which is not always reflected in farm sustainability analyses due to the imperfections of environmental sustainability measures. There is no doubt, however, that the dominance of large farms with large-scale intensive agricultural production has a negative impact on the vitality of rural areas, as it reduces local labor demand in this sector. These farms are also less connected to the local market. The concentration of the agrarian structure also reduces biodiversity and landscape values.
It can be assumed that there is a two-way relationship between the process of concentration of resources in agriculture and the polarization of agricultural income. This means that concentration processes leading to an increase in the effectiveness of production factors result in an increase in economic efficiency and the income of agricultural producers [32]. As previously highlighted, however, this process favors those farms that increase their production resources, and simultaneously is unfavorable for those farms from which these resources flow away. As a result, we observe dualism in the development of the sector, which is specific to agriculture in Poland. On the one hand, it is dominated by farms with little economic potential and limited development opportunities, while, on the other, there are commercial and economically strong farms supplying about 80% of food production to the market. The former are an important element of rural multiculturalism and fulfil important functions in preserving biodiversity. These include small-scale farms producing food for the owner and their family, connected with the local market. The latter represent advancements and competitiveness in agriculture [44].
The problem in the context of sustainable development lies in the fact that the dual path of development is not only a transition state, which will lead—among other things, by taking over land resources—to the total elimination of small agricultural holdings by large and economically strong farms or agricultural enterprises. Small agricultural holdings, operating alongside large and economically strong ones, can ensure the diversity of agriculture and food products and can be a driver of the rural economy. They are the place of work and the residence of farming families but, at the same time, they bring in insufficient income, forcing members of the farmers’ families to seek additional work and livelihood in non-agricultural activities. The dual model of agriculture can be beneficial for the sustainable development of agriculture and rural areas if surplus labor resources from agriculture can find employment and satisfactory income in non-agricultural sectors. Gradually, the land resources released by small farms will be transferred to modern progress-oriented family farms. The processes of the concentration of production factors should proceed gradually without destroying the economic and social order of agriculture.
A tool that can control, to some extent, the direction and pace of structural changes and the allocation of resources in agriculture is budget expenditure on agriculture and rural development. The income of farmers in EU countries is supported by direct payments and other subsidies from CAP instruments. The rationale for supporting development processes in agriculture (e.g., through investment grants) is to increase the competitiveness of farms, their capacity for extended production, modernize their production potential and implement innovations, and also boost production factors. Interventionism in agriculture, however, is increasingly perceived as rewarding farmers for the provision of public goods and the internalization of the social costs of the negative externalities of agricultural production [4]. This is related to the concept of sustainable development. Still, the question is to what extent subsidizing farmers’ incomes affects intra-sectoral differences in this respect.
In many countries around the world, a significant part of budget support for agriculture reaches mainly the largest farms, generating negative externalities, which is contrary to social expectations [45,46]. In Poland, 20% of subsidies are received by 67% of farms (small farms up to 30 ha), while the remaining 80% are taken over by one third of farms (mostly large farms over 30 ha or even 40 ha) [47]. The benefits of the agricultural policy created by budget expenditure vary depending on the size of farms or the type of farming [24,27]. The largest or more narrowly specialized farms, however, are not always the only ones to profit. Some CAP surveys indicate that the net balance of area payments for large one-way farms producing cereals by extensive farming may be negative. Such farms earn money from subsidies and productivity growth resulting from grants for investment. They lose significantly, however, on increases in lease and land prices [48]. Research on the impact of agricultural policy instruments on agricultural income differences consists mainly in comparing the scale of farm income spreads before and after the transfer of subsidies [24,27,49]. This indicates that subsidies reduce the concentration of income in agriculture caused by market forces.
4. Materials and Methods
4.1. Methods
In order to assess the scale of intra-sectoral income inequalities in agriculture, the Gini coefficient of disposable income per person in farmer households was used. The cyclical survey of the Polish Central Statistical Office (CSO) entitled “Household Budget Survey” from the years 2004–2018 was the data source [50]. This survey covered about 37 thousand Polish households (various types). The Gini coefficient was calculated using the formula [51]:
where: i = 1 to N, N is the number of subjects in a population, yi is the income of the i household indexed in non-decreasing order (yi ≤ yi+1), and is the average income of households in a population.
The low income stratification of a given population of farms can be observed when the Gini coefficient is less than 0.30. A Gini coefficient ranging from 0.30–0.45 illustrates average income disparities, while values above 0.45 characterize communities with high income stratification [52].
For the analysis of income differentiation among family farms per full-time equivalent employment (annual work unit; AWU), the concentration index C (Equation (2)), and the coefficient of variation V (the ratio of the standard deviation to the mean) were used. The range parameter R was also used in a modified form—i.e., illustrating the difference between the highest and the lowest value of the feature studied in the sample, but in the form of a multiple of the average determined for the sample.
The concentration index C was also used to assess the concentration of production factors in agricultural holdings in Poland. C is related to the concentration curve and is defined as twice the area between the concentration curve L(p) and the line of equality (line 45°). For grouped data, this index can be calculated with the following formula [53]:
where:
C = (p1L(p2) − p2L(p1)) + (p2L(p3) − p3L(p2)) + … + (pk − 1L(pk) − pkL(pk − 1))
k = 1 …, k—number of economic groups of agricultural holdings;
pk—the cumulative percentage of the sample ranked by economic size of holdings;
L(pk)—the corresponding concentration curve coordinate (cumulative percentage of the resource variable or income of a family farm corresponding to each cumulative percentage of the distribution of economic size of the holdings).
Where there were no inequalities related to income or production factors, the concentration index was 0. A low value of the index indicated a dispersion of income and resources among a larger number of farms (with a smaller area), while values higher than 0.5 proved the concentration of income or resources among the largest agricultural producers.
A multivariate linear regression analysis was applied in order to establish the interdependence of the income inequalities of farmers and the processes of resource concentration, and the level of agricultural budget support in Poland. The Pearson correlation analysis was used in order to determine the strength of the linear association between variables. The regression equation can be presented in the following general form:
where:
lnYi,t = β0 + βi lnXi,t + εt
Yi—dependent variable, income inequalities of farmers, as captured by the Gini coefficient (Y_Gini), or the concentration index for the income of a family farm (with budget subsidies) (C_FFI post-support);
Xi—a set of explanatory variables, which include concentration indices for labor resources, land, and capital, as well as budget expenditure on agriculture: X1_BE—total agricultural budget expenditures in constant prices (prices from 2016) in PLN billion; X2_RS—agricultural income subsidy rate, determined as a share of subsidies (direct payments and other payments supporting current farmers’ income, excluding the Agricultural Social Insurance Fund (KRUS) a national institution of government administration responsible for the servicing of social insurance for farmers) subsidies and investment subsidies) in gross disposable income in the sector of individual holdings in agriculture (in %);
β0, βi—slope of the regression equation, ε—random component, t—time.
All variables were transformed into a natural logarithm in order to improve their distribution (in terms of normal distribution). Moreover, it allowed the interpretation of the obtained regression coefficient as the coefficient of elasticity.
According to Engle and Granger, there is a long-term dependence (co-integration) among the variables (time series) if the individual explanatory variables and the dependent variable are integrated at a degree of d (d = 0, 1, 2, …, d), but their combination ε is integrated at a degree of d–b (where b is a positive number). For integrated variables of order 1 I (1)—this means that when the random component is stationary—the ordinary least squares (OLS) estimator is consistent, and there is a long-term relationship between the variables, which has its origin in complex economic processes [54,55]. This is also true for a model with more explanatory variables [55].
Although the described research methods allowed for the identification of the existence of cause–effect relationships between individual variables, they did not provide an exhaustive answer on the mechanisms that guided these relationships. The methods used, however, were sufficient to verify the research hypotheses that related to establishing the impact of budgetary expenditure and the concentration of agricultural production factors on the distribution of income within the sector.
The time scope of the research, in principle, covered the years 2004–2018—i.e., the period in which agriculture in Poland received income support under CAP instruments, especially direct payments. In the case of the data concerning the level of agricultural income and its differentiation, the figures for 2003—i.e., the year preceding Poland’s accession to the EU—were used as a reference point for the period under analysis.
The source of data on disposable income in various types of households in Poland was the cyclical survey of the Central Statistical Office (CSO) entitled “Household Budgets” from the years 2004 to 2018. The Farm Accountancy Data Network (FADN) data were used to describe the differences in income among family farms and the level of concentration of production factors in agriculture. Eurostat data from the Economic Accounts for Agriculture (EAA) and CSO data from agricultural statistical yearbooks from the years 2004–2019 were also used. The Polish Ministry of Agriculture and Rural Development provided data on agricultural budget expenditure.
4.2. Data
The analysis of household budgets in Poland in 2018 [50] showed that disposable income per person in farmer households was 146.8% higher in real terms than in 2003 (the consumer price index (CPI) was used as a deflator). At the same time, total household income increased by 84.4% in real terms, while employee household income increased by 72.8% in real terms. The average annual real income growth rate for farmers in the years 2004–2018 amounted to 6.8%, for total households to 4.2%, and for employee households to 3.7%. The income gap between farmers’ incomes in 2018 and those of employees was 7.3 p.p., while in 2003 it was 35.1 p.p. These results indicated a significant redistributive effect of agricultural policy in cross-sectoral terms. The improvement of farmers’ income parity resulted from an increase in budget expenditure on agriculture and an increase in productivity of production factors in agriculture, which, to some extent, was also due to budget transfers supporting investments in agricultural holdings [32].
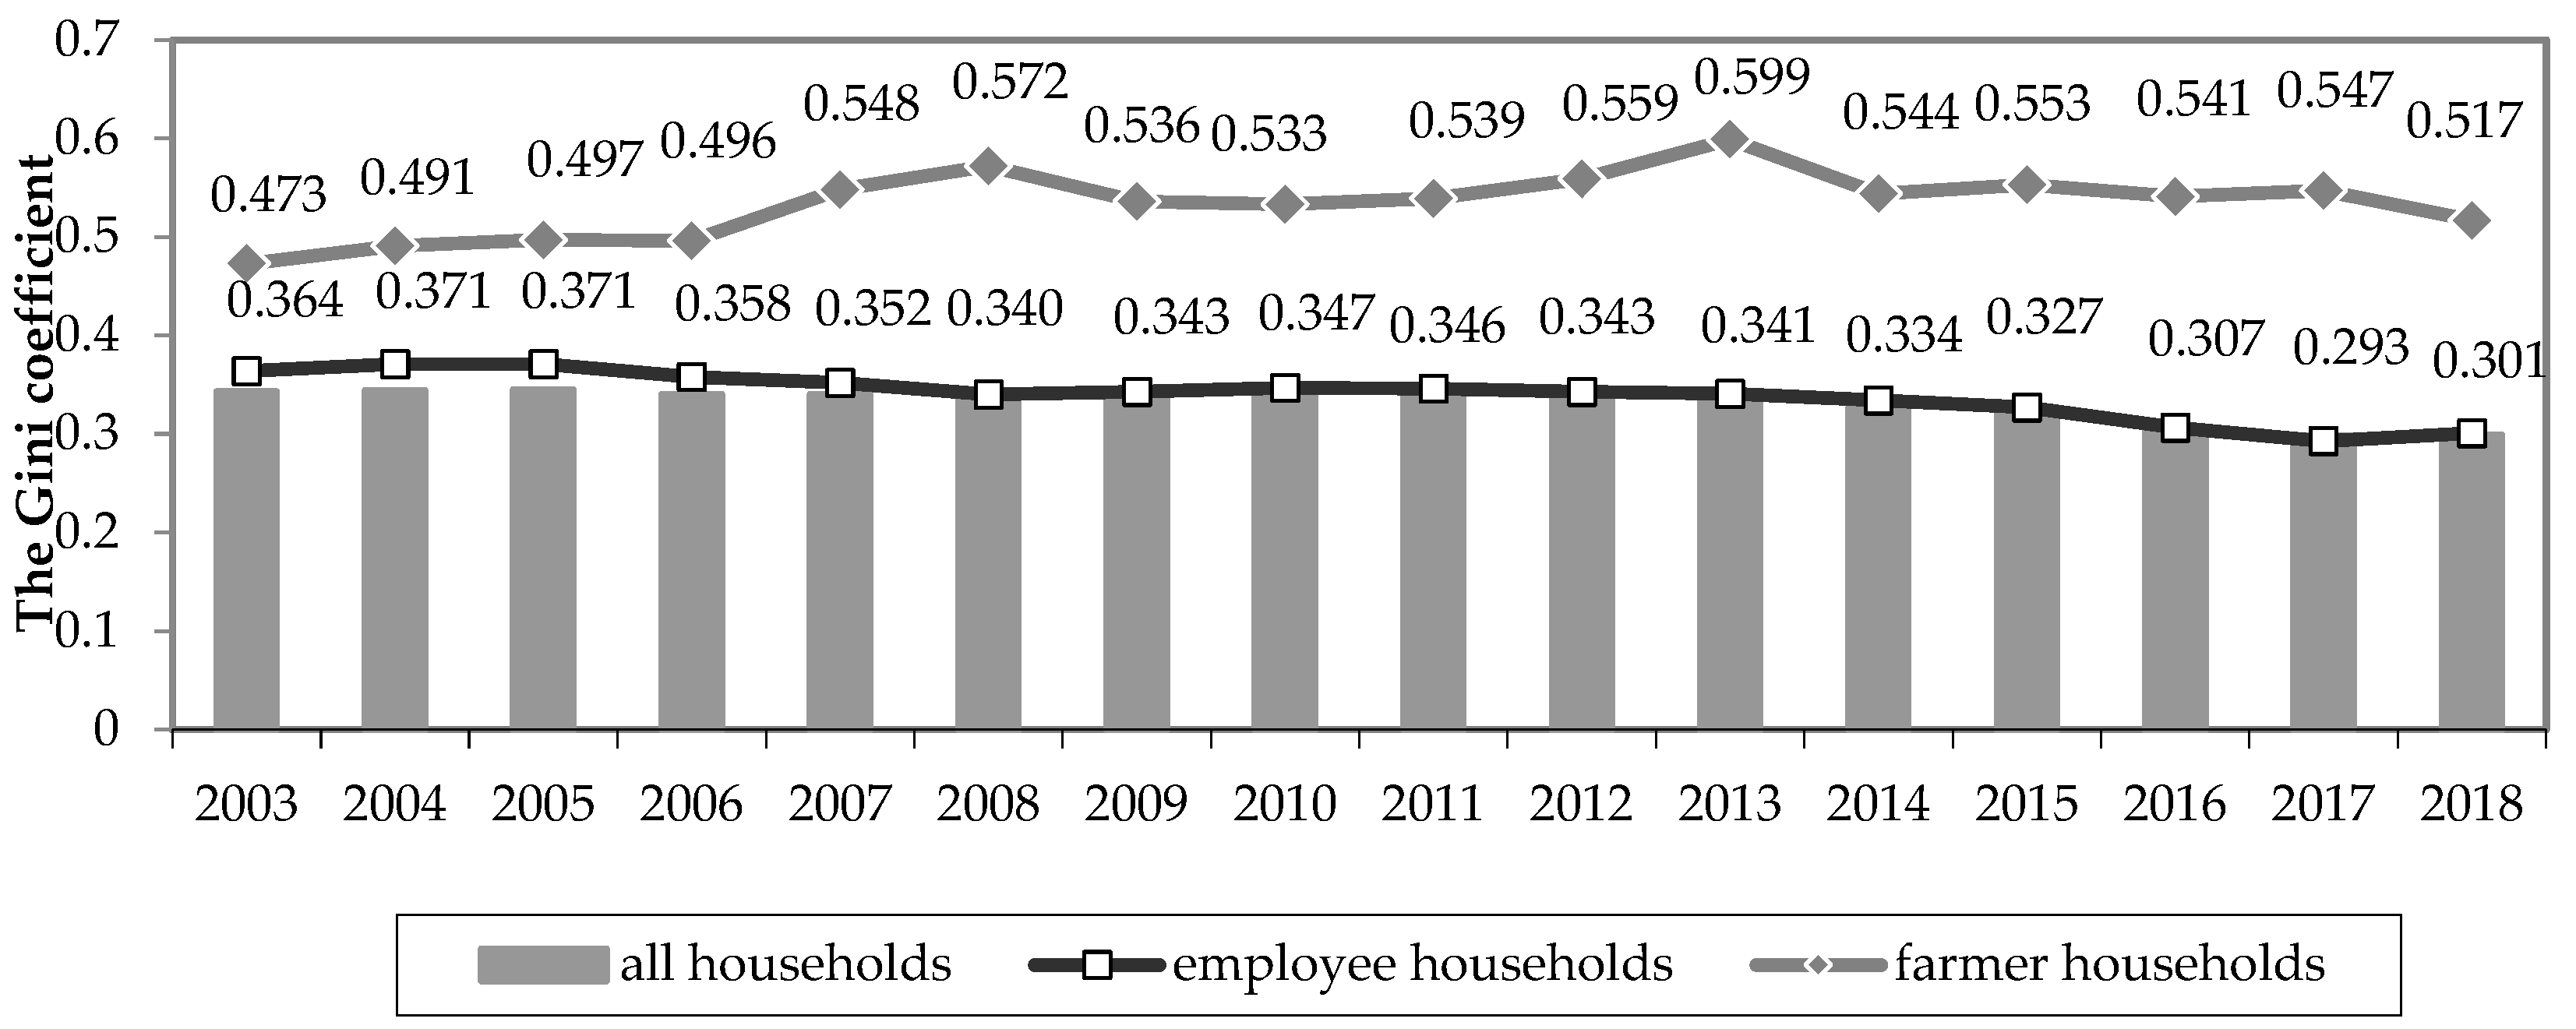
The redistributive effects of the increase in public spending on agriculture in 2004–2018 were not visible in relation to the intra-sectoral differences in farmers’ incomes (Figure 1). The Gini coefficient for disposable income per capita indicated that, compared to total households and employees’ households, the differences in the income of farmers’ households was much greater. This does not come as a surprise, given that the dominant source of income for farming families is the agricultural holding. It is known that agricultural holdings are very diverse in terms of production potential (e.g., size of agricultural land), structure, scale of production, etc.
The important question for the sustainable development of agriculture is whether the income gap is decreasing over time and whether the trend in the Gini coefficient is similar to that of all households. In the group of employees’ households and total households, the income disparity in the years 2004–2018 showed a permanent downward trend (Figure 1). In the case of farmers’ households, we observed an increase in the Gini coefficient in the years 2003–2008, while in subsequent years, the coefficient was in the range of 0.533–0.559, with a one-off upward deviation in 2013 (to 0.599) and a downward deviation in 2018 (0.517).
The level of income inequality in farmers’ households was high in both absolute and relative terms (Figure 1). Farmers are the most diverse socio-economic group in terms of income. In the years 2006–2014, about 26%–28% of farmers’ households were at risk of poverty, while about 7%–10% of households achieved income above the wealth limit [56]. Both indicators—poverty and wealth—for farmers were significantly higher in comparison with the total number of households in Poland.
Information on the disparities in farmers’ incomes obtained only from agricultural activity by different types of agricultural holdings was provided by FADN. These data are of a microeconomic nature and are representative of about 730,000 commercial farms, responsible for about 90% of agricultural production. The subject of the study was the family farm income (FFI), which is the remuneration for work in the farm and for the production assets involved, including land [57]. Family farm income (FFI) per full-time employee (AWU) was analyzed in two variants: i.e., without support (FFI pre-support) and with budget subsidies (FFI post-support).
The FADN data indicated large income inequality in Polish agriculture. The income disparity was large in terms of the agricultural type of holdings and very large in terms of the economic size of holdings, expressed as a standard gross margin (Table 1).
In the analysis of the income disparities among farms, FFI was included as an average over three years in order to reduce the impact of income fluctuations resulting from natural and climatic factors. The research showed that:
- (1)
- Income disparities were clearly greater for FFI pre-support than for FFI post-support. This conclusion is identical to the results of Juszczyk, Gołasa, and Wysokiński [49], who demonstrated that financial transfers resulting from the implementation of the CAP not only increase farm income in Poland, but also have a mitigating effect on disparities in this respect.
- (2)
- For most types of agricultural holdings (with the exception of field crops, horticultural crops, and mixed crops), a tendency of increased income disparity in relation to average income (especially FFI pre-support) could be observed between 2004 and 2016. The intra-sectoral agricultural income disparity decreased only in 2016–2018. In terms of the economic size of farms, throughout the whole period in question, the income disparity was large (as evidenced by income range R), while in the final period (2016–2018), it was very large. As in the case of agricultural types, the pre-support income disparity was much greater than in the case of income plus subsidies. Budget transfers, therefore, mitigated income inequalities for farms.
- (3)
- Economic size, and, thus, also the strongly correlated size of the holding, had a greater impact on income disparities than agricultural type—i.e., the dominant orientation and structure of agricultural production. This leads to the conclusion that, in order to mitigate excessive income disparities, it is necessary to use instruments that are not only separated from the scale of production, such as decoupled payments, but also separated from the size of the holding or are degressive in relation to the size of the holding.
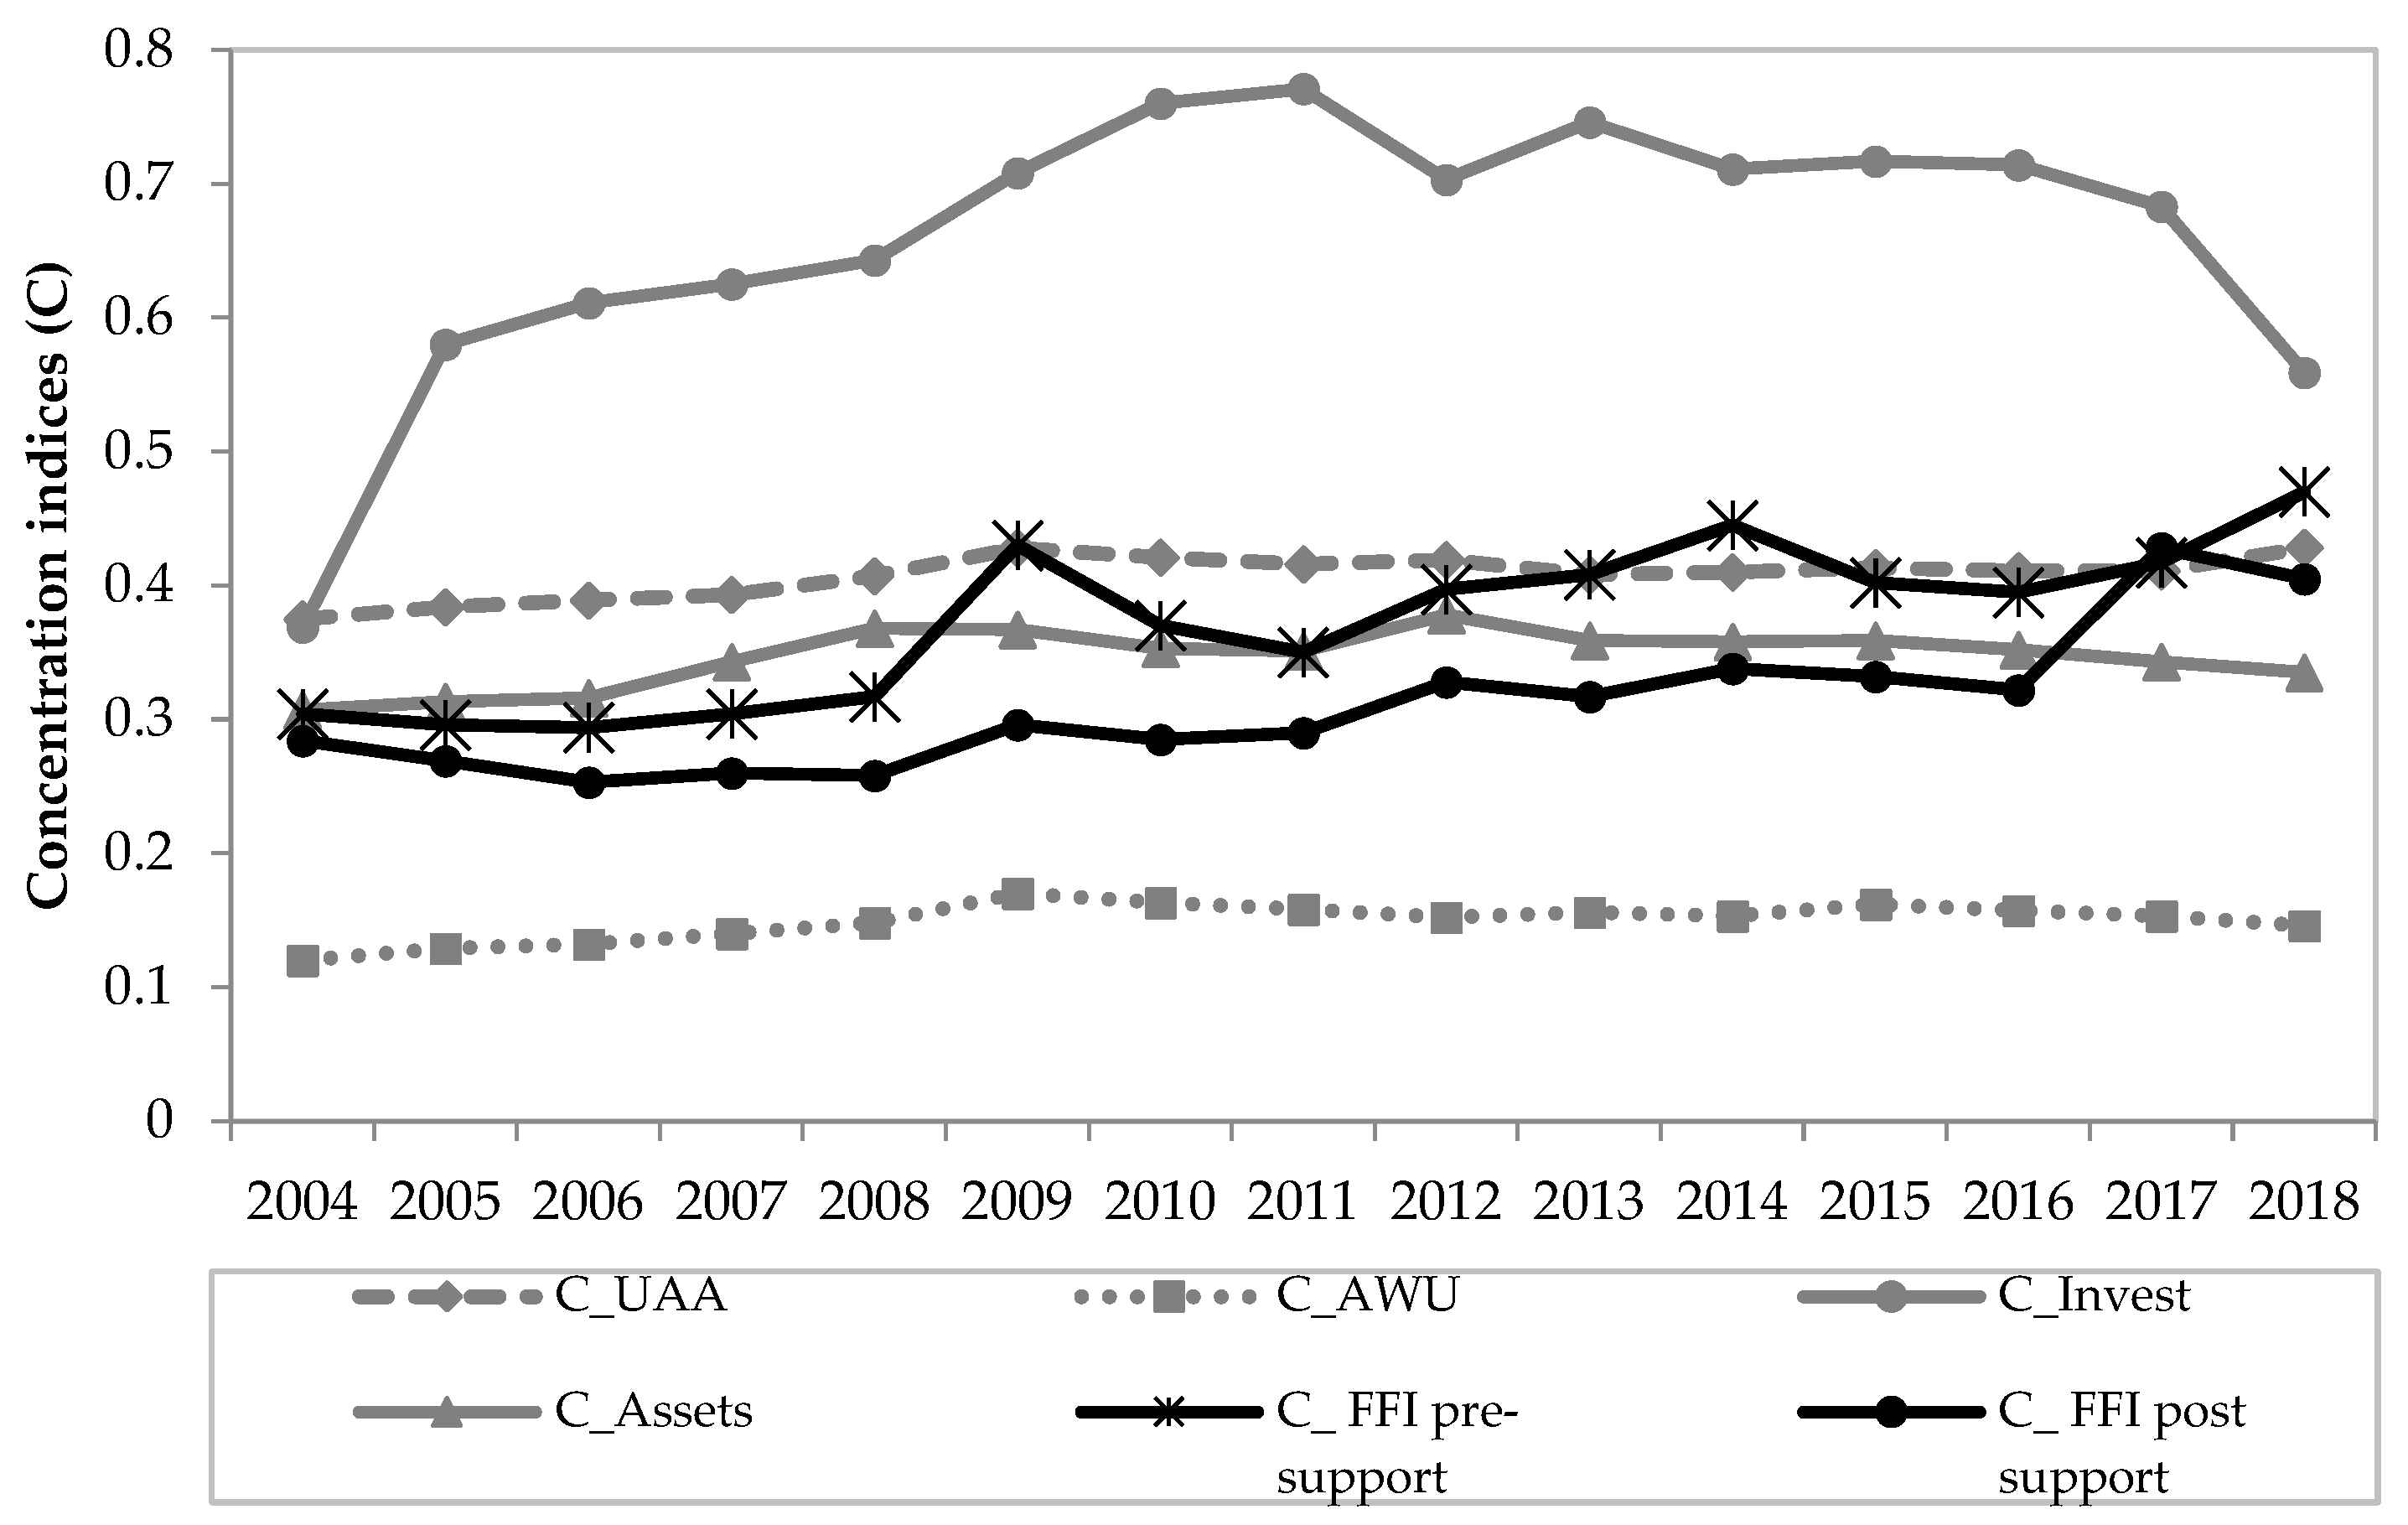
In Polish agriculture, in the years 2004–2018, the processes of labor, land, and capital concentration evolved (Figure 2). For all production factors, the concentration indices C showed higher values in 2018, as compared to 2004. The (relatively) largest concentration concerned the gross investment volume in agricultural holdings (C_Invest). The observed polarization in terms of investment outlays indicated the division into farms that invested and modernized their machinery and other assets, and, thus, strengthened their production potential, and farms that were not able to ensure the production of fixed assets in order to address wear and tear. As a result, there was also a trend towards the polarization of the value of fixed assets of households (C_Assets), although the concentration of assets was still lower than gross investment (Figure 2).
Between 2004 and 2018, land concentration (C_UAA) also evolved. This process, however, showed a relatively slower but sustained trend. As a result, the distribution of land was moderate and much more “egalitarian” than the distribution of gross investment. In Poland, the most “dispersed” resources were still labor resources (C_AWU), although the process of concentration could also be seen in relation to this production factor (mainly in the years 2004–2009).
The concentration of labor was clearly lower than the concentration of land, which may indicate a certain structural mismatch in Polish agriculture, hindering its productivity. It can also be concluded that there was still an excess of labor resources in small farms, while large farms suffered from a shortage of labor resources. This asymmetry was mitigated by capital expenditure, which was mainly concentrated in medium and large farms. From the point of view of agricultural sustainability, it would be desirable for land and labor concentration to be relatively symmetrical, and for the substitution of labor and land by capital expenditure to be effective not only economically, but also in terms of eco-efficiency.
The concentration index was also estimated for the distribution of the income of a family farm per full-time worker (Figure 2). The results of the research confirmed the previously demonstrated tendency of increasing intra-sectoral income disparities in agriculture. It was also confirmed that incomes without subsidies transferred from the state budget (FFI pre-support) showed clearly greater inequality than incomes with subsidies (FFI post-support). The lower values of the concentration index for FFI post-support compared to the values of the concentration indices for land and capital expenditure proved the effectiveness of the redistributive function of public spending on agriculture. Economically strong, and, therefore, also very large and expansive farms, had a smaller share in agricultural income than in land resources and capital expenditure.
5. Results and Discussion
The correlation analysis showed that the concentration of resources was co-existent with the concentration of income (Table 2), but these relationships did not follow a single universal mechanism. The concentration of investment and fixed assets with a delay of at least one year was related to changes in the structure of income distribution (correlation coefficients between the examined variables in year t were not statistically significant).
The results of the augmented Dickey–Fuller (ADF) unit root test showed that the series considered were non-stationary but integrated at the first order (Table 3). Regarding the income concentration index (C_FFI post-support), Engle–Granger’s co-integration procedure indicated that a long-term dependence (co-integration) could only be observed for the land concentration index (C_UAA). In the case of income inequality captured by the Gini coefficient, all analyzed time series were co-integrated.
The results of the calculations (Table 4) indicated a long-term relationship between income concentration and farm area concentration (Est. 1). The concentration of agricultural land contributed to the intensification of income concentration processes, ceteris paribus. It can, therefore, be concluded that the key (primary) stimulus for income concentration was the concentration of agricultural land. Concentration processes in the area of fixed assets, in turn, contributed to the increase in sectoral income inequalities in agriculture, measured by the Gini coefficient (Est. 2, 4). It should also be borne in mind that the processes of concentration in terms of investment expenditure and fixed assets also affected the productivity of production factors, and through this channel, indirectly exacerbated the income gap between investing holdings and those unable to modernize and develop their production potential. The effects on income, however, will only be visible after a longer period of time.
The results of the calculations (Table 4) also indicated the presence of a co-integrated relationship between the Gini coefficient and agricultural budget expenditure, indicating the causality of both the total size of the agricultural budget (X1_BE) and the agricultural income subsidy rate (X2_RS) (Est. 3, 4). The increase in the total size of the agricultural budget contributed, ceteris paribus, to the increase in inequality in the distribution of agricultural income (measured by the Gini coefficient). By contrast, the increase in the rate of subsidized agricultural income after 2004, ceteris paribus, contributed to a more egalitarian distribution of income among farmers. The described variables explained the changes in the Gini coefficient for agricultural income in the years 2004–2018 by 50%.
Differences in the directions of the impact of budget expenditure X1_BE and X2_RS on income inequalities Y_Gini resulted from differences between these explanatory variables. Both variables describe budgetary expenditure, but they were characterized by different aspects of that expenditure. Variable X1_BE describes total agricultural budget expenditure (in constant prices). They covered all measures targeted at the agricultural sector, agricultural markets, and rural areas. These were both transfers in the form of subsidies supporting farmers’ incomes directly, as well as subsidies for investments in agricultural holdings and funds for various types of interventions related, for example, to drought in agriculture. These funds, apart from their redistribution function, also help achieve the objectives of the allocation and stabilization functions of fiscal policy in agriculture. Therefore, these funds are divided between agricultural holdings asymmetrically. Relatively larger amounts are provided to farms that are larger in size, but also economically stronger, and which produce agricultural products on a relatively larger scale, commercial farms, and farms which invest: hence, the positive impact of the X1_BE variable on income polarization.
In contrast, variable X2_RS, the agricultural subsidy rate, determined what percentage of disposable income of agricultural holdings was represented by subsidies feeding farmers’ income directly. Direct payments are the main element of these subsidies. They are paid per hectare of UAA (utilized agricultural area), but there are degressive mechanisms in the support system (mechanism of modulation and reduction of payments to no more than EUR 150,000, requirement of greener production, additional redistributive payment for farms of 3–30 ha of UAA, and lump sum payment for small farms). This causes the X2_RS variable to be negatively linked to the Gini coefficient: i.e., an increase in the subsidy rate reduces income inequality in agriculture. Although the sums of subsidies showed a high concentration in larger and economically stronger holdings (the Gini coefficient for the distribution of direct payments in Poland for 2017 was 0.64 [47]), the subsidy rate for agricultural income, expressing the percentage of subsidies in the disposable income of farms, showed a different distribution. The average subsidy rate for FADN farms was 73.3% [58] (the rate of subsidy was fixed for the holdings covered by the FADN accounts and was the ratio of the subsidies for operation and investment activities to the income from the family farm in %). This value is often higher for small and medium farms in terms of size and economic strength than in large and very large farms. For example, in 2016, the subsidy rate for farms in terms of economic strength was similar to the one adopted in this study; for very small farms it was 111.3%, for small farms 87.9%, for medium–small farms 76%, for medium–large farms 69.2%, and for large farms 52.3%.
6. Conclusions
The growing inequalities in the income of agricultural holdings are a consequence of, among others, the processes of the concentration of production factors, which are allocated to an increasingly smaller community of growing agricultural holdings. In addition, the ongoing concentration and development of large and competitive farms bring about a concentration of support (subsidies) under agricultural policy instruments. These processes are characteristic of EU agriculture, including Poland.
The inequality (concentration) of income distribution is natural for agriculture. Excessive income disparities, however, threaten the development of sustainable agriculture. A high level of income inequality is undesirable in the social context of agricultural sustainability, but can also have a significant negative impact on achieving and balancing economic and environmental order.
Research on agriculture in Poland proves that the processes of concentration of production factors are taking place and are interrelated. The concentration of capital expenditure and the concentration of land are relatively the fastest. The results of the research allowed for a positive verification of Hypothesis 1. It has been shown that the process of land concentration is directly and positively linked to the process of farm income polarization. The increase in income disparities in agriculture is also influenced by the process of capital concentration, expressed by the value of fixed assets.
The processes of concentration of production factors are a condition for the growth of the production potential, economic efficiency, and competitiveness of agriculture in Poland. This is due to the still relatively high fragmentation and dispersion of the sector’s production factors, and especially due to the fragmentation of the agrarian structure. The sustainable development of agriculture, however, requires that the concentration processes create an opportunity to preserve the dual model of agriculture, in which both large, economically strong family farms, and smaller farms that provide valuable public goods (biodiversity, rural landscape, vitality of the countryside, cultural assets, etc.) hold their own place. Concentration processes in agriculture should also not be faster than the increasing capacity of non-agricultural sectors to absorb the labor resources released from agriculture.
In view of the permanence and inevitability of the processes of the concentration of production factors in agriculture, a special role in mitigating the growing income disparities should be attributed to agricultural policy instruments, and, in particular, to budget expenditure.
In Poland, in the years 2004–2018, the process of the income polarization of agricultural households was progressing and was the largest in comparison to total households and employees’ households. This may indicate that one of the redistributive objectives of agricultural budget expenditure—namely, the reduction of intra-sectoral income disparities—is not being met. Nonetheless, the results of the research conducted for agricultural holdings observed by FADN showed that income differences in terms of agricultural types and economic size of farms are much greater for income without budget subsidies (before support) than for income after support. Furthermore, the agricultural subsidy rate has been shown to be negatively linked to the Gini coefficient for the disposable income of agricultural holdings. The results of the study did not confirm Hypothesis 2, as it is stated that budget support for agriculture reduces the polarization income of agricultural holdings, yet they lead to the conclusion that, although agricultural policy subsidies cannot reverse the trend towards the increased polarization of farm incomes, they have an impact on mitigating these inequalities.
The above analysis has some limitations, as it covers a relatively short period. In addition, while the study indicates the existence of cause-and-effect links between concentration processes in agriculture and budget expenditure directed towards agriculture and the distribution of income within this sector, they do not provide an exhaustive answer as far as the mechanisms that guide these relations are concerned. This aspect requires further research and in-depth analysis. This includes both taking into account other measures of income inequality or other variables influencing farmers’ income levels (e.g., factor productivity, quality of agricultural production space, and ability to manage farm resources) and the application of econometric methods considering the endogenous nature of variables and the two-way links between them. Such analysis, however, requires access to longer time series and more detailed data on agricultural holdings.
Author Contributions
Conceptualization, R.K. and M.W.; methodology, R.K. and M.W.; formal analysis, R.K. and M.W.; editing, R.K. and M.W. All authors have read and agreed to the published version of the manuscript.
Funding
This work has been supported by the funds of the Ministry of Science and Higher Education granted to the University of Rzeszow, Poland.
Conflicts of Interest
The authors declare no conflict of interest. The funders had no role in the design of the study, in the collection, analyses, or interpretation of data, in the writing of the manuscript, or in the decision to publish the results.
References
- European Commission. European Union Treaty of Amsterdam; European Commission: Amsterdam, The Netherlands, 1997; Available online: http://europa.eu/eu-law/decisionmaking/treaties/pdf/treaty_of_amsterdam/treaty_of_amsterdam_en.pdf (accessed on 27 April 2020).
- Asefa, S. Economics of Sustainable Development; Upjohn Institute for Employment Research: Kalamazoo, MI, USA, 2005. [Google Scholar]
- Board on Sustainable Development, Policy Division, National Research Council. Our Common Journey: A Transition Toward Sustainability; National Academies Press: Washington, DC, USA, 1999. [Google Scholar]
- Czyżewski, B.; Brelik, A. Sustainable development of agriculture–case of Poland. Rocz. Nauk. Stowarzyszenia Ekon. Rol. Agrobiz. 2014, XVI, 38–43. [Google Scholar]
- Green, L.M.; Espinal, L.; Traversa, E.; Amis, E.J. Materials for sustainable development. MRS Bull. 2012, 37, 303–309. Available online: https://0-www-cambridge-org.brum.beds.ac.uk/core/journals/mrs-bulletin/article/materials-for-sustainable-development/25F2E2D67C13CF99AEFC2EB2ED4405B0 (accessed on 18 April 2020). [CrossRef] [Green Version]
- Wrzaszcz, W.; St. Zegar, J. Challenges for Sustainable Development of Agricultural Holdings. Econ. Environ. Stud. 2016, 16, 377–402. [Google Scholar]
- Prus, P. The role of higher education in promoting sustainable agriculture. Corporate Social Responsibility and Business Ethics in the Central and Eastern Europe. Nomos Verl. Mbh Co. Kg. J. East Eur. Manag. Stud. (JEEMS) 2019, Special Issue, 99–119. [Google Scholar]
- Kociszewski, K. Ekologiczne aspekty zmian Wspólnej Polityki Rolnej a zrównoważony rozwój polskiego rolnictwa. In Z Badań Nad Rolnictwem Społecznie Zrównoważonym, 23; Monografie Programu Wieloletniego 100; St. Zegar, J., Ed.; IERiGŻ-PIB: Warszawa, Poland, 2014; pp. 124–157. [Google Scholar]
- Krzyżanowski, J. Wpływ WPR 2014–2020 na zrównoważenie polskiego rolnictwa w świetle dotychczasowych badań i bieżących dokumentów. In Z Badań Nad Rolnictwem Społecznie Zrównoważonym, 31; Monografie Programu Wieloletniego 6; St. Zegar, J., Ed.; IERiGŻ-PIB: Warszawa, Poland, 2015; pp. 89–115. [Google Scholar]
- European Commission. Communication from the Commission to the Council and the European Parliament on the Mid-Term Review of the Common Agricultural Policy; COM(2002) 394 Final; European Commission: Brussels, Belgium, 2002; Available online: https://eur-lex.europa.eu/legal-content/EN/TXT/PDF/?uri=CELEX:52002DC0394&from=EN (accessed on 27 April 2020).
- Mishra, A.K.; El-Osta, H.S.; Morehart, M.J.; Johnson, J.D.; Hopkins, J.W. Income, Wealth, and the Economic Well-being of Farm Households; ERS, AER-812; U.S. Dep. of Agric.: Washington, DC, USA, July 2002.
- Xue, J. Urban-rural income disparity and its significance in China. Hitotsubashi J. Econ. 1997, 38, 45–59. Available online: https://www.ers.usda.gov/webdocs/publications/41451/31370_aer812.pdf?v=2880.1 (accessed on 20 April 2020).
- Klimkowski, C.; Rembisz, W. Kwestie stabilizacji dochodów w rolnictwie. Rocz. Nauk. Ekon. Rol. Rozw. Obsz. Wiej. 2014, 101, 85–96. [Google Scholar]
- Czyżewski, A.; Kata, R.; Matuszczak, A. Stabilizacyjne efekty krajowych i unijnych wydatków budżetowych na rolnictwo w Polsce—Identyfikacja przesłanek. Ekon. Organ. Gospod. Żywnościowej 2019, 125, 17–32. [Google Scholar] [CrossRef] [Green Version]
- Hansen, H.; Teuber, R. Assessing the impacts of EU’s common agricultural policy on regional convergence: Sub-national evidence from Germany. Appl. Econ. 2010, 43, 3755–3765. [Google Scholar] [CrossRef]
- Poczta, W. Instrumenty wsparcia ekonomicznego dla rodzinnych gospodarstw rolnych w polityce strukturalnej UE i w ramach interwencjonizmu państwowego oraz rola i znaczenie tych instrumentów. In Ekonomiczne I Prawne Mechanizmy Wspierania I Ochrony Rolnictwa Rodzinnego; Podstawka, M., Ed.; KSOW: Warszawa, Poland, 2015; pp. 142–159. [Google Scholar]
- Poon, K.; Weersink, A. Factors affecting variability in farm and off-farm income. Agric. Financ. Rev. 2011, 71, 379–397. [Google Scholar] [CrossRef] [Green Version]
- Severini, S.; Tantari, A. The Effect of the EU Farm Payments Policy and its Recent Reform on Farm Income Inequality. J. Polic. Model. 2013, 35, 212–227. [Google Scholar] [CrossRef]
- Severini, S.; Tommaso, G.; Finger, R. Effects of the Income Stabilization Tool on farm income level, variability and concentration in Italian agriculture. Agric. Food Econ. 2019, 7, 1–23. [Google Scholar] [CrossRef]
- Bojnec, S.; Fertö, I. Farm household income inequality in Slovenia. Span. J. Agric. Res. 2019, 17, 1–12. [Google Scholar] [CrossRef]
- Gardner, B.L. Determinants of farm family income inequality. Am. J. Agric. Econ. 1969, 51, 753–769. [Google Scholar] [CrossRef]
- Mishra, A.K.; El-Osta, H.S.; Gillespie, J.M. Effect on agricultural policy on regional income inequality among farm households. J. Policy Modeling 2009, 31, 325–340. [Google Scholar] [CrossRef]
- Allanson, P. The Redistributive Effects of Agricultural Policy on Scottish Farm Incomes. J. Agric. Econ. 2006, 51, 117–128. [Google Scholar] [CrossRef]
- Allanson, P. On the Characterisation and Measurement of the Redistributive Effect of Agricultural Policy. J. Agric. Econ. 2007, 59, 169–187. [Google Scholar] [CrossRef]
- Czyżewski, A.; Kata, R.; Matuszczak, A. The redistribution function in Poland’s agricultural budgets in the long term. ACTA Sci. Pol. Oeconomia 2019, 18, 25–35. [Google Scholar] [CrossRef]
- Moreddu, C. Distribution of Support and Income in Agriculture. OECD Food Agric. Fish. Work. Pap. 2011, 46, 108. [Google Scholar]
- Severini, S.; Tantari, A. The impact of agricultural policy on farm income concentration: The case of regional implementation of the CAP direct payments in Italy. Agric. Econ. 2013, 44, 275–286. [Google Scholar] [CrossRef]
- Sinabell, F.; Schmid, E.; Hofreither, M.F. Exploring the distribution of direct payments of the Common Agricultural Policy. Empirica 2013, 40, 325–341. [Google Scholar] [CrossRef] [Green Version]
- Zawisza, S.; Prus, P.; Beben, S. Development of Agricultural Farms in Terms of Common Agricultural Policy Support in the Opinion of Farmers. In Proceedings of the 20th International Scientific Conference “Economic Science for Rural Development 2019”, Jelgava, Latvia, 9–10 May 2019; pp. 264–271. [Google Scholar] [CrossRef]
- Kryszak, Ł. Nierówności dochodowe w rolnictwie krajów Unii Europejskiej w kontekście koncepcji zrównoważonego rozwoju. Rocz. Nauk. Stowarzyszenia Ekon. Rol. Agrobiz. 2016, 18, 166–171. [Google Scholar]
- Matuszczak, A. Zróżnicowanie Rozwoju Rolnictwa W Regionach Unii Europejskiej W Aspekcie Jego Zrównoważenia; PWN: Warszawa, Poland, 2013. [Google Scholar]
- Kata, R. Agricultural Productivity in Poland in the Context of Structural Changes in the Sector in 2002–2016. In Proceedings of the 2018 International Scientific Conference Economic Sciences for Agribusiness and Rural Economy, Warsaw, Poland, 7–8 June 2018; Volume 2, pp. 109–115. [Google Scholar]
- Raczkowska, M.; Wrzesińska-Kowal, J. Nierówności i ubótwo ekonomiczne na obszarach wiejskich w Polsce. Rocz. Nauk. Ekon. Rol. Rozw. Obsz. Wiej. 2018, 105, 7–17. [Google Scholar]
- Happe, K. Structural Change in Agricultural. In Conceptual Framework for Analysing Structural Change in Agriculture and Rural Livelihoods; IAMO Discussion Paper; Leibniz Institute of Agricultural Development in Transition Economies (IAMO): Halle, Germany, 2007; Volume 113, pp. 5–13. [Google Scholar]
- NRC. Toward Sustainable Agricultural System in the 21st Century; National Research Council, National Academies Press: Washington, DC, USA, 2010. [Google Scholar]
- St. Zegar, J. Kwestia Agrarna w Polsce; IERiGŻ-PIB: Warszawa, Poland, 2018. [Google Scholar]
- Wrzaszcz, W. Zrównoważenie indywidualnych gospodarstw rolnych w Polsce objętych FADN. Zagadnienia Ekon. Rolnej 2013, 1, 73–90. [Google Scholar]
- Staniszewski, J.; Czyżewski, A. Rolnictwo Unii Europejskiej W Procesie Zrównoważonej Intensyfikacji; PWN: Warszawa, Poland, 2019. [Google Scholar]
- St. Zegar, J. Kwestia agrarna w niepodległej Rzeczypospolitej—Aspekt ekonomiczny. Nierówności Społeczne Wzrost Gospod. (Soc. Inequalities Econ. Growth) 2019, 59, 83–94. [Google Scholar] [CrossRef]
- St. Zegar, J. Struktura Polskiego Rolnictwa Rodzinnego Pod Koniec Pierwszej Dekady Xxi Wieku; IERiGŻ-PIB: Warszawa, Poland, 2009. [Google Scholar]
- Deininger, K.; Nizalov, D.; Singh, S.K. Are Mega-farms the Future of Global Agriculture? Exploring the Farm Size Productivity Relationship for Large Commercial Farms in Ukraine. Kyiv Sch. Econ. Kyiv Econ. Inst. Work. Pap. Ser. 2013, 49, 1–57. [Google Scholar]
- Buckwell, A. (Ed.) Sustainable Intensification of European Agriculture; Foundation for Rural Investment Support for Europe: Brussels, Belgium, 2014. [Google Scholar]
- Staniszewski, J. Zrównoważona intensyfikacja rolnictwa w państwach Unii Europejskiej o zróżnicowanej strukturze agrarnej. Rocz. Nauk. Stowarzyszenia Ekon. Rol. Agrobiz. 2016, XVII, 238–243. [Google Scholar]
- Wigier, M. Model rozwoju rolnictwa polskiego w świetle efektów realizacji WPR. Zagadnienia Ekon. Rolnej 2013, 1, 22–41. [Google Scholar] [CrossRef]
- Gulati, A.; Narayanan, S. The Subsidy Syndrom in Indian Agriculture; Oxford University Press: New Delhi, India, 2003. [Google Scholar]
- Kułyk, P. Finansowe Wsparcie Rolnictwa W Krajach O Różnym Poziomie Rozwoju Gospodarczego; Wyd. Uniwersytetu Ekonomicznego w Poznaniu: Poznań, Poland, 2013. [Google Scholar]
- Wąs, A.; Kobus, P. Implikacje Mechanizmu Degresywności Płatności Bezpośrednich W Wpr 2020+ W Polsce. In Subsydia a Ekonomika, Finanse I Dochody Gospodarstw Rolniczych, 4; Soliwoda, M., Ed.; IERiGŻ-PIB: Warszawa, Poland, 2018; pp. 58–88. [Google Scholar]
- Ciaian, P.; Swinnen, J. Credit Market Imperfections and the Distribution of Policy Rents. Am. J. Agric. Econ. 2009, 91, 1124–1139. [Google Scholar] [CrossRef] [Green Version]
- Juszczyk, S.; Gołasa, P.; Wysokiński, M. Redystrybucyjna rola Wspólnej Polityki Rolnej Unii Europejskiej—Przesłanki teoretyczne i rezultaty. Ekonomista 2016, 5, 704–726. [Google Scholar]
- CSO. Household Budget Survey in 2006 and Next Until 2018; Central Statistical Office: Warsaw, Poland, 2006–2019. [Google Scholar]
- Panek, T. Ubóstwo i nierówności: Dylematy pomiaru. In Warunki I Jakość życia Polaków; Czapiński, J., Panek, T., Eds.; Rada Monitoringu Społecznego: Warszawa, Poland, 2009; pp. 310–319. [Google Scholar]
- Panek, T. Ubóstwo, Wykluczenie Społeczne I Nierówności. Teoria I Praktyka Pomiaru; Oficyna Wydawnicza SGH: Warszawa, Poland, 2011. [Google Scholar]
- O’Donnell, O.; O’Neill, S.; Van Ourti, T.; Walsh, B. Estimation of concentration indices. Stata J. 2016, 16, 112–138. [Google Scholar] [CrossRef] [Green Version]
- Lopez, S.; Weber, S. Testing for Granger causality in panel data. Stata J. 2017, 17, 972–984. [Google Scholar] [CrossRef] [Green Version]
- Majsterek, M. Modelowanie systemów skointegrowanych. Aspekty teoretyczne. Bank Kredyt 2014, 45, 433–466. [Google Scholar]
- Jędrzejczak, A.; Pekasiewicz, D. Nierówności dochodowe gospodarstw domowych rolników na tle innych grup społeczno-ekonomicznych w Polsce w latach 2006–2014. Probl. Rol. Światowego 2017, 17, 166–176. [Google Scholar] [CrossRef]
- Chmielewska, B. Zmiany zróżnicowania dochodów rolniczych w państwach członkowskich Unii Europejskiej. Zagadnienia Ekon. Rolnej 2018, 2, 61–75. [Google Scholar] [CrossRef]
- Kulawik, J.; Płonka, R.; Osuch, D. Subsydia a finanse i ekonomika gospodarstw osób fizycznych. In Subsydia a Ekonomika, Finanse I Dochody Gospodarstw Rolniczych, 4; Soliwoda, M., Ed.; IERiGŻ-PIB: Warszawa, Poland, 2018; pp. 106–135. [Google Scholar]
Figure 1.
Differences in disposable income per capita measured by the Gini coefficient in Poland in 2003–2018 for selected groups of households. Source: own study based on [50].
Figure 1.
Differences in disposable income per capita measured by the Gini coefficient in Poland in 2003–2018 for selected groups of households. Source: own study based on [50].

Figure 2.
Concentration indices (C) for production factors and income from a family agricultural holding. Source: own study.
Figure 2.
Concentration indices (C) for production factors and income from a family agricultural holding. Source: own study.


Table 1.
Family farm income disparities per full-time employee (AWU) before support (family farm income (FFI) pre-support) and after support (FFI post-support) by agricultural type and economic size of holdings.
Table 1.
Family farm income disparities per full-time employee (AWU) before support (family farm income (FFI) pre-support) and after support (FFI post-support) by agricultural type and economic size of holdings.
| Specification | Average Income of a Family Farm Per AWU in Relation to the Average for FADN Farms (in %)—Average for FADN Farms = 100 | |||||
|---|---|---|---|---|---|---|
| 2004–2006 | 2010–2012 | 2016–2018 | ||||
| FFI Pre-Support | FFI Post-Support | FFI Pre-Support | FFI Post-Support | FFI Pre-Support | FFI Post-Support | |
| A. Types of farming | ||||||
| Field crops | 103.9 | 132.9 | 90.9 | 120.6 | 14.3 | 82.3 |
| Horticult. crops | 185.7 | 112.9 | 170.1 | 83.8 | 94.0 | 82.8 |
| Permanent crops | 107.8 | 72.4 | 144.1 | 83.7 | 28.7 | 47.3 |
| Dairy cattle | 146.9 | 129.3 | 165.0 | 131.7 | 89.7 | 143.5 |
| Herbivores | 16.6 | 55.0 | −11.7 | 62.4 | −23.6 | 53.9 |
| Granivores | 204.1 | 164.9 | 356.2 | 223.3 | 87.6 | 132.1 |
| Mixed crops | 56.7 | 73.3 | 37.6 | 67.2 | −7.9 | 49.5 |
| R | 1.88 | 1.10 | 3.68 | 1.61 | 1.18 | 0.96 |
| V (%) 1 | 67.3 | 40.0 | 118.4 | 56.1 | 49.6 | 39.4 |
| B. Farm Size by Standard Output (SO) in Thousands of euros/farm | ||||||
| 2 ≤ € <8 | 11.8 | 24.3 | 12.6 | 60.1 | −29.7 | 30.5 |
| 8 ≤ € <25 | 34.8 | 47.8 | 7.7 | 26.3 | 41.5 | 75.1 |
| 25 ≤ € < 50 | 89.9 | 102.5 | 23.8 | 42.8 | 252.3 | 164.5 |
| 50 ≤ € < 100 | 139.4 | 151.7 | 74.7 | 87.8 | 504.7 | 263.0 |
| 100 ≤ € < 500 | 161.9 | 175.2 | 134.0 | 143.8 | 746.3 | 358.5 |
| € ≥ 500 | 86.6 | 124.8 | 179.2 | 187.9 | −368.1 | 54.6 |
| R | 1.73 | 1.21 | 1.26 | 1.17 | 11.1 | 3.28 |
| V (%) 1 | 58.1 | 57.9 | 52.1 | 42.7 | 398.6 | 130.5 |
1 Coefficient of variation: low variation—V < 50%; moderate variation—50% < V < 100%; high variation—V > 100%. Source: Farm Accountancy Data Network (FADN) data for 2004–2018.
Table 2.
Correlation analysis of the variables describing the concentration of production factors and FFI post-support.
Table 2.
Correlation analysis of the variables describing the concentration of production factors and FFI post-support.
| Variable | C_FFI Post-Support | C_UAA | C_AWU | C-Assetst (C_Assetst-1) | C_Investt (C_Investt-1) |
|---|---|---|---|---|---|
| C_FFI post-support | 1.00 | 0.766 | 0.703 | 0.491 (0.750) | 0.437 (0.599) |
| C_UAA | - | 1.00 | 0.874 | 0.683 | 0.620 |
| C_AWU | - | - | 1.00 | 0.813 | 0.850 |
| C-Assets | - | - | - | 1.00 | 0.656 |
| C_Invest | - | - | - | - | 1.00 |
Note: correlation is significant at the 0.05 level. Insignificant correlations are reported in italics. Source: own study.
Table 3.
Results of the augmented Dickey–Fuller (ADF) unit root tests (p-value).
| Variable | Y_Gini | C_FFI Post | C_UAA | C_AWU | C_Assets | C_Invest | X1_BE | X2_RS |
|---|---|---|---|---|---|---|---|---|
| Level | 0.112 | 0.092 | 0.599 | 0.843 | 0.923 | 0.247 | 0.052 | 0.08 |
| First diff. | 0.001 | 0.0001 | 0.019 | 0.005 | 0.009 | 0.0001 | 0.004 | 0.003 |
| Engle–Granger residual test of co-integration | ||||||||
| Y_Gini | 0.013 | 0.004 | 0.001 | 0.0001 | 0.003 | 0.004 | ||
| C_FFI post-support | 0.020 | 0.112 | 0.267 | 0.116 | 0.117 | 0.07 | ||
Source: own study.
Table 4.
The relationship between income inequality, the concentration of resources in agriculture, and budget expenditure (estimation results of Equation (3)).
Table 4.
The relationship between income inequality, the concentration of resources in agriculture, and budget expenditure (estimation results of Equation (3)).
| Estimation | 1 | 2 | 3 | 4a |
|---|---|---|---|---|
| lnC_FFI | lnY_Gini | lnY_Gini | lnY_Gini | |
| const. | −0.303 (0.186) | −0.135 (0.211) | −3.283 *** (0.311) | −2.223 * (1.101) |
| lnC_UAA | 1.953 *** (0.455) | −0.483 (0.430) | - | −0.431 (0.311) |
| lnC_AWU | - | 0.086 (0.201) | - | −0.028 (0.171) |
| lnC_Assets | - | 0.707 *** (0.140) | - | 0.510 *** (0.117) |
| lnX1_BE | - | - | 0.293 *** (0.025) | 0.183 ** (0.058) |
| lnX2_RS | - | - | −0.129 ** (0.059) | −0.070 (0.089) |
| Adj. R2 | 0.554 | 0.514 | 0.491 | 0.526 |
| F-test (p-value) | 0.001 | 0.001 | 0.001 | 0.00001 |
| Postestimation tests for residuals (p-value) | ||||
| AR(1) | 0.154 | 0.923 | 0.539 | 0.901 |
| Heterosc. (White’a) | 0.443 | 0.679 | 0.751 | 0.797 |
| Normality (Jarque-Bera) | 0.204 | 0.332 | 0.060 | 0.05 |
| ADF | 0.020 | 0.001 | 0.008 | 0.001 |
Note: statistical significance: * p < 0.10, ** p < 0.05, *** p < 0.01. OLS estimation. Robust standard errors in parentheses. Due to collinearity, the variable C_Invest was omitted in the regression equation. 4a p-value of partial F-test for significance of subset of production factors (lnC_UAA, lnC_AWU, lnC_Assets): p = 0.004. Source: own study on CSO data [9] and https://ec.europa.eu/agriculture/rica/database/report_en.
© 2020 by the authors. Licensee MDPI, Basel, Switzerland. This article is an open access article distributed under the terms and conditions of the Creative Commons Attribution (CC BY) license (http://creativecommons.org/licenses/by/4.0/).
Share and Cite
MDPI and ACS Style
Kata, R.; Wosiek, M. Inequality of Income in Agricultural Holdings in Poland in the Context of Sustainable Agricultural Development. Sustainability 2020, 12, 4963. https://0-doi-org.brum.beds.ac.uk/10.3390/su12124963
AMA Style
Kata R, Wosiek M. Inequality of Income in Agricultural Holdings in Poland in the Context of Sustainable Agricultural Development. Sustainability. 2020; 12(12):4963. https://0-doi-org.brum.beds.ac.uk/10.3390/su12124963
Chicago/Turabian StyleKata, Ryszard, and Małgorzata Wosiek. 2020. "Inequality of Income in Agricultural Holdings in Poland in the Context of Sustainable Agricultural Development" Sustainability 12, no. 12: 4963. https://0-doi-org.brum.beds.ac.uk/10.3390/su12124963
Note that from the first issue of 2016, this journal uses article numbers instead of page numbers. See further details here.