Article

Passenger Satisfaction Evaluation of Public Transportation Using Pythagorean Fuzzy MULTIMOORA Method under Large Group Environment

1
The Key Laboratory of Road and Traffic Engineering of Ministry of Education, Tongji University, Shanghai 200092, China
2
School of Transportation Engineering, Tongji University, Shanghai 201804, China
3
School of Management, Shanghai University, Shanghai 200444, China
4
College of Economics and Management, China Jiliang University, Hangzhou 310018, China
5
School of Economics and Management, Tongji University, Shanghai 200092, China
*
Author to whom correspondence should be addressed.
Sustainability 2020, 12(12), 4996; https://0-doi-org.brum.beds.ac.uk/10.3390/su12124996
Submission received: 10 May 2020 / Revised: 11 June 2020 / Accepted: 16 June 2020 / Published: 18 June 2020

Abstract

:
Passenger satisfaction is an important factor that affects the choice of travel modes for municipalities, especially in big cities. This evaluation is an important task for managers when they are considering improving the competitiveness of the public transportation system. However, passenger satisfaction evaluation is difficult as the information provided by passengers is often vague, imprecise, and uncertain. This paper aims to propose a new method, using Pythagorean fuzzy sets and multi-objective optimization by a ratio analysis plus full multiplicative form method (MULTIMOORA), to evaluate the passenger satisfaction level of the public transportation system under large group environment. The former is employed to represent the satisfaction assessments of rail transit network provided by passengers. The latter is extended and used to determine the passenger satisfaction levels of rail transit lines. In addition, a combination weighting method is suggested to compute the relative weights of evaluation criteria. A case study of the rail transit network in Shanghai is provided to demonstrate the effectiveness of the proposed passenger satisfaction evaluation method. The result shows that the new method proposed in this study can not only model passengers’ satisfaction evaluation information with more uncertainties, but also determine more reasonable and credible satisfaction levels of rail transit lines.

1. Introduction

Due to the rapid economic development and the acceleration of urbanization, the vehicle population has been increasing dramatically in China [1]. This leads to a considerable increase in energy consumption, vehicle emission, traffic congestion, and air pollution [2]. In order to alleviate these problems, public transportation is often given a higher priority, especially in the big and crowded cities. It provides an efficient and environmentally friendly service to urban passengers and plays an important role in easing traffic pressure and reducing carbon emission from automobiles [3,4]. The service quality of the public transportation system is highly valued by the authorities and managers [5,6]. Since passenger satisfaction is an important factor that affects the usage of public transportation, it is critical and important to understand the passenger satisfaction of public transportation to meet passenger requirements and preferences [7]. Therefore, the passenger satisfaction evaluation for public transportation systems has attracted more and more attention from researchers in recent years [8,9,10,11].
In the practical satisfaction evaluation of a public transportation system, the judgments of passengers are often vague and uncertain in nature, due to the increasing complexity of the public transportation system and the variation of human perception. As a result, it is difficult for passengers to assign crisp values or fuzzy values for the satisfaction degree of each rail transit line. As an effective generalization of intuitionistic fuzzy sets (IFSs) [12], the concept of Pythagorean fuzzy sets (PFSs) was proposed by Yager and Abbasov [13] to cope with complex fuzzy information provided by decision-makers. The PFS considers both membership degree and non-membership degree, and satisfies the condition that the square sum of its membership degree and non-membership degree is no more than 1 [14]. Thus, PFSs provide more autonomy to decision-makers in expressing their opinions about the alternatives of a considered decision-making problem [15,16]. Due to its flexible characteristic, the PFS theory has been widely used to handle uncertainties data in various decision-making processes such as hospital service quality evaluation [17], website quality evaluation [18], solar panel selection [19], risk prevention in hydropower plant operations [20], occupational risk assessment in pipeline construction [21], and digital supply chain partner selection [22].
When evaluating the passenger satisfaction of a public transportation system, it is needed to consider a lot of aspects or criteria, such as security, environment, and availability of facilities [6,23,24]. Accordingly, the passenger satisfaction evaluation can be regarded as a complex multi-criteria decision making (MCDM) problem, and thus solved by MCDM methods. The multi-objective optimization by a ratio analysis plus full multiplicative form (MULTIMOORA) is an effective MCDM method proposed by Brauers and Zavadskas [25]. It consists of three parts: ratio system, reference point method, and full multiplicative form [26]. The MULTIMOORA is more robust than other MCDM methods and can obtain a more accurate ranking result as it integrates the three subordinate models [27,28,29,30]. Over recent years, the method has been extended and applied for addressing MCDM problems in many fields. For example, Yazdi [31] extended the MULTIMOORA approach with Choquet integral to prioritize corrective actions in a probabilistic risk assessment technique. Wu et al. [32] presented a modified MULTIMOORA method based on cloud model theory for ranking engineering characteristics in quality function deployment. Lin et al. [33] established a picture fuzzy MULTIMOORA model to solve the site selection problem for car-sharing stations. In Reference [34], the MULTIMOORA method was combined with Shannon entropy index to evaluate the progress towards “Europe 2020” goals. In Reference [35], the MULTIMOORA method was integrated with the evaluation based on distance from average solution (EDAS) to evaluate the barriers to renewable energy adoption. In Reference [36], a hesitant fuzzy linguistic MULTIMOORA approach was proposed for robot evaluation and selection.
In this paper, we put forward an improved MULTIMOORA method based on PFSs to solve the passenger satisfaction problem of the public transportation system in the large group environment. In summary, this study makes the following valuable contributions to the literature: First, the PFSs are used to deal with the vagueness and hesitation of satisfaction assessments provided by passengers. Second, the MULTIMOORA is extended and employed to rank passenger satisfaction levels of different rail transit lines. Third, a combination weighting method is suggested to determine the weights of evaluation criteria, taking into consideration their subjective and objective weights. Finally, a real case study of Shanghai rail transit network is introduced to verify the effectiveness of the proposed passenger satisfaction evaluation method.
The remainder of this article is organized in the following way. Section 2 gives a review of the relevant literature on passenger satisfaction evaluation, especially for public transportation systems. Section 3 is concerned with the basic concepts of PFSs used for this study. In Section 4, the passenger satisfaction evaluation method of the public transportation system based on PFSs and MULTIMOORA is described. In Section 5, a practical case involving passenger satisfaction evaluation of rail transit lines in Shanghai is presented to illustrate the effectiveness of the proposed Pythagorean fuzzy MULTIMOORA model. The final section summarizes the main research findings and makes recommendations for further research work.

2. Literature Review

The service quality of public transportation is a comprehensive concept that can be evaluated by objective performance criteria or by the perceptions and opinions of passengers. As passenger satisfaction is a key factor that affects peoples’ willingness to use public transportation systems, there is an increasing number of studies investigating public transportation passenger satisfaction using different methods and from different perspectives.
First, empirical analysis methods are generally used to study the factors that affect the quality of public transportation services. For example, Zhang et al. [9] constructed a passenger satisfaction index model based on partial least square (PLS) and structural equation model (SEM) and used it to measure the passenger satisfaction of Chinese public transport services. Allen et al. [8] designed a full SEM cause multiple indicator model to analyze the effect of critical incidents on public transport satisfaction based on the survey data in the hinterland of Milan. Soza-Parra et al. [37] investigated the underlying effect of public transport reliability on users’ satisfaction through a post-service satisfaction survey of bus and metro users. Quddus et al. [38] examined the relationship between bus service quality and its influencing factors in Dhaka using a customer satisfaction survey and discrete choice models. Shang et al. [36] carried out a case study in a Beijing’s transport hub to optimize the bus timetabling by embodying a balance between passenger satisfaction and bus transit efficiency. Börjesson and Rubensson [11] analyzed the satisfaction with crowding and other attributes in public transport based on the customer satisfaction survey conducted among public transport passengers in Stockholm. In Reference [39], an SEM multi-group analysis method was proposed to explore the relationship between satisfaction and loyalty of transit passengers using four satisfaction survey datasets. In Reference [40], the customer satisfaction theory and PLS-SEM were employed to evaluate the passenger satisfaction of Chinese public transport operators, and then a mixed logit model was used to analyze the relationship between organizational forms and passenger satisfaction.
Second, the MCDM-based methods are also preferred for the passenger satisfaction evaluation of public transportation services, especially when multi-criteria are considered to determine the level of passenger satisfaction. For instance, Kiani Mavi et al. [41] proposed a hybrid MCDM model integrating grey step-wise weight assessment ratio analysis (SWARA-G) and grey complex proportional assessment of alternatives (COPRAS-G) to assess and enhance the customer satisfaction of BRT system in Tehran. Nassereddine and Eskandari [42] reported an integrated MCDM method based on Delphi method, analytic hierarchy process (AHP), and preference ranking organization method for enrichment of evaluations (PROMETHEE) for evaluating the passenger satisfaction levels of the public transportation systems in Tehran. de Aquino et al. [5] applied fuzzy technique for order performance by similarity to ideal solution (TOPSIS) method to evaluate the service quality of the Brazilian bus rapid transit (BRT) system. Moreover, Aydin [6] combined statistical analysis, fuzzy trapezoidal numbers, and the TOPSIS method to evaluate the service quality levels of rail transit lines for multiple periods. Güner [43] provided a two-stage MCDM approach using AHP and TOPSIS for measuring the quality of the public transportation systems and ranking bus transit routes. Bilişik et al. [44] adopted a fuzzy quality function deployment (QFD) methodology to increase the service quality and passenger satisfaction of public transportation in Istanbul. Besides, a combined approach was put forward by Zhang et al. [45] to evaluate the performance of public transit systems based on information entropy theory and super-efficiency data envelopment analysis (SE-DEA). An integrated framework was presented by Celik et al. [23] to determine the customer satisfaction level for the rail transit network based on statistical analysis, SERVQUAL, interval type-2 fuzzy sets and VIKOR (in Serbian: VIsekriterijumska optimizacija I KOmpromisno Resenje) method. A hybrid methodology was introduced by Bilişik et al. [24] for the customer satisfaction of the public transportation system using SERVQUAL, Delphi method, fuzzy AHP and fuzzy TOPSIS methods.
The extensive review of the related literature shows that many MCDM-based passenger satisfaction evaluation approaches have been proposed in previous studies. The existing researches often use fuzzy numbers or interval type-2 fuzzy sets to model passenger’ assessment information. However, in the real-life satisfaction evaluation process, these fuzzy set methods show some limitations for the situations of hesitate human opinions. On the other hand, the MULTIMOORA is a new MCDM method which is more robust than other common ranking methods. Although the MULTIMOORA method has been extended and used in many fields for decision making, it has not been considered to deal with the passenger satisfaction evaluation problem yet. To fill these gaps, in this paper, we develop a novel Pythagorean fuzzy MULTIMOORA method and apply it to solve the passenger satisfaction evaluation problem of public transport systems. Moreover, a combination weighting method is introduced for evaluating the weights of evaluation criteria. This insightful passenger satisfaction evaluation method can offer a scientific and reliable means for making convincing satisfaction ranking results of rail transit lines.

3. Preliminaries

The PFSs were proposed by Yager and Abbasov [13] to address decision-making problems under uncertainty, and Zhang and Xu [43] gave their general mathematical form. Next, the basic definitions and concepts of PFSs related to this study are introduced.
Definition 1
[13]. Let X be a fixed non-empty set. A PFS P in X is defined as:
P = { x , μ P ( x ) , ν P ( x ) | x X } ,
where μ P and ν P are the membership degree and non-membership degree of the element x to the set P, respectively; it satisfies the condition that 0 μ P 2 ( x ) + v P 2 ( x ) 1 , for all x X .
For each PFS P in X, π P ( x ) = 1 μ P 2 ( x ) v P 2 ( x ) is called the hesitation degree of element x X to set P. For a PFS P in X, the pair p ˜ = ( μ p ( x ) , ν p ( x ) ) is referred to as a Pythagorean fuzzy number (PFN) [41], and each PFN can be represented by p ˜ = ( μ p , ν p ) for simplicity.
Definition 2
[46,47]. For any two PFNs   p ˜ 1 = ( μ p 1 , ν p 1 ) and p ˜ 2 = ( μ p 2 , ν p 2 ) , the primary operational laws of PFNs are defined as follows:
(1)
p ˜ 1 p ˜ 2 = ( μ p 1 2 + μ p 2 2 μ p 1 2 μ p 2 2 , v p 1 v p 2 ) ;
(2)
p ˜ 1 p ˜ 2 = ( μ p 1 μ p 2 , v p 1 2 + v p 2 2 v p 1 2 v p 2 2 ) ;
(3)
λ p ˜ 1 = ( 1 ( 1 μ p 1 2 ) λ , v p 1 λ ) , λ > 0 ;
(4)
p ˜ 1 λ = ( μ p 1 λ , 1 ( 1 v p 1 2 ) λ ) , λ > 0 ;
Definition 3
[48,49]. Let p ˜ = ( μ p , ν p ) be a PFN, its score function is computed by
S ( p ˜ ) = 1 2 ( 1 + μ p 2 v p 2 ) ,
where S ( p ˜ ) [ 0 , 1 ] . The accuracy function of the PFN p ˜ = ( μ p , ν p ) is defined by
H ( p ˜ ) = 1 2 ( μ p 2 + v p 2 ) ,
where H ( p ˜ ) [ 0 , 1 ] .
Based on score function S and accuracy function H, we have the following comparison laws of PFNs.
Definition 4
[48]. Supposing there are two PFNs p ˜ 1 = ( μ p 1 , ν p 1 ) and p ˜ 2 = ( μ p 2 , ν p 2 ) , then
(1)
If S ( p ˜ 1 ) > S ( p ˜ 2 ) , then p ˜ 1 > p ˜ 2 ;
(2)
If S ( p ˜ 1 ) = S ( p ˜ 2 ) a n d H ( p ˜ 1 ) > H ( p ˜ 2 ) , then p ˜ 1 > p ˜ 2 ;
(3)
If S ( p ˜ 1 ) = S ( p ˜ 2 ) a n d H ( p ˜ 1 ) = H ( p ˜ 2 ) , then p ˜ 1 = p ˜ 2 .
Definition 5
[50]. Let p ˜ = ( μ p , ν p ) be a PFN. Then, its Pythagorean fuzzy entropy can be derived as follows:
E ( p ˜ ) = 1 ( μ p 2 + ν p 2 ) | μ p 2 ν p 2 | ,
where E ( p ˜ ) [ 0 , 1 ] .
Definition 6
[46,51]. Let p ˜ 1 = ( μ p 1 , ν p 1 ) and p ˜ 2 = ( μ p 2 , ν p 2 ) be two PFNs. The Euclidean distance between them is computed by
d ( p ˜ 1 , p ˜ 2 ) = 1 2 [ ( μ p 1 2 μ p 2 2 ) 2 + ( v p 1 2 v p 2 2 ) 2 + ( π p 1 2 π p 2 2 ) 2 ] .
Definition 7
[52]. Let p ˜ i = ( μ p i , ν p i ) ( i = 1 , 2 , , n ) be a collection of PFNs. Then the Pythagorean fuzzy weighted averaging (PFWA) operator is defined as:
P F W A ( p ˜ 1 , , p ˜ n ) = ( 1 i = 1 n ( 1 μ p i 2 ) w i , i = 1 n v p i w i ) ,
where w i is the importance degree of p ˜ i ( i = 1 , 2 , , n ) , satisfying w i [ 0 , 1 ] and i = 1 n w i = 1 .
Definition 8
[52]. Let p ˜ i = ( μ p i , ν p i ) ( i = 1 , 2 , , n ) be a collection of PFNs and ω = ( ω 1 , ω 2 , , ω n ) T be an associated ordered weight vector with ω i [ 0 , 1 ] and i = 1 n ω i = 1 . Then the Pythagorean fuzzy ordered weighted averaging (PFOWA) operator is defined as:
P F O W A ( p ˜ 1 , , p ˜ n ) = ( 1 j = 1 n ( 1 μ p σ ( j ) 2 ) ω i , j = 1 n v p σ ( j ) ω i ) ,
where p ˜ σ ( j ) is the jth largest value among p ˜ i ( i = 1 , 2 , , n ) . Note that the PFOWA operator becomes the PFWA operator when the ordered position of p ˜ σ ( j ) is the same as the position of p ˜ i .

4. The Proposed Methodology

In this section, we present a hybrid methodology by integrating PFSs and the MULTIMOORA method for evaluating the passenger satisfaction of a rail transit network in a large group environment. The proposed methodology consists of three stages: (1) Aggregating different opinions of large group passengers based on the PFSs; (2) computing the relative weights of evaluation criteria by using a combination weighting method; and (3) determining the ranking orders of rail transit lines with the MULTIMOORA method. A detailed diagrammatic representation of the proposed approach for passenger satisfaction evaluation is displayed in Figure 1.
The problem considered in this article is how to evaluate the passenger satisfaction level of a rail transit network according to the opinions obtained from a large number of passengers. The notations below are used to describe the sets and variables in the large group passenger satisfaction evaluation problem:
(1)
A = { A 1 , A 2 , , A m } is the set of rail transit lines in a rail transit network, where A i denotes the ith line, I = 1, 2, …, m.
(2)
C = { C 1 , C 2 , , C n } is the set of passenger satisfaction evaluation criteria determined for a rail transit network, where C j denotes the jth criterion, j = 1, 2, …, n.
(3)
G = { G 1 , G 2 , , G m } is the set of m passenger groups, where Gi denotes the passenger group that takes part in the evaluation of A i , i = 1, 2, …, m.
(4)
L = ( l 1 , l 2 , , l m ) is the vector of numbers of passengers concerning set G, where   l i represents the number of passengers in group G i , i = 1, 2, …, m.
(5)
S = { s 1 , s 2 , , s t } is the set of linguistic terms adopted by the passengers for satisfaction evaluation. These linguistic terms can be expressed in PFNs p ˜ k = ( μ p k , ν p k ) , k = 1 , 2 , , t . For example, if a seven-point linguistic term set is used, the linguistic terms can be denoted by PFNs, as shown in Table 1.
(6)
D i = [ d h j i ] l i × n is the passenger satisfaction evaluation matrix of rail transit line A i , where d h j i represents the satisfaction evaluation rating provided by the hth passenger from group Gi regarding the jth criterion based on the linguistic term set S, d h j i S , i = 1, 2, …, m, h = 1, 2, …,   l i , j = 1, 2, …, n.
Based on the abovementioned assumptions and notations, the large group passenger satisfaction evaluation problem can be solved by employing the steps given in the following subsections.

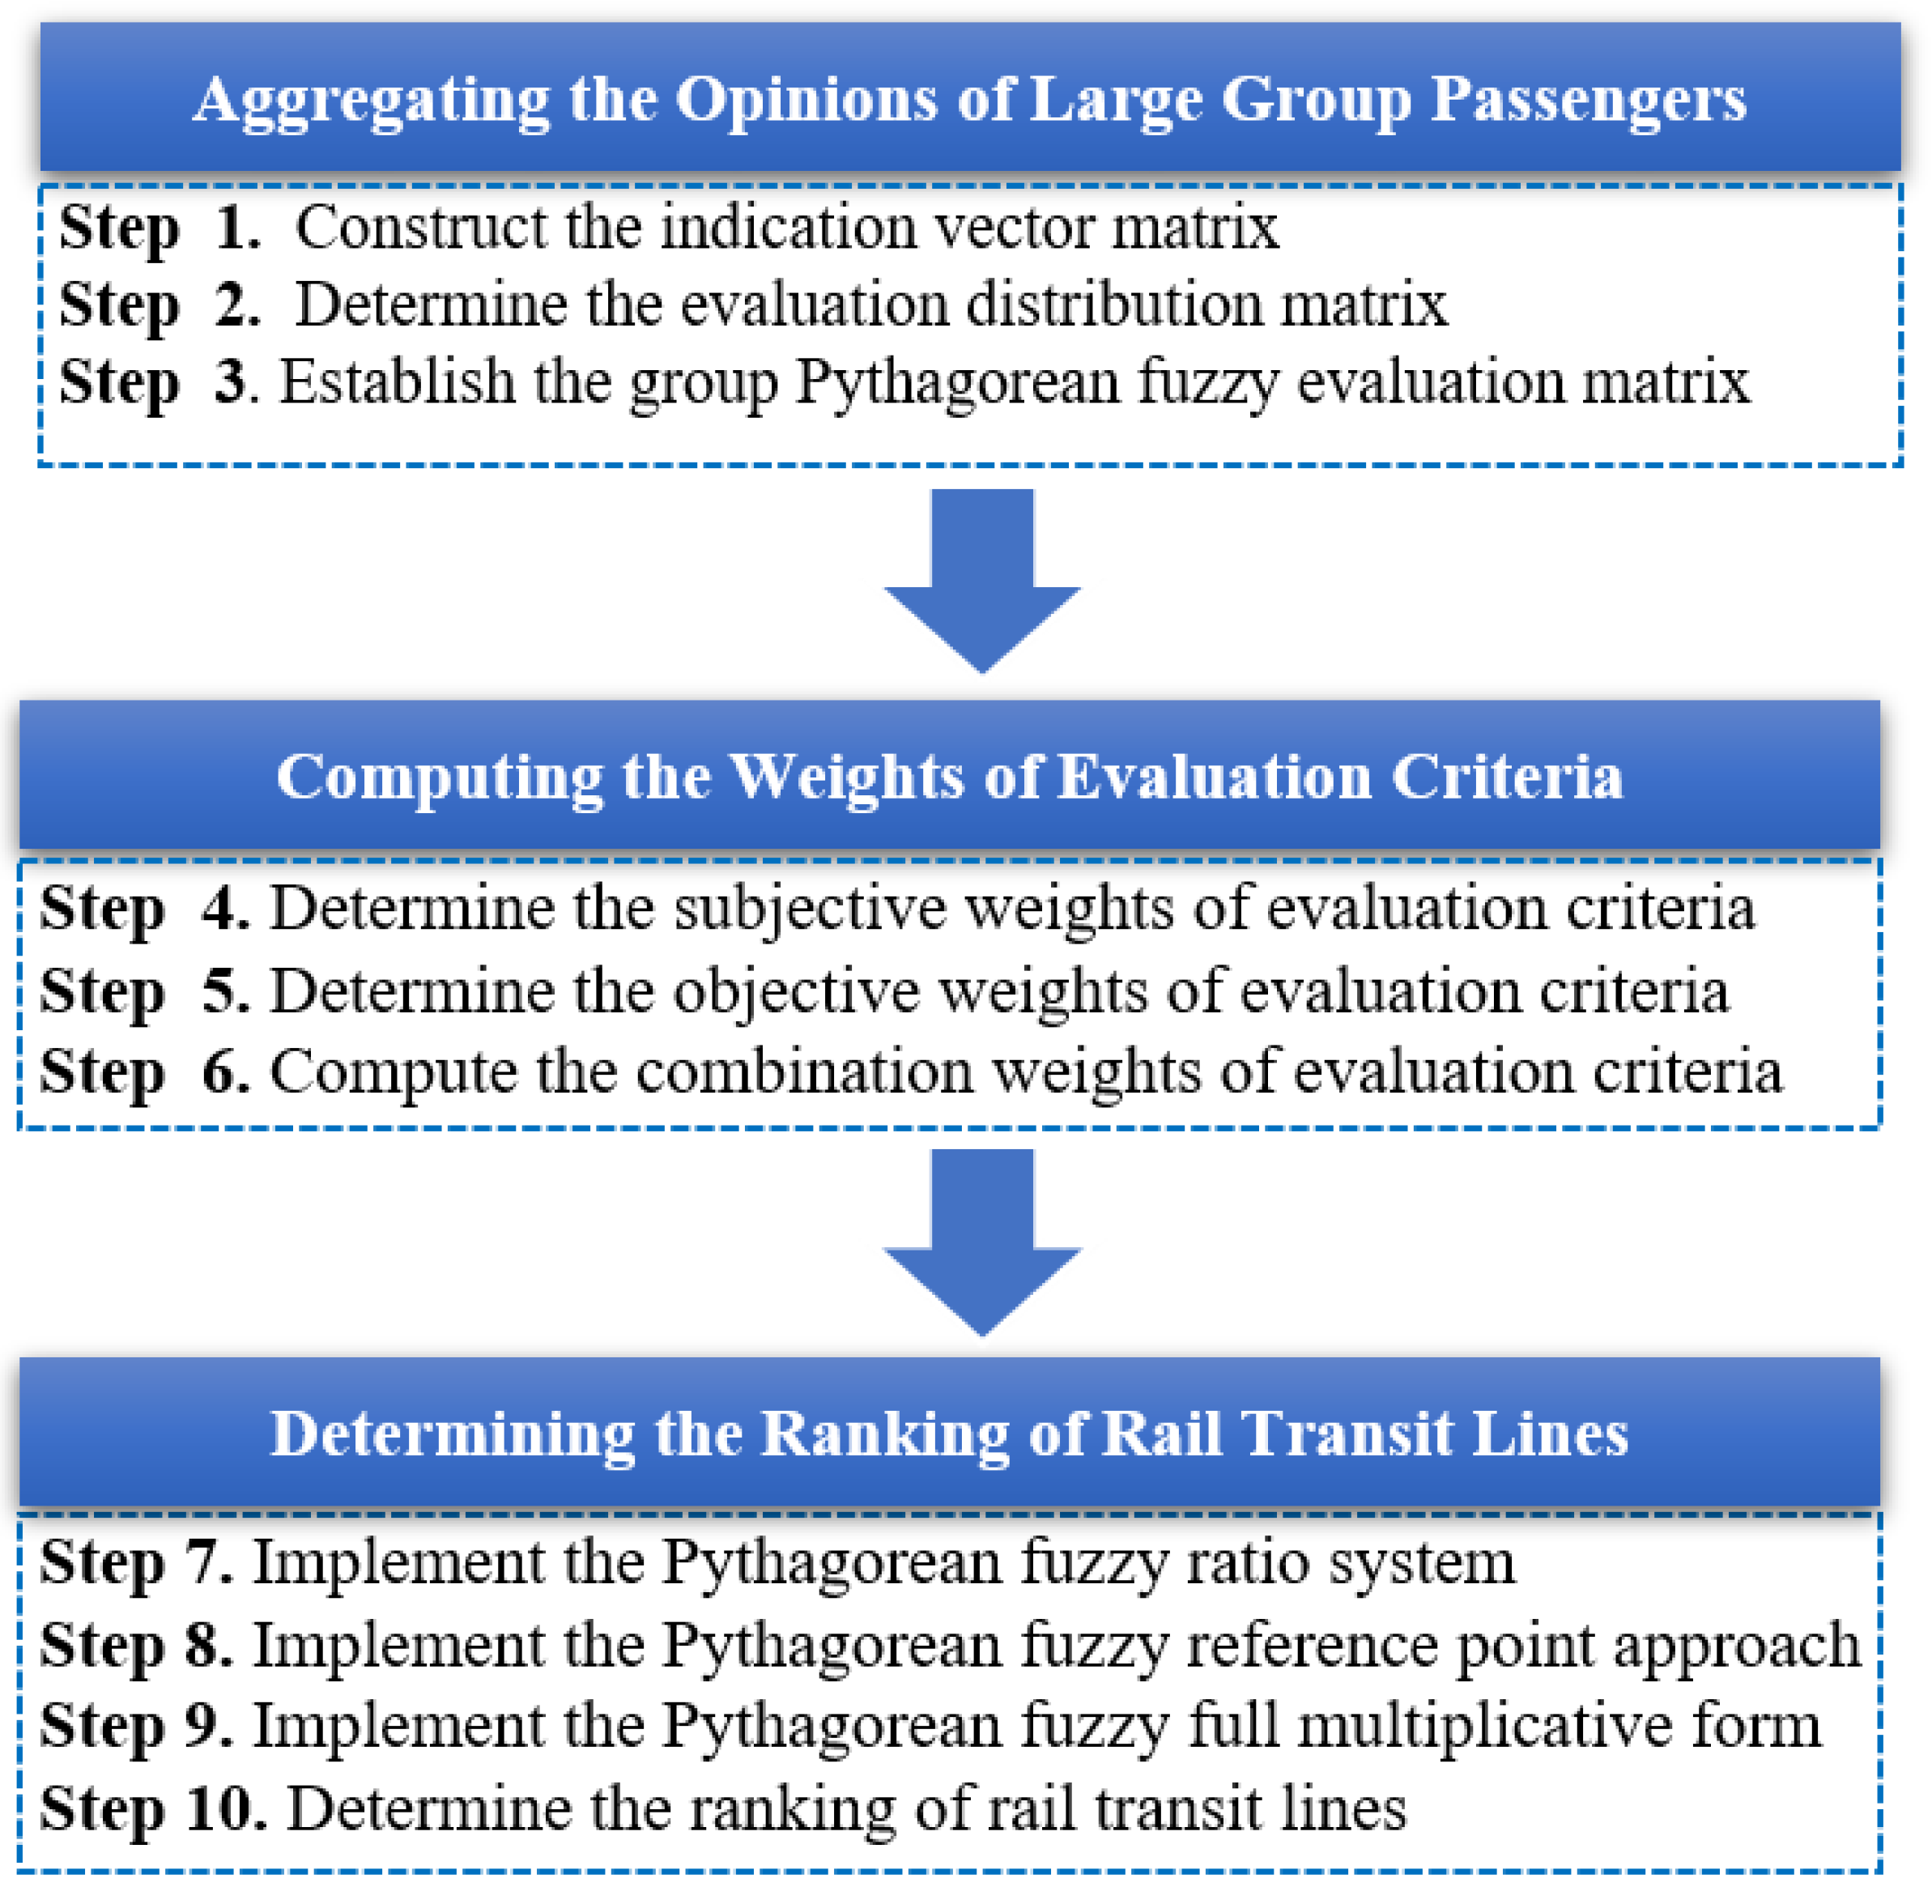
4.1. Aggregating the Opinions of Large Group Passengers

In the first stage, the satisfaction evaluation information of a large number of passengers concerning each rail transit line is determined and converted into group Pythagorean fuzzy satisfaction evaluations.
Step 1. Construct the indication vector matrix
Using the passenger satisfaction evaluation information obtained for the rail transit line A i , i.e., D i ( i = 1 , 2 , , m ) , the indication vector matrix I i = [ Ι h j i ] l i × n can be established, where Ι h j i is an indication vector Ι h j i = ( I h j i 1 , I h j i 2 , , I h j i t ) , in which
I h j i k = { 1 , if d h j i = s k 0 , otherwise , i = 1 , 2 , , m , j = 1 , 2 , , n , h = 1 , 2 , , l i , k = 1 , 2 , , t .
Step 2. Determine the evaluation distribution matrix
By pulling all the passengers’ opinions of group G i ( i = 1 , 2 , , m ) , the evaluation distribution matrix V = [ v i j ] m × n of m rail transit lines concerning each criterion can be determined. Note that v i j is an evaluation distribution vector v i j = ( v i j 1 , v i j 2 , , v i j t ) , in which
v i j k = 1 l i h = 1 l i I h j i k , i = 1 , 2 , , m , j = 1 , 2 , , n , k = 1 , 2 , , t ,
Here, p i j k and q i j k represents, respectively, the number and the percentage of passengers from group G i who utilize the linguistic term sk to express their satisfaction evaluations on A i in terms of C j .
Step 3. Establish the group Pythagorean fuzzy evaluation matrix
According to the PFNs defined for the t linguistic terms, p ˜ k ( k = 1 , 2 , , t ) , this step is to compute the group Pythagorean fuzzy evaluation matrix P ˜ = [ p ˜ i j ] m × n by using the PFWA operator. That is,
p ˜ i j = P F W A ( p ˜ 1 , , p ˜ t ) = ( 1 k = 1 t ( 1 μ p k 2 ) v i j k , k = 1 t v p k v i j k ) .

4.2. Computing the Weights of Evaluation Criteria

In the second stage, a combination weighting method [53] is used for determining the relative weights of the n passenger satisfaction evaluation criteria.
Step 4. Determine the subjective weights of evaluation criteria
The subjective weights of evaluation criteria are evaluated by decision-makers, D M g ( g = 1 , 2 , ,   L ) , using linguistic terms, such as those shown in Table 2. Let w j g be the important level of criterion C j given by the gth decision-maker. By aggregating their PFNs w ˜ j g ( j = 1 , 2 , , n ) using the PFOWA operator, the group criteria weights can be calculated as follows:
w ˜ j = P F O W A ( w ˜ j 1 , w ˜ j 2 , , w ˜ j L ) = J = 1 L ω J w ˜ j σ ( J ) ,
where w ˜ j σ ( J ) is the Jth largest value among w ˜ j g ( g = 1 , 2 , , L ) and ω = ( ω 1 , ω 2 , , ω L ) T is an associated ordered weight vector.
Then, the subjective weights of the n evaluation criteria are determined by
w j = S ( w ˜ j ) j = 1 n S ( w ˜ j ) , j = 1 , 2 , , n .
Step 5. Determine the objective weights of evaluation criteria
According to the entropy theory [54], the objective criteria weights are computed as:
w j = 1 E j n j = 1 n E j , j = 1 , 2 , , n ,
E j = i = 1 m E ( p ˜ i j ) , j = 1 , 2 , , n ,
where Ej is the entropy of the projected results of criterion Cj.
Step 6. Compute the combination weights of evaluation criteria
By combining both subjective and objective weights, the combination criteria weights are computed by
w j = w j w j j = 1 n w j w j , j = 1 , 2 , , n .

4.3. Determining the Ranking of Rail Transit Lines

In this stage, an extended Pythagorean fuzzy MULTIMOORA method is proposed to find the best passenger satisfaction level of a rail transit network, and its specific steps are presented as follows:
Step 7. Implement the Pythagorean fuzzy ratio system
For optimization, the Pythagorean fuzzy evaluations are added for each rail transit line by
y ˜ i = j = 1 n w j p ˜ i j , i = 1 , 2 , , m ,
where y ˜ i is the overall satisfaction evaluation of the rail transit line A i concerning all the evaluation criteria.
Step 8. Implement the Pythagorean fuzzy reference point approach
According to the Pythagorean fuzzy evaluation matrix P ˜ , the maximal objective reference point (MORP) vector r ˜ = ( r ˜ 1 , r ˜ 2 , , r ˜ n ) can be deduced, where
r ˜ j = max i { p ˜ i j } .
Then, the distance of each rail transit line from the MORP vector is computed by
d i = j = 1 n w j d ( p ˜ i j , r ˜ j ) , i = 1 , 2 , , m .
Step 9. Implement the Pythagorean fuzzy full multiplicative form
The overall utility concerning the ith rail transit line can be calculated as the product of all evaluation criteria, i.e.,
u ˜ i = j = 1 n p ˜ i j w j , i = 1 , 2 , , m .
Step 10. Determine the ranking of rail transit lines
Three ranking lists can be derived in line with the descending order of the values y ˜ i and u ˜ i for i = 1, 2, …, m and the increasing order of the distances d i for i = 1, 2, …, m. Finally, a single ranking of all the m rail transit lines can be determined by summarizing the three ranking lists through the dominance theory [55].

5. Illustrate Example

The case concerned in this study is to analyze a public transportation system in Shanghai to determine the current passenger satisfaction level of a rail transit network and demonstrate the applicability of the proposed approach. Next, the rail transit network infrastructure in Shanghai is first introduced, and then the proposed approach is applied to solve the passenger satisfaction evaluation problem.

5.1. Background

As an international metropolis with a strong economy, Shanghai has been the most prestigious residential area culturally, economically, and financially. Shanghai is one of the most crowded cities in China. Based on the 2019 census, the population of Shanghai was 24.28 million dispersed in 15 districts and one county. Coupled with the need for low-cost and accessible transportation, Shanghai has placed a priority on public transportation to mitigate congestion and reduce pollution. With the development of urban traffic, the public transportation system in Shanghai is relatively well-developed and largely satisfies the travel demands of residents. The number of bus lines, station distribution, and network density are among the top three in China.
At present, metros and trams are the most convenient way to transport for Shanghaiers since traffic congestion is still an issue in Shanghai, especially in the morning and evening peak times. The Shanghai Metro operated its first line in 1993. Since then, it has been rapidly growing into a considerable rail network and now operates metros, trams, light rails, and maglevs. The company has 16 urban rail transit lines, 415 stations, and a total route length of 704.91 km. In 2019 the daily passenger flow of the entire network reached 10.64 million, and the passenger flow of rail transit accounted for 63.3 percent of the passenger flow of the public transportation system.
In this study, the passenger satisfaction levels of five rail transit lines are analyzed. These lines, denoted as A1, A2, …, A5, are: Line 1 (Xinzhuang-Fujin Road), Line 2 (East Xujin-Pudong International Airport), Line 3 (Shanghai South Railway Station- North Jiangyang Road), Line 4 (Yishan Road-Yishan Road, Circle Line) and Line 7 (Huamu Road-Meilan Lake). Table 3 shows detailed information for the five rail transit lines. The passenger satisfaction surveys were performed in all stations of the five lines between February and April in 2019. In total, 554 passengers participated in the surveys—114 in Line 1, 113 in Line 2, 111 in Line 3, 108 in Line 4, and 108 in Line 7. So, the vector of numbers of participants in the five lines is L = (114, 113, 111, 108, 108). The participants used the linguistic term set displayed in Table 1 to express their satisfaction evaluation for each line. Many quantitative and qualitative criteria should be taken into account in order to conduct a comprehensive evaluation of the rail transit lines. In this study, the passenger satisfaction criteria are determined based on the literature review and classified in line with the SERVQUAL tool [23,44]. The identified five dimensions and their related 26 evaluation criteria are presented in Table 4. All the passengers are invited to take part in passenger satisfaction based on a web-based questionnaire system. The passenger satisfaction evaluation matrices provided by passengers for the five lines are D 1 = [ d h j 1 ] l i × 26 , D 2 = [ d h j 2 ] l i × 26 , D 3 = [ d h j 3 ] l i × 26 , D 4 = [ d h j 4 ] l i × 26 , and D 5 = [ d h j 5 ] l i × 26 . The details of these matrices are omitted here to save space.

5.2. Application of the Proposed Method
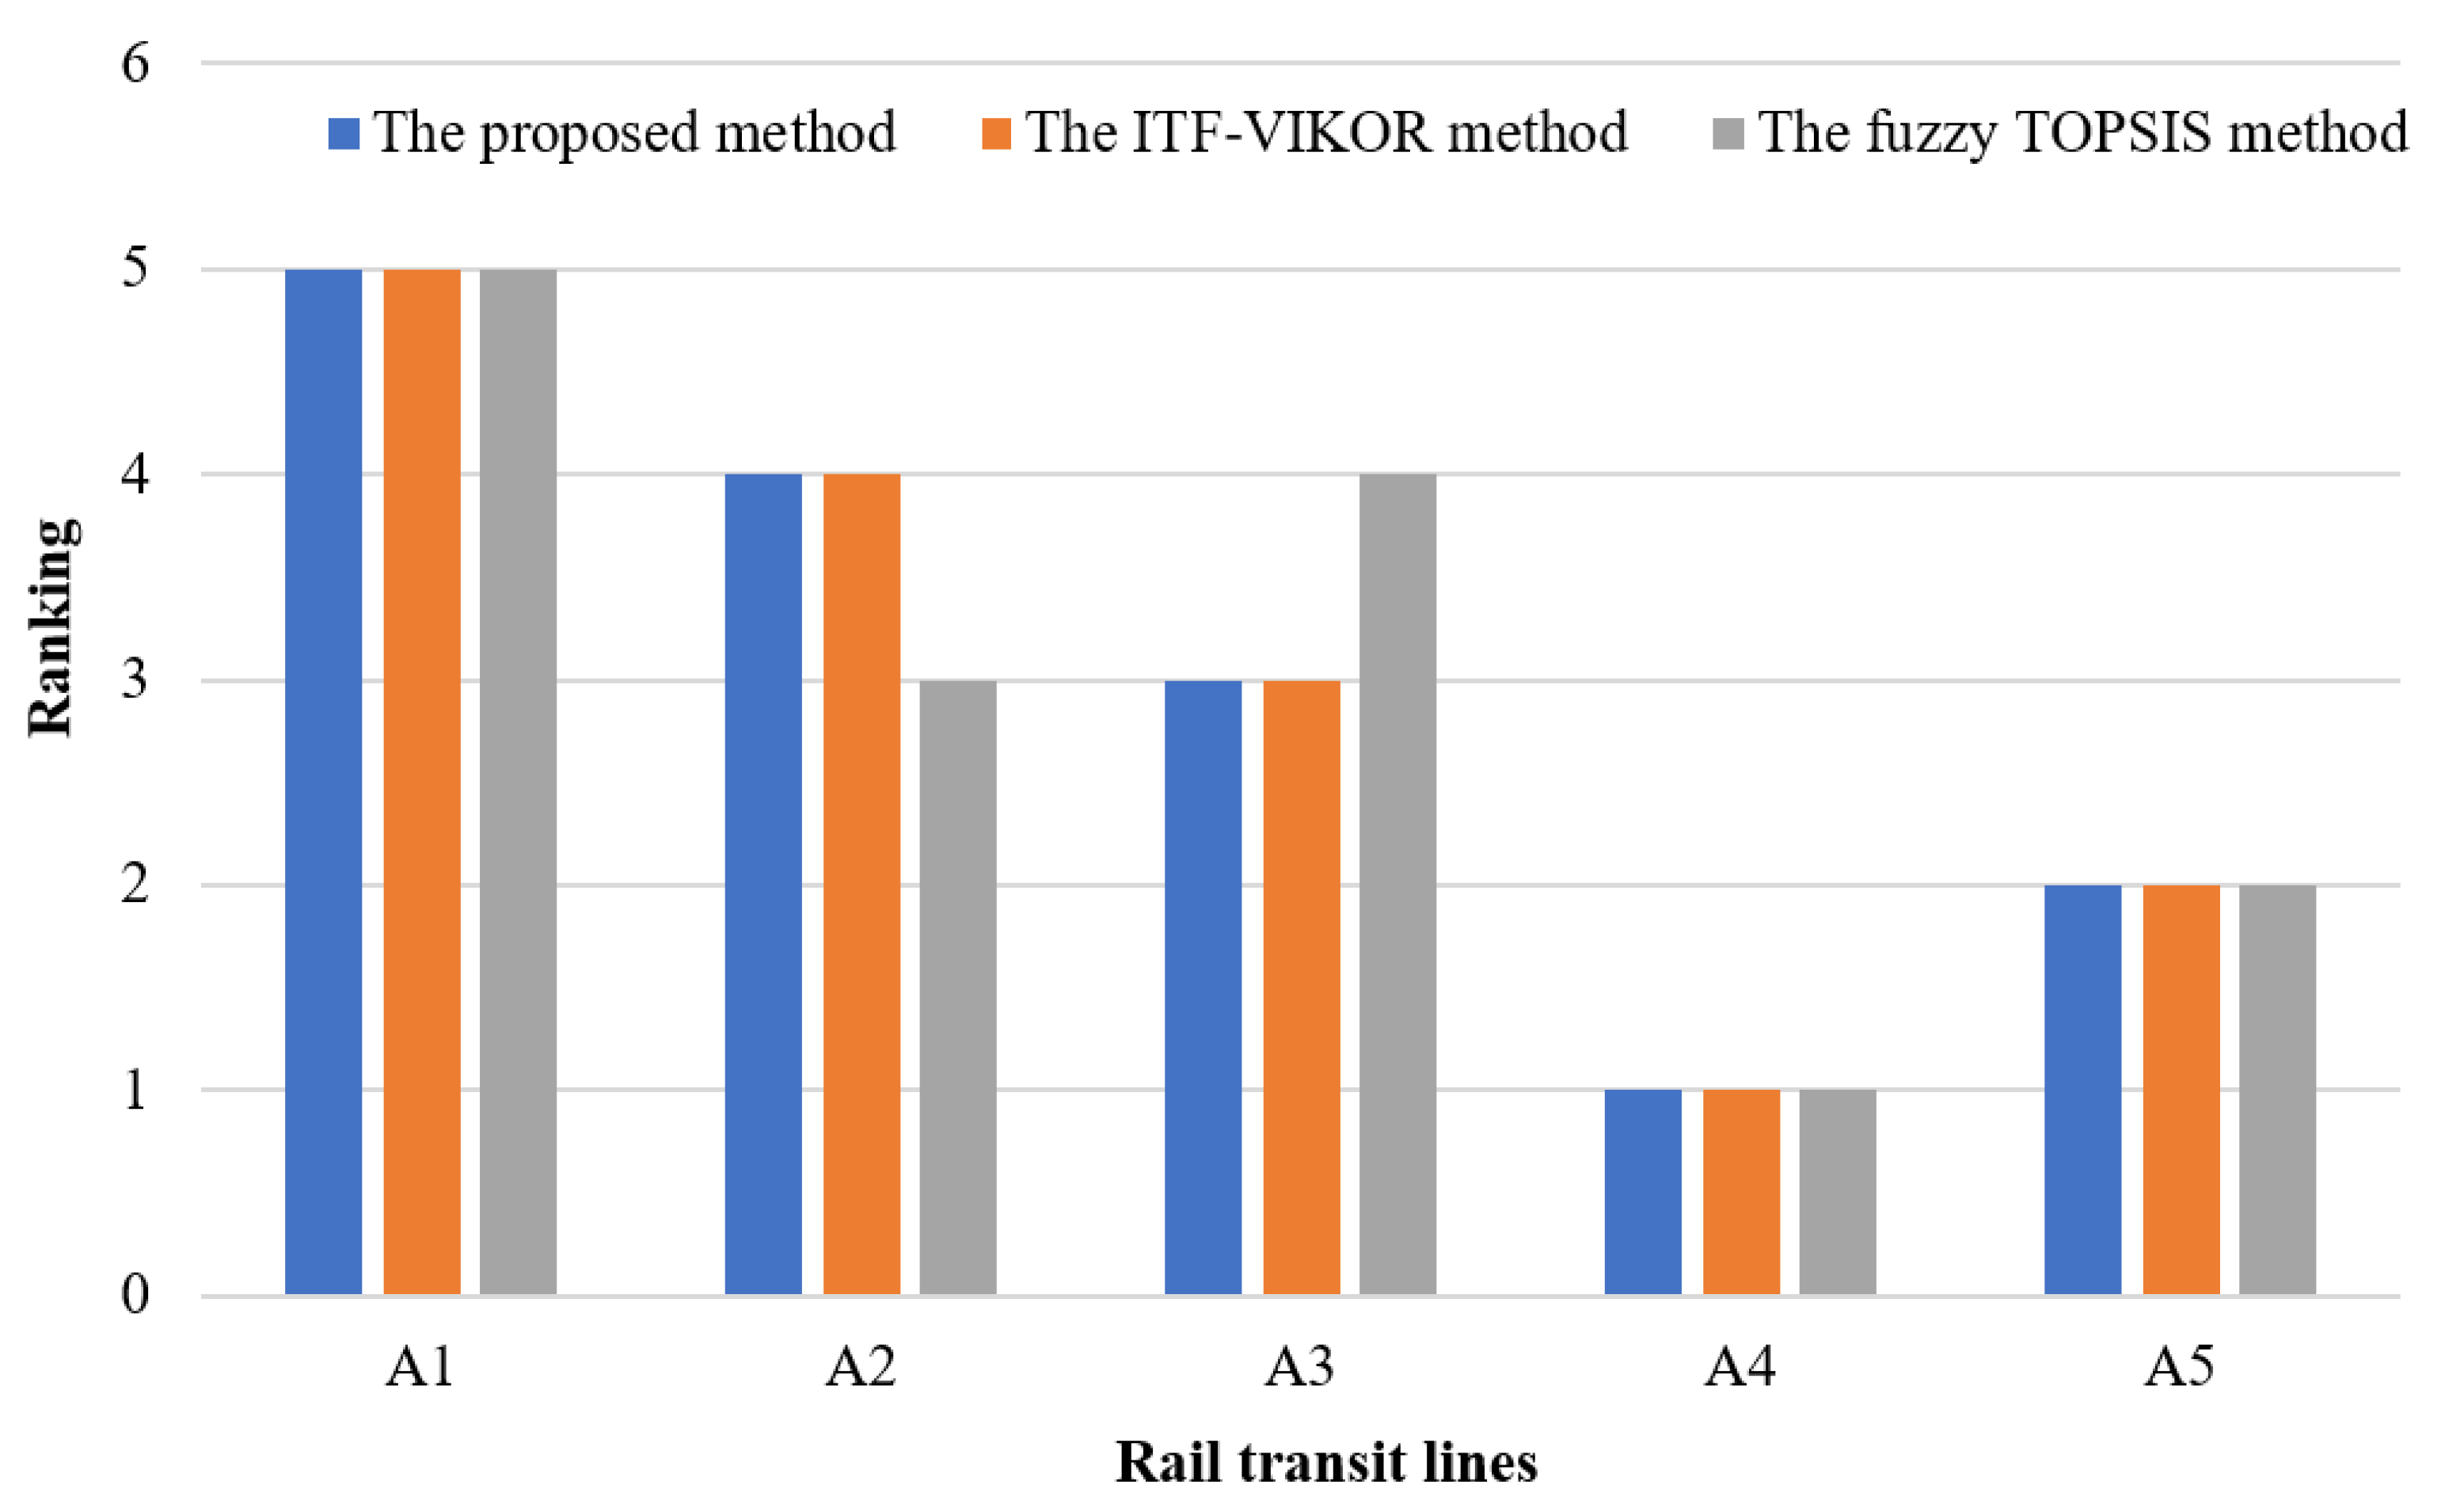
In this section, the proposed passenger satisfaction evaluation approach is applied to determine the passenger satisfaction levels of the considered rail transit lines. The implementation process and computation results are illustrated below.
Step 1. Based on the passenger satisfaction evaluation matrices D i = [ d h j i ] l i × 26 ( i = 1 , 2 , 5 ) the indication vector matrices I i = [ Ι h j i ] l i × 26 ( i = 1 , 2 , , 5 ) are obtained by Equation (8).
Step 2. Using Equation (9), the evaluation distributions of each rail transit line concerning the 26 criteria are determined as given in Table 5. For instance, the evaluation distributions of A1 concerning C1 is [0.00, 0.00, 0.09, 0.14, 0.25, 0.32, 0.20], which means that the proportion of satisfaction evaluations as Very poor, Poor, Moderately poor, Medium, Moderately good, Good, and Very good is 0%, 0%, 9%, 14%, 25%, 32%, and 20%.
Step 3. By Equation (10), the group Pythagorean fuzzy evaluation matrix P ˜ = [ p ˜ i j ] 5 × 26 is established, as shown in Table 6.
Step 4. The subjective weights of the evaluation criteria provided by the five decision-makers DMg (g = 1, 2, …, 5) are presented in Table 7. Using Equations (11) and (12), the subjective criteria weight vector is calculated as displayed in Table 8.
Step 5. The objective weights of the evaluation criteria are derived using Equations (13) and (14)—and the results are shown in Table 8.
Step 6. According to Equation (15), the combination weights of the evaluation criteria are computed as given in Table 8.
Steps 7–9. Based on different parts of the Pythagorean fuzzy MULTIMOORA method, the satisfaction evaluation y ˜ i , the distance from the MORP vector d i and overall utility u ˜ i of each line are calculated by using Equations (16)–(19). Table 9 summarizes the results obtained by using the three parts.
Step10. By ranking the values of y ˜ i , d i and u ˜ i , three ranking lists of the five rail transit lines can be obtained. At last, the final ranking is determined through the dominance theory. The ranking results of the five transit lines are shown in Table 10.
From Table 10, it can be seen that, the passenger satisfaction ranking of the five lines is A 4 A 5 A 3 A 2 A 1 , which means Line 4 has the highest passenger satisfaction level, and Line 1 has the lowest one.

5.3. Discussions

There are several important results of this study. First, according to the combination weights of the evaluation criteria obtained in Table 8, C12 (The frequency of train failures) and C11 (The smoothness of the train) are the most important criteria; C1 (Train Interval) and C21 (Lighting quality inside the stations) are the least important criteria. In the assurance dimension, the decision-makers consider C8 (The comfort of the trains) to be the most important criterion. In the reliability dimension, the decision-makers think that C12 is the most important criterion. In the tangibles dimension, the decision-makers consider C24 (Convenience of ticket vending machines and ticket gates) to be the most important criterion. These findings reveal that reliability, assurance and tangibles should not be overlooked when evaluating the passenger satisfaction of the given rail transit lines.
Second, to verify the effectiveness and advantages of the proposed Pythagorean fuzzy MULTIMOORA method, some comparable methods were applied to the above case study, which includes the interval type-2 fuzzy VIKOR (ITF-VIKOR) [23] and the fuzzy TOPSIS [56]. Figure 2 shows the ranking results of the five rail transit lines as yielded using these methods. It can be observed that the most satisfied two lines for the considered problem remains the same (i.e., A4 and A5) for the proposed method and the other two methods. Thus, the proposed passenger satisfaction evaluation model is validated. However, interval type-2 fuzzy sets and fuzzy sets are adopted by the ITF-VIKOR and the fuzzy TOPSIS, respectively, to handle the inexact subjective evaluation data of passengers. They are invalid when dealing with the problems with hesitate evaluation information. The PFSs overcome this limitation because decision-makers do not have to assign membership and non-membership degrees whose sum is at most 1. Therefore, the proposed method is more effective to describe complex fuzzy information in the passenger satisfaction evaluation problem. In addition, compared with the VIKOR and the TOPSIS used in the other two methods, the MULTIMOORA is employed in this study for the ranking of rail transit lines. As a result, a reliable and robust result can be obtained by our proposed method as it includes three complementary parts, i.e., ratio system, reference approach, and full multiplicative form.
Third, the result determined by our proposed method is in line with the Shanghai Metro’s practical operation information statistics for 2019. The Shanghai commission of communications released a passenger satisfaction evaluation report of Shanghai rail transit operation service in the second quarter of 2019. Its details are shown in Table 11. According to this report, Line 4 has excellent passenger satisfaction level, which is second only to Line 7, and Line 1 has the lowest passenger satisfaction level. Line 1 not only has the highest failure rate, but also has a terrible temperature and ventilation system, which makes people uncomfortable. Therefore, to enhance the passenger satisfaction level of Line 1, it should be improved from the aspects of reliability, assurance, and tangibles.

6. Conclusions

In this study, a new method, which integrates PFSs and the MULTIMOORA, is proposed for the passenger satisfaction level of the public transportation system in a large group environment. The PFSs are used to cope with the vagueness and uncertainty of passengers’ satisfaction assessments. The MULTIMOORA method is extended and used to determine the passenger satisfaction levels of rail transit lines. Besides, a combination weighing method is used to determine the weights of passenger satisfaction evaluation criteria. Finally, the proposed method is applied to a real case study of passenger satisfaction evaluation for a rail transit network in Shanghai, China. The results show that Line 4 has the highest passenger satisfaction level, and Line 1 has the lowest passenger satisfaction level. This provides a reference for the company to improve its service quality and passenger satisfaction level.
For future research, the following directions are suggested. First, it is an interesting topic to develop further extensions of the proposed method by considering the psychological factors of passengers. Second, it may be valuable to determine the weights of experts by considering the consistency of satisfaction assessments, because their experience and knowledge are often different in reality. Additionally, the proposed Pythagorean fuzzy MULTIMOORA framework for passenger satisfaction evaluation is a general method, which can be applied to other cities or other public transportation systems to measure the public transport satisfaction for urban transportation providers and managers.

Author Contributions

The individual contribution and responsibilities of the authors were as follows: X.-H.L. and Q.L. together designed research; L.H. and H.-C.L. provided extensive advice throughout the study regarding the abstract, introduction, research design, research methodology, findings and revise the manuscript. The discussion was a team task. All authors have read and approved the final manuscript.

Funding

This work was partially supported by the National Natural Science Foundation of China (No. 71701153), and the Open Research Fund Project of Key Laboratory of Quality Infrastructure Efficacy Research (No. KF20180303).

Acknowledgments

The authors are very grateful to the editor and reviewers for their insightful and constructive comments and suggestions, which are very helpful in improving the quality of the paper.

Conflicts of Interest

The authors declare no conflict of interest.

References

  1. Liu, H.-C.; Yang, M.; Zhou, M.; Tian, G. An Integrated Multi-Criteria Decision Making Approach to Location Planning of Electric Vehicle Charging Stations. IEEE Trans. Intell. Transp. Syst. 2018, 20, 362–373. [Google Scholar] [CrossRef]
  2. Liu, H.-C.; You, X.-Y.; Xue, Y.-X.; Luan, X. Exploring critical factors influencing the diffusion of electric vehicles in China: A multi-stakeholder perspective. Res. Transp. Econ. 2017, 66, 46–58. [Google Scholar] [CrossRef]
  3. Hamurcu, M.; Eren, T. Strategic Planning Based on Sustainability for Urban Transportation: An Application to Decision-Making. Sustainability 2020, 12, 3589. [Google Scholar] [CrossRef]
  4. Agaton, C.B.; Collera, A.A.; Guno, C.S. Socio-Economic and Environmental Analyses of Sustainable Public Transport in the Philippines. Sustainability 2020, 12, 4720. [Google Scholar] [CrossRef]
  5. De Aquino, J.T.; De Melo, F.J.C.; Jerônimo, T.; De Medeiros, D.D. Evaluation of Quality in Public Transport Services: The Use of Quality Dimensions as an Input for Fuzzy TOPSIS. Int. J. Fuzzy Syst. 2018, 21, 176–193. [Google Scholar] [CrossRef]
  6. Aydin, N. A fuzzy-based multi-dimensional and multi-period service quality evaluation outline for rail transit systems. Transp. Policy 2017, 55, 87–98. [Google Scholar] [CrossRef]
  7. Weng, J.; Di, X.; Wang, C.; Wang, J.; Mao, L. A Bus Service Evaluation Method from Passenger’s Perspective Based on Satisfaction Surveys: A Case Study of Beijing, China. Sustainability 2018, 10, 2723. [Google Scholar] [CrossRef] [Green Version]
  8. Allen, J.; Eboli, L.; Mazzulla, G.; Ortúzar, J.D.D. Effect of critical incidents on public transport satisfaction and loyalty: An Ordinal Probit SEM-MIMIC approach. Transportation 2018, 47, 827–863. [Google Scholar] [CrossRef]
  9. Zhang, C.; Liu, Y.; Lu, W.; Xiao, G. Evaluating passenger satisfaction index based on PLS-SEM model: Evidence from Chinese public transport service. Transp. Res. Part A Policy Pract. 2019, 120, 149–164. [Google Scholar] [CrossRef]
  10. Shang, H.-Y.; Huang, H.-J.; Wu, W.-X. Bus timetabling considering passenger satisfaction: An empirical study in Beijing. Comput. Ind. Eng. 2019, 135, 1155–1166. [Google Scholar] [CrossRef]
  11. Börjesson, M.; Rubensson, I. Satisfaction with crowding and other attributes in public transport. Transp. Policy 2019, 79, 213–222. [Google Scholar] [CrossRef]
  12. Atanassov, K.T. Intuitionistic fuzzy sets. Fuzzy Sets Syst. 1986, 20, 87–96. [Google Scholar] [CrossRef]
  13. Yager, R.R.; Abbasov, A. Pythagorean Membership Grades, Complex Numbers, and Decision Making. Int. J. Intell. Syst. 2013, 28, 436–452. [Google Scholar] [CrossRef]
  14. Liang, D.; Darko, A.P.; Xu, Z.; Zhang, Y. Partitioned fuzzy measure-based linear assignment method for Pythagorean fuzzy multi-criteria decision-making with a new likelihood. J. Oper. Res. Soc. 2019, 71, 831–845. [Google Scholar] [CrossRef]
  15. Sarkar, B.; Biswas, A. A unified method for Pythagorean fuzzy multicriteria group decision-making using entropy measure, linear programming and extended technique for ordering preference by similarity to ideal solution. Soft Comput. 2019, 24, 5333–5344. [Google Scholar] [CrossRef]
  16. Akram, M.; Ilyas, F.; Garg, H. Multi-criteria group decision making based on ELECTRE I method in Pythagorean fuzzy information. Soft Comput. 2019, 24, 3425–3453. [Google Scholar] [CrossRef]
  17. Yucesan, M.; Mete, S.; Gul, M.; Celik, E. Hospital service quality evaluation: An integrated model based on Pythagorean fuzzy AHP and fuzzy TOPSIS. Soft Comput. 2020, 24, 3237–3255. [Google Scholar] [CrossRef]
  18. Liang, D.; Zhang, Y.; Xu, Z.; Jamaldeen, A. Pythagorean fuzzy VIKOR approaches based on TODIM for evaluating internet banking website quality of Ghanaian banking industry. Appl. Soft Comput. 2019, 78, 583–594. [Google Scholar] [CrossRef]
  19. Rani, P.; Mishra, A.R.; Mardani, A.; Cavallaro, F.; Streimikiene, D.; Khan, S. Pythagorean Fuzzy SWARA–VIKOR Framework for Performance Evaluation of Solar Panel Selection. Sustainability 2020, 12, 4278. [Google Scholar] [CrossRef]
  20. Yucesan, M.; Kahraman, G. Risk evaluation and prevention in hydropower plant operations: A model based on Pythagorean fuzzy AHP. Energy Policy 2019, 126, 343–351. [Google Scholar] [CrossRef]
  21. Mete, S. Assessing occupational risks in pipeline construction using FMEA-based AHP-MOORA integrated approach under Pythagorean fuzzy environment. Hum. Ecol. Risk Assess. Int. J. 2019, 25, 1645–1660. [Google Scholar] [CrossRef]
  22. Buyukozkan, G.; Göçer, F. A Novel Approach Integrating AHP and COPRAS Under Pythagorean Fuzzy Sets for Digital Supply Chain Partner Selection. IEEE Trans. Eng. Manag. 2019, 1–18. [Google Scholar] [CrossRef]
  23. Celik, E.; Aydin, N.; Gumus, A.T. A multiattribute customer satisfaction evaluation approach for rail transit network: A real case study for Istanbul, Turkey. Transp. Policy 2014, 36, 283–293. [Google Scholar] [CrossRef]
  24. Bilisik, O.N.; Erdogan, M.; Kaya, I.; Baraçlı, H. A hybrid fuzzy methodology to evaluate customer satisfaction in a public transportation system for Istanbul. Total. Qual. Manag. Bus. Excel. 2013, 24, 1141–1159. [Google Scholar] [CrossRef]
  25. Brauers, W.K.M.; Zavadskas, E.K. Project management by MULTIMOORA as an instrument for transition economies. Technol. Econ. Dev. Econ. 2010, 16, 5–24. [Google Scholar] [CrossRef]
  26. Hafezalkotob, A.; Hafezalkotob, A.; Liao, H.; Herrera, F. An overview of MULTIMOORA for multi-criteria decision-making: Theory, developments, applications, and challenges. Inf. Fusion 2019, 51, 145–177. [Google Scholar] [CrossRef]
  27. Hafezalkotob, A.; Hafezalkotob, A.; Liao, H.; Herrera, F. Interval MULTIMOORA Method Integrating Interval Borda Rule and Interval Best–Worst-Method-Based Weighting Model: Case Study on Hybrid Vehicle Engine Selection. IEEE Trans. Cybern. 2020, 50, 1157–1169. [Google Scholar] [CrossRef]
  28. Siksnelyte-Butkiene, I.; Zavadskas, E.K.; Bausys, R.; Streimikiene, D. Implementation of EU energy policy priorities in the Baltic Sea Region countries: Sustainability assessment based on neutrosophic MULTIMOORA method. Energy Policy 2019, 125, 90–102. [Google Scholar] [CrossRef] [Green Version]
  29. Luo, L.; Zhang, C.; Liao, H. Distance-based intuitionistic multiplicative MULTIMOORA method integrating a novel weight-determining method for multiple criteria group decision making. Comput. Ind. Eng. 2019, 131, 82–98. [Google Scholar] [CrossRef]
  30. Liu, P.; Li, Y. An extended MULTIMOORA method for probabilistic linguistic multi-criteria group decision-making based on prospect theory. Comput. Ind. Eng. 2019, 136, 528–545. [Google Scholar] [CrossRef]
  31. Yazdi, M. A perceptual computing–based method to prioritize intervention actions in the probabilistic risk assessment techniques. Qual. Reliab. Eng. Int. 2019, 36, 187–213. [Google Scholar] [CrossRef]
  32. Wu, S.-M.; You, X.-Y.; Liu, H.-C.; Wang, L.-E. Improving quality function deployment analysis with the cloud MULTIMOORA method. Int. Trans. Oper. Res. 2017, 27, 1600–1621. [Google Scholar] [CrossRef]
  33. Lin, M.; Huang, C.; Xu, Z. MULTIMOORA based MCDM model for site selection of car sharing station under picture fuzzy environment. Sustain. Cities Soc. 2020, 53, 101873. [Google Scholar] [CrossRef]
  34. Fedajev, A.; Stanujkic, D.; Karabašević, D.; Brauers, W.K.M.; Zavadskas, E.K. Assessment of progress towards “Europe 2020” strategy targets by using the MULTIMOORA method and the Shannon Entropy Index. J. Clean. Prod. 2020, 244, 118895. [Google Scholar] [CrossRef]
  35. Asante, D.; He, Z.; Adjei, N.O.; Asante, B. Exploring the barriers to renewable energy adoption utilising MULTIMOORA- EDAS method. Energy Policy 2020, 142, 111479. [Google Scholar] [CrossRef]
  36. Liu, H.-C.; Zhao, H.; You, X.-Y.; Zhou, W.-Y. Robot Evaluation and Selection Using the Hesitant Fuzzy Linguistic MULTIMOORA Method. J. Test. Eval. 2018, 47, 2. [Google Scholar] [CrossRef]
  37. Soza-Parra, J.; Raveau, S.; Muñoz, J.C.; Cats, O. The underlying effect of public transport reliability on users’ satisfaction. Transp. Res. Part A Policy Pract. 2019, 126, 83–93. [Google Scholar] [CrossRef] [Green Version]
  38. Quddus, M.A.; Rahman, F.; Monsuur, F.; De Ona, J.; Enoch, M. Analyzing Bus Passengers’ Satisfaction in Dhaka using Discrete Choice Models. Transp. Res. Rec. J. Transp. Res. Board 2019, 2673, 758–768. [Google Scholar] [CrossRef]
  39. Allen, J.; Rica, U.D.C.; Eboli, L.; Forciniti, C.; Mazzulla, G.; Ortúzar, J.D.D. The role of critical incidents and involvement in transit satisfaction and loyalty. Transp. Policy 2019, 75, 57–69. [Google Scholar] [CrossRef]
  40. Zhang, C.; Juan, Z.; Lu, W.; Xiao, G. Do the organizational forms affect passenger satisfaction? Evidence from Chinese public transport service. Transp. Res. Part A Policy Pract. 2016, 94, 129–148. [Google Scholar] [CrossRef]
  41. Mavi, R.K.; Zarbakhshnia, N.; Khazraei, A. Bus rapid transit (BRT): A simulation and multi criteria decision making (MCDM) approach. Transp. Policy 2018, 72, 187–197. [Google Scholar] [CrossRef]
  42. Nassereddine, M.; Eskandari, H. An integrated MCDM approach to evaluate public transportation systems in Tehran. Transp. Res. Part A Policy Pract. 2017, 106, 427–439. [Google Scholar] [CrossRef] [Green Version]
  43. Guner, S. Measuring the quality of public transportation systems and ranking the bus transit routes using multi-criteria decision making techniques. Case Stud. Transp. Policy 2018, 6, 214–224. [Google Scholar] [CrossRef]
  44. Bilişik, Ö.N.; Seker, S.; Aydın, N.; Güngör, N.; Baraçlı, H. Passenger Satisfaction Evaluation of Public Transportation in Istanbul by Using Fuzzy Quality Function Deployment Methodology. Arab. J. Sci. Eng. 2018, 44, 2811–2824. [Google Scholar] [CrossRef]
  45. Zhang, C.; Juan, Z.; Luo, Q.; Xiao, G. Performance evaluation of public transit systems using a combined evaluation method. Transp. Policy 2016, 45, 156–167. [Google Scholar] [CrossRef]
  46. Zhang, X.; Xu, Z. Extension of TOPSIS to Multiple Criteria Decision Making with Pythagorean Fuzzy Sets. Int. J. Intell. Syst. 2014, 29, 1061–1078. [Google Scholar] [CrossRef]
  47. Yager, R.R. Pythagorean Membership Grades in Multicriteria Decision Making. IEEE Trans. Fuzzy Syst. 2014, 22, 958–965. [Google Scholar] [CrossRef]
  48. Gao, H.; Lu, M.; Wei, G.; Wei, Y. Some Novel Pythagorean Fuzzy Interaction Aggregation Operators in Multiple Attribute Decision Making. Fundam. Inform. 2018, 159, 385–428. [Google Scholar] [CrossRef]
  49. Wei, G.; Lu, M. Pythagorean fuzzy power aggregation operators in multiple attribute decision making. Int. J. Intell. Syst. 2017, 33, 169–186. [Google Scholar] [CrossRef]
  50. Xue, W.; Xu, Z.; Zhang, X.; Tian, X. Pythagorean Fuzzy LINMAP Method Based on the Entropy Theory for Railway Project Investment Decision Making. Int. J. Intell. Syst. 2017, 33, 93–125. [Google Scholar] [CrossRef]
  51. Ren, P.; Xu, Z.; Gou, X. Pythagorean fuzzy TODIM approach to multi-criteria decision making. Appl. Soft Comput. 2016, 42, 246–259. [Google Scholar] [CrossRef]
  52. Zhang, X. A Novel Approach Based on Similarity Measure for Pythagorean Fuzzy Multiple Criteria Group Decision Making. Int. J. Intell. Syst. 2015, 31, 593–611. [Google Scholar] [CrossRef]
  53. Wang, J.-J.; Miao, Z.-H.; Cui, F.-B.; Liu, H.-C. Robot Evaluation and Selection with Entropy-Based Combination Weighting and Cloud TODIM Approach. Entropy 2018, 20, 349. [Google Scholar] [CrossRef] [Green Version]
  54. Shannon, C.E.; Weaver, W. A Mathematical Theory of Communication; The University of Illinois Press: Urbana, IL, USA, 1947. [Google Scholar]
  55. Brauers, W.K.M.; Zavadskas, E.K. MULTIMOORA OPTIMIZATION USED TO DECIDE ON A BANK LOAN TO BUY PROPERTY. Technol. Econ. Dev. Econ. 2011, 17, 174–188. [Google Scholar] [CrossRef]
  56. Awasthi, A.; Chauhan, S.S.; Omrani, H.; Panahi, A. A hybrid approach based on SERVQUAL and fuzzy TOPSIS for evaluating transportation service quality. Comput. Ind. Eng. 2011, 61, 637–646. [Google Scholar] [CrossRef]
Figure 1. Flowchart of the proposed passenger satisfaction evaluation approach.
Sustainability 12 04996 g001
Figure 2. Comparative ranking results for the considered case.
Sustainability 12 04996 g002
Table 1. Linguistic terms for satisfaction evaluation.
Linguistic TermsPFNs
Very good (VG)(0.80, 0.05)
Good (G)(0.05, 0.80)
Moderately good (MG)(0.70, 0.15)
Medium (M)(0.55, 0.25)
Moderately poor (MP)(0.45, 0.40)
Poor (P)(0.30, 0.55)
Very poor (VP)(0.20, 0.70)
PFNs–Pythagorean fuzzy numbers.
Table 2. Linguistic terns for rating criteria importance.
Linguistic TermsPFNs
Very important (VI)(0.95, 0.05)
Important (I)(0.80, 0.20)
Medium (M)(0.50, 0.50)
Unimportant (U)(0.35, 0.65)
Very unimportant (VU)(0.05, 0.95)
Table 3. Characteristics of the five transit lines.
LinesOperating TimeLine Length (km)Daily Ridership (Ten Thousand)Trip Time (Minutes)Number of Stations
A15:30–22:3036.89115.84228
A25:30–22:4564143.99330
A35:25–22:3040.349.16729
A45:30–22:3033.676.955/5726
A55:30–22:3044.3573.56333
Table 4. Dimensions and criteria of passenger satisfaction evaluation for the rail transit network.
DimensionsCriteria
AssuranceTrain Interval (C1)
Speed of trains (C2)
Operating time (C3)
The diversity of access to information (C4)
Noise level on the trains (C5)
Vibration level on the trains (C6)
Noise level of the stations (C7)
The comfort of the trains (C8)
EmpathyParticular people can easily take the subway (C9)
The convenience of access and use of the trains (C10)
ReliabilityThe smoothness of the train (C11)
The frequency of train failures (C12)
Arrival performance concerning schedules (C13)
A sense of security at the station (C14)
A sense of security inside trains (C15)
Reliability of the information broadcasted in the stations and trains (C16)
ResponsivenessEfficiency and quality of the service (C17)
Politeness and dressing of staff (C18)
TangiblesLighting quality of stations (C19)
Cleanliness inside the stations (C20)
Lighting quality inside the stations (C21)
Temperature and ventilation system of stations and trains (C22)
Convenience of vertical elevators and escalators (C23)
Convenience of ticket vending machines and ticket gates (C24)
Price of tickets (C25)
Availability of the seat on the platform (C26)
Table 5. The evaluation distributions of five rail transit lines.
CriteriaA1A2A3A4A5
C1[0.00,0.00,0.09,0.14,0.25,0.32,0.20][0.08,0.06,0.13,0.08,0.23,0.20,0.22][0.03,0.04,0.06,0.08,0.21,0.36,0.22][0.00,0.00,0.00,0.00,0.02,0.45,0.53][0.01,0.01,0.02,0.07,0.34,0.31,0.24]
C2[0.00,0.02,0.18,0.11,0.28,0.30,0.11][0.06,0.10,0.11,0.03,0.21,0.21,0.29][0.05,0.04,0.04,0.08,0.27,0.28,0.23][0.00,0.00,0.00,0.06,0.00,0.94,0.00][0.01,0.00,0.01,0.11,0.28,0.39,0.20]
C3[0.00,0.00,0.20,0.11,0.26,0.26,0.17][0.05,0.09,0.10,0.07,0.24,0.26,0.18][0.04,0.04,0.07,0.11,0.28,0.30,0.15][0.05,0.05,0.08,0.08,0.09,0.33,0.32][0.00,0.04,0.10,0.17,0.17,0.34,0.19]
C24[0.09,0.13,0.09,0.20,0.19,0.22,0.08][0.04,0.15,0.08,0.07,0.14,0.32,0.19][0.05,0.06,0.04,0.07,0.28,0.27,0.22][0.04,0.07,0.11,0.05,0.18,0.30,0.25][0.02,0.02,0.05,0.06,0.31,0.35,0.20]
C25[0.20,0.04,0.10,0.11,0.37,0.18,0.00][0.03,0.11,0.10,0.12,0.09,0.27,0.29][0.06,0.05,0.04,0.13,0.22,0.23,0.26][0.04,0.09,0.08,0.07,0.19,0.29,0.25][0.03,0.03,0.06,0.24,0.25,0.30,0.10]
C26[0.08,0.11,0.23,0.08,0.30,0.21,0.00][0.04,0.11,0.12,0.11,0.14,0.27,0.23][0.08,0.04,0.08,0.12,0.24,0.31,0.13][0.04,0.08,0.08,0.10,0.20,0.28,0.23][0.02,0.03,0.15,0.18,0.31,0.25,0.07]
Table 6. Group Pythagorean fuzzy evaluation matrix.
CriteriaA1A2A3A4A5
C1[0.6518,0.1752][0.6133,0.2147][0.6601,0.1696][0.7571,0.0848][0.6693,0.1557]
C2[0.6080,0.2204][0.6410,0.1859][0.6497,0.1772][0.6906,0.1586][0.6701,0.1584]
C3[0.6200,0.2059][0.6160,0.2139][0.6229,0.2061][0.6767,0.1544][0.6408,0.1897]
C4[0.3197,0.5623][0.6500,0.1771][0.6644,0.1656][0.6370,0.1912][0.6548,0.1753]
C5[0.4211,0.4371][0.6229,0.2080][0.6017,0.2289][0.6204,0.2115][0.5283,0.3107]
C6[0.4958,0.3619][0.6103,0.2213][0.6085,0.2210][0.6523,0.1767][0.5731,0.2595]
C7[0.4175,0.4416][0.6340,0.1958][0.5982,0.2352][0.6315,0.1942][0.5665,0.2675]
C8[0.5627,0.2756][0.6533,0.1774][0.5846,0.2474][0.6502,0.1779][0.5003,0.3435]
C9[0.5648,0.2688][0.6172,0.2141][0.5983,0.2329][0.6319,0.1987][0.5611,0.2775]
C10[0.5620,0.2744][0.6153,0.2151][0.6333,0.1962][0.6349,0.1925][0.6394,0.1871]
C11[0.5737,0.2604][0.6188,0.2120][0.6512,0.1796][0.6061,0.2277][0.6394,0.1894]
C12[0.6073,0.2230][0.6236,0.2111][0.6205,0.2080][0.6443,0.1870][0.6579,0.1679]
C13[0.6131,0.2189][0.6315,0.1957][0.6346,0.1974][0.6461,0.1870][0.6842,0.1438]
C14[0.6030,0.2306][0.6321,0.1960][0.6404,0.1847][0.6397,0.1902][0.6438,0.1862]
C15[0.5932,0.2385][0.6202,0.2116][0.6095,0.2248][0.6459,0.1829][0.6453,0.1849]
C16[0.5897,0.2426][0.6367,0.1951][0.6425,0.1879][0.6354,0.1994][0.6429,0.1864]
C17[0.5873,0.2490][0.6456,0.1841][0.6307,0.1986][0.6483,0.1837][0.6524,0.1769]
C18[0.6103,0.2190][0.6327,0.1987][0.6445,0.1832][0.6502,0.1785][0.6512,0.1782]
C19[0.5957,0.2328][0.6071,0.2262][0.6535,0.1724][0.6339,0.1988][0.6846,0.1470]
C20[0.6065,0.2216][0.5902,0.2383][0.6349,0.2009][0.6365,0.1954][0.6677,0.1618]
C21[0.6094,0.2193][0.6296,0.2009][0.6463,0.1805][0.6478,0.1828][0.6849,0.1452]
C22[0.4966,0.3554][0.6375,0.1968][0.6398,0.1843][0.6560,0.1749][0.6297,0.2008]
C23[0.5984,0.2334][0.6312,0.2011][0.6257,0.2027][0.6369,0.1925][0.6223,0.2044]
C24[0.5482,0.2941][0.6243,0.2103][0.6436,0.1835][0.6514,0.1778][0.6604,0.1669]
C25[0.5044,0.3396][0.6501,0.1804][0.6429,0.1840][0.6466,0.1829][0.6044,0.2268]
C26[0.5040,0.3407][0.6276,0.2038][0.6111,0.2213][0.6400,0.1891][0.5794,0.2507]
Table 7. Importance assessment information provided by decision-makers.
CriteriaDM1DM2DM3DM4DM5
C1VIIIVII
C2IVIIVII
C3MVIIVII
C4MIVIIVU
C5MIMIVI
C6MIMIVI
C7UIMVIM
C8IVIMIVI
C9MIUVIU
C10IVIIII
C11IVIIVII
C12VIVIVIVIVI
C13IIVIVIM
C14IMIVIVI
C15IVIIVIVI
C16IMMII
C17IIVIVII
C18IMVIVIM
C19IMVIVII
C20IMIVIVI
C21IMIMI
C22IIIMVI
C23IVIIMVI
C24IVIVIMVI
C25MVIMIM
C26UVIMIM
Table 8. Weights of the evaluation criteria.
CriteriaSubjective WeightsObjective WeightsCombination Weights
C10.03660.03510.0334
C20.03700.03660.0352
C30.03690.03770.0362
C40.03670.03780.0361
C50.03630.04140.0391
C60.03630.04020.0380
C70.03640.04080.0387
C80.03760.04000.0392
C90.03640.04000.0379
C100.03960.03880.0400
C110.04170.03870.0420
C120.04990.03800.0493
C130.04170.03730.0404
C140.03760.03800.0372
C150.04170.03850.0417
C160.03630.03810.0359
C170.04170.03790.0410
C180.03930.03760.0384
C190.03930.03770.0385
C200.03760.03820.0374
C210.03630.03720.0351
C220.03670.03890.0371
C230.03760.03850.0377
C240.03930.03820.0390
C250.03690.03900.0375
C260.03640.04000.0379
Table 9. Results of the Pythagorean fuzzy multi-objective optimization by a ratio analysis plus full multiplicative form (MULTIMOORA) method.
Lines y ˜ i d i u ˜ i
A1[0.5648,0.2713]0.1107[1.80 × 107,0.9557]
A2[0.6277,0.2029]0.0417[6.11 × 106,0.8095]
A3[0.6308,0.1984]0.0386[5.41 × 106,0.8175]
A4[0.6485,0.1823]0.0186[1.23 × 105,0.7723]
A5[0.6328,0.1960]0.0377[5.37 × 106,0.8285]
Table 10. Ranking results for the five transit lines.
LinesRatio SystemReference Point Approach Full Multiplicative FormFinal Ranking
A15555
A24434
A33323
A41111
A52242
Table 11. Passenger satisfaction evaluation report of Shanghai rail transit operation service.
LinesNumber of SamplesPassenger Satisfaction ScoreFrequency of Train Failures
Line1192587.4317
Line2235988.0013
Line381988.2210
Line4131289.583
Line7125889.392

