Article

Digital Communication: Information and Communication Technology (ICT) Usage for Education Sustainability

by
Waleed Mugahed Al-Rahmi
1,2,*,
Ahmed Ibrahim Alzahrani
2,
Noraffandy Yahaya
1,
Nasser Alalwan
2 and
Yusri Bin Kamin
1
1
Faculty of Social Sciences and Humanities, School of Education, Universiti Teknologi Malaysia, Johor Bahru 81310, Malaysia
2
Computer Science Department, Community College, King Saud University, Riyadh 11437, Saudi Arabia
*
Author to whom correspondence should be addressed.
Sustainability 2020, 12(12), 5052; https://0-doi-org.brum.beds.ac.uk/10.3390/su12125052
Submission received: 6 May 2020 / Revised: 17 June 2020 / Accepted: 18 June 2020 / Published: 21 June 2020
(This article belongs to the Special Issue Technology and Innovation Management in Education)

Abstract

:
Today, developments in information and communication technology (ICT) have a significant influence on education sustainability. In this study, the factors influencing students’ intentions towards using ICT in education sustainability, as well as their satisfaction from its use, were examined. This study aims to investigate student intentions to use information and communication technology, as well as their satisfaction with such use. Therefore, this study employed an extended model of the Technology Acceptance Model (TAM) as the research framework, and adopted quantitative data collection and analysis methods by surveying 502 university students who were chosen through stratified random sampling. Using structural equation modeling (SEM), student responses were sorted into eight study constructs and analyzed to explain their intentions towards technology use and satisfaction. A significant relationship was found between computer self-efficacy (CSE), subjective norms (SN), and perceived enjoyment (PE), which were significant determinants of perceived ease of use (PEU) and perceived usefulness (PU). PEU, PU, and attitudes towards computer use (ACU) influenced students’ intentions to use (SIU) ICT and students’ satisfaction (SS). The constructs succeeded in explaining usage intentions towards ICT among students and their satisfaction from this usage.

1. Introduction

Information and communication technology (ICT) has had a tremendous influence on aspects of our lives (professional and personal) by improving knowledge sharing and increasing information and communication flow. Ongoing ICT development has led to innumerable challenges for individuals. ICT has transformed work processes in organizations, has caused paradigm shifts in the educational sector, and has changed student learning methods. The former consists of physical telecommunication systems and networks in the form of cellular, voice, mail, radio, and television technologies, whereas the latter consists of the hardware and software required to collect, store, process, and present information [1]. Sarkar [1] brought forward the notion that female empowerment and societal education are primary development strategies, and that technology use in enhanced learning elevates women and unlocks their potential to contribute to society [1].
The core of ICT is comprised of software, hardware, networks, and media, which are primarily utilized to gather, present, process, store, and transmit information via voice, data, text, and images, as well as providing other services. There are two components of ICT, namely Information and Communication Infrastructure (ICI and ICT). The use of an ICT infrastructure in technology-enhanced learning enables efficient educational sustainability using ICT tools and their processes [2]. In many countries, ICT infrastructure availability is one of the main concerns for education [1]. The ultimate influence of ICT on education sustainability is still being discovered [3]. ICT-improved education sustainability is defined as the application of ICT in learning and teaching, which supports learning and teaching processes, delivery mechanisms, and design parameters to enhance knowledge [4].
An answer to this problem is the use of modern ICTs and technology-enhanced learning (TEL) tools in education sustainability while maintaining international standards of education [5]. Evidently, there has been a tremendous contribution from ICT to teaching quality. Such technologies have led to enhanced teaching and learning using dynamic interactive and engaging content and have opened up opportunities for instructions to be individually catered. According to Roztocki and Weistroffer [6], ICT research has not provided an overall view of the current situation, as it mainly focuses on a few developed nations. In general, assessment is an indispensable aspect of teaching, training, and learning.
According to Bennett, Dawson, Bearman, Molloy, and Boud [7], assessment is an important factor for student engagement, as it has a critical impact on both student learning and certification. Despite the ubiquity of ICT applications, there have been few investigations into the contributing dimensions of ICT satisfaction in tertiary education sustainability [8,9]. According to Wu, Tennyson, and Hsia [10], satisfaction is the most recognized measurement of quality and usefulness in teaching and learning.
Despite technology playing a crucial role in promoting efficient instructions, there is evidence that students do not always apply technology in a way that maximizes its effect on teaching and learning [11]. In such a case, satisfaction could be one of the reasons why students are not willing to frequently use ICT in their teaching and research activities in universities. Nevertheless, teachers’ gratification in using ICT in the context of education sustainability has rarely been assessed. Lacking an assessment, it is not clear how best to train and support teachers in effective technology integration in learning and instruction [8].
Therefore, a starting point for assessing and then designing technology integration training is to assess ICT uses and attitudes among students to see to what extent they adopt and are satisfied with using available ICTs. Therefore, this study aims to investigate students’ intentions to use (SIU) ICT (SIU-ICT) as well as their satisfaction with such use. This study backs the Technology Acceptance Model (TAM) literature by investigating the relationship between the TAM variables, SIU-ICT, and students’ satisfaction (SS) with ICT.
Consequently, this study employed eight factors: computer self-efficacy (CSE), subjective norms (SN), perceived enjoyment (PE), perceived ease of use (PEU), perceived usefulness (PU), attitudes towards computer use (ACU), SIU-ICT, and SS; these factors will be explained later in Section 2. This study could be useful for developing and testing theories related to ICT scheme recognition, as well as for practitioners who design and encourage ICT in education sustainability. While the second part of the current study deals with the model development and hypotheses, the third part deals with research methodology and the fourth part deals with the results and analysis, as well as the discussion and implications. The last part of the study is the conclusion and describes future work.

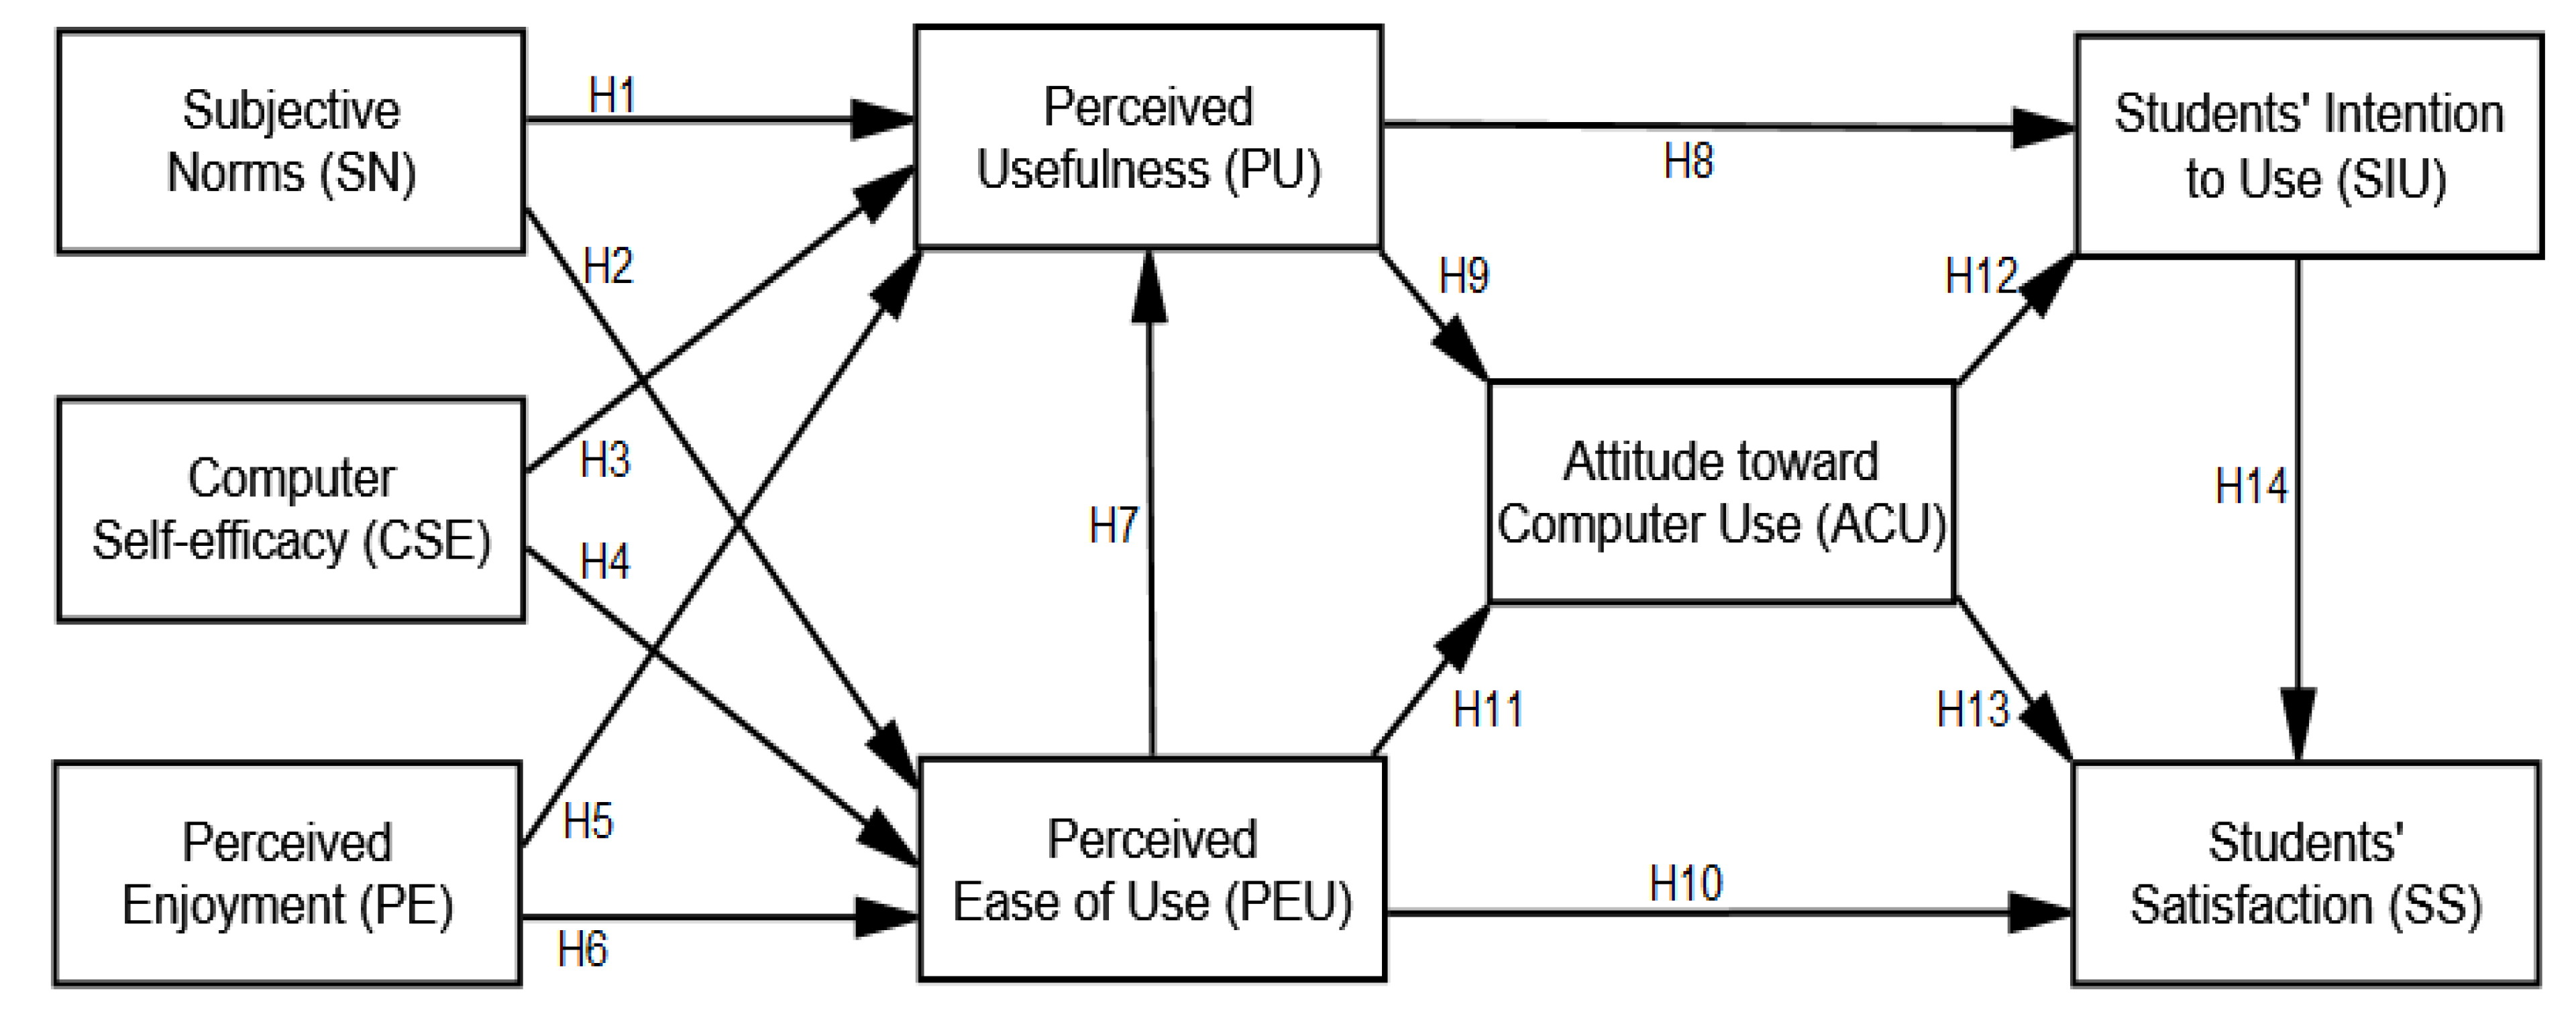
2. Model Development and Hypotheses

The Theory of Planned Behavior (TPB) was proposed by [12] as an extension of the Theory of Reasoned Action (TRA) by [13]. In the TPB, behavioral intentions are influential behavior predictors, as argued by [12], which are influenced by ACU, SN, and perceived behavioral control. Additionally, stemming from the TRA is the Technology Acceptance Model (TAM) of Davis et al. [14], which assesses technology acceptance among users using various technological tools [15,16,17,18]. In this study, the TAM was adopted as the underpinning study framework to tackle the question as to how users accept and use ICT, specifically student ACU, intentions towards ICT usage, and satisfaction. Accordingly, the proposed hypotheses for every construct were developed as described in Section 2.1, Section 2.2, Section 2.3, Section 2.4, Section 2.5, Section 2.6, Section 2.7.

2.1. Subjective Norm (SN)

SNs are an individual’s beliefs on what the people around them think if they would perform or refrain from performing certain behavior [19]. In a study by [17], the authors evidenced a significant effect of SNs on PU, as well as behavioral intentions towards mandatory technology usage. With voluntary technology usage, a significant influence was still noted from SN on PU, but not on behavioral intentions. On the basis of the voluntary case findings, it is proposed that a similar result will occur in this study. The TAM was used by [20] to examine technology acceptance among 284 surveyed individuals, and the findings indicated that SNs significantly predicted PU and PEU, but had no direct influence on intentions towards technology usage, indicating on indirect influence of SNs on intentions towards technology usage via PU and PEU. Hence, this study proposes the following hypotheses:
Hypothesis 1 (H1).
SNs have a significant influence on the PU of technology among students.
Hypothesis 2 (H2).
SNs have a significant influence on the PEU of technology among students.

2.2. Computer Self-Efficacy (CSE)

CSE refers to an individual’s belief in their ability to perform a certain task [21]. In a specific task, performance refers to a function of individual perceived self-efficacy. On the basis of the literature, CSE positively influences PEU and PU [22,23]. The hypothesis proposed for this construct is that perceived self-efficacy concerning ICT use is positively influenced by ICT usefulness and ease of use. In prior findings, such as those of [24,25,26], CSE was found to be a significant predictor of PU. It is argued that if students perceive that they have the capability to use computers, they will tend to use an ICT that allows them to be more productive in completing their tasks (PU). According to Durndell and Haag [27], the greater the CSE level, the better the ACU will be. Thus, this study proposes the following hypotheses:
Hypothesis 3 (H3).
The CSE of students significantly influences their ICT-PU.
Hypothesis 4 (H4).
The CSE of students significantly influences their ICT-PEU.

2.3. Perceived Enjoyment (PE)

PE refers to the level to which an activity offered by a Learning Management System (LMS) is perceived to be pleasant, independently of expected performance outcomes [28]. This construct can be viewed as a form of bi-perspective enjoyment from using ICT with friends and helping others [26]. In this study, the PE of students is defined as the level to which they enjoy using ICT. Thus, this study has the following hypotheses:
Hypothesis 5 (H5).
PE of students from using ICT significantly influences their PU.
Hypothesis 6 (H6).
PE of students for using ICT significantly influences their PEU.

2.4. Perceived Usefulness (PU)

PU is the level to which an individual is convinced that technology use will improve their work performance [14]. In this study, PU is the level to which students consider ICT use as enriching their learning experience. In recent studies, PU was evidenced to influence attitudes towards technology and usage intentions [24,29,30,31]. Owing to the direct influence of PU on attitudes, it is assumed that it will have an indirect influence on intention towards technology usage and, therefore, this study proposes that:
Hypothesis 8 (H8).
PU of ICT significantly influences SIU-ICT.
Hypothesis 9 (H9).
PU of ICT significantly influences students’ ACU.

2.5. Perceived Ease of Use (PEU)

PEU is the level to which a user is convinced that ICT use is effort-free. According to the findings of [14,32], when a technology is viewed as being easy to use, it is likely that individuals will develop a positive attitude towards it [24]. In this study, PEU refers to the level to which a student is convinced that ICT use is both easy and beneficial. While PU addresses a technology’s impact on job performance, perceived ease is a technology’s influence on performance processes [14]. As a consequence, this study proposes the following hypotheses:
Hypothesis 7 (H7).
PEU of ICT significantly influences students’ PU of ICT.
Hypothesis 10 (H10).
PEU of ICT significantly influences SS with ICT.
Hypothesis 11 (H11).
PEU of computers significantly influences students’ ACU.

2.6. Attitude towards Use (ACU)

The literature shows that students’ ACU are influenced by their classroom [33] or by their commitment to and acceptance of their learning tasks [34]. According to Davis et al. [14], PEU and the TAM affect PU, and, in combination, affect user approaches towards ICT usage. In a related study, PEU and PU were considered core signals for virtual course recognition [29,35]. PEU affects learners’ ACU online learning systems (ICT) and their behavioral intentions towards using them. In this study, ACU for ICT use refers to the level to which students are convinced that using ICT enriches their learning, which, in turn, heightens their SIU-ICT. Therefore, this study proposes the following hypotheses:
Hypothesis 12 (H12).
The attitudes of students towards computer use significantly influence their intentions towards ICT use.
Hypothesis 13 (H13).
The attitudes of students towards computer use significantly influence their satisfaction with ICT use.

2.7. Student Intentions to Use ICT

An intention to use ICT refers to the inclination of an individual to use and continue using ICT. SIU-ICT is a determinant of technology use [36,37]. In this study, a student’s intention towards ICT usage was their inclination to use ICT to increase their learning satisfaction. Using ICT for learning is a major element of developmental technology use models [14,32]. In the literature on technology acceptance, an intention towards use represents the inclination of an individual towards using a technology in the near future. It was used as an outcome variable in this study owing to its reliability in predicting actual technology use [24]. Hence, this study proposes the following hypothesis:
Hypothesis 14 (H14).
The intention of students to use ICT significantly influences their satisfaction with its use.

2.8. Students’ Satisfaction (SS) with ICT Usage

In this study, SS with technology use refers to the level to which a technology is aligned with their current values, needs, and experiences [9]. In this study, the satisfaction of students with using ICT for learning stems from the enrichment of such learning. Based on the TAM model of Davis et al. [14], PEU and PU were the primary components of technology acceptance among users. Additionally, based on the TSM model [8], these two antecedents were proven to be powerful enough to measure SS. More importantly, both PEU and PU were deemed to be significant user post-adoption beliefs that led to high levels of satisfaction and ongoing usage intentions [38]. In this regard, Kim [39] revealed that individuals that use ICT view their system interactions in a more positive light and form high intentions towards system use. As the underpinning theory is the TAM, the constructs considered in this study were SN, CSE, and PE, which were used to examine students’ ACU, intentions towards ICT usage, and satisfaction. Overall, the research model was developed to contain and examine SN, CSE, PE, PU, PEU, ACU, SIU-ICT, and satisfaction among students’ see Figure 1.

3. Research Methodology

The use of available ICTs for education sustainability has been encouraged by many universities. Therefore, this research aims to develop a model of measurement of students’ intention to use and their satisfaction through an empirical investigation of students’ acceptance of ICT for education sustainability. The chosen study sample was comprised of undergraduate and postgraduate students (blended learning) that used ICT for learning. The survey items were gauged using a five-point Likert scale ranging from 1 (strongly disagree) to 5 (strongly agree) for items comprised of the TAM constructs and demographic characteristics. Self-administration was adopted for survey distribution, and respondents were requested to provide feedback on the use of ICT, its influence on their satisfaction, and their intention towards using it in the future. The gathered data were then analyzed with the help of the Statistical Package for the Social Sciences (SPSS) and Partial Least Squares–Structural Equation Modeling (PLS-SEM) using Smart PLS 3.0 to confirm both the validity and reliability of the measurement model. For the model’s goodness of fit, factor loadings were employed to ensure construct validity, composite reliability, Cronbach’s alpha, and convergence validity, as recommended by Hair et al. [40].

3.1. Sample Characteristics and Data Collection

For the purpose of the study, we distributed 570 questionnaires, of which 557 were answered. After the manual analysis of the questionnaires, 19 of the 557 questionnaires were incomplete (students did not finish the survey) and had to be dropped, making the remaining number 538. Of the remaining 538 questionnaire copies, 12 had missing data (missing values in the survey) when entered into SPSS, and 24 contained outliers (the data had an abnormal distance from other values in a random sample), making the number of remaining useable questionnaires 502. Such exclusions were recommended by [40], who related that outliers could lead to inaccurate statistical results and have to be eliminated. Of the 502 useable questionnaires, 291 were from female respondents (58.0%), while 211 (42.0%) were from male respondents. In addition, 229 respondents (45.6%) were 18–20 years old, 228 (45.4%) were 21–24 years old, 24 (4.8%) were 25–30 years old, and 21 (4.2%) were 31 years old. For educational level, 13 respondents were undergraduate students in their first year (2.6%), 65 respondents were undergraduate students in their second year (12.9%), 138 respondents were undergraduate students in their third year (27.5%), 137 respondents were undergraduate students in the fourth year (27.3%), and 149 were post-graduate students (master’s students were 13.2% and PhD students were 16.5%). The distribution of respondents based on specialization was as follows: 177 respondents were from science and technology (35.3%), 149 respondents were from the social sciences (29.7%), and 176 respondents were from engineering (35.1%).

3.2. Measurement Instruments

The content validity of the measurement scales was confirmed by the construct items being adopted from prior studies. The study questionnaire was comprised of two parts: Questionnaire items that collected basic demographic data (gender, age, educational level, and specialization) and questionnaire items measuring SN and CSE (four items each; adopted from [41] as well as items measuring PE, PEU, PU, ACU/ICT usage, intentions towards ICT use, and SS (five items each; adopted from the TAM model of [14,17] for 38 total items.

4. Results and Analysis

The reliability of the factors that influenced SS through ICT usage intentions in education sustainability was measured using the Cronbach’s alpha reliability coefficient and was found to be 0.911. Discriminant validity was evaluated on the basis of three conditions: Variable indexes had to be lower than 0.80, as recommended by [40], the Average Variance Extracted (AVE) of each construct had be equal to or greater than 0.5, and the AVE square root of each construct had be higher than the Inter-Construct Correlations (IC) for a factor, as established by [42]. Aside from the above conditions, construct factor analysis outcomes with factor loadings equal to or greater than 0.70 were acceptable (Cronbach’s alpha ≥ 0.70 and composite reliability ≥ 0.70) [40].

4.1. Construct Validity of Measurements

The level to which specific items measure the concept they are developed to measure is referred to as construct validity [40]. This was calculated using a systematic literature review of previously assessed items. Items and their loadings are tabulated in Table 1, where they are expected to load onto the construct that they were developed to measure [15].

4.2. Convergent Validity of Measurements

The factor loadings of 38 items were deemed acceptable as they exceeded 0.70, and their composite reliability generated satisfactory results (above 0.70), ranging from 0.881 to 0.930. Cronbach’s alpha coefficient results ranged from 0.832 to 0.906, which showed satisfactory results. With regards to AVE, values ranged from 0.599 to 0.728. Confirmatory Factor Analysis (CFA) results are listed in Table 2.

4.3. Convergent Validity of Measurements

Discriminant validity refers to differences between sets of concepts and their indicators. All constructs’ discriminant validities were confirmed with values exceeding 0.50 and significant at p = 0.001, a condition established by [42]. The AVE square root shared by a single construct’s items should be lower than the correlations between the items in the two constructs [40] (refer to Table 3 for results).

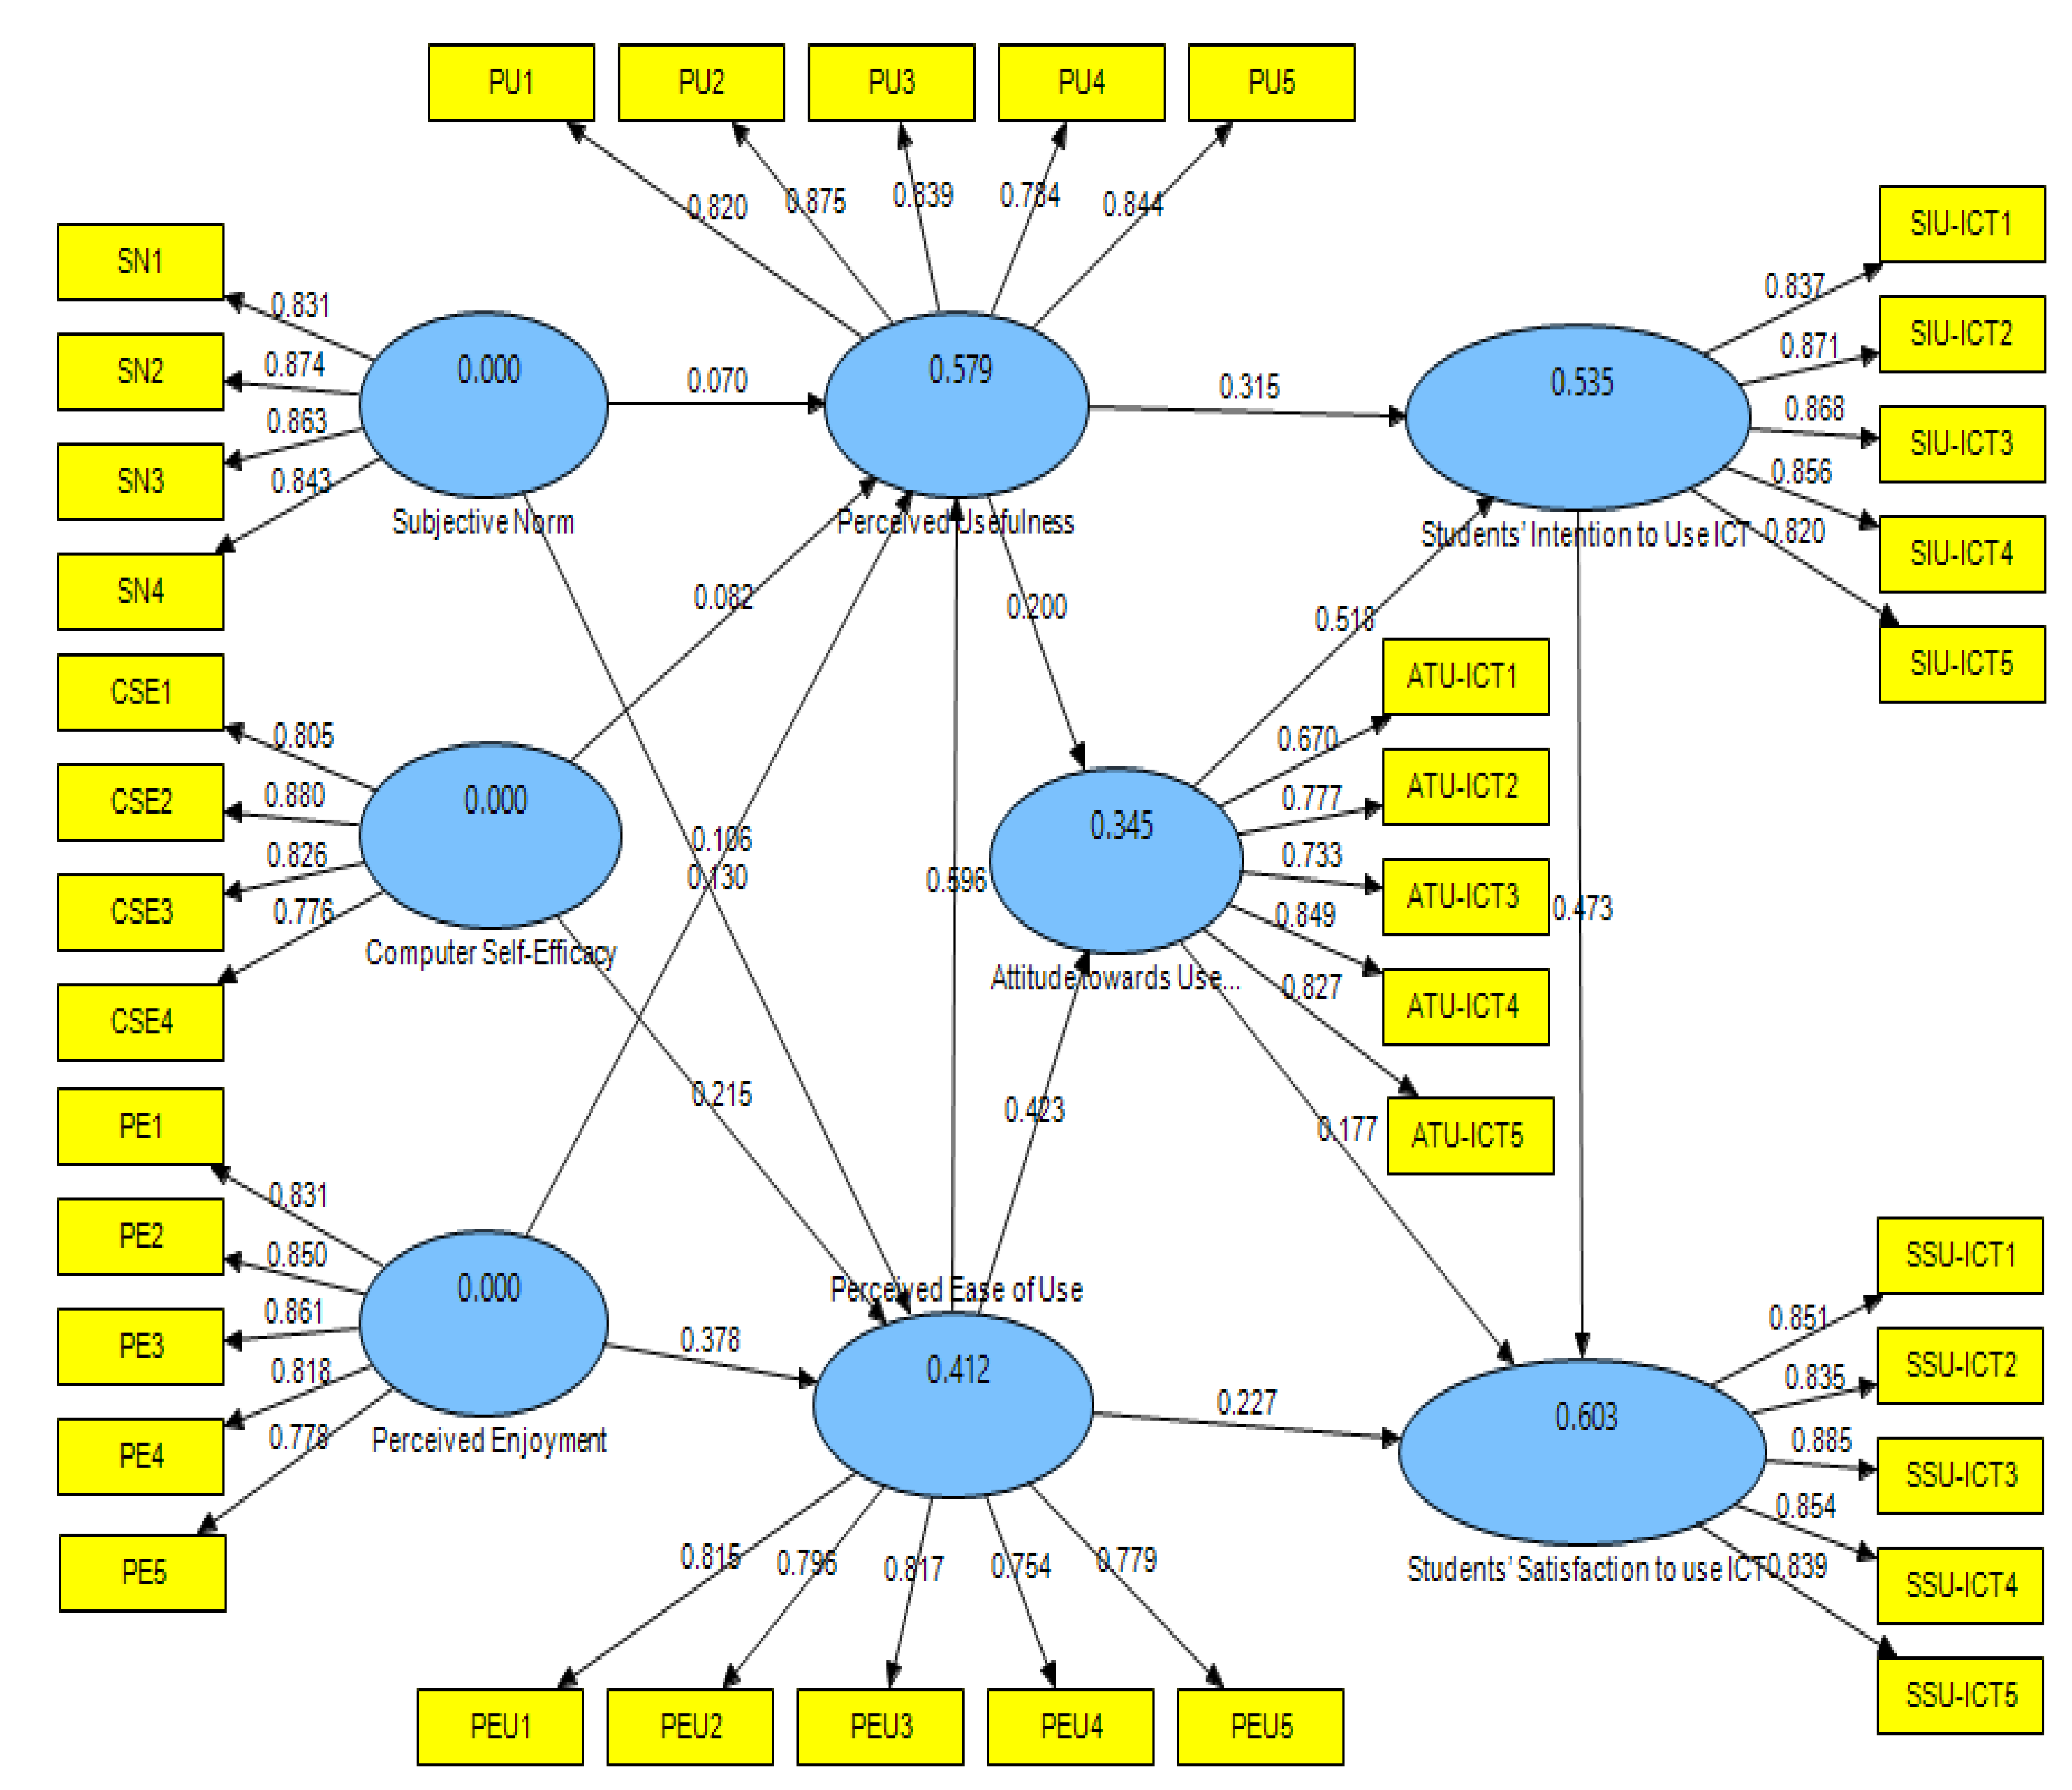
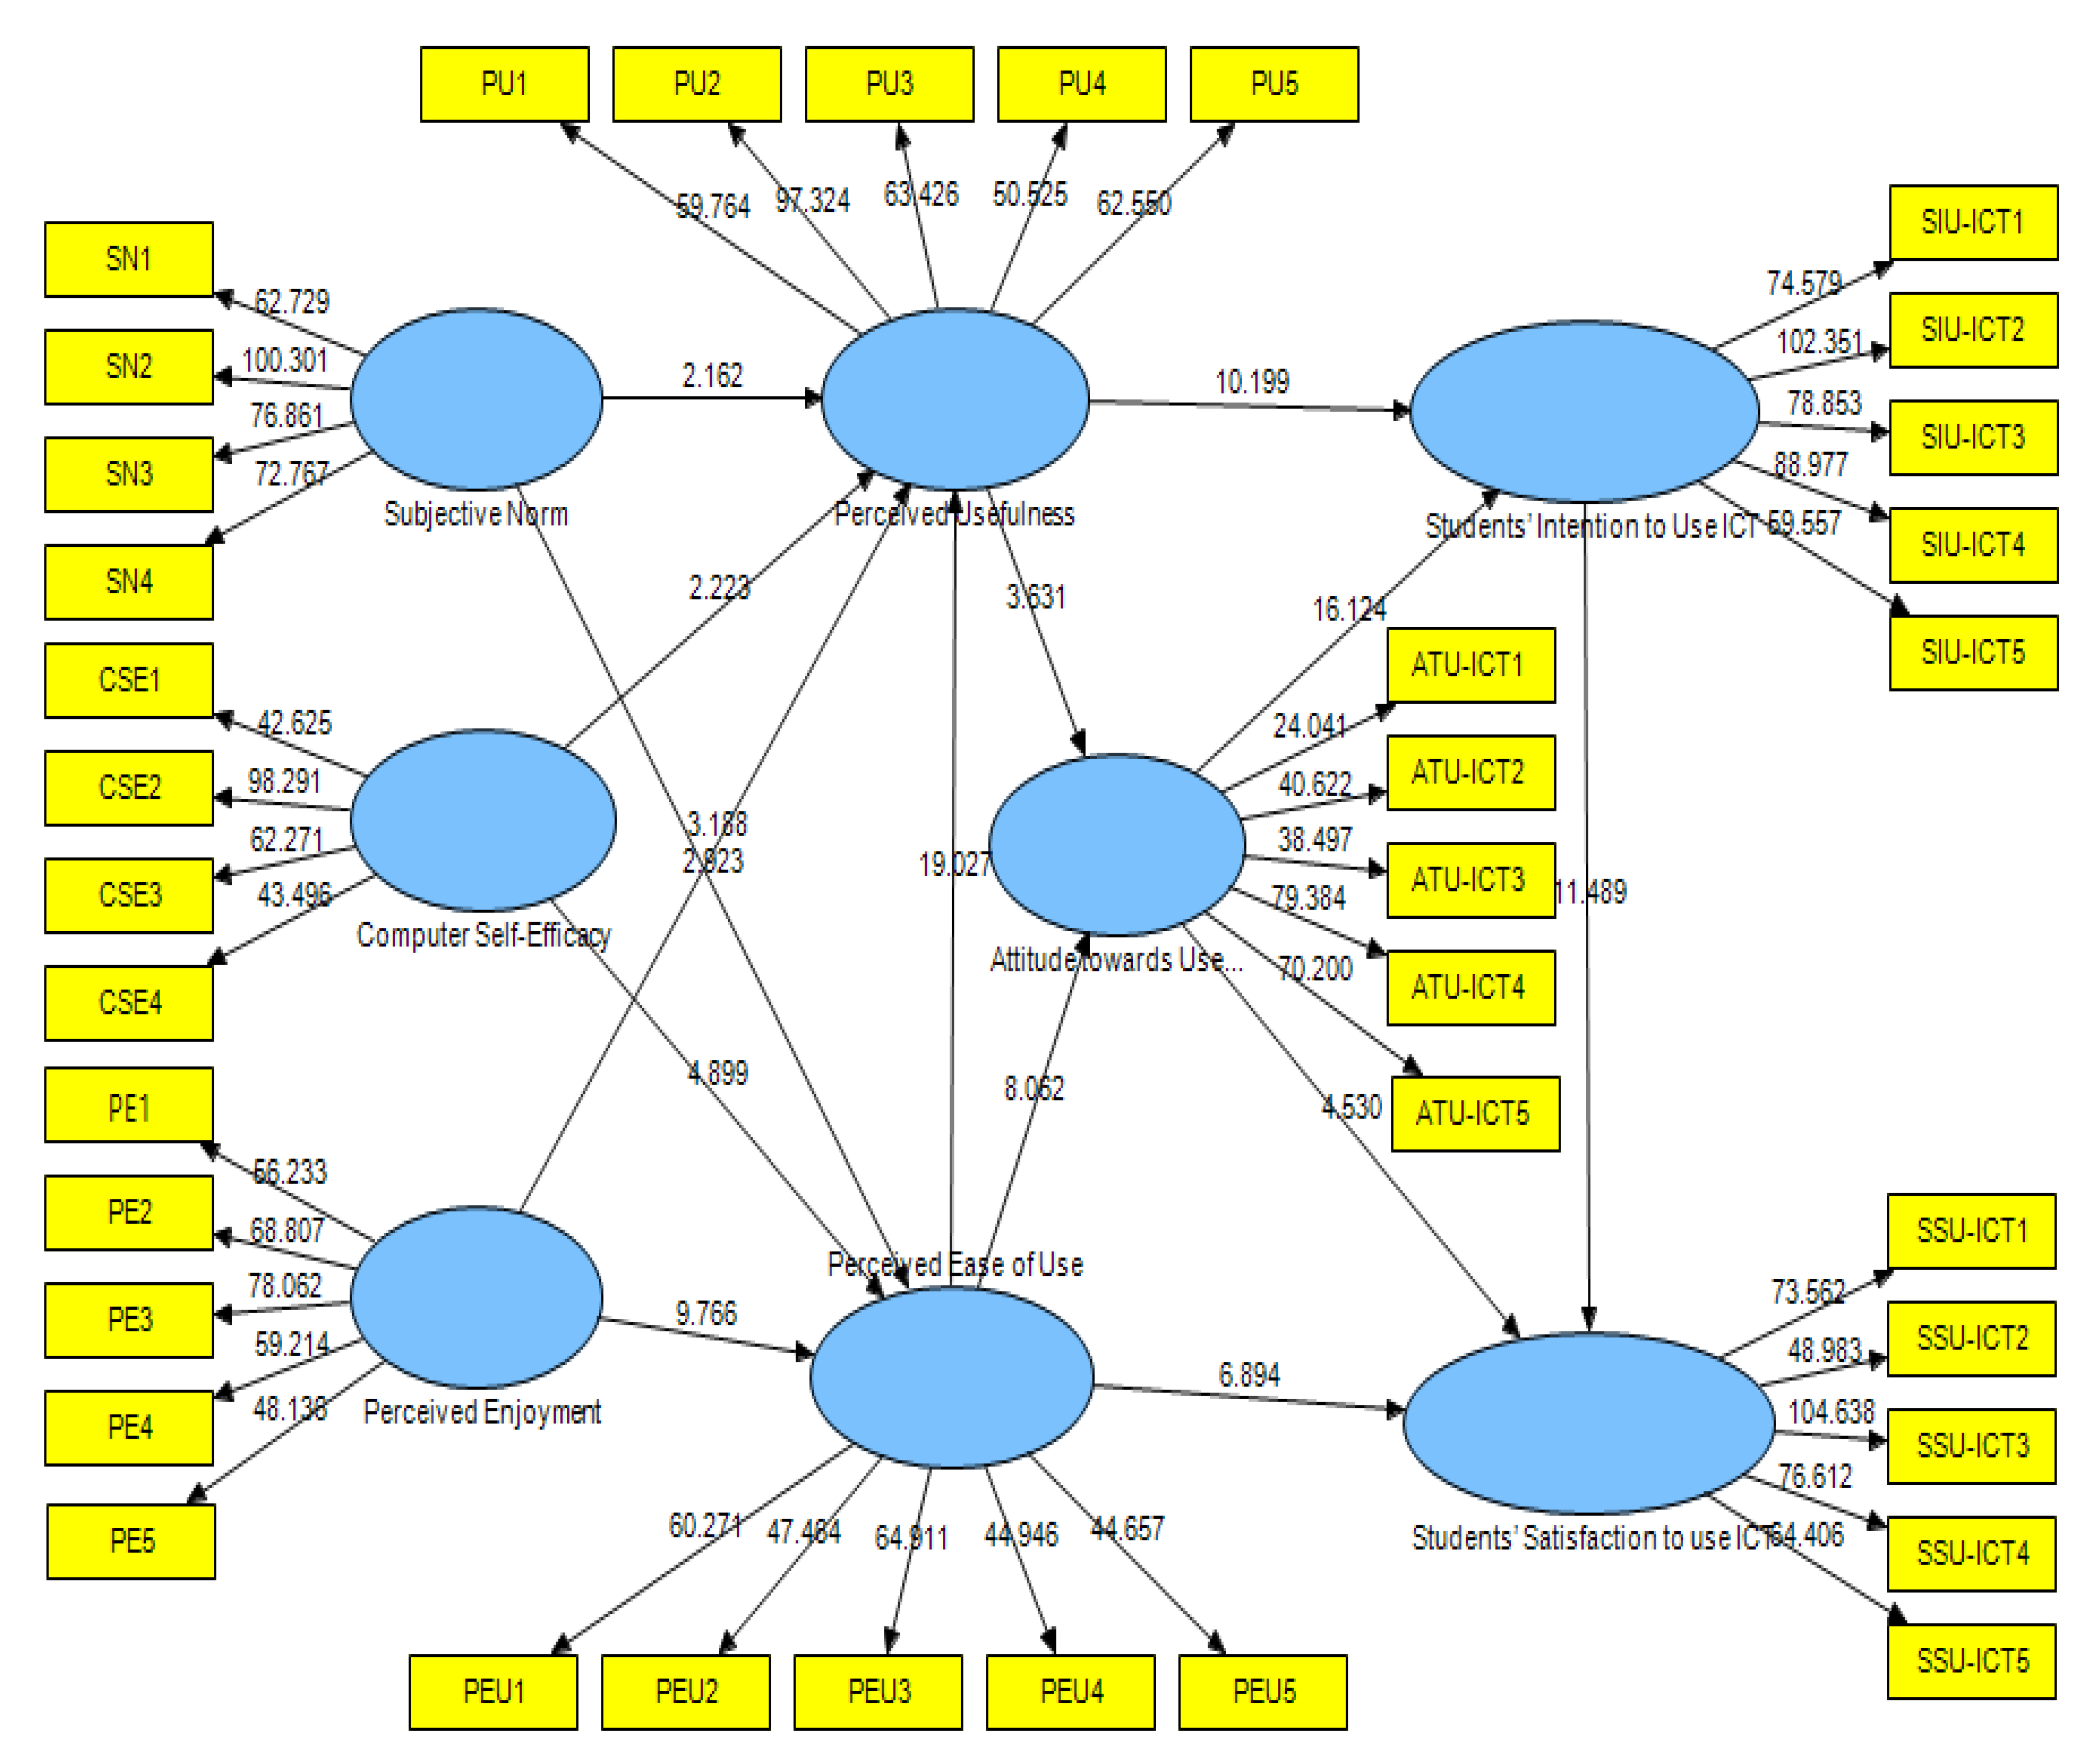
4.4. Analysis of the Structural Model

The research hypotheses were tested and construct relationships were examined using Smart PLS 3.0. The hypothesis development is depicted in Figure 1, path coefficient findings are depicted in Figure 2, and path coefficient (T-Values) findings are depicted in Figure 3.
Figure 3 illustrates that all of the hypotheses concerning the relationships among the eight key constructs were accepted, with the following having the greatest direct influence on ICT; PEU with PU was 19.027, attitude towards ICT use with SS was 16.124, SIU-ICT with SS was 11.489, and PU with SIU-ICT was 10.199 (see Figure 3 and Table 4).
The first hypothesis proposed a relationship between SN and PU. The results showed a positive and significant relationship (β = 0.070, t = 2.162, p < 0.001), indicating support for the first hypothesis (H1). Stated clearly, SNs positively supported ICT-PU. For the second hypothesis (H2), the analysis results showed a positive and significant relationship between SN and PEU (β = 0.130, t = 2.923, p < 0.001), supporting the hypothesis. This indicates that SNs positively support ICT-PEU. For the third hypothesis, it was proposed that CSE and PU has a positive and significant relationship, and the analysis results indicated support at β = 0.082, t = 2.223, and p < 0.001. The same was true for the fourth hypothesis, which proposed a positive and significant relationship between CSE and ICT on PEU, with results of β = 0.215, t = 4.899, and p < 0.001. The next hypothesis predicted a direct effect between PE and PU, and the results of β = 0.106, t = 3.188, and p < 0.001 supported this hypothesis (H5), indicating that PE influenced perceived ICT usefulness among students. The sixth hypothesis (H6) proposed a positive and significant relationship between PE and PEU, and the results showed support for this relationship (β = 0.378, t = 9.766, p < 0.001), indicating that PE positively supported perceived ease of use of ICT. In the next hypothesis (H7), the study proposed a positive relationship between PEU and PU, and the results supported this proposed linkage (β = 0.596, t = 19.027, p < 0.001). This shows that ICT-PEU was supported by PU. In the eighth hypothesis (H8), the relationship between PU and students’ intentions towards ICT use was proposed to be significant and positive, and the results supported this (β = 0.315, t = 10.199, p < 0.001), indicating that the PU of ICT among students supported their usage intentions. Furthermore, a positive and significant relationship was proposed between PU and student ACU-ICT use in the ninth hypothesis (H9), and on the basis of the obtained results (β = 0.200, t = 3.631, p < 0.001), the hypothesis was supported. This shows that the PU of ICT positively supported student ACU-ICT. The tenth hypothesis (H10) assumed that the relationship between ICT-PEU and ICT usage satisfaction among students was positive and significant, and the results supported this hypothesis (β = 0.227, t = 6.894, p < 0.001). In other words, the model correctly predicted that ICT-PEU supported ICT usage satisfaction among students. In the eleventh hypothesis (H11), it was proposed that a positive and significant relationship lies between student ACU-ICT, PEU, and their satisfaction with ICT usage, and the results obtained supported this hypothesis (β = 0.423, t = 8.062, p < 0.001). Stated clearly, the model indicated that ICT-PEU was positively associated with satisfaction with ICT use. The twelfth hypothesis (H12) proposed a positive and significant relationship between student ACU-ICT usage and their intention to use ICT technologies, which was supported by the results (β = 0.518, t = 16.124, p < 0.001). The model thus indicated that student ACU-ICT usage had positively and significantly supported SIU-ICT among students. The thirteenth hypothesis (H13) proposed a positive and significant relationship between student ACU-ICT use and their satisfaction with ICT technologies. The results showed that this hypothesis (H13) was supported at β = 0.177, t = 4.530, and p < 0.001. Stated plainly, the attitudes of students towards ICT use had a positive and significant influence on their satisfaction with using ICT. The last hypothesis (H14) predicted a positive and significant relationship between SIU-ICT and their satisfaction with ICT technologies, and the results supported this relationship at β = 0.373, t = 11.489, and p < 0.001, meaning that student intentions towards ICT use positively influenced their satisfaction with ICT technologies (see Table 4).

4.5. Description and Analysis of Factors

Mean and Standard deviation (SD) are numbers used to tell how measurements for a group are spread out from the average (mean) or expected value. A low standard deviation means that most of the numbers are close to the average. A high standard deviation means that the numbers are more spread out. Therefore, according to the results showed in Table 5, Table 6, Table 7, Table 8, Table 9, Table 10, Table 11 and Table 12, all values were accepted, which means that using available ICTs among university students enhanced academic performance. The numbers mean the following: 1: “Strongly disagree”; 2: “Disagree”; 3: “Neutral”; 4: “Agree”; 5: “Strongly agree”; F: “Frequency”; %: “Percentages”. The results show that the majority of the students agree and strongly agree on SNs for ICT use for education sustainability. Therefore, this study defines SNs as the degree to which a student believes that ICT use would enrich their academic performance (see Table 5).
As shown in Table 6 below, the majority of the students agree and strongly agree that CSE, ease of use, and usefulness influence ICT use for education sustainability. Therefore, this study defines CSE as the degree to which a student believes that ease of use and usefulness of ICT would enrich their academic performance.
The results in Table 7 show that the majority of the students agree and strongly agree on the PE of ICT use for education sustainability. Therefore, this study defines PE as the degree to which a student believes that enjoyment of ICT use would enrich their academic performance.
The results shown in Table 8 indicate that the majority of the students agree and strongly agree on the PEU of ICT for education sustainability. Therefore, this study defines PEU as the degree to which a student believes that the ease of use of ICT would enrich their academic performance”.
The results shown in Table 9 indicate that the majority of the students agree and strongly agree on the PU of ICT for education sustainability. Therefore, this study defines PU as the degree to which a student believes that ICT is useful and would enrich their academic performance.
As shown in Table 10, the majority of the students agree and strongly agree on students’ ACU for ICT use for education sustainability. Therefore, this study defines ACU for ICT use as the degree to which a student believes that ICT is useful and would enrich their academic performance.
The results shown in Table 11 indicate that the majority of the students agree and strongly agree on SIU-ICT for education sustainability. Therefore, this study defines SIU-ICT as the degree to which a student believes that ICT useful and would enrich their academic performance.
The results of the final measurement are shown in Table 12; the majority students agree and strongly agree on students’ satisfaction with ICT use for education sustainability. Therefore, this study defines a student’s satisfaction with ICT use as the degree to which a student is satisfied with and believes that ICT is useful and would enrich their academic performance.

5. Discussion and Implications

This study is one of the first to use the TAM model to examine ICT. On the basis of the proposed model, the results indicated that CSE, SN, and PE significantly determined PEU and PU. Moreover, PEU, PU, and ACU significantly determined SIU-ICT and SS with ICT technologies. The constructs constituted 53.5% variance in SIU-ICT and 60.3% variance in satisfaction with ICT technologies. The results supported the developed research model and the proposed hypotheses. The research findings provide a deeper insight into the use of the TAM constructs SN, CSE, and PE (independent variables), as well as PU and PEU (mediating variables), in the measurement of SIU-ICT and SS with ICT technologies. Based on the findings, several constructs, including SN, CSE, PE, PU, PEU, and usefulness, had a positive and significant relationship with student ACU-ICT use, indicating an increase of their usage intentions and satisfaction with ICT use. Prior studies support these study findings on the significant positive effects of SN, CSE, PE, PU, PEU, ACU, and SS with ICT technologies. It can thus be inferred that before students decide to use ICT, they evaluate its ability to meet their study requirements and its relevance towards their education sustainability. Upon perceiving that ICT is capable of meeting such requirements, students are more likely to consider the technology to be useful [20,24,25,43,44,45]. Undoubtedly, ICTs are both well-known and extensively utilized in education sustainability with students already familiar with ICTs. It goes to show that their PU and PEU significantly influence usage intensions and usage satisfaction. According to the statistical analysis results in Table 4, all hypothesized relationships were supported. Some of hypothesis results opposed those reported in prior literature, such as [24], who reported that CSE significantly and positively influences PU. These mixed findings call for more studies in this area to examine the relationship between the two constructs. In addition, CSE had a significant and positive impact on PU, while SN and PE significantly and positively impacted PU and PEU. This is supported by prior findings from [9,20,24,25].
The TAM posits that PE, PEU, and PU positively and directly influence usage attitudes, usage intentions, and usage satisfaction. This was evidenced in this study in that ICT users were convinced that higher PU and PEU contributed to better ACU-ICT use, which heightened SIU-ICT and satisfaction with such use. The fact that this study reported a positive and direct effect between PEU and PU was supported by [17]. This study revealed that students perceive ICT as easy to use if it is useful towards their studies. If the students are provided opportunities to use ICT, they are likely to perceive it as being easy to use. Therefore, to enhance perceived ease of use, ICT developers should develop systems that are user-friendly and relevant to student education sustainability. In addition, managers should provide students with support in using ICT.
The findings concerning system characteristics clearly indicated that developers, designers, and purchasers of ICT (like institutions of higher learning) should take user needs and values into consideration to guarantee that the system meets student demands. This perceived match between system features and student requirements can enhance ICT adoption. Furthermore, factors like SN, CSE, and PE influence the SIU-ICT among students in an indirect manner. With regards to this study’s implications, this study confirms the acknowledged significance of belief constructs in that ICT-PEU influenced PU, with both belief constructs acting as determinants for ICT use. In other words, ICT has to be perceived as both easy to use and useful for ICT to be adopted. ICT should also be user-friendly and provide clear instructions. The findings also showed the importance of faculty in describing how ICT can be leveraged by students to learn course content, as SS increases ACU-ICT use and usage intentions.
This study provides three major empirical findings: ICT use via PU and PEU; ACU-ICT use via PU and PEU, affecting intentions towards ICT usage and ICT use satisfaction in higher educational institutions; PU and PEU via SN, CSE, and PE, influencing student ACU-ICT use and their SIU-ICT. The findings also provide significant contributions to the TAM in the context of education sustainability [9,14,24,25,46,47]. The growing use of ICT as an instructional medium is changing and will likely continue to change many of the strategies employed by both teachers and students in the learning process [48]. Moreover, many ICT tools are available in the modern world that can be used to create and disseminate knowledge [49]. Using available ICTs is also useful in solving teachers’ and students’ doubts, gaining knowledge of currents events, and also providing global connectivity and competitiveness [50]. In sum, this study’s contributions are as follows:
  • ICT use in learning strategies should boost student usage and SS with ICT. Additionally, support from lecturers and supervisors can motivate students to use ICT as they resolve ambiguities, share knowledge, and provide information to improve students’ learning experiences, performance, and research skills.
  • Higher educational institutions are advised to accept students who are familiar with using ICT for learning as opposed to forcing someone who is not familiar to do so. This is because the institutions need to integrate ICT components and tools throughout the learning process.
  • Students’ ACU-ICT use and their SIU-ICT concern both technology and resources. Opportunities should be leveraged by students to use ICT to enrich their learning experience.
Regardless of the insights provided by this study, it has its own limitations. First, this study’s sample size was limited to a single university and its findings should be interpreted with caution, as behaviors in other universities (private universities, army universities, or other schools) may differ. Another limitation is the use of questionnaires—a qualitative data collection method (interviews or observations). This study’s data were based on student perceptions, which could differ from teacher perceptions, meaning that differences between research fields were not considered. In this regard, future studies can replicate this study in other nations and cultures to resolve its limitations and extend its findings.

Conclusions and Future Work

In the 21st century, ICT plays an important role not only for school students, but also for university students in improving their quality of learning and research activities. However, no study has previously evaluated the students’ intentions to use ICT and their satisfaction. This study was successful in validating the TAM model in education sustainability and provided information on student perceptions on using ICT in education sustainability. The study’s contributions to theory and practice were discussed. This study highlighted the merits of the TAM and provided new information concerning user acceptance and adoption of ICT. It is therefore concluded that the TAM is robust enough to provide results regarding the studied phenomenon, which is student SIU-ICT usage and SS with ICT technologies. The significant contribution of this research is that it may be a useful guideline for researchers, practitioners, system developers, service providers, vendors, and academics to recognize systematic research approaches for model validation in education sustainability, especially by using structural equation modeling. This study used eight innovative TAM model characteristics as significant determinants of ICT adoption. However, mixed results in the literature call for further exploration of the relationship between CSE and PU. With regards to the limitations of the research design and the chosen quantitative approach, future studies can adopt interview techniques to resolve these issues. Moreover, it is recommended that future researchers explore these areas when using this model and cross-validate them in different cultures by including cultural dimensions.

Author Contributions

Conceptualization, W.M.A.-R., N.Y. and A.I.A.; methodology, W.M.A.-R., N.Y. and A.I.A.; software, W.M.A.-R. and Y.B.K.; formal analysis, W.M.A.-R., N.A. and A.I.A. resources, W.M.A.-R., N.Y. and Y.B.K.; writing—original draft preparation, W.M.A.-R., N.Y. and Y.B.K.; writing—review and editing, W.M.A.-R., N.A.Y. and A.I.A. All authors have read and agreed to the published version of the manuscript.

Funding

This work was funded by the Researcher Supporting Project (RSP-2020/157), King Saud University, Riyadh, Saudi Arabia.

Acknowledgments

This work was funded by the Researcher Supporting Project (RSP-2020/157), King Saud University, Riyadh, Saudi Arabia.

Conflicts of Interest

The authors declare no conflict of interest.

References

  1. Sarkar, S. The role of information and communication technology (ICT) in higher education for the 21st century. Sci. Probe 2012, 1, 30–41. [Google Scholar]
  2. Robinson, R.; Michael, M.; Landra, R. Facilitating learning. In Educational Technology: A Definition with Commentary; Routledge: London, UK, 2008; pp. 15–48. [Google Scholar]
  3. Alkharang, M.M. Factors that Influence the Adoption of e-Learning, an Empirical Study in Kuwait. Ph.D. Thesis, School of Information Systems Computing and Mathematics, Brunel University London, Uxbridge, UK, 2014. [Google Scholar]
  4. Kirkwood, A.; Price, L. Technology-enhanced learning and teaching in higher education: What is ‘enhanced’ and how do we know? A critical literature review. Learn. Media Technol. 2014, 39, 6–36. [Google Scholar] [CrossRef]
  5. Sife, A.; Lwoga, E.; Sanga, C. New technologies for teaching and learning: Challenges for higher learning institutions in developing countries. Int. J. Educ. Dev. Using ICT 2007, 3, 57–67. [Google Scholar]
  6. Roztocki, N.; Weistroffer, H.R. Information and communications technology in developing, emerging and transition economies: An assessment of research. Inf. Technol. Dev. 2015, 21, 330–364. [Google Scholar] [CrossRef]
  7. Bennett, S.; Dawson, P.; Bearman, M.; Molloy, E.; Boud, D. How technology shapes assessment design: Findings from a study of university teachers. Br. J. Educ. Technol. 2017, 48, 672–682. [Google Scholar] [CrossRef]
  8. Islam, A.A.; Mok, M.M.C.; Gu, X.; Spector, J.; Hai-Leng, C. ICT in Higher Education: An Exploration of Practices in Malaysian Universities. IEEE Access 2019, 7, 16892–16908. [Google Scholar] [CrossRef]
  9. Islam, A.Y.M.A. Development and Validation of the Technology Adoption and Gratification (TAG) Model in Assessing Teachers’ ICT Use. Ph.D. Thesis, University of Malaya, Kuala Lumpur, Malaya, 2015. [Google Scholar]
  10. Wu, J.; Tennyson, R.D.; Hsia, T.L. A study of student satisfaction in a blended e-learning system environment. Comput. Educ. 2010, 55, 155–164. [Google Scholar] [CrossRef]
  11. Ramlan, J.; Ahmed, E.M. The impact of ICT in Malaysia: A simultaneous equations approach. World J. Sci. Technol. Sustain. Dev. 2010, 7, 61–72. [Google Scholar] [CrossRef]
  12. Ajzen, I. Theory of planned behaviour. Organ. Behav. Hum. Decis. Process 1991, 50, 179–211. [Google Scholar] [CrossRef]
  13. Ajzen, I.; Fishbein, M. The prediction of behavior from attitudinal and normative variables. J. Exp. Soc. Psychol. 1985, 6, 466–488. [Google Scholar] [CrossRef]
  14. Davis, F.D.; Bagozzi, R.P.; Warshaw, P.R. User acceptance of computer technology: A comparison of two theoretical models. Manag. Sci. 1989, 35, 982–1003. [Google Scholar] [CrossRef] [Green Version]
  15. Chow, Y.S.; Teicher, H. Probability Theory: Independence, Interchangeability, Martingales; Springer Science Business Media: Berlin, Germany, 2012. [Google Scholar]
  16. Rauniar, R.; Rawski, G.; Yang, J.; Johnson, B. Technology acceptance model (TAM) and social media usage: An empirical study on Facebook. J. Enterp. Inf. Manag. 2014, 27, 6–30. [Google Scholar] [CrossRef]
  17. Venkatesh, V.; Davis, F.D. A theoretical extension of the technology acceptance model: Four longitudinal field studies. Manag. Sci. 2000, 46, 186–204. [Google Scholar] [CrossRef] [Green Version]
  18. Wallace, L.G.; Sheetz, S.D. The adoption of software measures: A technology acceptance model (TAM) perspective. Inf. Manag. 2014, 51, 249–259. [Google Scholar] [CrossRef]
  19. Fishbein, M.; Ajzen, I. Belief, Attitude, Intension and Behaviour: An Introduction to Theory and Research; Addison Wesley: Reading, MA, USA, 1975. [Google Scholar]
  20. Teo, T. Modelling technology acceptance in education: A study of pre-service teachers. Comput. Educ. 2009, 52, 302–312. [Google Scholar] [CrossRef]
  21. Bandura, A. Self-efficacy mechanism in human agency. Am. Psychol. 1992, 37, 122–147. [Google Scholar] [CrossRef]
  22. Venkatesh, V. Determinants of perceived ease of use: Integrating control, intrinsic motivation, and emotion into the technology acceptance model. Inf. Syst. Res. 2000, 11, 342–365. [Google Scholar] [CrossRef] [Green Version]
  23. Wang, Y.S.; Wang, Y.M.; Lin, H.H.; Tang, T.I. Determinants of user acceptance of Internet banking: An empirical study. Int. J. Serv. Ind. Manag. 2003, 14, 501–519. [Google Scholar] [CrossRef]
  24. Teo, T.; Zhou, M. Explaining the intention to use technology among university students: A structural equation modeling approach. J. Comput. High. Educ. 2014, 26, 124–142. [Google Scholar] [CrossRef]
  25. Macharia, J.K.N.; Pelser, T.G. Key factors that influence the diffusion and infusion of information and communication technologies in Kenyan higher education. Stud. High. Educ. 2012, 39, 695–709. [Google Scholar] [CrossRef]
  26. Hsu, M.K.; Wang, S.W.; Chiu, K.K. Computer attitude, statistics anxiety and self-efficacy on statistical software adoption behaviour: An empirical study of online MBA learners. Comput. Hum. Behav. 2009, 25, 412–420. [Google Scholar] [CrossRef]
  27. Durndell, A.; Haag, Z. Computer self-efficacy, computer anxiety, attitudes towards the internet and reported experience with the internet, by gender, in an east European sample. Comput. Hum. Behav. 2002, 18, 521–535. [Google Scholar] [CrossRef]
  28. Heijden, H.V. User Acceptance of Hedonic Information Systems. MIS Q. 2004, 28, 695–704. [Google Scholar] [CrossRef]
  29. Al-Rahmi, W.M.; Alias, N.; Othman, M.S.; Marin, V.I.; Tur, G. A model of factors affecting learning performance through the use of social media in Malaysian higher education. Comput. Educ. 2018, 121, 59–72. [Google Scholar] [CrossRef]
  30. Al-Rahmi, W.M.; Othman, M.S.; Yusuf, L.M. The effect of social media on researchers’ academic performance through collaborative learning in Malaysian higher education. Mediterr. J. Soc. Sci. 2015, 6, 193–203. [Google Scholar] [CrossRef] [Green Version]
  31. Al-Rahmi, W.M.; Yahaya, N.; Alamri, M.M.; Alyoussef, I.Y.; Al-Rahmi, A.M.; Kamin, Y.B. Integrating innovation diffusion theory with technology acceptance model: Supporting students’ attitude towards using a massive open online courses (MOOCs) systems. Interact. Learn. Environ. 2019, 1–13. [Google Scholar] [CrossRef]
  32. Venkatesh, V.; Morris, M.G.; Davis, G.B.; Davis, F.D. User acceptance of information technology: Toward a unified view. MIS Q. 2003, 27, 425–478. [Google Scholar] [CrossRef] [Green Version]
  33. Fabunmi, M.P.B.A.; Isaiah, A.A. Class factors as determinants of secondary school student’s academic performance in Oyo State, Nigeria. J. Soc. Sci. 2007, 14, 243–247. [Google Scholar] [CrossRef]
  34. Riaz, A.; Riaz, A.; Hussain, M. Students’ acceptance and commitment to e- learning: Evidence from Pakistan. J. Educ. Soc. Res. 2011, 1, 21–30. [Google Scholar]
  35. Tan, P.J.B. An empirical study of how the learning attitudes of college students toward English e-tutoring websites affect site sustainability. Sustainability 2019, 11, 1748. [Google Scholar] [CrossRef] [Green Version]
  36. Venkatesh, V.; Thong, J.Y.; Xu, X. Consumer acceptance and use of information technology: Extending the unified theory of acceptance and use of technology. MIS Q. 2012, 36, 157–178. [Google Scholar] [CrossRef] [Green Version]
  37. Al-Rahmi, W.M.; Yahaya, N.; Alamri, M.M.; Aljarboa, N.A.; Kamin, Y.B.; Saud, M.S.B. How Cyber Stalking and Cyber Bullying Affect Students’ Open Learning. IEEE Access 2019, 7, 20199–20210. [Google Scholar] [CrossRef]
  38. Pelling, E.; White, K. The theory of planned behavior applied to young people’s use of social networking web sites. CyberPsychol. Behav. 2009, 12, 755–779. [Google Scholar] [CrossRef] [PubMed] [Green Version]
  39. Kim, B. Understanding antecedents of continuance intention in social-networking services. CyberPsychology Behav. Soc. Netw. 2011, 14, 199–205. [Google Scholar] [CrossRef] [PubMed]
  40. Hair, J.F.; Sarstedt, M.; Ringle, C.M.; Mena, J.A. An assessment of the use of partial least squares structural equation modeling in marketing research. J. Acad. Mark. Sci. 2012, 40, 414–433. [Google Scholar] [CrossRef]
  41. Compeau, D.R.; Higgins, C.A. Computer self-efficacy: Development of a measure and initial test. MIS Q. 1995, 19, 189–211. [Google Scholar] [CrossRef] [Green Version]
  42. Fornell, C.; Larcker, D.F. Evaluating structural equation models with unobservable variables and measurement error. J. Mark. Res. 1981, 18, 39–50. [Google Scholar] [CrossRef]
  43. Fan, R.J.D.; Tan, P.J.B. Application of Information Technology in Preschool Aesthetic Teaching from the Perspective of Sustainable Management. Sustainability 2019, 11, 2179. [Google Scholar] [CrossRef] [Green Version]
  44. Al-Rahmi, W.M.; Othman, M.S.; Yusuf, L.M. Social media for collaborative learning and engagement: Adoption framework in higher education institutions in Malaysia. Mediterr. J. Soc. Sci. 2015, 6, 246–252. [Google Scholar] [CrossRef] [Green Version]
  45. Al-Rahmi, W.M.; Yahaya, N.; Aldraiweesh, A.A.; Alamri, M.M.; Aljarboa, N.A.; Alturki, U.; Aljeraiwi, A.A. Integrating Technology Acceptance Model with Innovation Diffusion Theory: An Empirical Investigation on students’ Intention to use E-Learning Systems. IEEE Access 2019, 7, 26797–26809. [Google Scholar] [CrossRef]
  46. Al-Rahmi, W.M.; Othman, M.S.; Yusuf, L.M. Using Social Media for Research: The Role of Interactivity, Collaborative Learning, and Engagement on the Performance of Students in Malaysian Post-Secondary Institutes. Mediterr. J. Soc. Sci. 2015, 6, 536–546. [Google Scholar] [CrossRef] [Green Version]
  47. Al-Rahmi, W.M.; Othman, M.S.; Yusuf, L.M. Effect of Engagement and Collaborative Learning on Satisfaction Through the use of Social Media on Malaysian Higher Education. Res. J. Appl. Sci. Eng. Technol. 2015, 9, 1132–1142. [Google Scholar] [CrossRef]
  48. Bala, M. Use of ICT in Higher Education. Multidisciplinary Higher Education. In Research Dynamics and Concepts; Swaranjali Publication: Perth, Australia, 2018; pp. 368–376. [Google Scholar]
  49. Agrawal, A.K.; Mittal, G.K. The Role of ICT in Higher Education. In Multidisciplinary Higher Education, Research, Dynamics and Concepts; Swaranjali Publication: Perth, Australia, 2018; pp. 76–83. [Google Scholar]
  50. Dave, D.D. An Analytical Study of the Role of ICT in Higher Education. J. Glob. Econ. 2019, 15, 56–61. [Google Scholar]
Figure 1. Research model and hypotheses.
Sustainability 12 05052 g001
Figure 2. Path coefficient results.
Sustainability 12 05052 g002
Figure 3. Path coefficients’ T-values.
Sustainability 12 05052 g003
Table 1. Loadings and cross-loadings of items.
NoFactorsCodeSNCSEPEPUPEUATU-ICTSIU-ICTSSU-ICT
1Subjective NormsSN10.8310.5620.4930.4120.4250.5240.5070.413
2SN20.8740.6470.5570.4570.4610.5770.5620.535
3SN30.8630.5780.5110.3880.4190.5590.5120.511
4SN40.8430.6030.5150.4330.4390.5950.5290.563
5Computer Self-EfficacyCSE10.5190.8050.4740.3920.4250.4880.5760.492
6CSE20.6220.8800.5870.4510.4770.5620.6220.576
7CSE30.6220.8260.6060.4540.4750.5950.6090.568
8CSE40.5390.7760.4640.4410.4380.4990.5700.553
9Perceived EnjoymentPE10.5270.5250.8310.3820.4350.6130.5140.409
10PE20.5000.5050.8500.4150.4490.6420.5140.454
11PE30.4880.5160.8610.4070.4360.6240.5190.414
12PE40.4780.5390.8180.4670.4720.5980.4900.408
13PE50.5150.5800.7780.5770.6180.6410.5550.539
14Perceived UsefulnessPU10.4370.4700.5040.8200.6080.4580.4880.468
15PU20.4030.4330.5020.8750.6400.4810.5120.502
16PU30.3910.4410.4540.8390.5840.4090.4800.493
17PU40.4240.4220.4270.7840.6230.3870.4710.457
18PU50.4150.4390.4330.8440.6260.3950.4640.488
19Perceived Ease of UsePEU10.3500.4640.4840.6670.8150.4610.5640.553
20PEU20.4750.4160.4220.6220.7960.3890.4860.512
21PEU30.3750.4540.5330.5700.8170.4750.5140.461
22PEU40.4060.4210.4290.5080.7540.4460.4980.471
23PEU50.4370.4340.4960.5560.7790.4910.4520.490
24Attitude towards ICT UseATU-CT10.4400.4430.6300.3200.3830.6700.4600.390
25ATU-CT20.5620.4970.6350.3460.4130.7770.4970.409
26ATU-CT30.4010.4600.4560.2980.3690.7330.4270.433
27ATU-CT40.5840.5580.6010.4570.4680.8490.6100.576
28ATU-CT50.5510.5550.6170.5150.5460.8270.5980.577
29Students’ Intentions to Use ICTSIU-ICT10.4900.5890.5150.4830.5270.5480.8370.592
30SIU-ICT20.5240.6320.5380.5190.5770.5980.8710.673
31SIU-ICT30.5350.6310.5200.4900.5400.5690.8680.645
32SIU-ICT40.5290.6230.5640.5200.5270.5950.8560.633
33SIU-ICT50.5580.5990.5520.4540.5300.5770.8200.588
34Students’ Satisfaction with ICT UseSSU-ICT10.4790.5750.4640.5230.5560.5420.6670.851
35SSU-ICT20.5330.5570.4950.5030.5650.5410.6200.835
36SSU-ICT30.5450.5940.4720.5010.5360.5320.6530.885
37SSU-ICT40.4980.5730.4500.4890.5230.5420.6030.854
38SSU-ICT50.4790.5460.4550.4450.4980.5190.5970.839
Table 2. Constructs, items, and Confirmatory Factor Analysis results.
NoFactorsCodeFactors LoadingCronbach’s AlphaAVEComposite ReliabilityR-Square
1Subjective NormsSN10.8310.8700.7270.9140.000
2SN20.874
3SN30.863
4SN40.843
5Computer Self-EfficacyCSE10.8050.8400.6770.8930.000
6CSE20.880
7CSE30.826
8CSE40.776
9Perceived EnjoymentPE10.8310.8860.6860.9160.000
10PE20.850
11PE30.861
12PE40.818
13PE50.778
14Perceived UsefulnessPU10.8200.8890.6940.9190.579
15PU20.875
16PU30.839
17PU40.784
18PU50.844
19Perceived Ease of UsePEU10.8150.8520.6280.8940.412
20PEU20.796
21PEU30.817
22PEU40.754
23PEU50.779
24Attitude towards ICT UseATU-ICT10.6700.8320.5990.8810.345
25ATU-ICT20.777
26ATU-ICT30.733
27ATU-ICT40.849
28ATU-ICT50.827
29Students’ Intentions to Use ICTSIU-ICT10.8370.9040.7230.9290.535
30SIU-ICT20.871
31SIU-ICT30.868
32SIU-ICT40.856
33SIU-ICT50.820
34Students’ Satisfaction with ICT UseSSU-ICT10.8510.9060.7280.9300.603
35SSU-ICT20.835
36SSU-ICT30.885
37SSU-ICT40.854
38SSU-ICT50.839
Table 3. Discriminant validity.
NoFactors12345678
1Subjective Norms0.915
2Computer Self-Efficacy0.3820.893
3Perceived Enjoyment0.4370.4110.911
4Perceived Usefulness0.5320.5430.5980.899
5Perceived Ease of Use0.4340.4810.5480.4060.874
6Attitudes towards ICT Use0.3880.5010.3590.5410.5270.909
7Students’ Intentions to Use ICT0.3200.4580.3970.5090.4680.4990.893
8Students’ Satisfaction with ICT Use0.5460.3490.3910.4760.5120.5030.4920.907
Table 4. Hypothesis testing results of the structural model.
HIndependentRelationshipDependentPathS.E.T. ValueResult
H1SN Sustainability 12 05052 i001PU0.0700.0322.162Supported
H2SN Sustainability 12 05052 i001PEU0.1300.0462.923Supported
H3CSE Sustainability 12 05052 i001PU0.0820.0372.223Supported
H4CSE Sustainability 12 05052 i001PEU0.2150.0444.899Supported
H5PE Sustainability 12 05052 i001PU0.1060.0333.188Supported
H6PE Sustainability 12 05052 i001PEU0.3780.0399.766Supported
H7PEU Sustainability 12 05052 i001PU0.5960.03119.027Supported
H8PU Sustainability 12 05052 i001SIU-ICT0.3150.03110.199Supported
H9PU Sustainability 12 05052 i001ATU-ICT0.2000.0553.631Supported
H10PEU Sustainability 12 05052 i001SSU-ICT0.2270.0336.894Supported
H11PEU Sustainability 12 05052 i001ATU-ICT0.4230.0538.062Supported
H12ATU-ICT Sustainability 12 05052 i001SIU-ICT0.5180.03216.124Supported
H13ATU-ICT Sustainability 12 05052 i001SSU-ICT0.1770.0394.530Supported
H14SIU-ICT Sustainability 12 05052 i001SSU-ICT0.3730.04111.489Supported
Note: S.E: standard error.
Table 5. Measuring subjective norms (SNs) for information and communication technology (ICT) use.
VariableCode12345MeanSD
f (%)f (%)f (%)f (%)f (%)
Subjective NormsSN 112 (2.4)18 (3.6)79 (15.7)223 (44.4)170 (33.9)3.680.866
SN 212 (2.4)38 (7.6)59 (11.8)207 (41.2)186 (37.1)3.520.884
SN 38 (1.6)27 (5.4)76 (15.1)235 (46.8)156 (31.1)3.690.850
SN 414 (2.8)52 (10.4)78 (15.5)201 (40.0)157 (31.3)3.550.967
Table 6. Measuring computer self-efficacy (CSE) for ICT use.
VariableCode12345MeanSD
f (%)f (%)f (%)f (%)f (%)
Computer Self-EfficacyCSE 17 (1.4)32 (6.4)67 (13.3)214 (42.6)182 (36.3)3.600.848
CSE 211 (2.2)33 (6.6)90 (17.9)205 (40.8)163 (32.5)3.660.912
CSE 33 (0.6)35 (7.0)76 (15.1)189 (37.6)199 (39.6)3.600.848
CSE 44 (0.8)30 (6.0)65 (12.9)219 (43.6)184 (36.7)3.620.814
Table 7. Measuring perceived enjoyment (PE) of ICT use.
VariableCode12345MeanSD
f (%)f (%)f (%)f (%)f (%)
Perceived EnjoymentPE 110 (2.0)18 (3.6)109 (21.7)217 (43.2)148 (29.5)3.790.890
PE 25 (1.0)44 (8.8)69 (13.7)205 (40.8)179 (35.7)3.580.869
PE 36 (1.2)31 (6.2)67 (13.3)207 (41.2)191 (38.0)3.590.840
PE 46 (1.2)40 (8.0)87 (17.3)206 (41.0)163 (32.5)3.650.898
PE 513 (2.6)32 (6.4)77 (15.3)204 (40.6)176 (35.1)3.600.912
Table 8. Measuring perceived ease of use (PEU) of ICT.
VariableCode12345MeanSD
f (%)f (%)f (%)f (%)f (%)
Perceived Ease of UsePEU 15 (1.0)13 (2.6)86 (17.1)253 (50.4)145 (28.9)4.040.808
PEU 23 (0.6)12 (2.4)105 (20.9)248 (49.4)134 (26.7)3.880.782
PEU 39 (1.8)25 (5.0)107 (21.3)229 (45.6)132 (26.3)3.800.893
PEU 410 (2.0)23 (4.6)102 (20.3)237 (47.2)130 (25.9)3.790.885
PEU 510 (2.0)23 (4.6)103 (20.5)235 (46.8)131 (26.1)3.790.887
Table 9. Measuring the perceived usefulness (PU) of ICT use.
VariableCode12345MeanSD
f (%)f (%)f (%)f (%)f (%)
Perceived UsefulnessPU 18(1.6)16(3.2)96(19.1)236(47.0)146(29.1)3.990.869
PU 28(1.6)35(7.0)68(13.5)197(39.2)194(38.6)3.560.869
PU 36(1.2)16(3.2)93(18.5)251(50.0)136(27.1)3.810.811
PU 46(1.2)16(3.2)105(20.9)255(50.8)120(23.9)3.870.817
PU 511(2.2)15(3.0)96(19.1)240(47.8)140(27.9)3.790.862
Table 10. Measuring attitudes towards computer use (ACU) for ICT use.
VariableCode12345MeanSD
f (%)f (%)f (%)f (%)f (%)
Attitudes towards ICT UseATU-CT14 (0.8)16 (3.2)117 (23.3)234 (46.6)131 (26.1)3.880.825
ATU-CT21 (0.2)24 (4.8)92 (18.3)263 (52.4)122 (24.3)3.840.781
ATU-CT34 (0.8)15 (3.0)114 (22.7)240 (47.8)129 (25.7)3.890.815
ATU-CT45 (1.0)26 (5.2)99 (19.7)232 (46.2)140 (27.9)3.780.853
ATU-CT56 (1.2)12 (2.4)105 (20.9)232 (46.2)145 (28.9)3.840.822
Table 11. Measuring students’ intentions to use (SIU) ICT.
VariableCode12345MeanSD
f (%)f (%)f (%)f (%)f (%)
Students’ Intentions to Use ICTSIU-ICT12 (0.4)24 (4.8)92 (18.3)245 (48.8)139 (27.7)3.800.805
SIU-ICT28 (1.6)22 (4.4)70 (13.9)203 (40.4)199 (39.6)3.600.839
SIU-ICT36 (1.2)23 (4.6)83 (16.5)219 (34.6)171 (34.1)3.700.841
SIU-ICT46 (1.2)22 (4.4)106 (21.1)238 (47.4)130 (25.9)3.830.852
SIU-ICT56 (1.2)17 (3.4)117 (23.3)233 (46.4)129 (25.7)3.870.847
Table 12. Measuring students’ satisfaction with using ICT.
VariableCode12345MeanSD
f (%)f (%)f (%)f (%)f (%)
Student’s SatisfactionSSU-ICT 118 (3.6)23 (4.6)83 (16.5)213 (42.4)165 (32.9)3.640.933
SSU-ICT 221 (4.2)29 (5.8)65 (12.9)215 (42.8)172 (34.3)3.550.935
SSU-ICT 313 (2.6)32 (6.4)69 (13.7)201 (40.0)187 (37.3)3.560.898
SSU-ICT 49 (1.8)27 (5.4)72 (14.3)245 (48.8)149 (29.7)3.690.848
SSU-ICT 513 (2.6)30 (6.0)74 (14.7)215 (42.8)170 (33.9)3.610.899

