Radon Concentrations in Raw Water and Treated Water Used for Bottled Water in South Korea

1
Groundwater Research Center, Geologic Environment Division, Korea Institute of Geoscience and Mineral Resources, Daejeon 34142, Korea
2
Geoscience Data Center, Geoscience Platform Division, Korea Institute of Geoscience and Mineral Resources, Daejeon 34142, Korea
3
Department of Earth and Environmental Sciences, Andong National University, Andong 36729, Korea
*
Author to whom correspondence should be addressed.
Sustainability 2020, 12(13), 5313; https://0-doi-org.brum.beds.ac.uk/10.3390/su12135313
Submission received: 3 June 2020
/
Revised: 24 June 2020
/
Accepted: 26 June 2020
/
Published: 1 July 2020
(This article belongs to the Special Issue Characterization of Contaminated Groundwater Site and Numerical Simulation and Analytical Solution of Contaminants Transport and Fate in Groundwater)
Abstract
:Radon concentrations in the raw water and treated water used for 59 brands of bottled water produced in South Korea were analysed. The radon levels in 59 raw water samples ranged from 3.7 to 476.8 Bq/L, with a geometric mean of 49.0 Bq/L. The mean radon levels in raw water samples were high in Jurassic granite aquifers and low in volcanic rock aquifers. However, the maximum radon levels were observed in metamorphic rock aquifers. The concentrations in 55 treated water samples ranged from 0.1 to 239.4 Bq/L, with a geometric mean of 7.7 Bq/L. In treated water, radon levels decreased by 16.0–98.9% (average, 74.9%) due mainly to storage in water tanks and treatment with granular activated carbon (GAC) filters. The radon levels in raw water and treated water samples exceeded the US EPA alternative maximum contaminant level (AMCL) of 148 Bq/L by 16.9% and 1.8%, respectively. Considering the radon reduction rate, it is anticipated that the radon concentrations in bottled water in stores will not exceed 148 Bq/L because it takes about 1–2 weeks for treated water to reach the customer as bottled water.
1. Introduction
Radon is a colourless, odourless, inert gas that has a half-life of 3.8 days. Direct ingestion of groundwater with high concentrations of radon can increase the risk of developing stomach cancer [1]. Due to the health risks of radon, many countries have begun conducting research on groundwater radon and have established proposed drinking water limits according to the research results. Research on groundwater radon has revealed that concentrations are high in granite and granite gneiss and low in volcanic and sedimentary rocks [2,3]. To date, the highest measured radon concentration in groundwater in the world is 77,500 Bq/L [4].
The production and sales of bottled water have been steadily increasing worldwide [5,6]. Because sources of bottled water originate from groundwater, there have been concerns about radon. Most studies have focused on the radon concentrations in bottled water and their effective dose in the human body [7,8]. However, the concentrations in bottled water depend on when analyses are carried out after the bottled water is released to the market. In other words, the radon concentrations in bottled water are only meaningful at the time the final bottled water products reach the consumers. Because of these circumstances, Todorovic et al. [9] investigated temporal variation in radon concentrations in bottled water of various sizes from the bottling date.
In Korea, bottled water comprises natural mineral water originating from groundwater. The production rate of bottled water has been increasing continuously since the establishment of the Water Control Act in May 1995. The market values of bottled water were $140 million in 2000 and $450 million in 2013, and it has been estimated that the value will be $910 million in 2020 [10]. However, because many bottled water companies in Korea are located on granite and granite gneiss, it is expected that radon levels in some brands of bottled water will be be high [11]. Furthermore, it has been required to monitor radon levels as part of national drinking water standards since January 2019, and it is highly probable that a threshold radon concentration (148 Bq/L) will be proposed as one of the water quality standards for drinking water based on the results of a three-year observational study. Therefore, it is necessary to evaluate the degree of radon concentrations in bottled water in Korea. The radon concentration in treated water can be reduced by storage in water tanks and by using a granular activated carbon (GAC) filter. Although the water treatment process of each company can vary slightly due to water quality and hydraulic conditions, it usually includes 3–6 steps of filtration [12]. If we know the radon concentrations in raw water and treated water, it is possible to estimate the concentrations in bottled water at the time it reaches consumers. Shin et al. [12] analysed the water from 13 bottled water companies in Korea and compared the radon concentrations in raw water and treated water samples.
However, an investigation of the radon concentrations in raw and treated waters produced by all the bottled water companies in Korea has yet to be conducted. Therefore, as the first nationwide study on Korean bottled water, we determined the radon concentrations in the raw water and treated water from 59 bottled water companies in Korea and evaluated the variation in radon concentrations in the raw water according to rock types. The results of this study provide safety information pertaining to the radon concentrations in raw, treated, and bottled water produced in Korea.
2. Materials and Methods
2.1. Study Sites
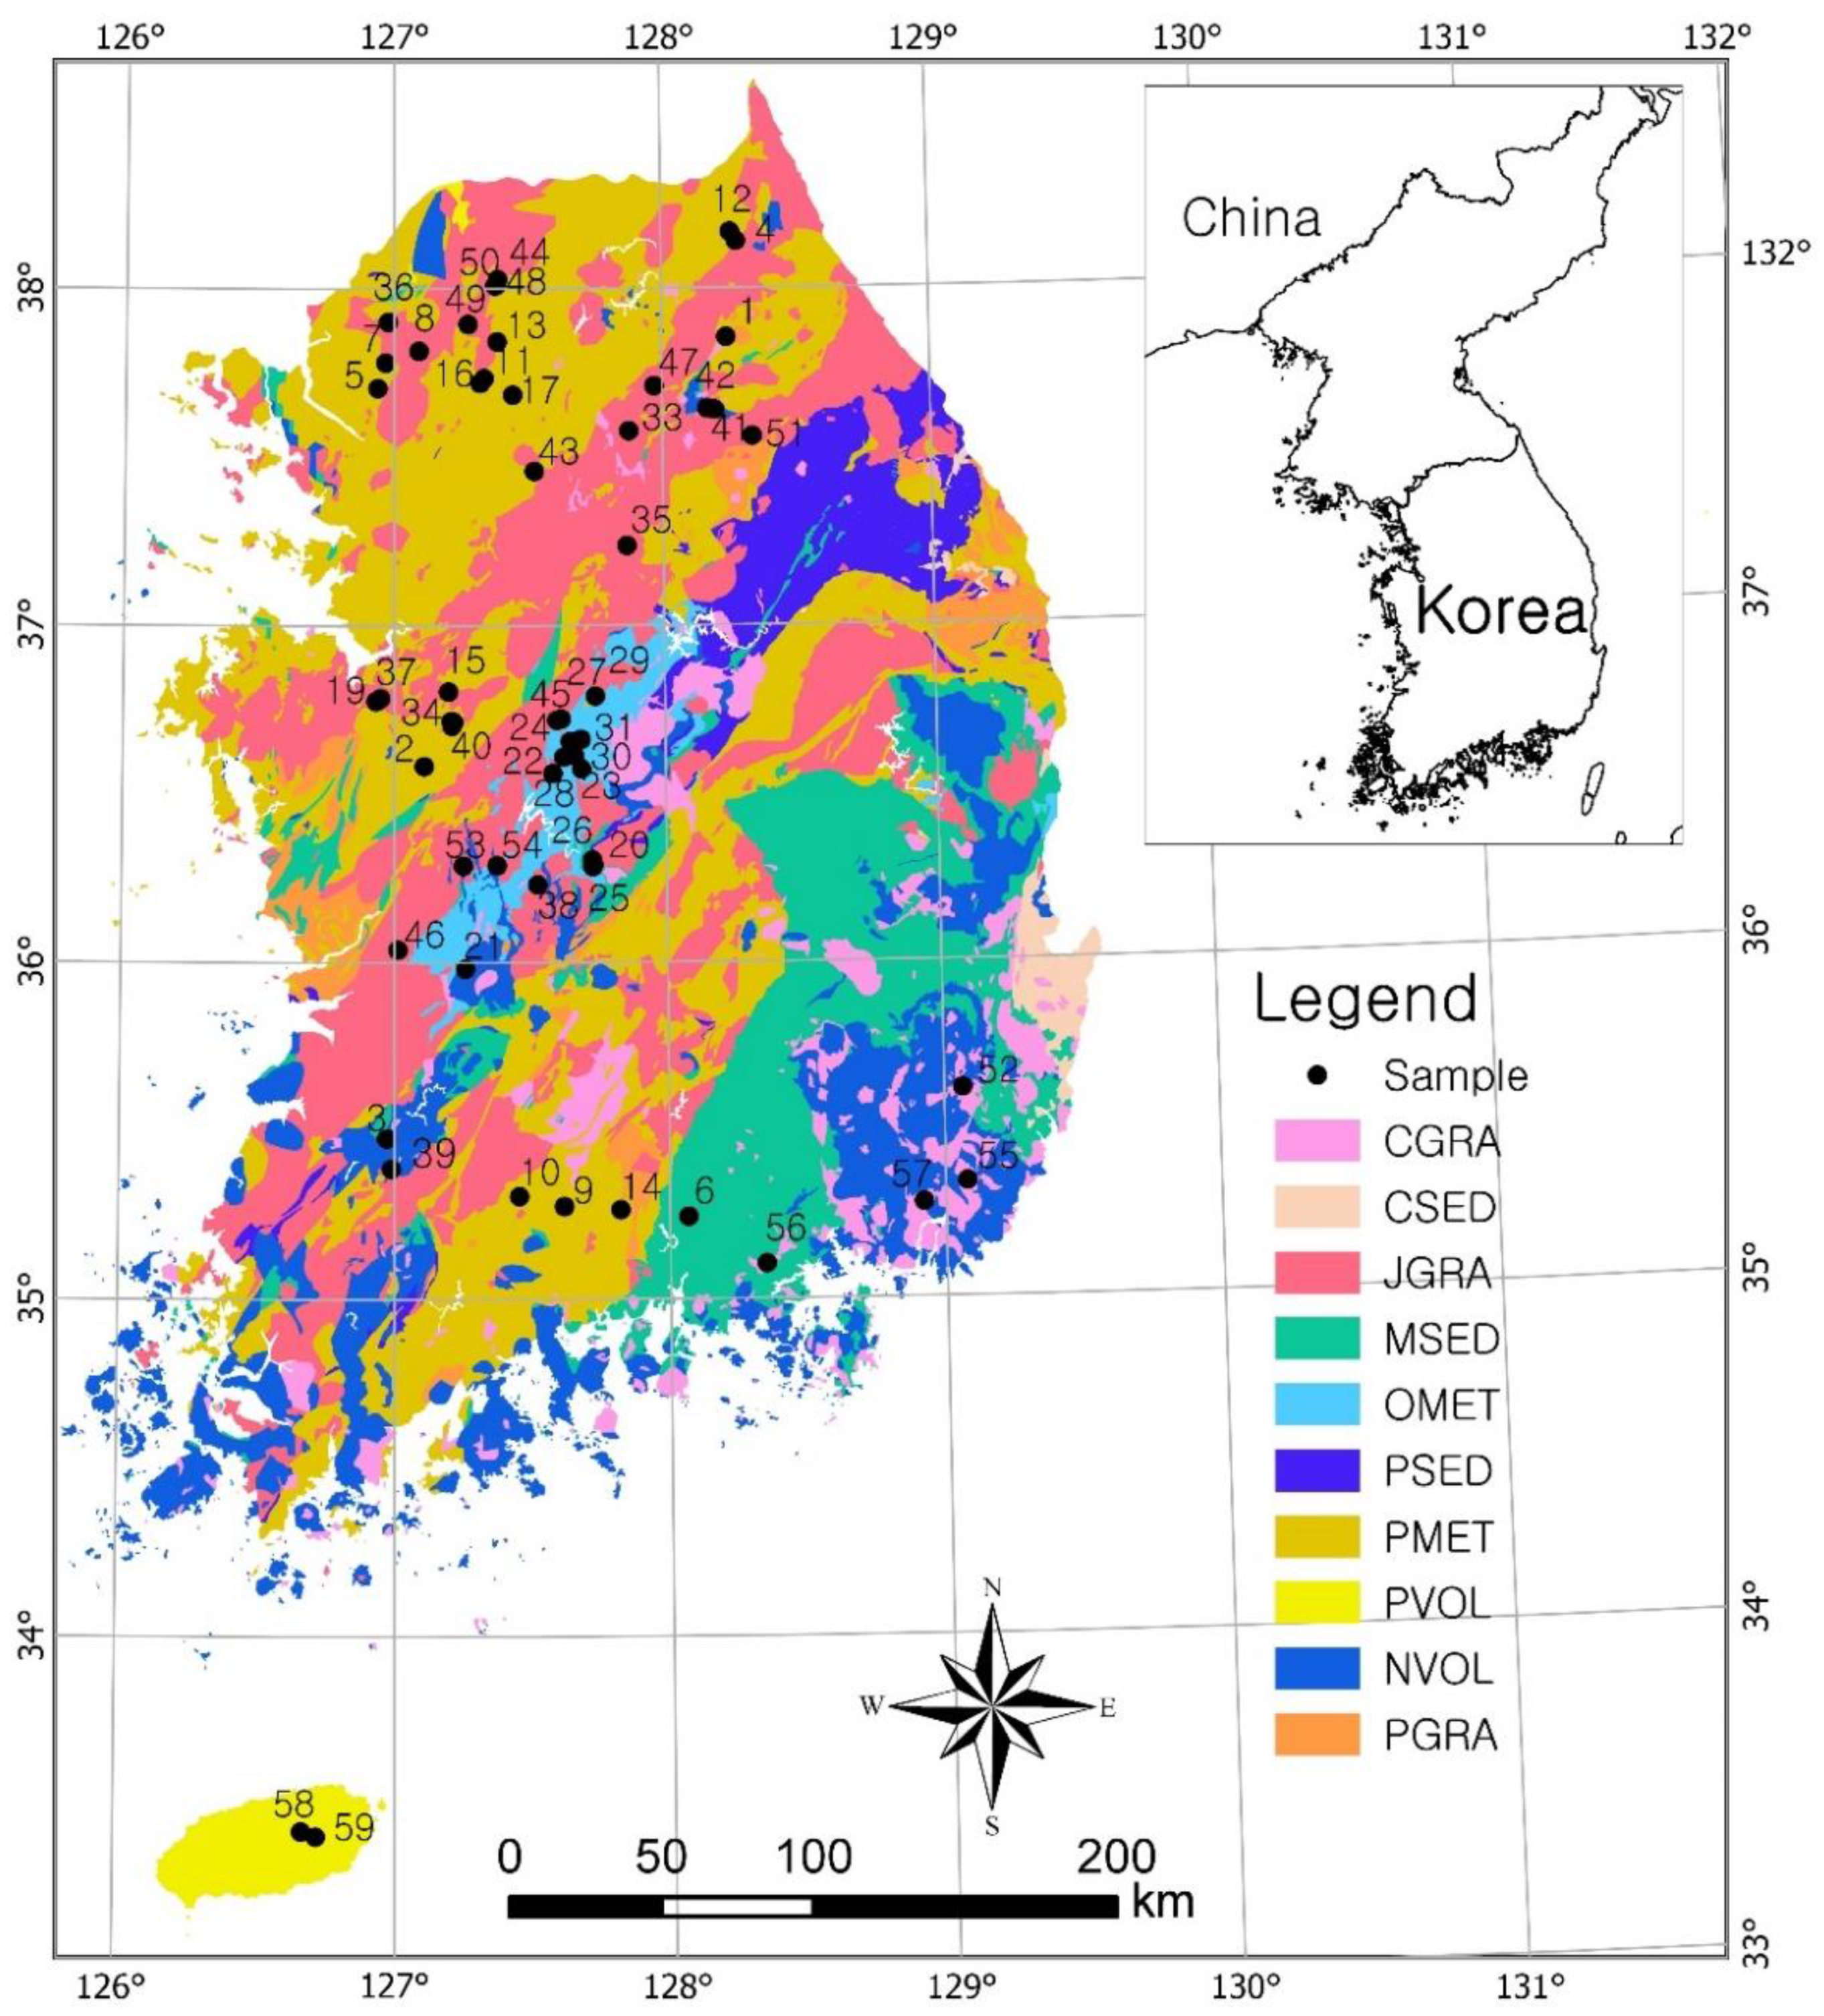
Although there were 70 bottled water companies in Korea, it was possible to collect samples for analysing radon concentrations from only 59 companies (Figure 1). These companies are located in rural or mountainous areas (average 225.2 m above sea level) to secure a clean and safe recharge area, and each company typically has 1–9 production wells. Production wells permitted in the country averaged 2.5, and permitted capacities ranged from 50 m3/d to 1,750 m3/d (average 310 m3/d). The depths of 59 production wells representative of the 59 companies were 90–430 m (average, 208.5 m). The geology, depths of the representative production wells, and field measurements of water quality of the 59 bottled water companies are listed in Table 1.
Although the geology of Korea is relatively complex, it can be divided into 10 geological units [3]. The 59 bottled water companies are located in areas corresponding to five geological units to ensure favourable water quality for drinking water, most of which are crystalline metamorphic rocks and igneous rocks (Figure 1). Among these, Precambrian metamorphic rocks (PMET) consist mainly of gneiss and granite gneiss. Ogcheon metamorphic rocks (OMET) are composed of metamorphosed sedimentary rocks with ages ranging from Precambrian to Palaeozoic. The main constituent rocks of OMET are schist, phyllite, crystalline limestone, and slate. Jurassic granite (JGRA) is reported to have formed from magma originated from sedimentary rocks (S-type granite). However, the Cretaceous granite (CGRA) was derived from the partial melting of the mantle (I-type granite). Porous volcanic rocks (PVOL) consist of Quaternary basalts characterised by rapid movement of groundwater [13].
2.2. Production Processes of Bottled Water
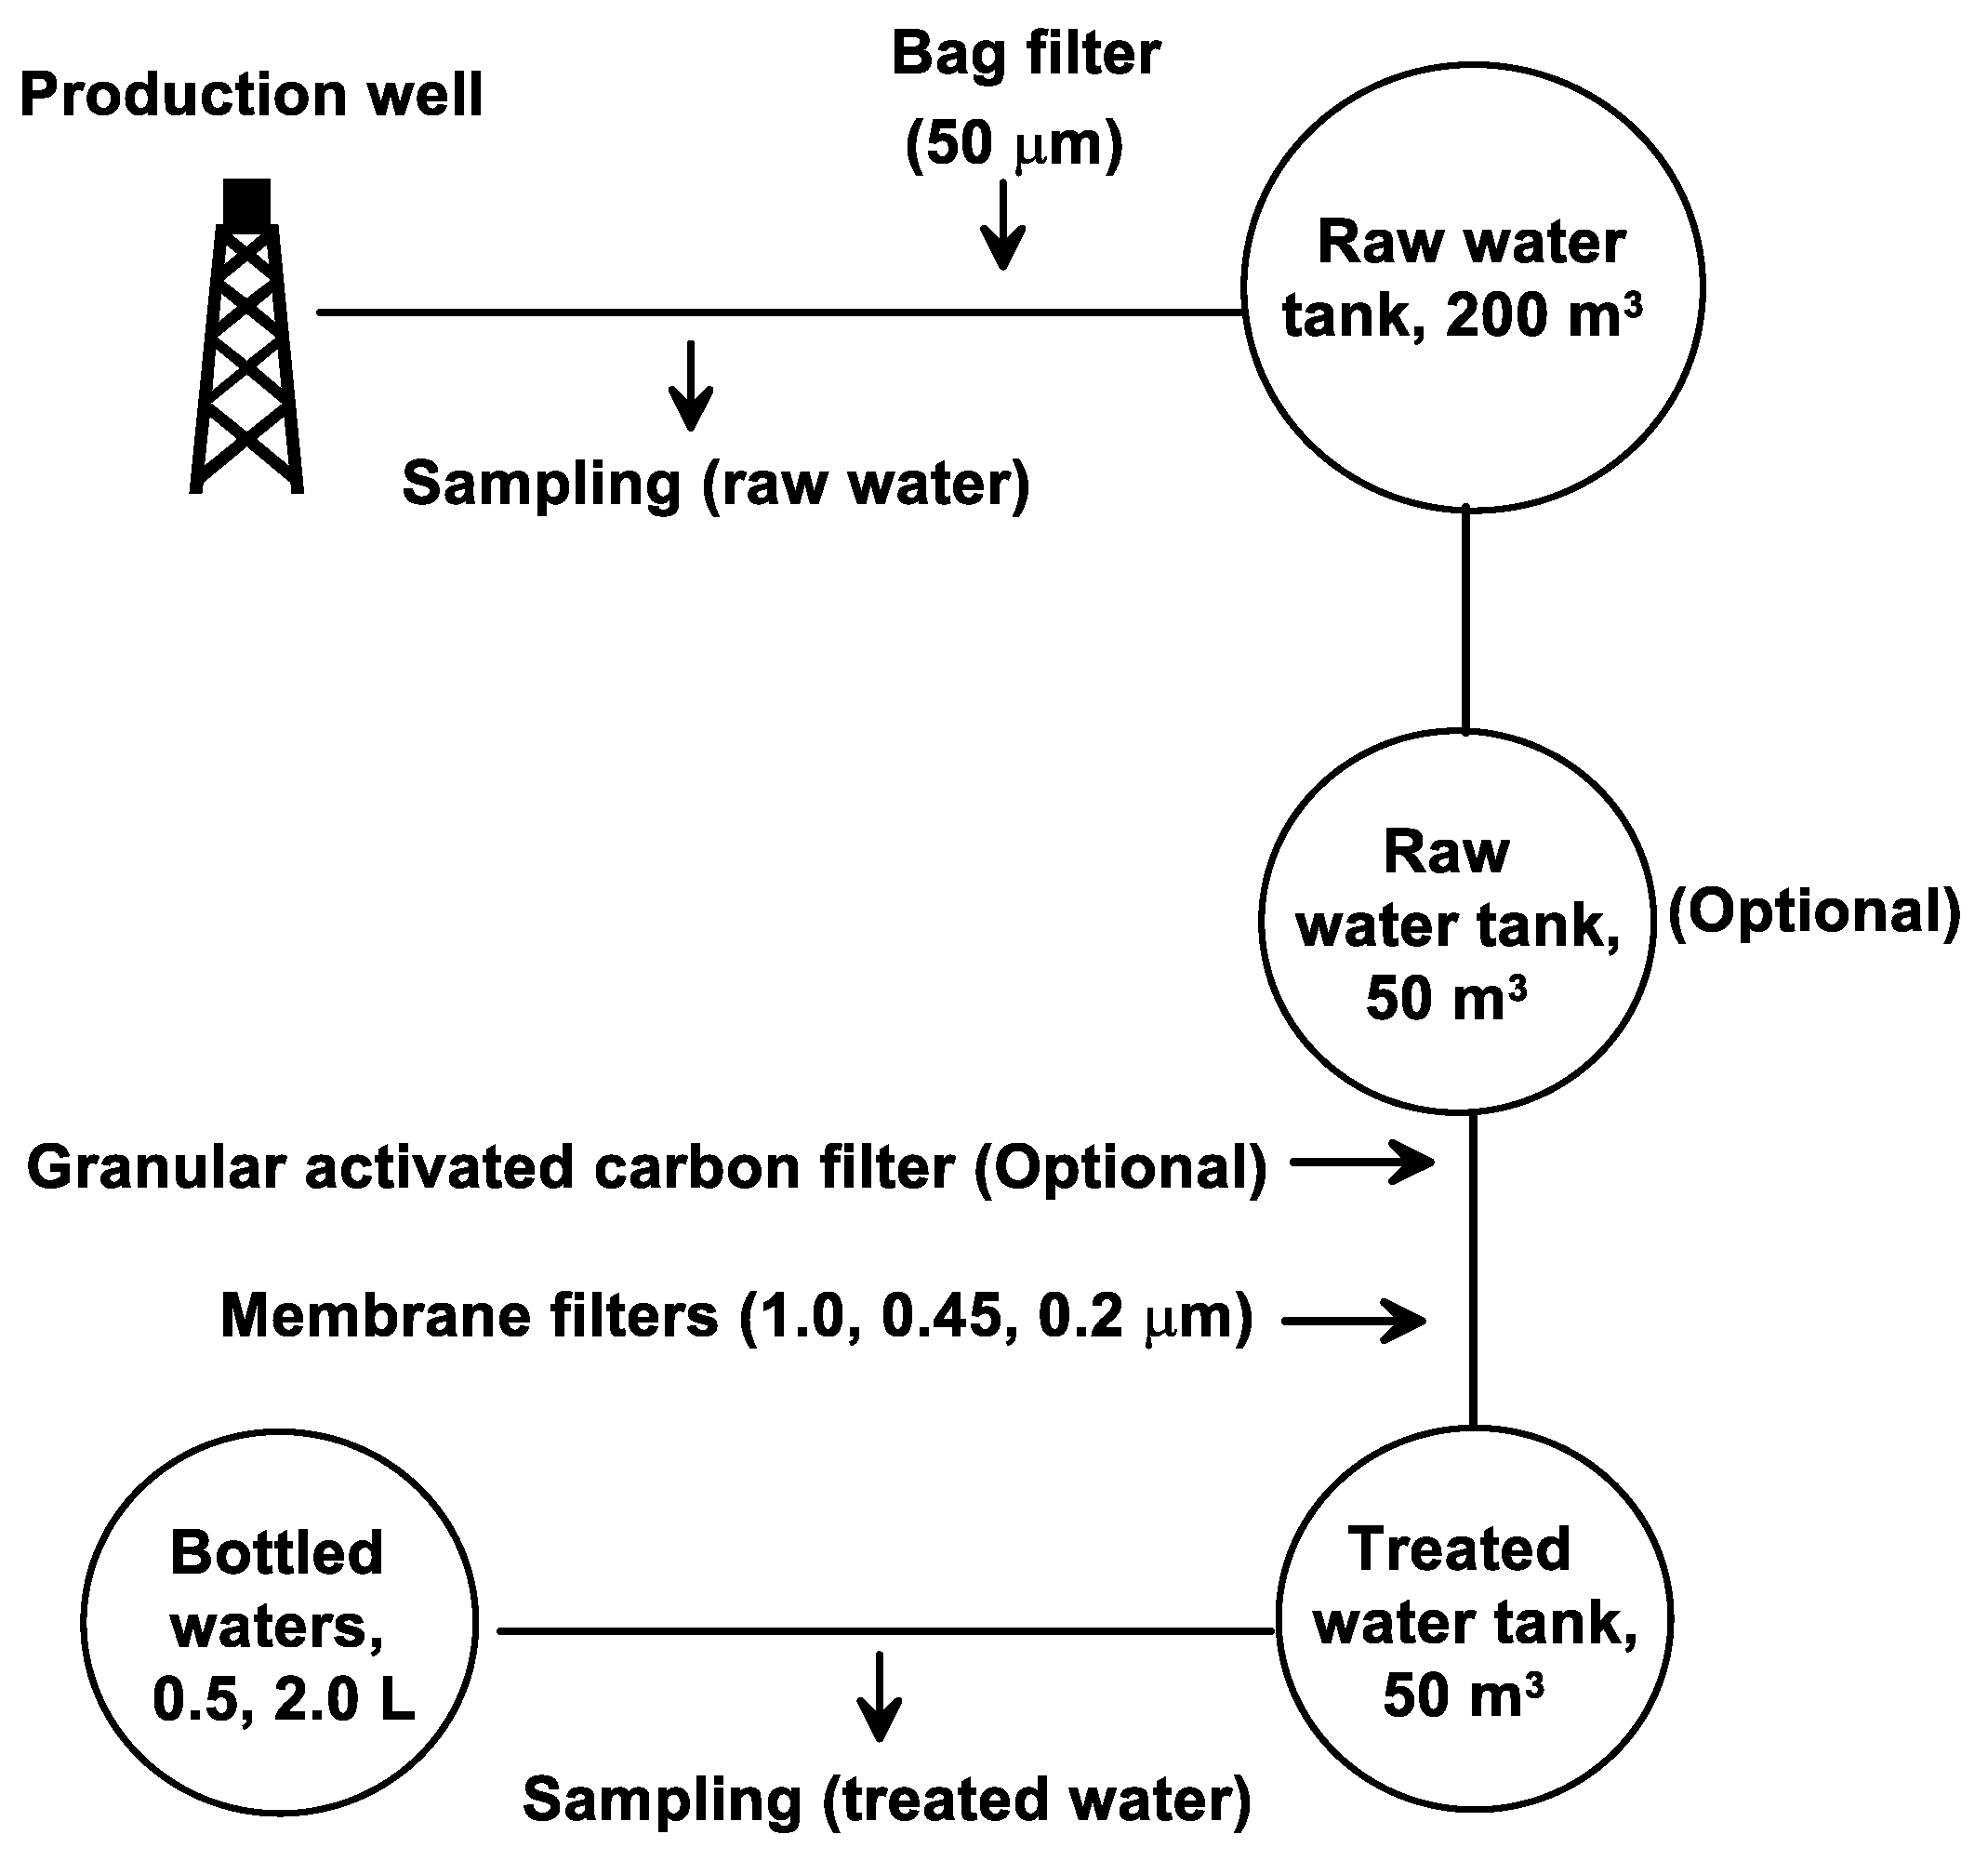
Radon concentrations in bottled waters are low compared to the raw water concentrations due to the short half-life of Rn (3.8 days) and radon losses during bottling [6]. The manufacturing processes of bottled water in Korea are as follows (Figure 2): groundwater, pumped from a production well as raw water, is physically purified to remove impurities using a bag filter (50 µm in diameter) and then is first stored in tanks with a capacity of approximately 200 m3. We obtained samples right before passing through the bag filter in order to measure radon concentrations in the raw water.
At the manufacturing stage for bottled water, this raw water is temporarily transported to the second-stage storage tank (50 m3) right after high-level purification treatment. That is, the raw water from the first-stage storage tank is treated, passing through a GAC (granular activated carbon) filter and membrane filters (1.0, 0.45, 0.2 µm in diameter). Then, the treated water is stored in the second water tank (Figure 2). This water, as the purified water, is used as the final bottled water product.
For the measurement of radon concentration in treated water, we obtained samples from the manufacturing process after the second storage tank. As can be seen in the treatment processes for bottled water, radon reduction takes place. In detail, radon level naturally decreases during the time when water is pumped from the production well and transported to the storage tank for purification treatment. That is, natural radon reduction proceeds by atmospheric storage as follows:
C = C0e−kt
- t: time of decay
- k: decay constant, 0.182d−1
- C: concentration at time t
- C0: concentration, initial
Based on the manufacturing stages for bottled water, it is estimated that storage duration ranges 12–24 h in storage tanks (50–200 m3). Besides storage, it is expected that the radon concentration in water decreases during purification treatment. As shown in Figure 2, several stages of treatment, including 50, 1, 0.45, and 0.2 μm membrane filters and a GAC filter, are applied to the raw water, resulting in a reduction in the radon level.
GAC can remove radon from water and was evaluated as a potential Best Available Technology (BAT) and a potential Small Systems Compliance Technology (SSCT) for radon. SSCTs may be restricted to radon influent levels below around 185 Bq/L to reduce risk of the build-up of radioactive radon products [1].
The capacity and efficiency of radon adsorption by GAC are commonly affected by physical properties of GAC and water chemistry. However, it has been acknowledged that one of the most important factors that affects radon adsorption is Empty Bed Contact Time (EBCT) [1].
2.3. Sampling and Radon Measurements
Groundwater samples from the 59 bottled water companies were collected to analyse the radon concentrations in the raw water and treated water. Most of the bottled water companies have several production wells. In this case, the raw water sample was taken from the production well with the largest groundwater abstraction. Before sampling, pumping was conducted for at least 5–10 min to drain an amount of groundwater that was more than 3–5 times that of the well bore storage [14]. During the pumping for sampling, water temperature, pH, and electrical conductivity (EC) were checked to ensure that the discharged groundwater was representative of the water in the aquifer.
Samples for radon analysis were collected with caution to prevent aeration effects resulting from turbulent flow during pumping. During sampling, raw water was collected slowly in a beaker using a hose connected to the pipe of the production well to avoid generating bubbles and to minimise contact with air, which may cause radon levels in the water to decrease. Then, 8 mL of water was sampled and injected into a 22-mL polyethylene vial containing 12 mL of scintillation solution (Optiphase HiSafe3; Perkin-Elmer, Inc., Waltham, MA, USA). After adding the 8 mL of groundwater, the sealed vial was shaken so that the scintillation solution and water mixed evenly. To sample treated water, water from the storage tank was passed through a filtering system, such as a GAC filter and membrane filters. As with raw water sampling, care was taken to avoid generating bubbles and to minimise contact with air during sampling.
Sampling time was recorded to correct for the time interval between sampling and analysis. The samples were transported to the Korea Institute of Geosciences and Mineral Resources (KIGAM) laboratory within 48 h, and radon activity was analysed using a liquid scintillation counter (LSC, Perkin Elmer, Wallac 1220 Quantulus) equipped with a pulse-shape analyser which can electronically separate alpha and beta nuclides into different spectra. When the pulse shape analysis level was measured at 100 for 300 min, the lower detection limit was approximately 0.12 Bq/L [15], which was determined using 241Am and 90Sr/90Y standard radioactive solutions to minimise alpha/beta discrimination capabilities [16]. The detection efficiency for 222Rn was determined in triplicate using three standard samples based on the total peak area of the alpha line at 100 PSA level, yielding a mean value of 89% with a standard deviation of 0.6%, as demonstrated by Cho et al. [17].
3. Results and Discussion
3.1. Radon Concentrations in Raw Water
The radon concentrations in groundwater may change depending on the season and pumping time [18]. Accordingly, the radon level in the groundwater of a production well may be different at each measurement time point [6]. The temperature, EC, and pH of the raw water ranged from 11.2 to 21.2 °C, 44.8 to 434 μS/cm, and 6.20 to 8.45, respectively (Table 1). Most of the groundwater used to produce Korean bottled water is classified as Ca–HCO3, Ca–Na–HCO3, and Ca–Mg–HCO3 types according to Piper plot analysis, because the majority of the bedrock containing this groundwater is composed of granite, granitic gneiss, and calcareous metasedimentary rocks [18].
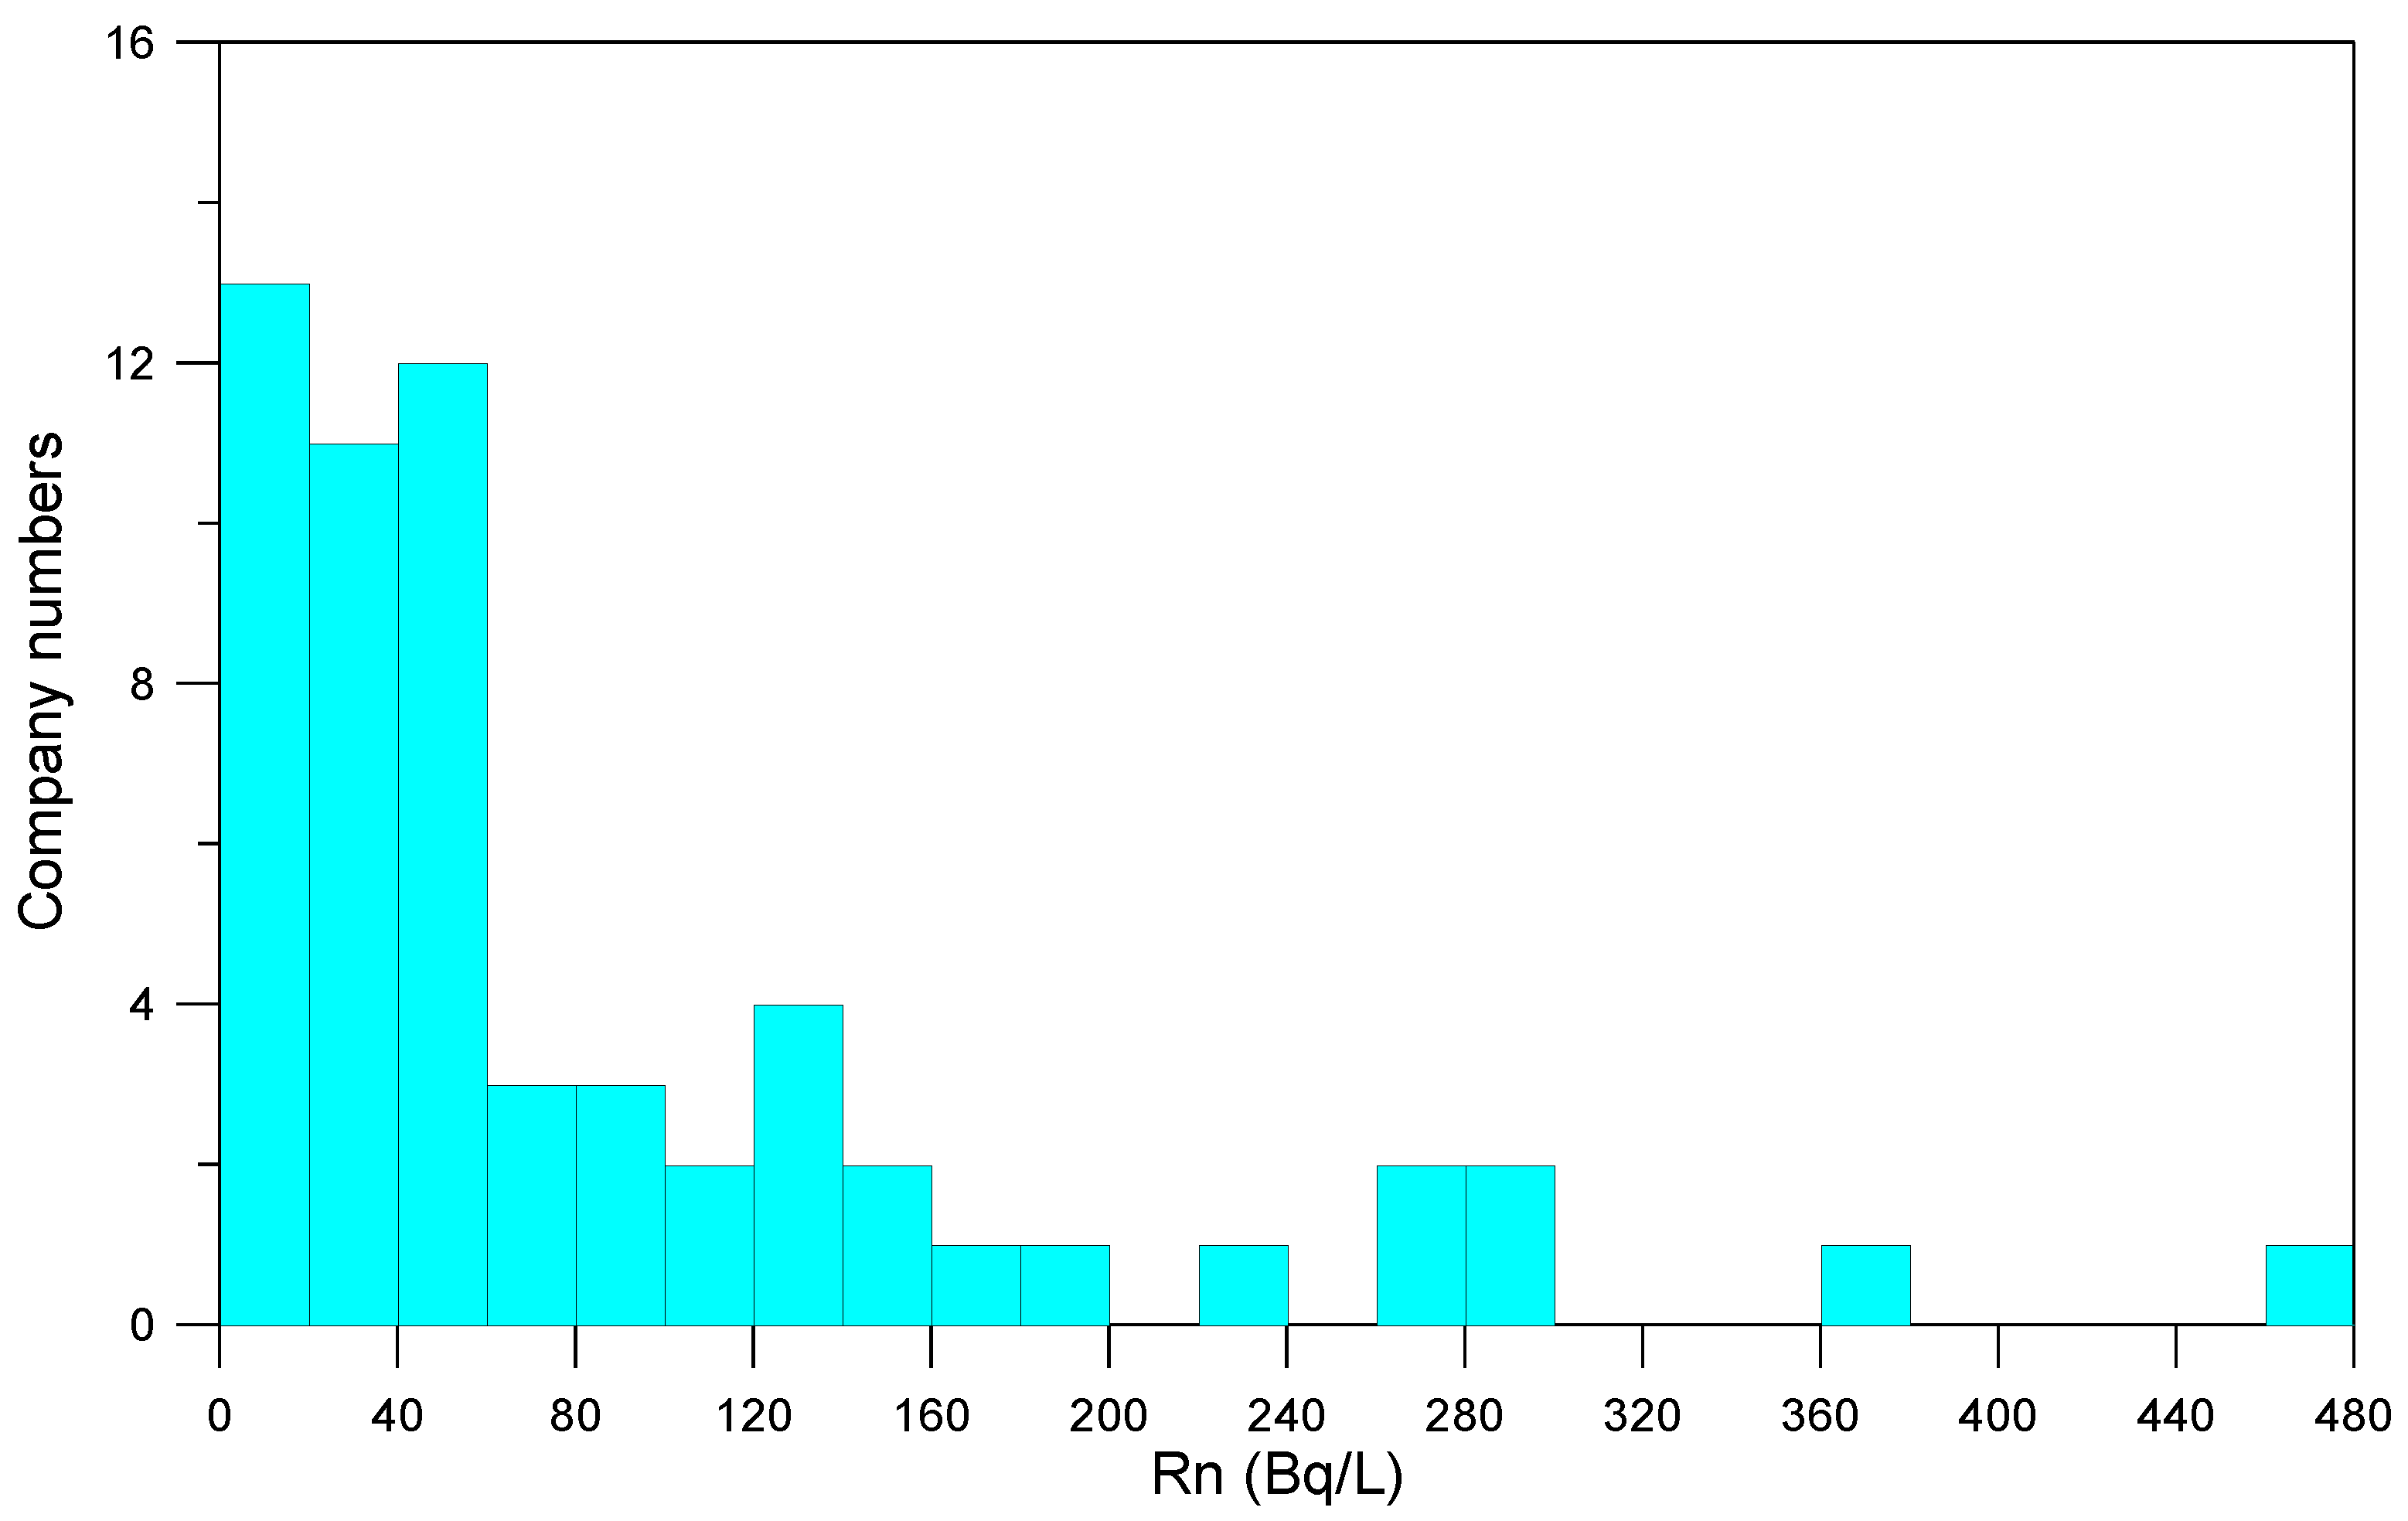
The radon concentration frequencies for the 59 raw water samples exhibited a log-normal distribution (Figure 3), similar to those of natural radionuclides in groundwater [19,20]. The range of radon concentrations in the 59 raw water samples was 3.7–476.8 Bq/L, with an average of 87.7 Bq/L (geometric mean, 49.0 Bq/L), as shown in Table 2. These values were similar to those of groundwater sampled from 5,453 sites in Korea (median, 48.8 Bq/L) [21]. Of the raw water samples collected in this study, 16.9% had radon concentrations that exceeded the US EPA alternative maximum contaminant level (AMCL) of 148 Bq/L. Similarly, 17.7% of the groundwater samples collected at 5,453 sites in Korea had radon concentrations above the AMCL [21].
In many countries, there have been extensive studies on radon concentrations in bottled water, but little is known about radon concentrations in raw water for bottled water. It is possible to estimate raw water radon concentrations from the concentrations in bottled water in the market and at the date of bottling. However, because the filtering process and the duration that raw water is stored in water tanks before bottling are unknown, it is difficult to determine the radon concentrations at the time of pumping [9]. The raw water radon concentrations measured in this study were low compared to the concentrations in raw water sampled at seven sites in Serbia (0.91–1463 Bq/L; geometric mean, 72.2 Bq/L), which were estimated from the radon levels in bottled water and its manufacture date [9]. The raw water radon concentrations were also low compared to those of raw mineral water in Suan Phueng District, Thailand (126 Bq/L) [22].
3.2. Radon Concentrations in Treated Water
The radon concentrations in groundwater before bottling can be reduced by atmospheric storage effects and GAC filtration [6]. The magnitude of the reduction by GAC filtration differs depending on the filter type and the rate of groundwater treatment. The radon removal efficiency by GAC processes complying with the small-systems standard was in the range of 50–99% [1]. The radon removal rates by GAC (empty bed detention time, 1.49–6.51 h) at nine homes in Finland were reported to be 87.6–100% [23]. The radon reduction rates of a small-scale water supply system (SWSS) in Korea, which has a storage tank capacity of approximately 30 m3/d, were reported to be 26.5% [15] and 25.7–44.8% [3], respectively.
Although the groundwater transportation process from the production well to the filtering facility may vary among bottled water companies, the radon concentrations of the treated water samples before bottling ranged from 0.1 to 239.4 Bq/L, with an average of 19.5 Bq/L (geometric mean, 7.8 Bq/L) (Table 2). Comparing these values to those of bottled water in stores is inappropriate because it would have taken from a few days to several weeks for the bottled waters to be transported to the store after bottling. Therefore, it is meaningless to compare the radon concentrations in the treated water samples in this study with those of bottled water in other countries. However, considering the locations of the bottled water companies and the transportation system of Korea, it can be assumed that the treated water would reach the customer within 1–2 weeks after bottling. Based on this assumption, the radon concentrations in bottled water at the store in Korea are higher than those of 197 brands of bottled water in Austria (<0.12–18.0 Bq/L) [6] and 72 brands of bottled water in Iran (0–0.9 Bq/L) [24]. Conversely, as shown in Table 3, the radon values of bottled water obtained in this study were lower than those of 63 brands of bottled water in Portugal (1–814 Bq/L) [8] and 8 brands of bottled mineral water in Algeria (2.6–14 Bq/L) [25].
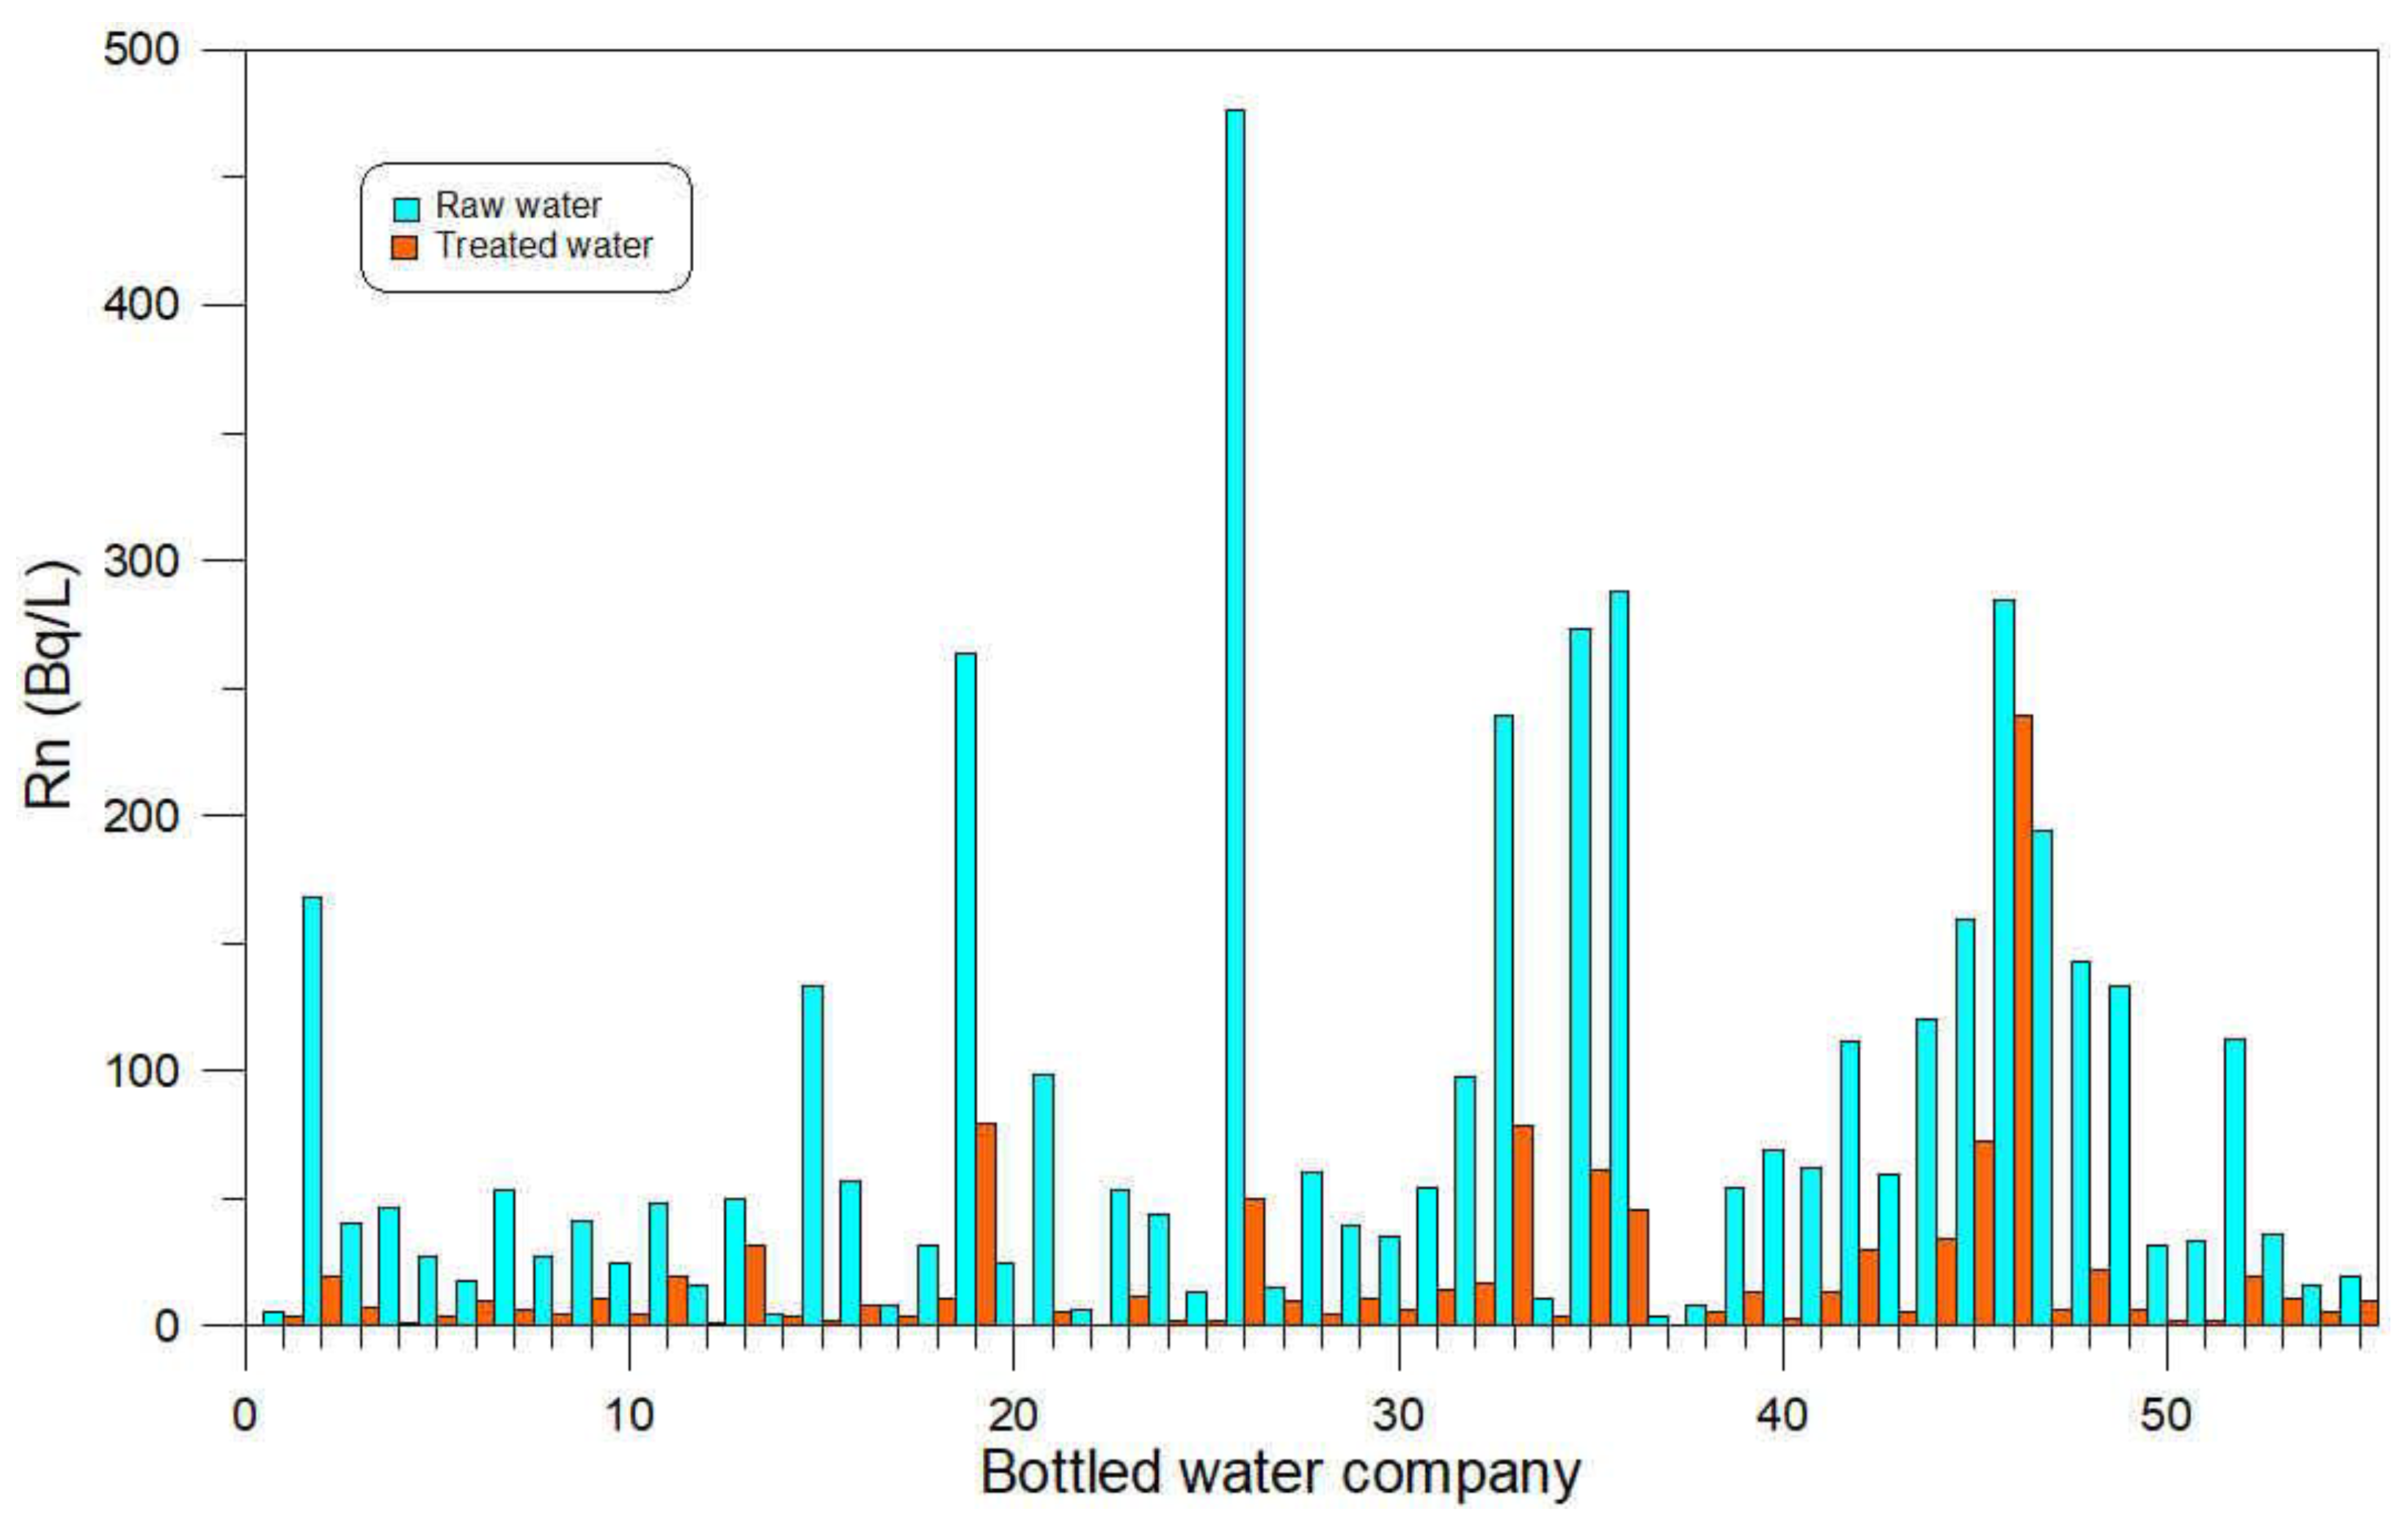
Comparing the radon concentrations of the raw water with those of treated water, treatment reduced radon concentrations by 16.0–98.9% (average, 74.9%), as described in Figure 4. These reduction rates are similar to those observed in 13 brands of treated water (38–99%) in Korea [12]. The differences in radon reduction rate between different samples of treated water can be explained by the following. First, radon concentrations are highly variable among different water types and even within the same type [26]. Second, the radon concentrations and pumping durations among the production wells of a bottled water company typically differ. Third, the raw water treatment process may differ slightly among different companies [12]. Finally, storage duration controls the radon reduction rate. It usually takes approximately 12–24 h to treat the raw water in the Korean bottled water.
If the production rate is high, the radon reduction rate will be low because the groundwater retention time in the water tank and the contact time with the GAC will be short. Therefore, to estimate the radon reduction rate in a treated water sample precisely, it is necessary to know not only the radon concentration and pumping rate of each production well of a company but also the treatment process of each company.
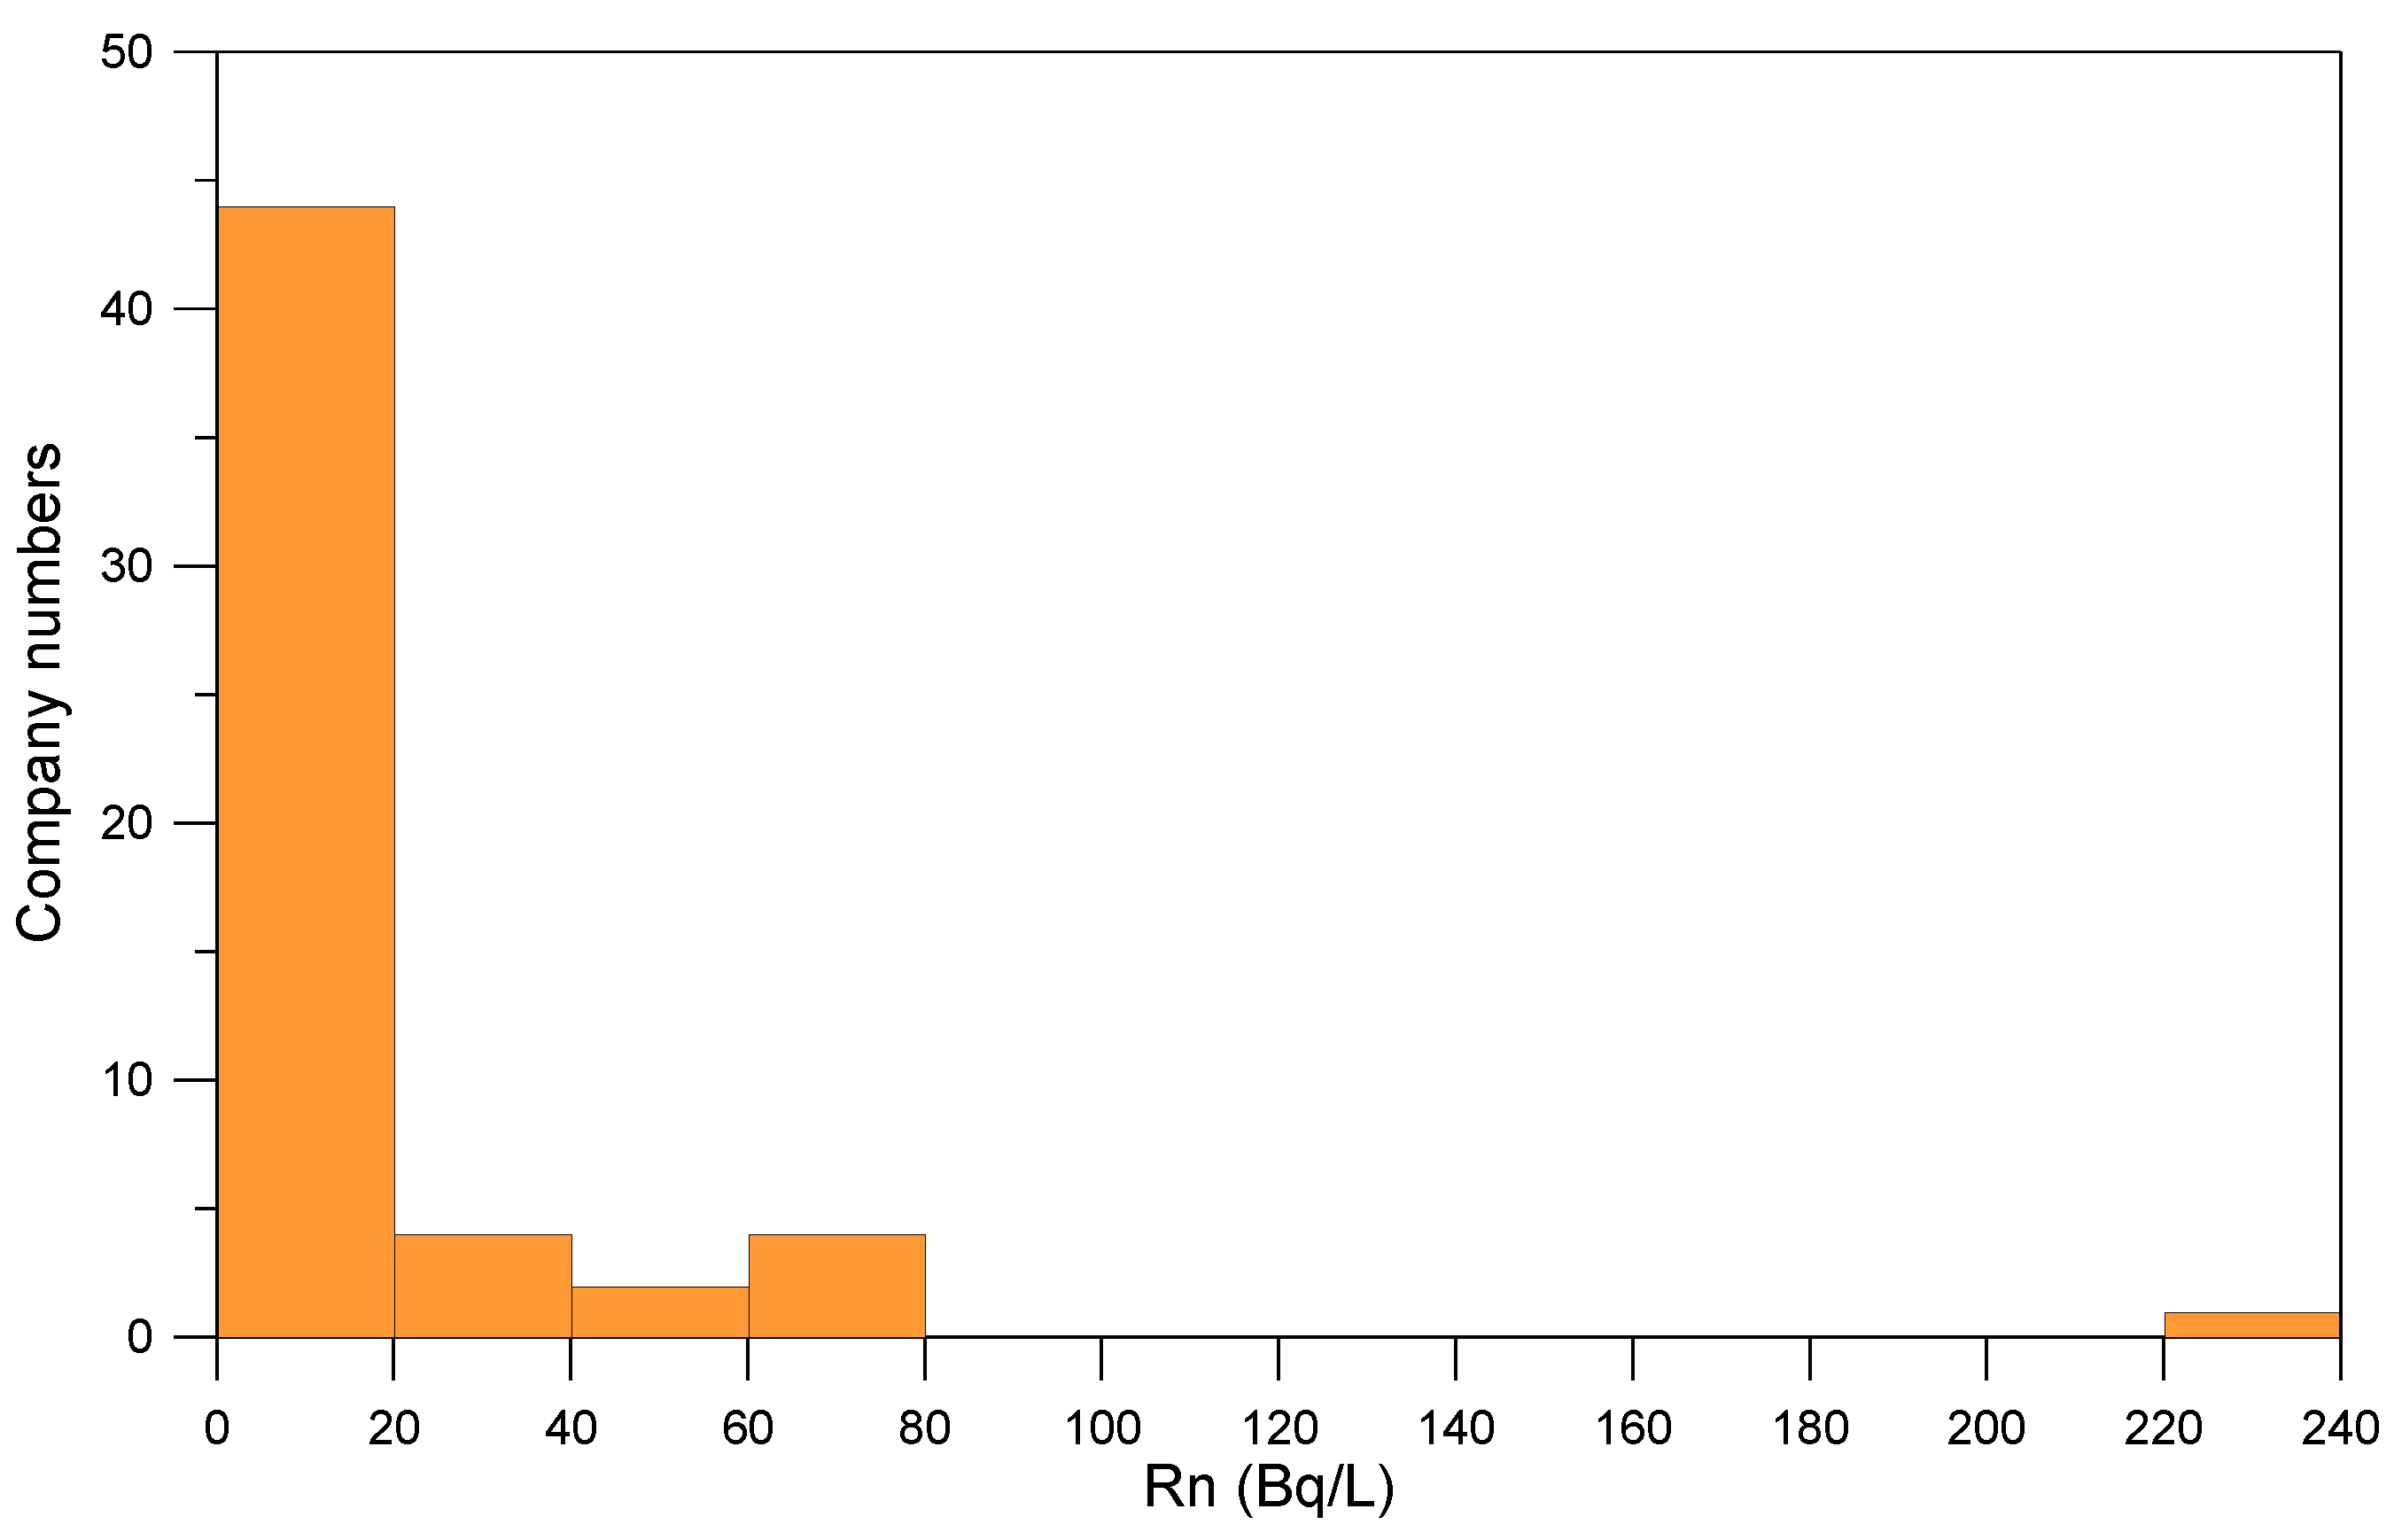
The radon concentration frequency distribution of the treated water is shown in Figure 5. Among the 55 raw water samples, company 50 produced water with a concentration exceeding 148 Bq/L (284.9 Bq/L). The radon concentration in the treated water of this company remained high at 239.4 Bq/L. The treated water of company 50 exhibited a low radon reduction rate, mainly because the company did not use GAC filters and had a high bottled water production rate. Generally, it takes 1–2 weeks for bottled water to reach the store in Korea; hence, it is expected that the radon concentration in the bottled water produced by company 50 will be lower than 50 Bq/L when the bottles are purchased by consumers.
A similar example of radon reduction occurs for Nordic groundwater with high radon concentrations. Nordic bottled water from groundwater with a high radon concentration is not likely to have a problem due to the short half-life of radon (3.8 days). The concentrations of radon are reduced substantially before the bottles reach store shelves and do not constitute a problem in the final product [27]. In conclusion, the radon concentrations in the treated water produced by the bottled water companies in Korea are considered safe under the tentative drinking water standards of Korea.
3.3. Radon Concentrations in Raw Water in Relation to Geology
The radon concentration in groundwater is closely related to geology [21]. As shown in Table 4, the geometric means were high in groundwater found in granite (JGRA, 85.2 Bq/L; CGRA, 66.0 Bq/L) and moderate in groundwater found in PMET and OMET (33.7 Bq/L and 38.5 Bq/L, respectively). The concentration was lowest in PVOL (average, 17.6 Bq/L) because the geology of this area consists of porous volcanic rocks with high permeability [13]. The radon concentration differences in raw water between areas with different geology are consistent with those reported by Cho [21] on 5453 small-scale water supply systems (SWSS) in Korea. They are also consistent with the finding that radon concentrations are low in the groundwater of sedimentary rocks and high in the groundwater of granite [2,3].
In general, radon concentrations are high in groundwater found in granite; however, the maximum radon concentrations in PMET and OMET were 476.8 Bq/L and 263.2 Bq/L, respectively (Table 4). The unusually high radon concentrations in some groundwater found in PMET and OMET are likely due to the groundwater being in contact with granite. Although the surface geology is classified as PMET or OMET, the lower parts of the production wells are likely affected by a granite intrusion, resulting in high levels of radon and uranium in the groundwater [2,28].
Therefore, the measured radon concentrations in PMET and OMET (Table 4) were higher than the actual values. In the granite areas, the radon concentration in the raw water in JGRA was higher than that in the raw water in CGRA. This is attributable to the difference in origin between the two granite types [21]. It is suggested that because JGRA is an S-type granite originating from the mixing of crustal material and sediment, the uranium concentration in this rock is higher than that in the I-type CGRA, which was formed by magma differentiation [3].
Among the 59 raw water samples, 10 samples had radon concentrations exceeding 148 Bq/L. Among the 55 treated water samples, 1 sample had a concentration exceeding 148 Bq/L. However, as mentioned previously, the radon concentration in bottled water produced from raw water with a radon concentration higher than 148 Bq/L will be lowered at the time when the bottled water reaches the consumer because it usually takes 1–2 weeks for the bottled water to arrive at the store. Nevertheless, in the case of raw water with extremely high radon values, important monitoring considerations still need to be resolved [28]. The maximum radon concentration in groundwater in Korea was reported to be 7218.7 Bq/L, and nearly 2% of groundwater samples had concentrations higher than 1000 Bq/L [21]. Therefore, careful attention should be given to the management of bottled water originating from Jurassic granite areas as well as the newly developed production wells for bottled water in these areas.
4. Conclusions
This study highlighted the importance of investigation of the radon concentrations in the raw and treated waters produced by all the bottled water companies in Korea. The frequencies of radon concentrations in the 59 raw water samples followed a log-normal distribution. The highest concentrations were in water from Jurassic granite, and the lowest occurred in water from volcanic rocks. Ten raw water samples had radon concentrations higher than 148 Bq/L; however, the radon concentrations in most of the treated water samples were lower than 148 Bq/L due to the effects of atmospheric storage and GAC filtration. The radon levels in the treated water samples decreased by a wide range (16.0–98.9%), due to differences in GAC filtration, production processes among the bottled water companies, and variation in radon levels in the groundwater. In general, the mean radon concentrations are high in groundwater found in granite; however, the maximum radon concentrations in PMET and OMET were 476.8 Bq/L and 263.2 Bq/L, respectively. Assuming that the treated water reaches consumers in no less than 1–2 weeks, the radon concentrations in bottled water in Korea are generally similar to those of other countries. However, particular care should be given to bottled water produced from Jurassic granite because the radon concentrations in the raw water in these areas are high and may change at each pumping period. All of the bottled water in Korea will be safe for drinking because the radon concentrations in the water will be lower than the tentative standard of 148 Bq/in Korea.
Author Contributions
C.O.C. and B.W.C. prepared and wrote the article. They were responsible for fieldwork, sample preparation, and data analyses. J.H.H., B.D.L., and Y.H.O. collected and curated the data. All authors have read and agreed to the published version of the manuscript.
Funding
This research was supported by the Basic Research Project (GP2017-008) of the Korea Institute of Geoscience and Mineral Resources (KIGAM), funded by the Ministry of Science and ICT of Korea.
Conflicts of Interest
The authors declare no conflict of interest. The funders had no role in the design of the study; in the collection, analyses, or interpretation of data; in the writing of the manuscript; or in the decision to publish the results.
References
- Environmental Protection Agency (EPA). National Primary Drinking Water Regulations; Radon-222; Proposed Rule; Federal Register 64; EPA: Washington, DC, USA, 1999; pp. 59246–59294.
- Skeppström, K.; Olofsson, B. Uranium and radon in groundwater. Eur. Water 2007, 17/18, 51–62. [Google Scholar]
- Cho, B.W.; Kim, H.K.; Kim, M.S.; Hwang, J.H.; Yoon, U.; Cho, S.Y.; Choo, C.O. Radon concentrations in Community Groundwater System of South Korea. Environ. Monit. Assess. 2019, 191. [Google Scholar] [CrossRef] [PubMed]
- Salonen, L. 238U series radionuclides as a source of increased radioactivity in ground water originating from Finnish bedrock. In Future Groundwater Resources at Risk, Proceedings of the IAHS Helsinki Conference, Finland; IAHS Press: Wallingford, UK, 1994; no 222. [Google Scholar]
- Karamanis, D.; Stamoulis, K.; Ioannides, K.G. Natural radionuclides and heavy metals in bottled water in Greece. Desalianation 2007, 213, 90–97. [Google Scholar] [CrossRef]
- Kralik, C.; Friedrich, M.; Vojir, F. Natural radionuclides in bottled water in Austria. J. Environ. Radioact. 2003, 65, 233–241. [Google Scholar] [CrossRef]
- Abuelhia, E. Assessment of radiation dose from radon ingestion and inhalation in commercially bottled drinking water and its annual effective dose in Eastern Province, Saudi Arabia. Int. J. Environ. Health Res. 2019, 29, 64–172. [Google Scholar] [CrossRef] [PubMed]
- Dueñas, C.; Fernández, M.C.; Carretero, J.; Liger, E.; Cañete, S. 226Ra and 222Rn concentrations and doses in bottled waters in Spain. J. Environ. Radioact. 1999, 45, 283–290. [Google Scholar] [CrossRef]
- Todorovic, N.; Nikolov, J.; Forkapic, S.; Bikit, I.; Mrdja, D.; Krmar, M.; Veskovi, M. Public exposure to radon in drinking water in Serbia. Appl. Radiat. Isot. 2012, 70, 543–549. [Google Scholar] [CrossRef]
- Korea Environment Institute (KEI). Modernization of Natural Mineral Water; KEI Report 2012000540018; KEI: Seoul, Korea, 2013; pp. 1–349. [Google Scholar]
- Ministry of Environment (MOE). Study on the Construction of Management System on Natural Mineral Water; KIGAM Report; KIGAM: Daejeon, Korea, 1999; pp. 1–165. [Google Scholar]
- Shin, W.S.; Choung, S.W.; Han, J.H.; Han, W.S.; Jeon, S.D.; Ryu, J.S.; Chang, B.W. Accumulation of naturally occurring radioactive materials on the filters utilized in bottled mineral-water facilities. Appl. Geochem. 2017, 85, 154–161. [Google Scholar] [CrossRef]
- Choi, B.S. Determination of aquifer characteristics from specific capacity data of wells in Cheju Island. J. Korean Soc. Groundw. Environ. 1999, 16, 180–187. [Google Scholar]
- Barcelona, M.J.; Gibb, J.P.; Helfrich, J.A.; Garske, E.E. Practical Guide for Groundwater Sampling; Illinois State Water Survey: Champaign, IL, USA, 1985; pp. 70–84. [Google Scholar]
- Yun, U.; Kim, T.S.; Kim, H.K.; Kim, M.S.; Cho, S.Y.; Choo, C.O.; Cho, B.W. Natural radon reduction rate of the Community Groundwater System in South Korea. Appl. Radiat. Isot. 2017, 126, 23–25. [Google Scholar] [CrossRef]
- Kim, Y.; Cho, S.-Y.; Yoon, Y.-Y.; Lee, K.-Y. Optimal method of radon analysis in groundwater using ultra low-level liquid scintillation counter. J. Soil Groundw. Environ. 2006, 11, 59–66. [Google Scholar]
- Cho, S.Y.; Koo, M.-H.; Cho, B.W.; Jung, Y.-Y.; Oh, Y.H. Factors controlling the spatial and temporal variability in groundwater 222Rn and U levels. Water 2019, 11, 1796. [Google Scholar] [CrossRef] [Green Version]
- Lee, B.D.; Oh, Y.H.; Cho, B.W.; Yun, U.; Choo, C.O. Hydrochemical properties of groundwater used for Korea bottled waters in relation to geology. Water 2019, 11, 1043. [Google Scholar] [CrossRef] [Green Version]
- Cothern, C.R.; Robers, P.A. Radon, Radium and Uranium in Drinking Water; Lewis Publishers: Chelsea, MI, USA, 1990; pp. 1–286. [Google Scholar]
- Pinti, D.L.; Retailleau, S.; Barnetche, D.; Moreira, F.; Mortiz, A.M.; Larocque, M.; Gelinas, Y.; Lefebvre, R.; Helie, J.F.; Valadez, A. 222Rn activity in groundwater of the St. Lawrence Lowlands, Quebec, eastern Canada: Relation with local geology and health hazard. J. Environ. Radioact. 2014, 136, 206–217. [Google Scholar] [CrossRef] [PubMed]
- Cho, B.W. Radon concentrations in groundwater of Korea. J. Korean Soc. Eng. Geol. 2018, 28, 661–672. [Google Scholar]
- Sola, P.; Srisuksawad, K.; Loaharojanahand, S.; O-Manee, A.; Permnamtip, V.; Issarapan, P.; Thummagarun, L. Radon concentration in air, hot spring water, and bottled mineral water in one hot spring area in Thailand. J. Radioanal. Nucl. Chem. 2013, 297, 183–187. [Google Scholar] [CrossRef]
- STUK (Radiation and Nuclear Safety Authority). Radon and Radium in Well Water: Measurements and Mitigation of Exposure; STUK (Radiation and Nuclear Safety Authority): Helsinki, Finland, 2013; Stuk-A255; pp. 61–82.
- Fakhri, Y.; Mahvi, A.S.; Langarizadeh, Z.; Zandsalimi, Y.; Amirhajeloo, L.R.; Kargosha, M.; Moradi, M.; Moradi, B.; Mirzaei, M. Effective dose of radon 222 bottled water in different age groups humans: Bandar Abbas city, Iran. Glob. J. Health Sci. 2015, 8, 64–71. [Google Scholar] [CrossRef]
- Amrani, D. Natural radioactivity in Algerian bottled mineral waters. J. Radioanal. Nucl. Chem. 2002, 252, 597–600. [Google Scholar] [CrossRef]
- Jobbágy, B.; Altzitzoglou, T.; Malo, P.; Tanner, V.; Hult, M. A brief overview on radon measurements in drinking water. J. Environ. Radioact. 2017, 173, 18–24. [Google Scholar] [CrossRef]
- Frengstad, B.S.; Lax, K.; Tarvainen, T.; Jæger, Ø.; Wigum, B.J. The chemistry of bottled mineral and spring waters from Norway, Sweden, Finland and Iceland. J. Geochem. Explor. 2010, 107, 350–361. [Google Scholar] [CrossRef]
- Cho, B.W. Uranium concentrations in groundwater of the Goesan Area. Econ. Environ. Geol. 2017, 50, 353–361. [Google Scholar]
Figure 1.
Locations of the 59 bottled water companies on a simplified geological map of the study area. CGRA, Cretaceous granite; CSED, Cretaceous sedimentary rocks; JGRA, Jurassic granite; MSED, Mesozoic sedimentary rocks; NVOL, Nonporous volcanic rocks (Cretaceous); OMET, Ogcheon metamorphic rocks; PGRA, Precambrian granite; PMET, Precambrian metamorphic rocks; PSED, Precambrian sedimentary rocks; PVOL, Porous volcanic rocks (Quaternary).

Figure 2.
Schematic diagram showing the transportation and filtration processes used to treat groundwater for producing bottled water.
Figure 2.
Schematic diagram showing the transportation and filtration processes used to treat groundwater for producing bottled water.

Figure 3.
Distribution of radon concentrations (Rn) in 59 raw water samples. Italic values on the tops of bars denote sample numbers.
Figure 3.
Distribution of radon concentrations (Rn) in 59 raw water samples. Italic values on the tops of bars denote sample numbers.

Figure 4.
Radon concentrations (Rn) in the raw and treated water of 55 bottled water companies (data on radon concentrations in treated water were not available for companies 25, 40, 44, and 45).
Figure 4.
Radon concentrations (Rn) in the raw and treated water of 55 bottled water companies (data on radon concentrations in treated water were not available for companies 25, 40, 44, and 45).

Figure 5.
Distribution of radon concentrations (Rn) in 55 treated water samples.


Table 1.
Production well depth, water quality, and location geology of the 59 bottled water companies.
Table 1.
Production well depth, water quality, and location geology of the 59 bottled water companies.
| Company No. | Depth (m) | T(°C) | pH | EC (μS/cm) | Geol. | Company No. | Depth (m) | T(°C) | pH | EC (μS/cm) | Geol. |
|---|---|---|---|---|---|---|---|---|---|---|---|
| 1 | 120 | 18.6 | 6.30 | 136 | A | 31 | 200 | 12.4 | 7.55 | 96.2 | B |
| 2 | 200 | 17.1 | 7.31 | 187 | A | 32 | 333 | 15.5 | 7.72 | 315 | B |
| 3 | 180 | 18.7 | 8.14 | 167 | A | 33 | 370 | 16.6 | 6.86 | 175 | C |
| 4 | 305 | 11.2 | 7.40 | 51.6 | A | 34 | 200 | 16.5 | 6.68 | 177 | C |
| 5 | 157 | 16.0 | 7.70 | 159 | A | 35 | 110 | 19.8 | 7.35 | 213 | C |
| 6 | 320 | 17.2 | 7.84 | 84.1 | A | 36 | 130 | 16.5 | 6.88 | 127 | C |
| 7 | 150 | 14.6 | 7.22 | 76.9 | A | 37 | 229 | 17.1 | 6.65 | 434 | C |
| 8 | 200 | 16.0 | 7.25 | 77.4 | A | 38 | 160 | 15.7 | 7.71 | 79.4 | C |
| 9 | 200 | 15.6 | 7.37 | 44.8 | A | 39 | 350 | 21.2 | 8.19 | 170 | C |
| 10 | 210 | 16.8 | 7.81 | 269 | A | 40 | 150 | 15.4 | 6.58 | 163 | C |
| 11 | 200 | 13.0 | 6.84 | 92.5 | A | 41 | 200 | 15.5 | 7.53 | 154 | C |
| 12 | 248 | 15.0 | 7.02 | 88.4 | A | 42 | 218 | 14.8 | 8.07 | 210 | C |
| 13 | 150 | 14.3 | 7.97 | 105 | A | 43 | 190 | 17.6 | 8.31 | 124 | C |
| 14 | 200 | 15.7 | 7.69 | 58.1 | A | 44 | 149 | 15.7 | 7.04 | 76.3 | C |
| 15 | 107 | 15.0 | 6.65 | 209 | A | 45 | 140 | 14.4 | 6.59 | 161 | C |
| 16 | 199 | 18.6 | 7.81 | 167 | A | 46 | 90 | 15.8 | 7.41 | 67.8 | C |
| 17 | 155 | 17.8 | 7.90 | 221 | A | 47 | 180 | 19.0 | 7.08 | 105 | C |
| 18 | 200 | 14.4 | 6.75 | 198 | A | 48 | 150 | 16.3 | 7.77 | 94.6 | C |
| 19 | 250 | 16.0 | 6.88 | 218 | A | 49 | 140 | 16.9 | 6.95 | 105 | C |
| 20 | 220 | 14.8 | 7.62 | 332 | B | 50 | 248 | 13.9 | 7.11 | 102 | C |
| 21 | 135 | 17.6 | 6.57 | 287 | B | 51 | 180 | 11.8 | 7.09 | 101 | C |
| 22 | 175 | 15.6 | 7.91 | 214 | B | 52 | 250 | 16.9 | 6.98 | 80.7 | D |
| 23 | 430 | 15.1 | 6.20 | 220 | B | 53 | 283 | 16.4 | 7.19 | 94.8 | D |
| 24 | 325 | 15.9 | 8.35 | 83.3 | B | 54 | 210 | 18.1 | 7.14 | 225 | D |
| 25 | 160 | 14.2 | 7.78 | 323 | B | 55 | 200 | 16.0 | 7.13 | 68.3 | D |
| 26 | 100 | 14.0 | 7.70 | 153 | B | 56 | 302 | 17.4 | 7.54 | 189 | D |
| 27 | 210 | 14.5 | 7.57 | 112 | B | 57 | 160 | 14.0 | 7.37 | 108 | D |
| 28 | 200 | 14.5 | 7.57 | 112 | B | 58 | 430 | 17.3 | 7.60 | 116 | E |
| 29 | 220 | 15.4 | 7.79 | 197 | B | 59 | 286 | 16.2 | 7.29 | 137 | E |
| 30 | 139 | 14.8 | 8.45 | 106 | B |
A: Precambrian metamorphic rocks (PMET); B: Ogcheon metamorphic rocks (OMET); C: Jurassic granite (JGRA); D: Cretaceous granite (CGRA); E: porous volcanic rocks (PVOL); Temp., temperature; EC, electrical conductivity.
Table 2.
Radon concentrations (Bq/L) in 59 raw water and 54 treated water samples and reduction rates (Red. rate) for each facility.
Table 2.
Radon concentrations (Bq/L) in 59 raw water and 54 treated water samples and reduction rates (Red. rate) for each facility.
| Company No. | Raw Water | Treated Water | Red. Rate (%) | Company No. | Raw Water | Treated Water | Red. Rate (%) |
|---|---|---|---|---|---|---|---|
| 1 | 5.2 ± 0.4 | 3.7 ± 0.3 | 29.1 | 31 | 34.7 ± 2.3 | 6.8 ± 0.5 | 80.5 |
| 2 | 168.4 ± 3.7 | 19.1 ± 0.4 | 88.7 | 32 | 53.9 ± 2.8 | 14.1 ± 1.3 | 73.9 |
| 3 | 40.2 ± 1.7 | 6.9 ± 0.6 | 82.9 | 33 | 97.8 ± 6.7 | 17.1 ± 0.9 | 82.5 |
| 4 | 46.4 ± 3.2 | 1.4 ± 0.2 | 97.0 | 34 | 239.0 ± 8.9 | 78.7 ± 1.7 | 67.1 |
| 5 | 27.6 ± 2.0 | 3.7 ± 0.3 | 86.5 | 35 | 11.0 ± 0.8 | 3.4 ± 0.2 | 68.9 |
| 6 | 17.8 ± 1.4 | 9.8 ± 0.5 | 44.8 | 36 | 273.0 ± 16.6 | 61.0 ± 3.3 | 77.6 |
| 7 | 53.0 ± 3.1 | 6.6 ± 0.5 | 87.6 | 37 | 287.8 ± 6.3 | 45.8 ± 1.8 | 84.1 |
| 8 | 27.2 ± 1.3 | 4.6 ± 0.3 | 83.1 | 38 | 3.7 ± 0.4 | 0.1 ± 0.0 | 97.8 |
| 9 | 41.4 ± 2.0 | 10.7 ± 0.3 | 74.1 | 39 | 8.2 ± 0.7 | 5.5 ± 0.2 | 32.9 |
| 10 | 24.9 ± 1.7 | 4.6 ± 0.3 | 81.5 | 40 | 97.6 ± 4.0 | - | - |
| 11 | 48.1 ± 2.7 | 19.4 ± 1.5 | 59.7 | 41 | 54.3 ± 3.2 | 13.1 ± 1.0 | 76.0 |
| 12 | 16.2 ± 1.2 | 1.3 ± 0.2 | 92.0 | 42 | 68.7 ± 4.9 | 2.9 ± 0.1 | 95.7 |
| 13 | 49.9 ± 2.2 | 31.3 ± 2.1 | 37.3 | 43 | 62.4 ± 3.8 | 13.3 ± 0.3 | 78.7 |
| 14 | 4.6 ± 0.5 | 3.8 ± 0.3 | 16.1 | 44 | 129.9 ± 3.1 | - | - |
| 15 | 133.3 ± 7.0 | 2.5 ± 0.2 | 98.1 | 45 | 375.4 ± 24.1 | - | - |
| 16 | 56.5 ± 4.0 | 7.9 ± 0.5 | 86.0 | 46 | 111.9 ± 4.2 | 29.7 ± 1.3 | 73.5 |
| 17 | 8.0 ± 0.7 | 4.2 ± 0.1 | 47.2 | 47 | 59.5 ± 4.0 | 5.9 ± 0.4 | 90.0 |
| 18 | 31.2 ± 1.8 | 10.7 ± 0.3 | 65.6 | 48 | 120.2 ± 2.2 | 34.0 ± 2.0 | 71.8 |
| 19 | 263.2 ± 7.3 | 79.2 ± 3.2 | 69.9 | 49 | 159.1 ± 10. | 72.1 ± 5.0 | 54.7 |
| 20 | 24.9 ± 1.7 | 0.3 ± 0.2 | 98.9 | 50 | 284.9 ± 18.5 | 239.4 ± 13.3 | 16.0 |
| 21 | 98.6 ± 3.1 | 5.9 ± 0.3 | 94.0 | 51 | 194.1 ± 13.8 | 6.3 ± 0.5 | 96.8 |
| 22 | 6.5 ± 0.6 | 0.5 ± 0.1 | 92.9 | 52 | 143.2 ± 7.3 | 22.3 ± 1.6 | 84.4 |
| 23 | 53.6 ± 3.8 | 11.4 ± 0.8 | 78.8 | 53 | 133.0 ± 4.6 | 6.7 ± 0.3 | 94.9 |
| 24 | 43.5 ± 3.0 | 2.3 ± 0.2 | 94.8 | 54 | 32.0 ± 1.6 | 1.9 ± 0.2 | 94.1 |
| 25 | 24.2 ± 1.6 | - | - | 55 | 33.1 ± 2.4 | 2.2 ± 0.2 | 93.5 |
| 26 | 13.6 ± 0.9 | 1.7 ± 0.1 | 87.7 | 56 | 112.8 ± 3.1 | 19.1 ± 0.4 | 83.1 |
| 27 | 476.8 ± 16.5 | 49.9 ± 2.9 | 89.5 | 57 | 36.1 ± 2.5 | 10.7 ± 0.9 | 70.4 |
| 28 | 15.5 ± 0.8 | 10.1 ± 0.6 | 34.6 | 58 | 15.7 ± 1.2 | 5.1±0.20 | 67.5 |
| 29 | 60.3 ± 4.7 | 4.6 ± 0.3 | 92.4 | 59 | 19.5 ± 1.4 | 9.5 ± 0.4 | 51.5 |
| 30 | 39.4 ± 2.6 | 10.8 ± 0.7 | 72.5 |
Table 3.
Summary of radon concentrations (Bq/L) in the bottled water produced by different countries.
Table 3.
Summary of radon concentrations (Bq/L) in the bottled water produced by different countries.
| Country | No. of Samples | Rn (Bq/L) | Geometric Mean | References |
|---|---|---|---|---|
| Algeria | 8 | 2.6–14 | 7 1 | Amrani (2001) |
| Austria | 197 | <0.12–18.0 | 0.54 | Kralik et al. (2003) |
| Iran | 72 | 0–0.9 | 0.64 | Fakhri (2015) |
| Korea | 54 | 0.1–239.4 | 7.8 2 | This study |
| Portugal | 63 | 1–814 | 16.7 | Dueñas et al. (1999) |
| Spain | 84 | 0.22–52.0 | 1.2 | Dueñas et al. (1999) |
1 Arithmetic mean; 2 Raw water was passed through the filtration process before bottling.
Table 4.
Simple statistical analysis of the radon concentrations (Bq/L) in the 59 raw water samples.
Table 4.
Simple statistical analysis of the radon concentrations (Bq/L) in the 59 raw water samples.
| Geology | No. of Samples | Min. | Max. | AM | GM | SD |
|---|---|---|---|---|---|---|
| PMET | 19 | 4.6 | 263.2 | 56.0 | 33.7 | 65.0 |
| OMET | 13 | 6.5 | 476.8 | 72.7 | 38.5 | 123.9 |
| CGRA | 6 | 32.0 | 143.2 | 81.7 | 66.0 | 53.4 |
| JGRA | 19 | 3.7 | 375.4 | 138.9 | 85.2 | 108.4 |
| PVOL | 2 | 15.7 | 19.5 | 17.6 | 17.5 | 2.7 |
| Total | 59 | 3.7 | 476.8 | 87.7 | 49.0 | 98.9 |
Min.: minimum; Max.: maximum; AM: arithmetic mean; GM: geometric mean; SD: standard deviation.
© 2020 by the authors. Licensee MDPI, Basel, Switzerland. This article is an open access article distributed under the terms and conditions of the Creative Commons Attribution (CC BY) license (http://creativecommons.org/licenses/by/4.0/).
Share and Cite
MDPI and ACS Style
Cho, B.W.; Hwang, J.H.; Lee, B.D.; Oh, Y.H.; Choo, C.O. Radon Concentrations in Raw Water and Treated Water Used for Bottled Water in South Korea. Sustainability 2020, 12, 5313. https://0-doi-org.brum.beds.ac.uk/10.3390/su12135313
AMA Style
Cho BW, Hwang JH, Lee BD, Oh YH, Choo CO. Radon Concentrations in Raw Water and Treated Water Used for Bottled Water in South Korea. Sustainability. 2020; 12(13):5313. https://0-doi-org.brum.beds.ac.uk/10.3390/su12135313
Chicago/Turabian StyleCho, Byong Wook, Jae Hong Hwang, Byeong Dae Lee, Yong Hwa Oh, and Chang Oh Choo. 2020. "Radon Concentrations in Raw Water and Treated Water Used for Bottled Water in South Korea" Sustainability 12, no. 13: 5313. https://0-doi-org.brum.beds.ac.uk/10.3390/su12135313
Note that from the first issue of 2016, this journal uses article numbers instead of page numbers. See further details here.