Future Energy and Environmental Implications of Electric Vehicles in Palestine


Civil Engineering Department, An-Najah National University, Nablus P.O. Box 7, Palestine
*
Author to whom correspondence should be addressed.
Sustainability 2020, 12(14), 5515; https://0-doi-org.brum.beds.ac.uk/10.3390/su12145515
Submission received: 16 June 2020
/
Revised: 30 June 2020
/
Accepted: 1 July 2020
/
Published: 8 July 2020
(This article belongs to the Special Issue Road Traffic Engineering and Sustainable Transportation)
Abstract
:During the last two decades, problems related to high-energy consumption and greenhouse gas (GHG) emissions by the transportation sector have arisen. Therefore, several alternatives have been investigated, in order to reduce the dependence on the conventional fuels that are used by land transportation modes. One of these promising alternatives is the electric vehicles (EVs), which seem to be the future replacement for conventional vehicles. Thus, this study aims to quantify the energy and the environmental implications of EVs in Palestine in 2030, considering that the current percentage of EVs is almost 0%. In this study, the needed parameters related to the number of vehicles and energy costs by source in Palestine were collected. Then, several prediction models have been developed in order to determine the energy and environmental implications of EVs in 2030, considering that 10% of conventional vehicles could be replaced by EV during the next 10 years (2020–2030). The results have showed that this could save USD 464.31 million in operating energy costs during 2030 (one year of saving). More specifically, this number is almost equal to 3.18% of the gross domestic product (GDP) of Palestine in 2018. Furthermore, significant amounts of GHG emissions could be reduced. The reduction (during 2030) in NH4, N2O, and CO2 emissions could be around 10.51%, 10%, and 6.86%, respectively.
1. Introduction
Recently, due to projected shortage of crude oil and the urgent need of reducing greenhouse gas (GHG) emissions, more efforts and resources have been spent on developing a sustainable transportation system that can address the climate change challenge and reduce oil dependence [1,2]. Among many innovative technologies, developing electric vehicles (EVs) has been one of the most effective approaches to reduce GHG emissions and oil dependence.
The problem of GHG emissions that are produced from the transportation sector is one of the main environmental problems in Palestine. In 2014, the total amount of CO2 emissions produced by transportation sector was 2364.9 thousand tons, namely about 74.4 percent of the national CO2 emissions [3].
The high price of fuel is another problem that the transportation sector faces in Palestine. More specifically, the average gasoline price (per liter) in 2019 was about USD 1.75, while the world average price was about USD 0.99 [4]. In other words, the average fuel price in Palestine is about 177% in relation to the world’s average.
Generally, EVs are more energy efficient and less noisy than internal combustion vehicles (ICVs). Furthermore, the environmental impacts of EVs using renewable energy sources seem to be more realistic than the extensive use of conventional fuels for ICVs [5]. Despite all of these benefits, the percentage of registered EVs in Palestine was about 0 percent in 2018, due to several restrictions on cars’ importing through Israel’s seaports and borders [3].
The indirect CO2 emissions from EVs vary significantly among regions, based on the source of electricity. However, EVs powered by hydropower-based electricity could significantly decrease the CO2 emission; whereas, EVs powered by coal-based electricity could increase CO2 emissions by 7.3 percent, compared to ICVs [6].
In Palestine, the absence of studies and information related to EVs, makes it difficult for decision makers and companies to consider this sector in short-term and even-long term plans; moreover, this makes people confused about the implications and benefits of owning EVs. However, this study does not address all aspects of EVs, it aims to offer the basic information and indications about the expected implications of EVs in Palestine, and to pave the way for more comprehensive studies in this field.
This study aims to assess the energy and the environmental implications of future use of EVs in Palestine. These implications depend mainly on the source of electricity in Palestine, projected fuel rates, projected electricity rates, and projected total vehicle-kilometer of travel. The study has quantified the implications of replacing 10% of conventional vehicles with EVs within the next 10 years (2020–2030). Using a specific percentage of replacement (10%) is only to provide an indication of the energy and environmental benefits that could be obtained by using EVs.
2. Literature Review
During the last two decades, several studies have investigated the implications of using electrical vehicles from different aspects. The results of the studies have varied significantly among regions. In some regions, the studies have proven significant benefits of using EVs, while, in other ones, the studies have proven insignificant benefits. On the contrary, in few regions, some studies have showed negative attributes of using EVs.
Thus, impacts assessment of using EVs depends on many factors, which should be investigated based on regions, since these factors vary significantly among regions. For example, energy and environmental assessments of using EVs (as in this study) depend mainly on the source of electricity, fuel rates, electricity rates, electricity efficiency (electricity consumption) of EVs, and expected gas emissions by EVs (gas emissions at electricity plants).
Around the world, several studies have tried to quantify the energy and the environmental impacts of using EVs in specific regions. Lang et al. [7] conducted one of these studies in China. The expected environmental and energy impacts of EVs during 2010–2020 were investigated through an energy conversion analysis. The results showed that EVs could reduce the energy consumption by 18%. Moreover, a significant reduction in CO2 emissions could be obtained by using EVs.
Likewise, Huo et al. [6] conducted a study in China in order to evaluate the future environmental impacts of EVs. The study determined the expected GHG emission that could be produced in order to generate the amount of electricity that is required for the EVs’ operation. The results showed that a significant reduction in CO2 emissions could be obtained by EVs in regions where hydropower is the main source of electricity. In regions where the coal is the main source of electricity, a slight reduction in CO2 could be obtained, and a significant increase in NOx could be obtained by EVs.
In Germany, a study conducted by Braun and Rid [5] determined the difference in energy consumption between one ICV and an equivalent EV. The vehicles were equipped with several devices, in order to measure the energy consumption data during operation. The two vehicles travelled within a specific route around the city of Erfurt, Germany. The relative energy efficiency advantage of electric vehicle was about 77% for urban driving compared to ICV.
In the United States, a study conducted by Brennan and Barder [8] determined the true cost and environmental impacts of EVs, depending on each component of the vehicle. The study indicated that the electricity cost associated with operating an EV over a distance of one mile is significantly lower than the gasoline cost required to operate a comparable ICV over the same distance.
Another study was conducted by Kawamoto et al. [9] to estimate the CO2 emissions of ICVs and EVs. In the study, the CO2 emissions of conventional gasoline and diesel ICVs were compared with the ones produced in power plants, in order to provide the EVs with the required electricity. The US, the European Union, Japan, China, and Australia were selected as the reference regions for vehicle operation. The results showed that in these regions, where the renewable energy sources were used in electricity production, the total amount of CO2 emissions produced in electricity plants was lower than the amount produced by ICVs.
In Palestine, where the EVs importing started in 2019, the number of EVs is still very close to 0%; as such, there are no previous studies addressing this subject. However, there are a few studies addressing the environmental impacts of improving the existing traffic systems, such as [10]. Therefore, it is highly recommended to have a future energy and environmental assessment of EVs. Thus, this study aims to determine the future energy and environmental impacts of EVs in Palestine in 2030, assuming that 10% of the conventional ICV could be replaced with EVs during the next 10 years (2020–2030). In order to achieve this impact assessment, projected gas emissions by EVS (at electricity plants), projected total vehicle-kilometers of travel, projected emissions from ICVs, fuel rates, and electricity rates have been determined, using prediction models.
3. Data and Methodology
In this study, a large amount of data has been initially collected from several sources. The data included the annual total number of vehicles (1994–2017), the total vehicle-kilometers of travel by diesel and gasoline ICVs, the fuel efficiency factor (consumption rate) for diesel and gasoline ICVs (2018), the diesel and gasoline fuel rates (1998–2020), the electricity rates (2004–2020), the sources of electricity (coal, oil, natural gas, wind, solar), and the amount of electricity produced from each source in Palestine.
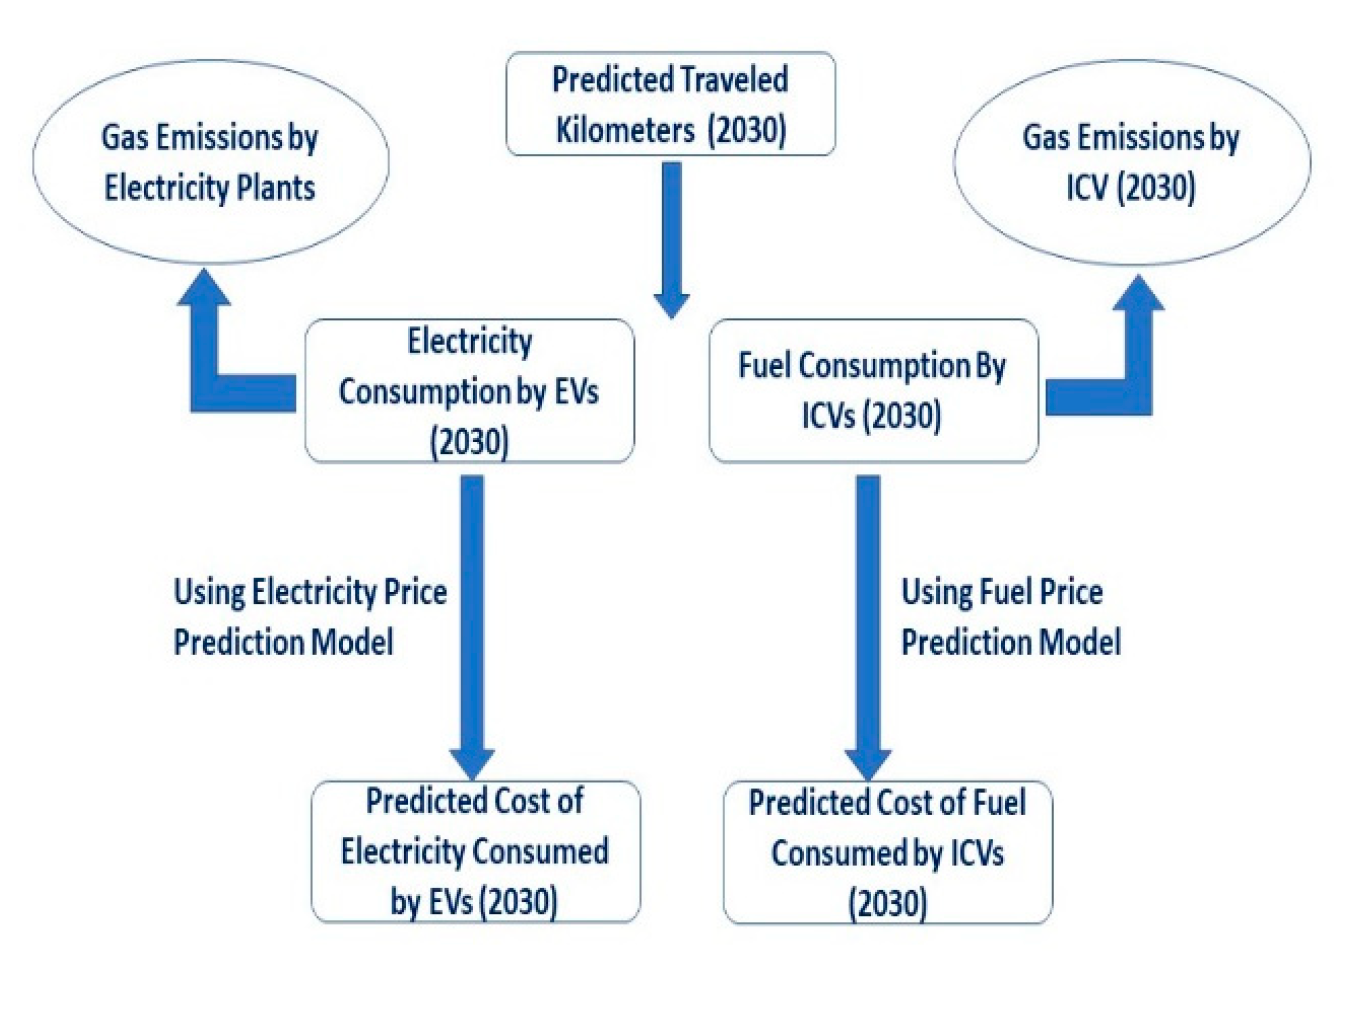
Then, prediction models for the total number of vehicles, gasoline and diesel fuel rates, and electricity rates have been developed, in order to determine the energy and environmental implications of EVs in 2030, in case that 10% of ICVs are replaced by EVs during the next 10 years (2020–2030), as shown in Figure 1. The 10% replacement has been used as an indication about the expected benefits from EVs.
In this study, the exponential smoothing method has been used in developing the prediction models. This method applies an unequal set of weights to past data, and since the weights typically decay in an exponential manner from the most recent to the most distant data point, and this method is known as the exponential smoothing method [11].
The principle of exponential smoothing is to smooth the original series the way the moving average does, and to use the smoothed series in forecasting future values of the variable of interest. In exponential smoothing, the more recent values in the series have greater influence on the forecast of future values than the more distant observations. Exponential smoothing is a simple and pragmatic approach of forecasting, whereby the largest weight is given to the present observation, less weight to the immediately preceding observation, even less weight to the observation before that, and so on. Assuming that the observed time series are y1, y2, …, yn, the simple exponential smoothing equation could be written as in Equation (1) [12].
where yi is the actual, known series value for time period i, yˆi is the forecast value of the variable Y for time period i, yˆi+1 is the forecast value for time period i + 1, and α is the smoothing constant.
yˆ i+1 == αyi + (1 − α) yˆi
3.1. Prediction of Vehicle-Kilometres of Travel
First, vehicle-kilometers of travel by gasoline and diesel cars in 2014 (the only available yearly data) have been acquired from the Palestinian Central Bureau of Statistics [3]. Then, the exponential smoothing method has been used to develop a prediction model for the number of vehicles in 2030, using the annual number of vehicles (1994–2017) acquired from the Palestinian Central Bureau of Statistics (2018). Based on the percentage increase in the number of vehicles between 2014 and 2030, the expected vehicle-kilometers of travel in 2030 has been determined.
3.2. Prediction of GHG Emissions by ICVs
Using the predicted vehicle kilometers of travel in 2030 and the average fuel efficiency factors (consumption rate km/L) for diesel and gasoline cars in Palestine, the expected consumed amounts of diesel and gasoline by ICVs in 2030 have been calculated separately. Then, based on the average global emissions rate from diesel and gasoline fuels combustion, the expected total amount of GHG emissions by ICVs in 2030 has been calculated.
3.3. Prediction of Gas Emissions by EVs
Based on the predicted vehicle-kilometers of travel in 2030, and using a 10% of these kilometers to be travelled by EVs, the total consumed electricity by EVs has been calculated based on the average world electricity consumption rate of EVs (Km/Kwh). Next, the total amount of GHG emissions produced in the electricity plants to generate these amounts of electricity have been determined, based on the source of electricity in Palestine (natural gas, coal, oil, wind, solar) and the percentage of emissions from each of these sources.
3.4. Prediction of Fuel Cost Consumed by ICVs
Two prediction models have been developed to determine the expected diesel and gasoline fuel rates in 2030. Then, these data have been used, together with the predicted amount of diesel and gasoline fuel used by ICVs in 2030, in order to estimate the expected total cost of diesel and gasoline fuels to be used by ICVs in 2030.
3.5. Prediction of Electricity Cost by EVs
A prediction model has been developed to predict the electricity rates (USD/MWh) in 2030. Using these data, together with the predicted amount of consumed electricity by EVs in 2030, the expected total cost of electricity consumed by EVs in 2030 has been determined.
3.6. Determining the Energy and Environmental Implications of EVs
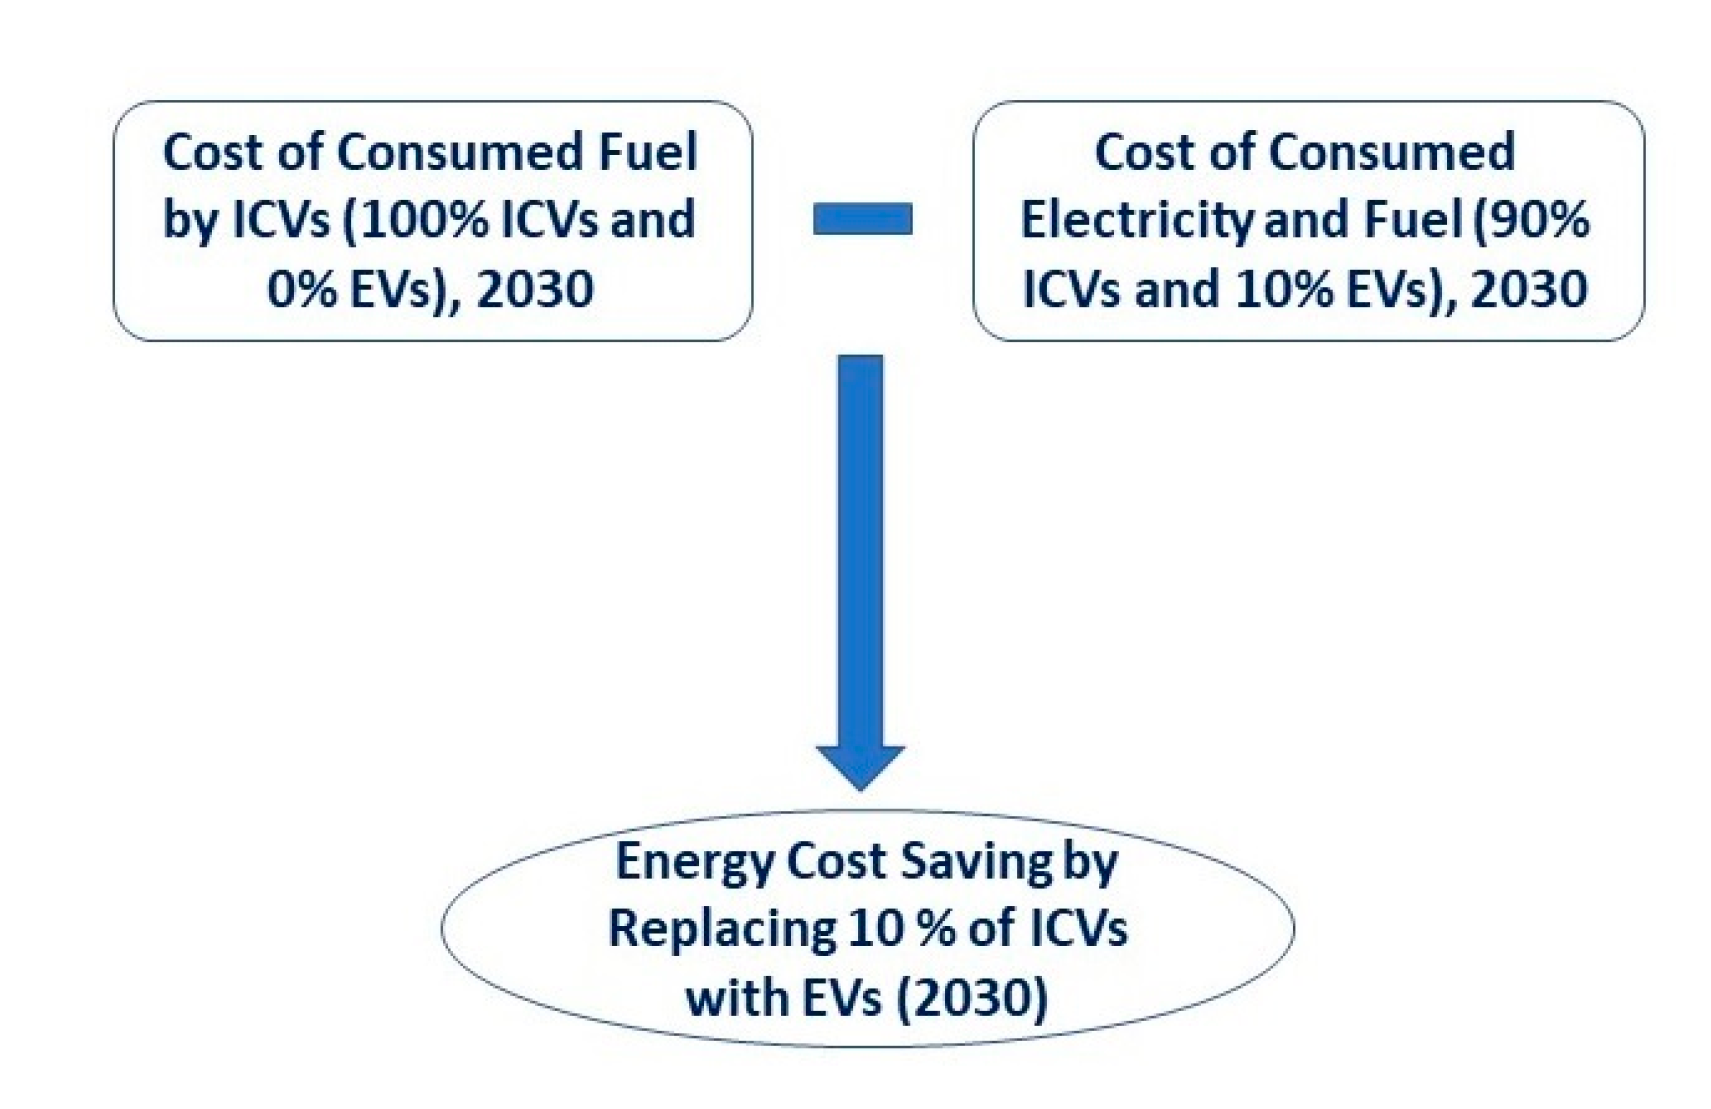
In this study, the energy consumption was determined based on Tank-to-Wheel (TTW) method, since it is the simplest method that could clarify the energy cost implications. In order to determine the energy cost that can be saved in 2030 by replacing 10% of the ICVs by EVs, the expected total cost of consumed fuels by ICVs in 2030 (Case I: 100% ICVs and 0% EVs) has been deducted by the expected total cost of the consumed energy by ICVs and EVs (Case II: 90% ICVs and 10% EVs), as shown in Figure 2.
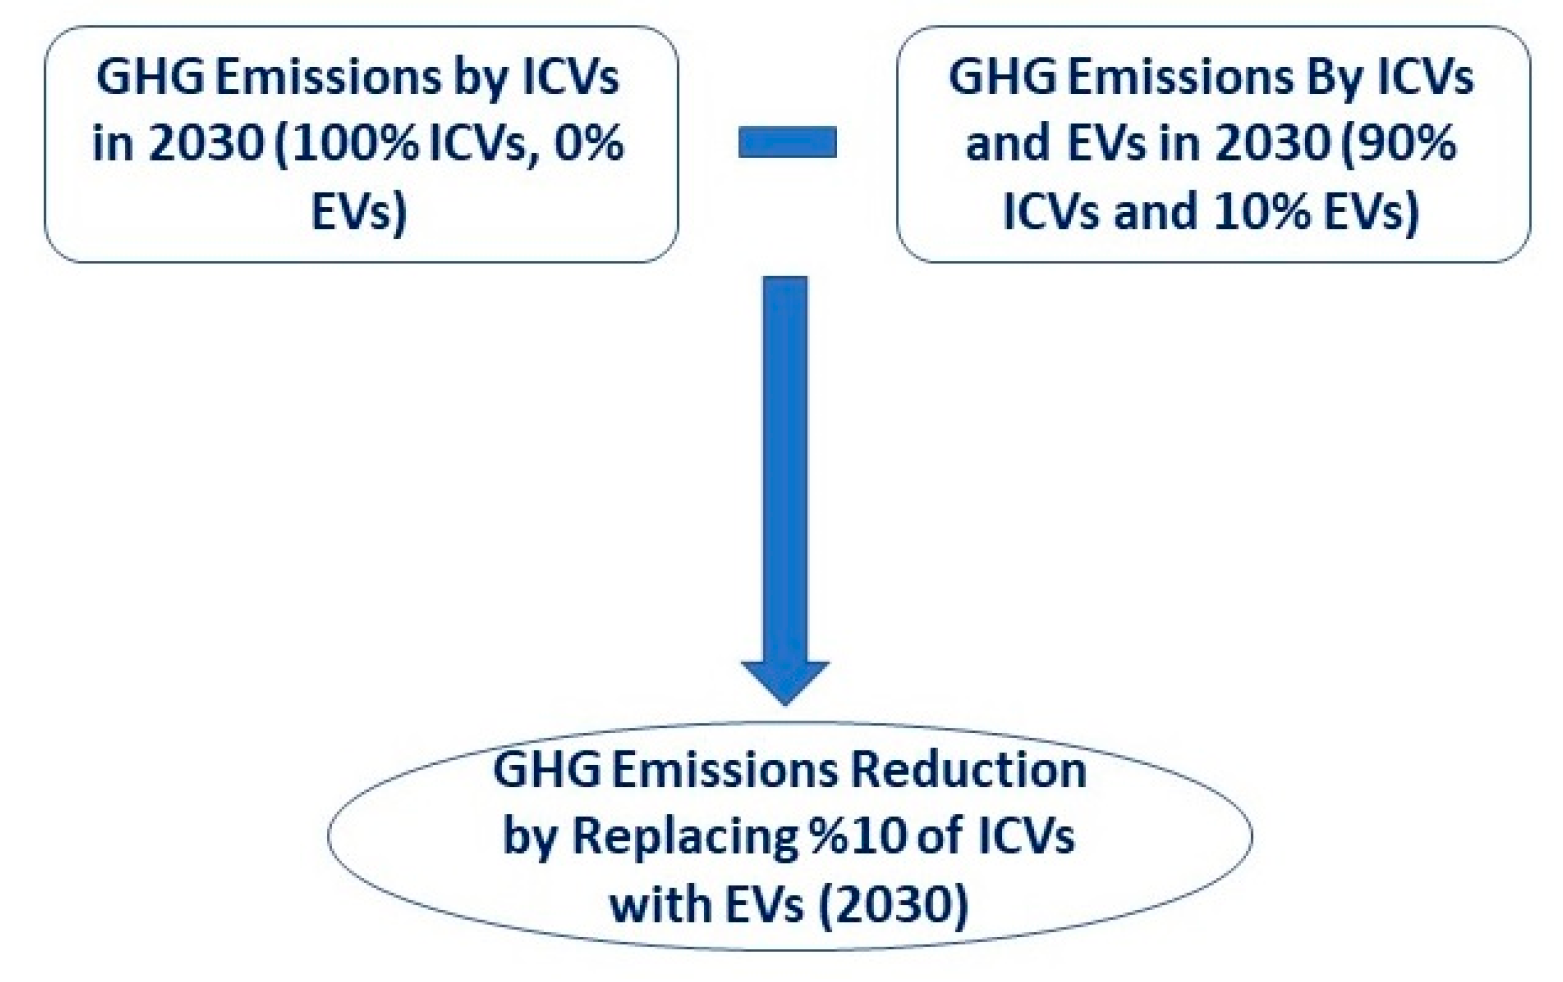
Similarly, in order to determine the amounts of GHG emissions that can be reduced in 2030 by replacing 10% of the ICVs by EVs during the next 10 years (2020–2030), the expected amounts of GHG emissions produced by ICVs in 2030 (Case I: 100% ICVs and 0% EVs) have been deducted by the expected amounts of GHG emissions produced by ICVs and EVs (Case II: 90% ICVs and 10% EVs), as shown in Figure 3.
In this study, the electricity generation emissions were assumed to be the same during the next 10 years, since that there is no official announced plan for a significant development in electricity power plants during the next 10 years. Efficiency improvements in ICVs and EVs during the next 10 years were neglected, since the majority of current vehicles will continue to be used for the next 10 years. Furthermore, the efficiency of both ICVs and EVs could be improved simultaneously, and this could keep the same trends. Moreover, charging infrastructures, modification to the distribution network, and the transmission and charging losses of electric vehicles were not included in this study.
4. Analysis and Discussion
In this study, the energy and the environmental implications of EVs in 2030 have been determined, in case 10% of ICVs will be replaced with EVs during 2020–2030. The analysis is presented in terms of annual vehicle-kilometer of travel, environmental impact, and energy impact.
4.1. Annual Vehicle Kilometres of Travel
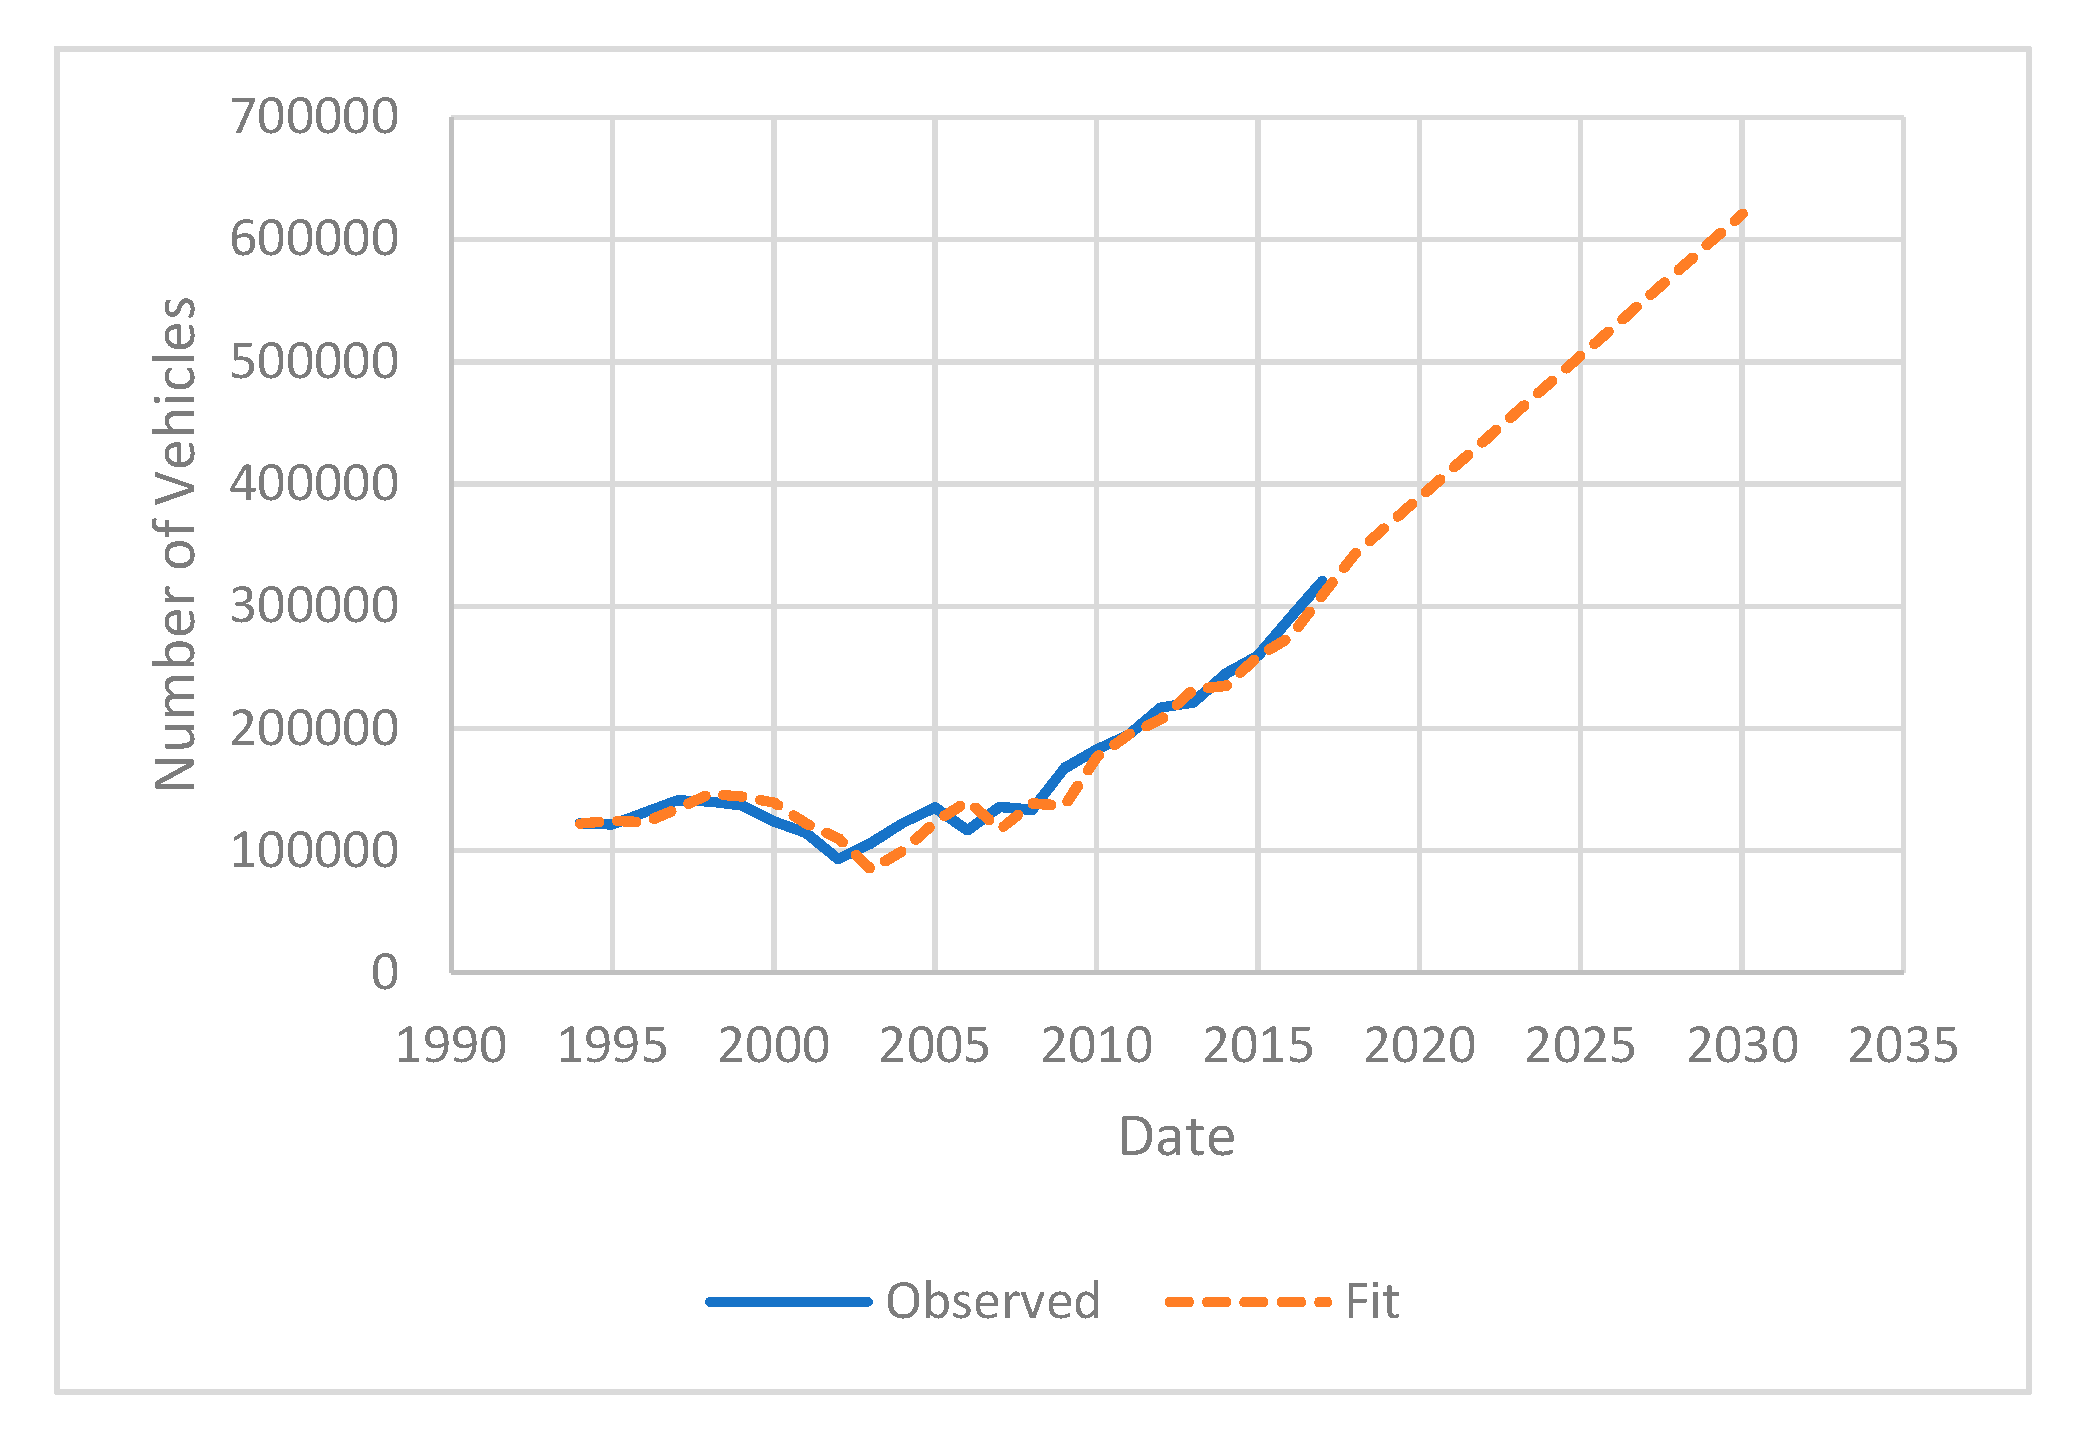
The estimated total vehicle-kilometers of travel, based on 2014 data (the only available yearly data), by gasoline and diesel vehicles were 5106 and 8882 million kilometers, respectively [3]. In order to estimate the total vehicle-kilometers of travel in 2030, data related to annual number of vehicles between 1994 and 2017 [13] have been initially used to develop a prediction model using Holt’s linear exponential smoothing method. Figure 4 shows the fit and observed data of the model.
The model has been developed using IBM SPSS 25, and the results of fit statistics have shown that the model has a good prediction fitness level (see Table 1), which has been the highest among other models (average moving, ARIMA, single exponential models, etc.).
Based on the developed model, the estimated total number of vehicles in 2030 would be 620,932, while the total number of vehicles in 2014 was 244,515 [3]. In other words, there is an expected 153.9% increase in the number of vehicles. Using the same increase rate, the estimated annual vehicle-kilometers of travel in 2030 would be 12,964 and 22,551 million kilometers for gasoline and diesel vehicles, respectively.
4.2. Environmental Impacts of EVs
According to the Palestinian Central Bureau of Statistics [12], the average fuel efficiency (consumption rate) of gasoline and diesel vehicles in Palestine are 0.11 and 0.12 (L/km). Based on this data, and using the estimated total travelled kilometers in 2030, the estimated amounts of diesel and gasoline fuels by ICVs in 2030, assuming that there are no EVs, will be 1409 and 2767 million liters, respectively.
Based on the estimated amounts of diesel and gasoline by ICVs in 2030, and using the average amounts of GHG emissions by diesel and gasoline combustion (emissions/L of fuel), the total amount of GHG emissions by ICVs in 2030 could be estimated. The average amounts of CH4, N2O, and CO2 emissions produced by gasoline combustion in ICVs are 0.72, 0.05, and 2597.87 gm/L, respectively. The average amounts of emissions produced by diesel combustion in ICVs are 0.04, 0.16, and 2924.90 gm/L, respectively [14]. Thus, the estimated total amount of CO2, N2O, and CO2 emissions in 2030 by ICVs (100% ICVs, 0% EVs) can be calculated as shown in Table 2.
In order to estimate the GHG emissions by EVs (emissions at power plants) in 2030, assuming that 10% of ICVs will be replaced by EVs, the total amount of consumed electricity in 2030 has been estimated, based on the estimated total travelled kilometers in 2030 and the average electricity consumption (electricity efficiency, kWh/km) by EVs. Since the average electricity consumption for all the EVs produced in 2020 is 0.186 kWh/km [15] and the total estimated travelled kilometers by both diesel and gasoline vehicles is 2030 is 35,515 million kilometers, the estimated total consumed electricity by EVs (Case II) in 2030 would be 660,579 MWh.
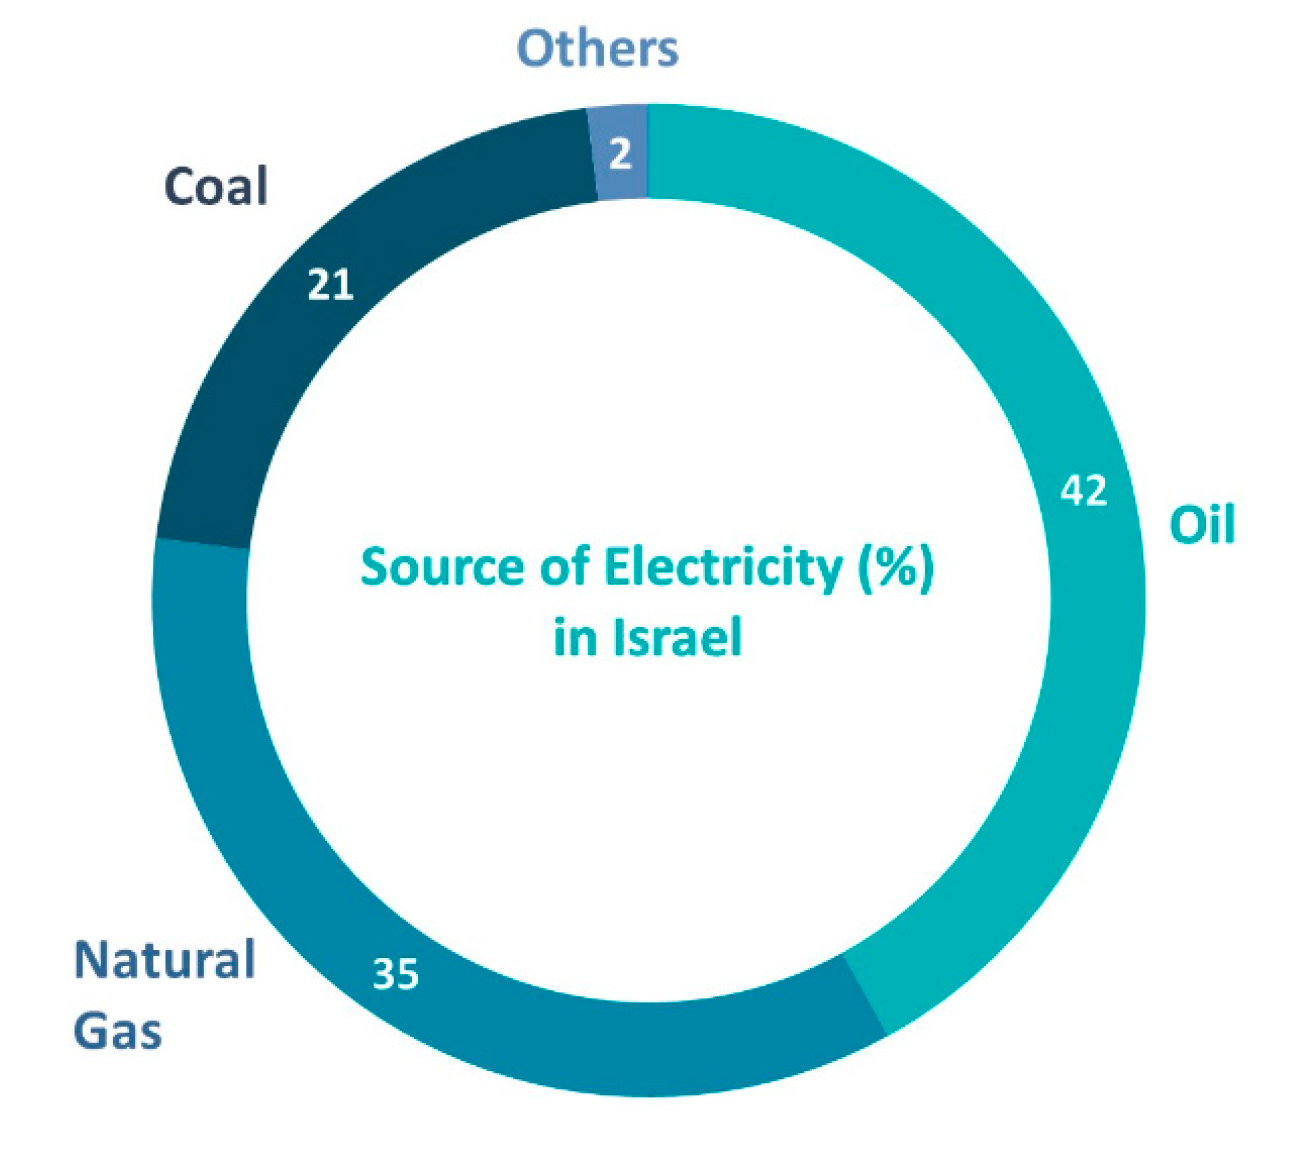
Estimating the GHG emissions by EVs depends mainly on the source of the electricity (coal, oil, natural gas, etc.). In Palestine, the consumed electricity power is imported mainly from Israel, which depends on several sources for electricity generation. These are: (1) oil, 42%; (2) natural gas, 35%; (3) coal, 21%; and (4) others, 2% [16], as shown in Figure 5. Since the coal-based electricity is not the major source of electricity, the expected amounts of GHG emissions could be significantly lower than the one of many other countries, such as China, with a coal-based electricity of more than 70% [7].
Based on the amounts of emissions in Table 3 for each source of electricity, the estimated amounts of GHG emissions for CH4, N2O, and CO2 are 8.40 gm/MWh, 7.11 gm/MWh, and 637 kg/MWh, respectively [17]. Therefore, the estimated total amounts of GHG emissions in 2030 (90% ICVs + 10% EVs) for CH4, N2O, and CO2 are 1018.19 (1012.64 + 5.55), 466.55 (461.85 + 4.70), and 10,999,028.90 (10,578,240 + 420,788.90) million tons, respectively.
The differences in GHG emissions between Case I and Case II are the amounts of GHG emissions that could be reduced in 2030 by replacing the 10% replacement, as shown in Table 4.
4.3. Energy Impacts of EVs
The amount of saving in energy cost in 2030 has been determined based on the estimated total consumed amounts of diesel and gasoline fuels by ICVs in Case I in 2030 (1409 million liters of gasoline and 2767 million liters of diesel), the estimated amount of consumed electricity by EVs in case II (10% EVs and 90% ICVs) in 2030 (660,579 MWh), and the estimated gasoline and diesel fuel rates in 2030.
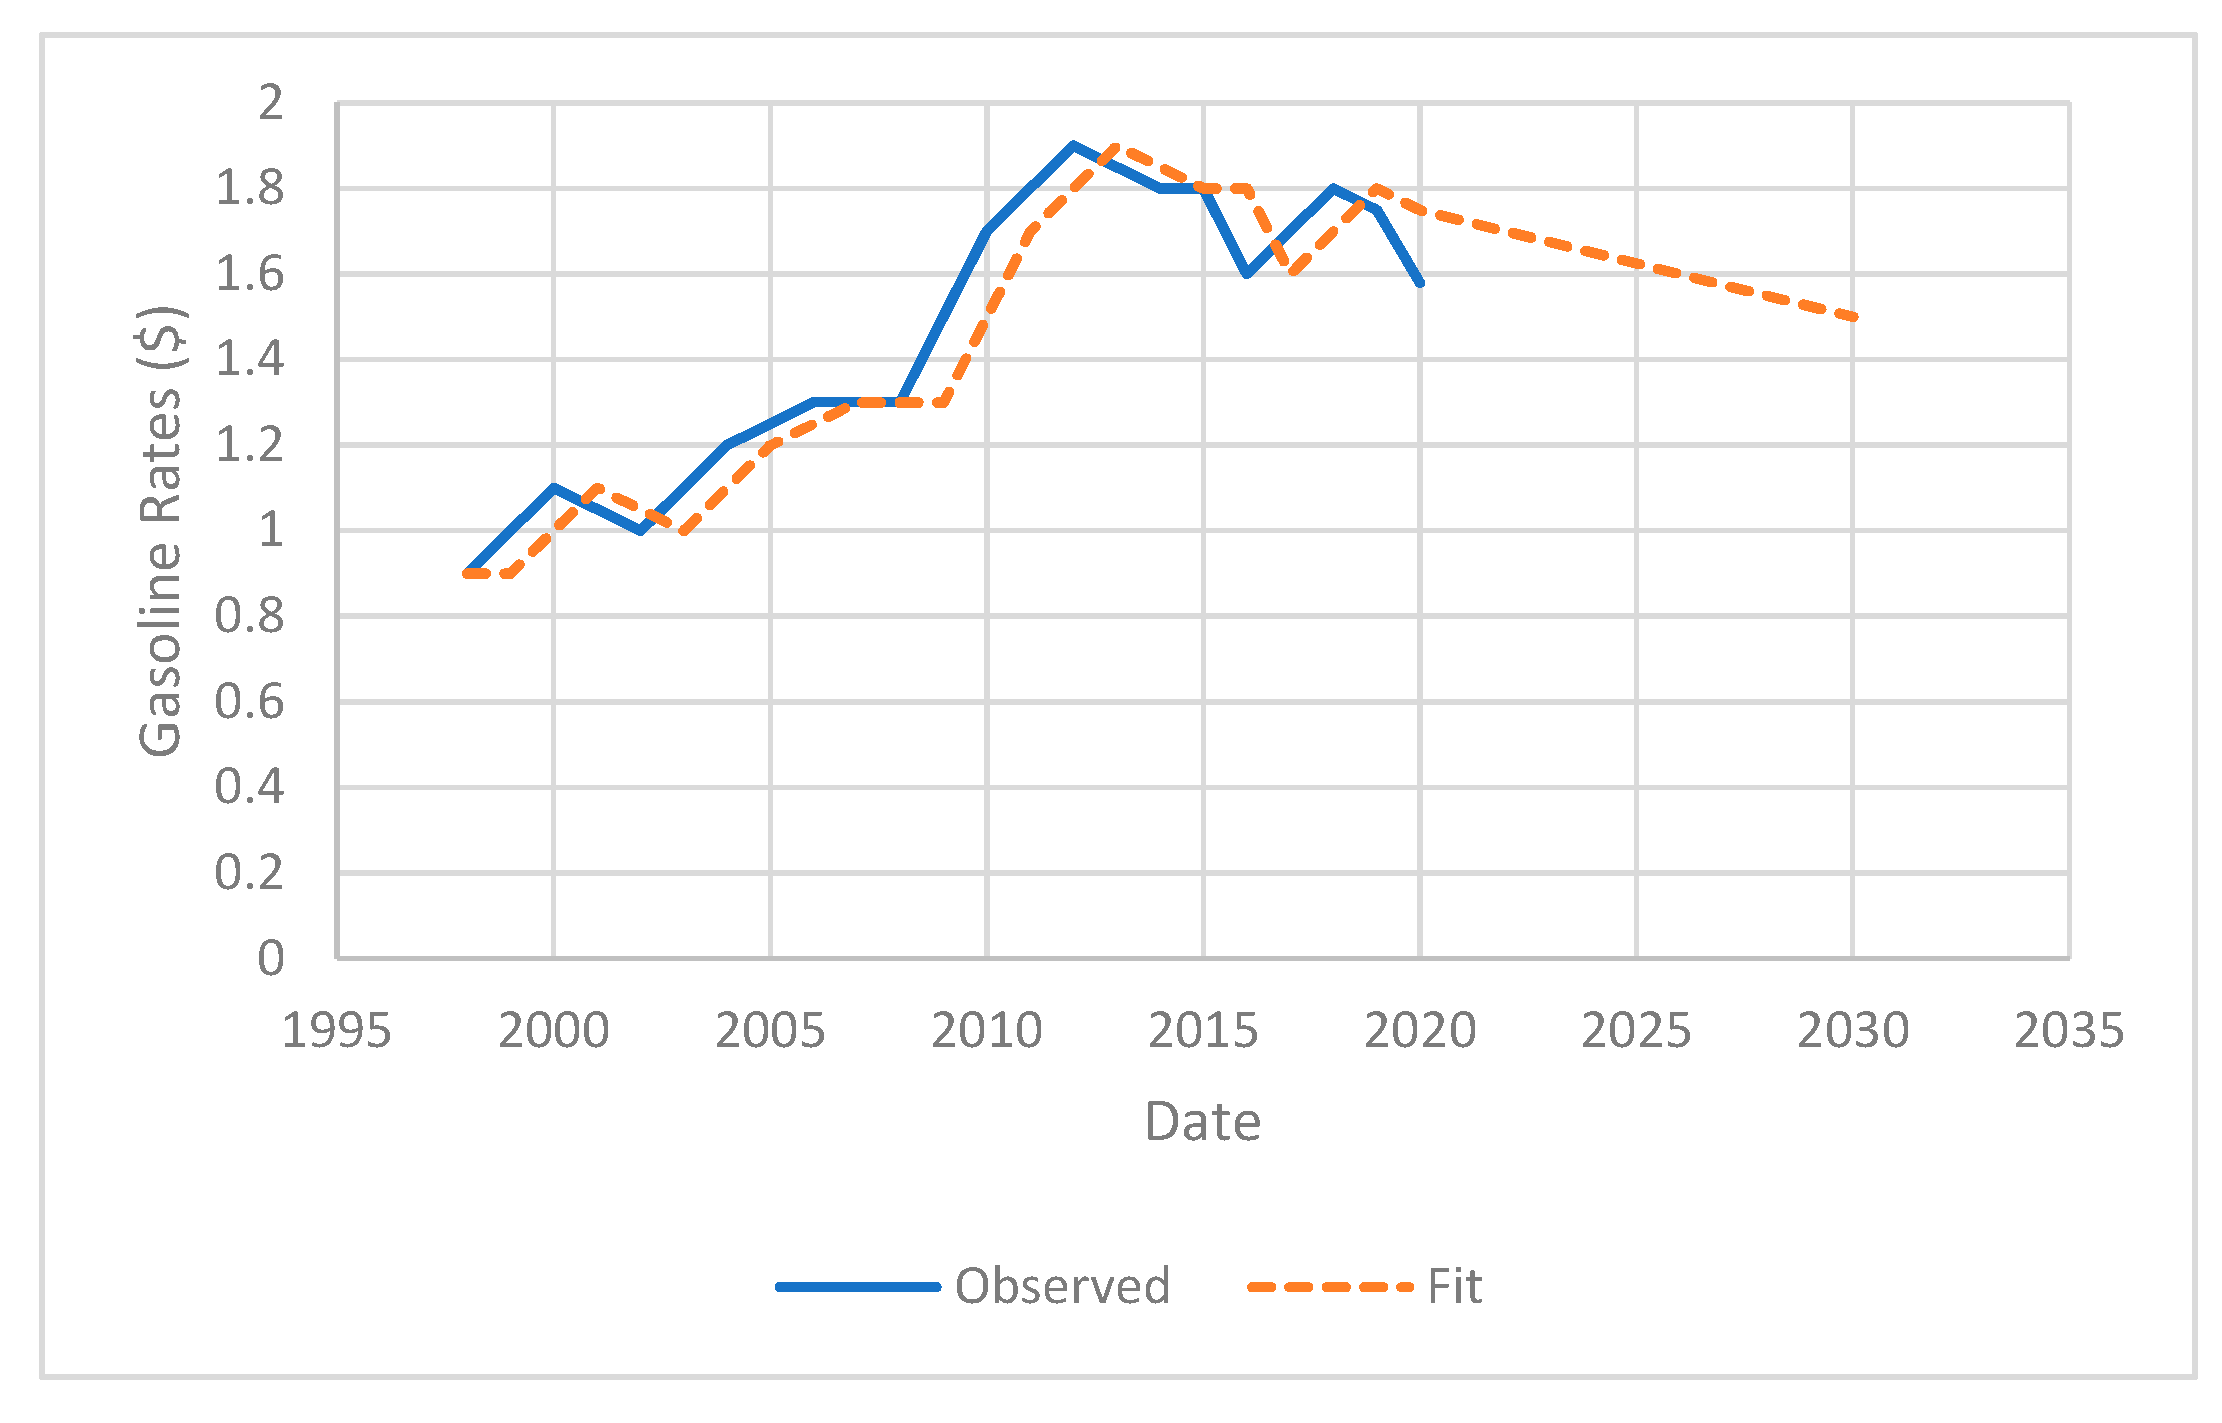
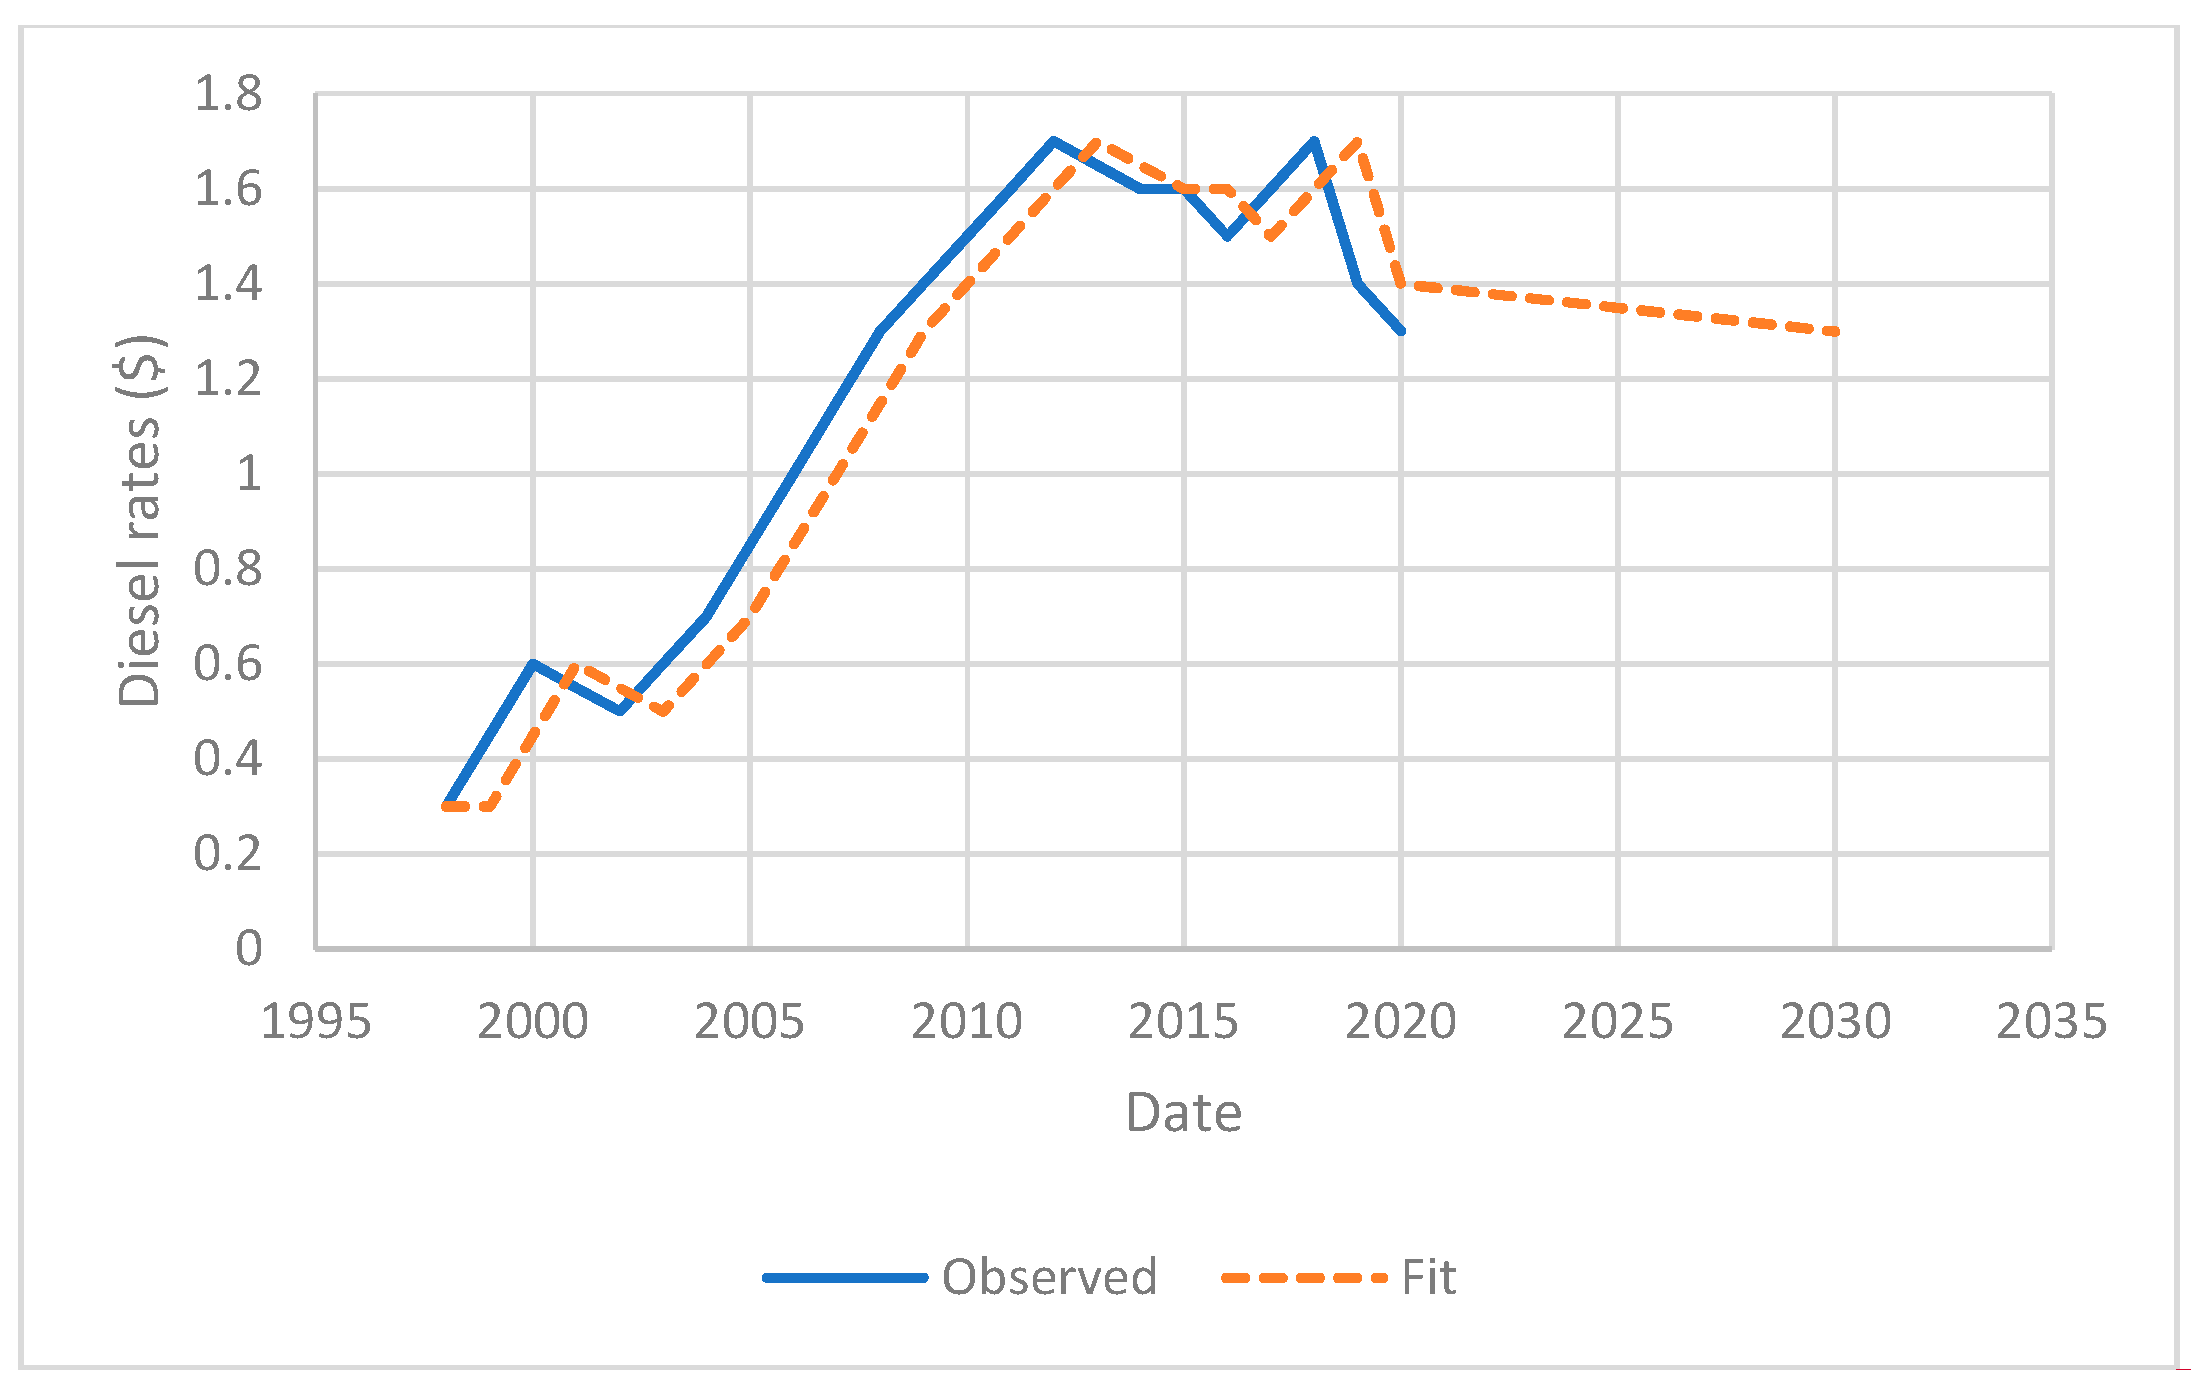
In order to estimate gasoline and diesel fuel rates in 2030, two prediction models have been developed using historical gasoline and diesel fuel rates data between 1998 and 2020 [18]. The single exponential smoothing method has been used to develop the two models. Fit and observed data for gasoline rate and diesel rate prediction models are shown in Figure 7; Figure 8, respectively.
The results of fit statistics showed that the model has a good prediction fitness level (see Table 5; Table 6), which has been the highest among other types of models (average moving, ARIMA, Holt’s linear exponential smoothing, etc.).
Using the developed prediction models, the gasoline and diesel fuel rates in 2030 could be estimated, and the results are USD1.5 and USD 1.3, respectively. Therefore, the total cost of consumed gasoline and diesel fuels in 2030 can be determined using the estimated total amounts of gasoline and diesel fuels in 2030, and the results are USD 2113.5 and USD 3597.1 million, respectively.
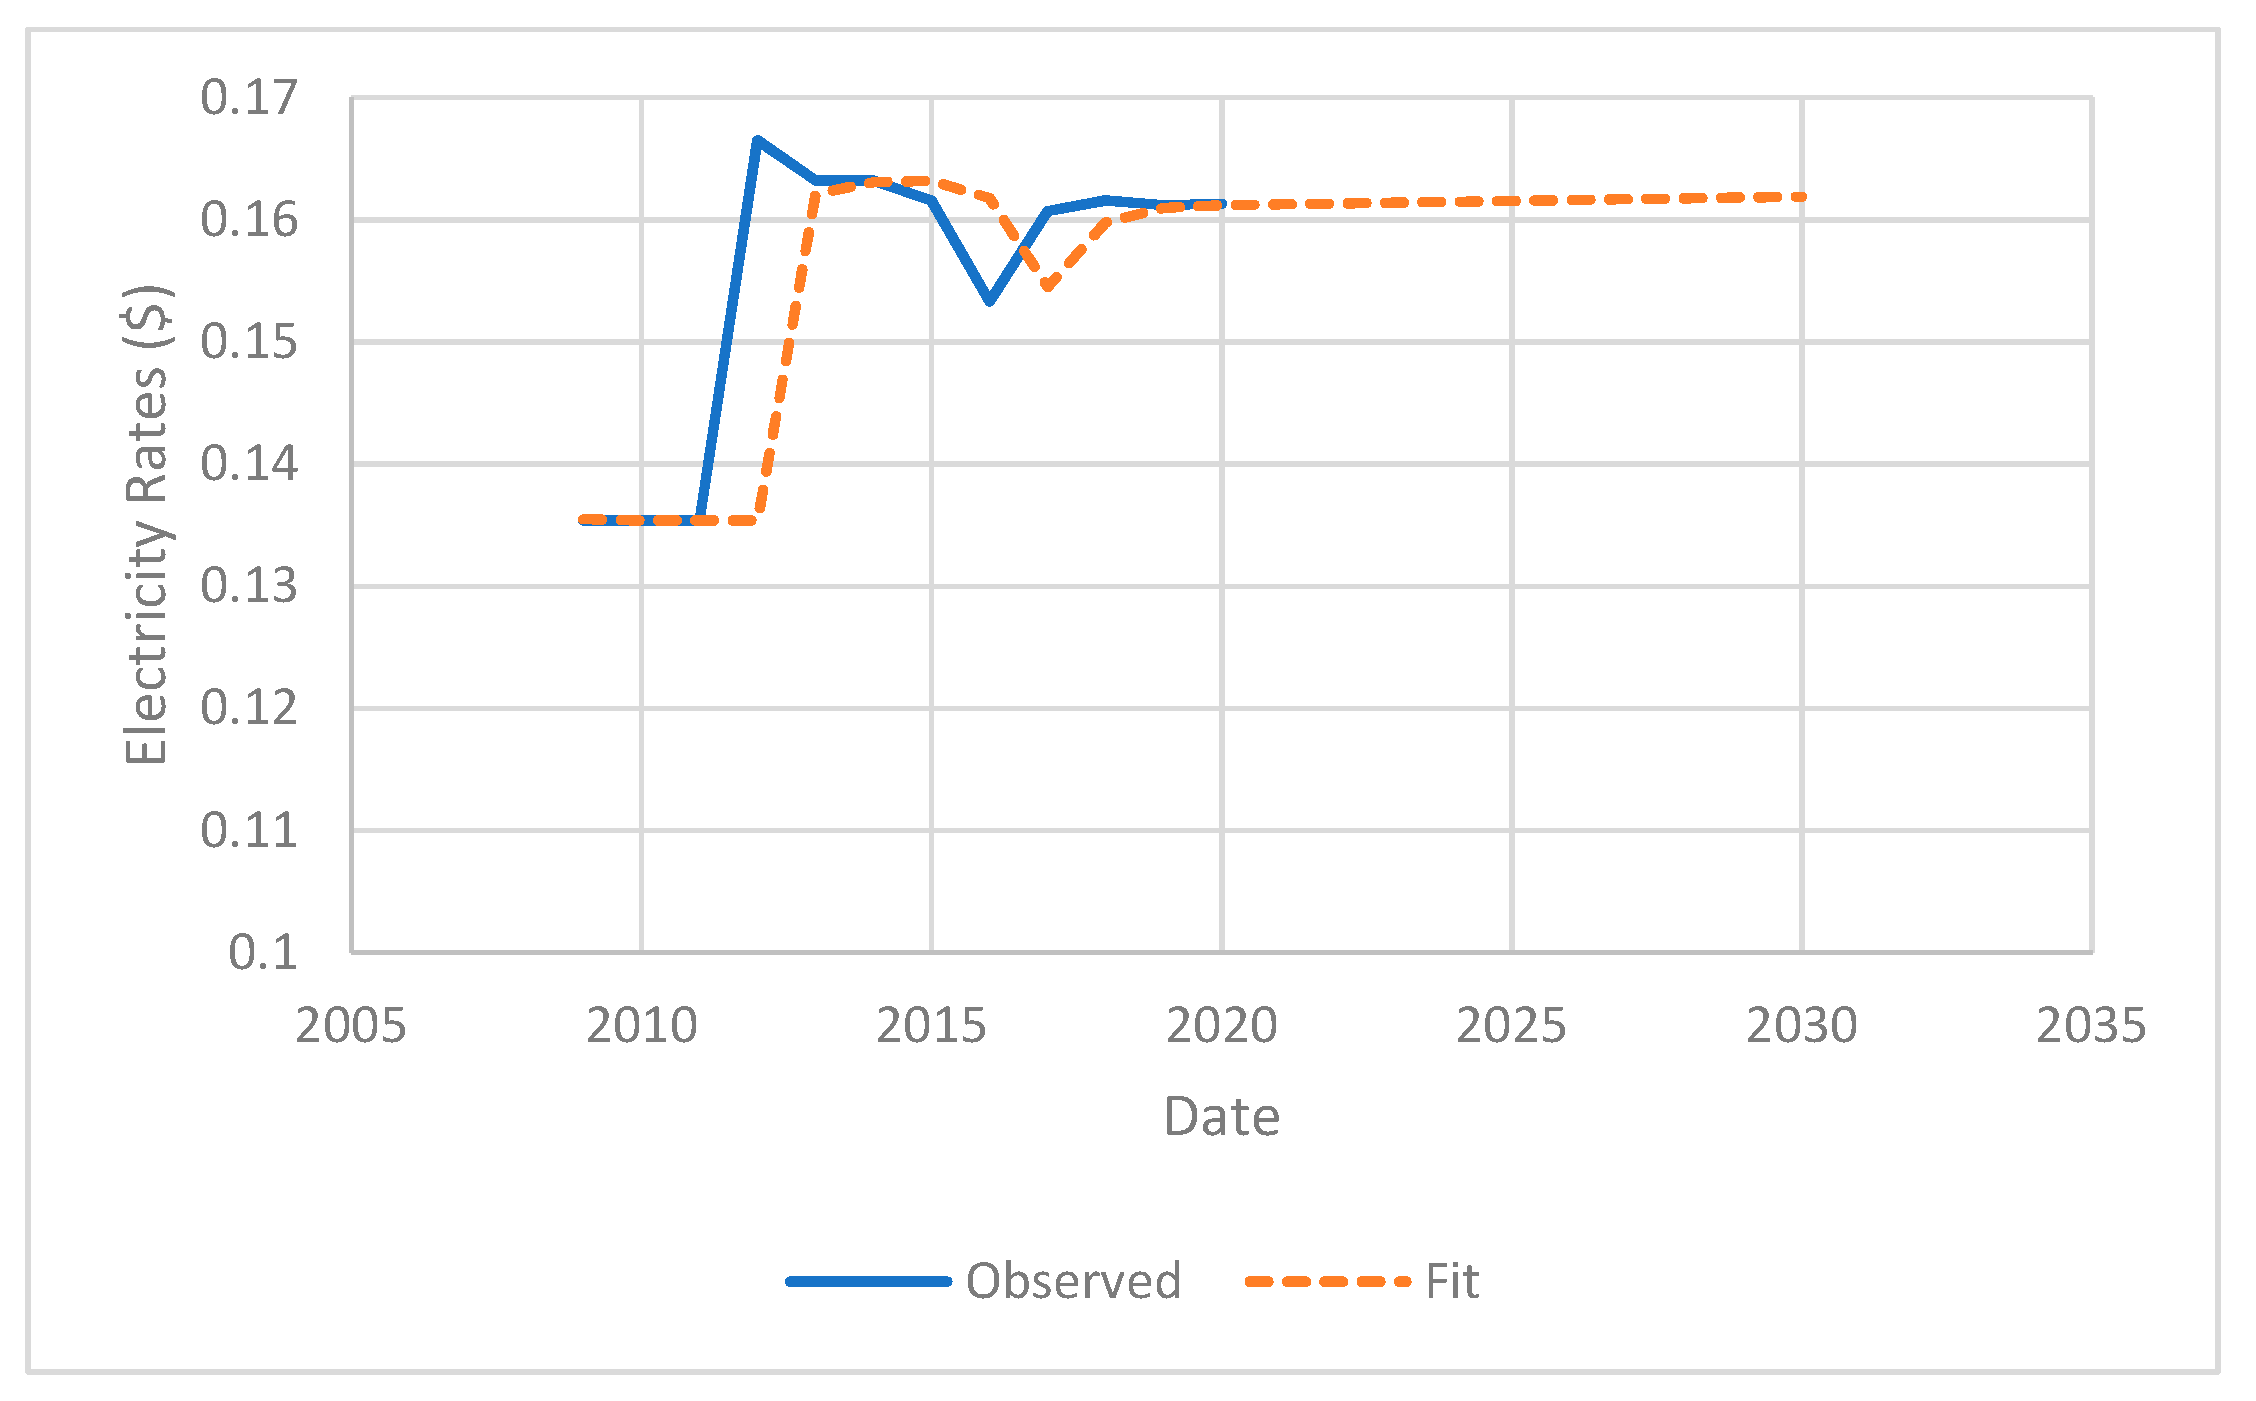
In order to estimate the electricity rates in 2030, a prediction model has been developed using the historical data of electricity rates between 2004 and 2020, using the single exponential smoothing method. Fit and observed data for electricity rate prediction models are shown in Figure 9.
The results of fit statistics have shown that the model has a good prediction fitness level (see Table 7), which has been the highest among other types of models (average moving, ARIMA, Holt’s linear exponential smoothing, etc.).
Similarly, using the developed prediction model, the average electricity rate in 2030 could be estimated, and the result is 0.16 USD /kWh. Thus, the total cost of consumed electricity in 2030 could be determined using the estimated total amounts of electricity in 2030 (660,579 MWh), which is USD 106.75 million.
The difference in estimated price of fuels (Case I) and estimated price of electricity (case II), is the amount of saving in energy cost in 2030 by replacing a 10% of ICVs by EVs, as shown in Table 8.
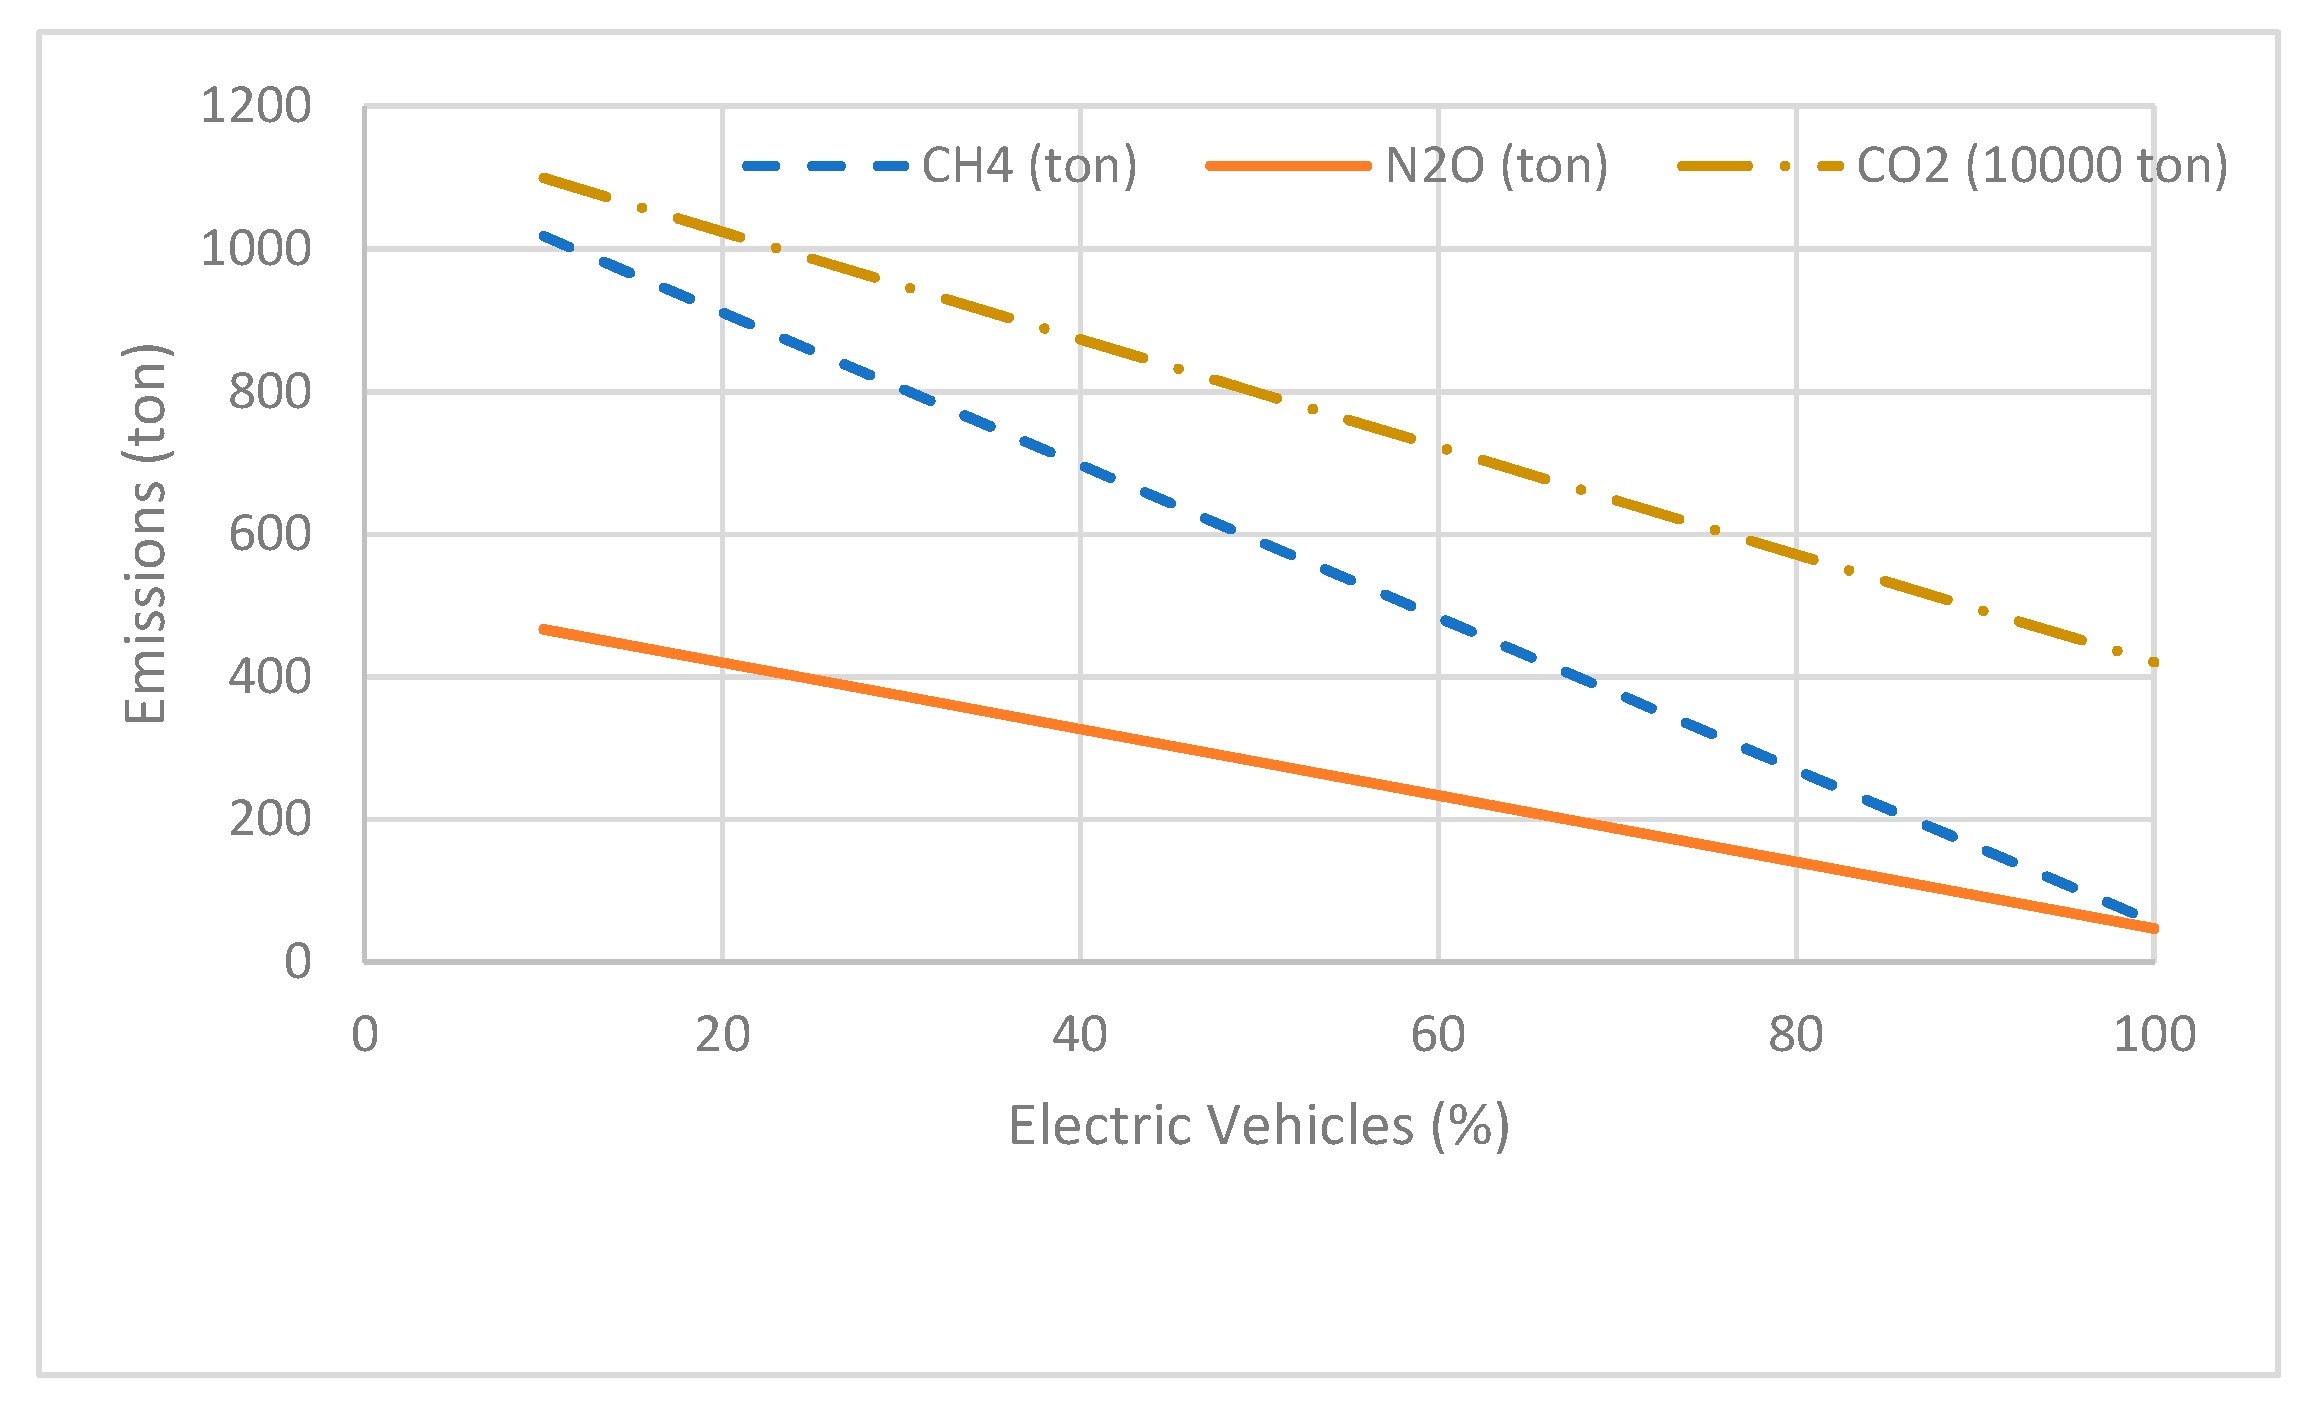
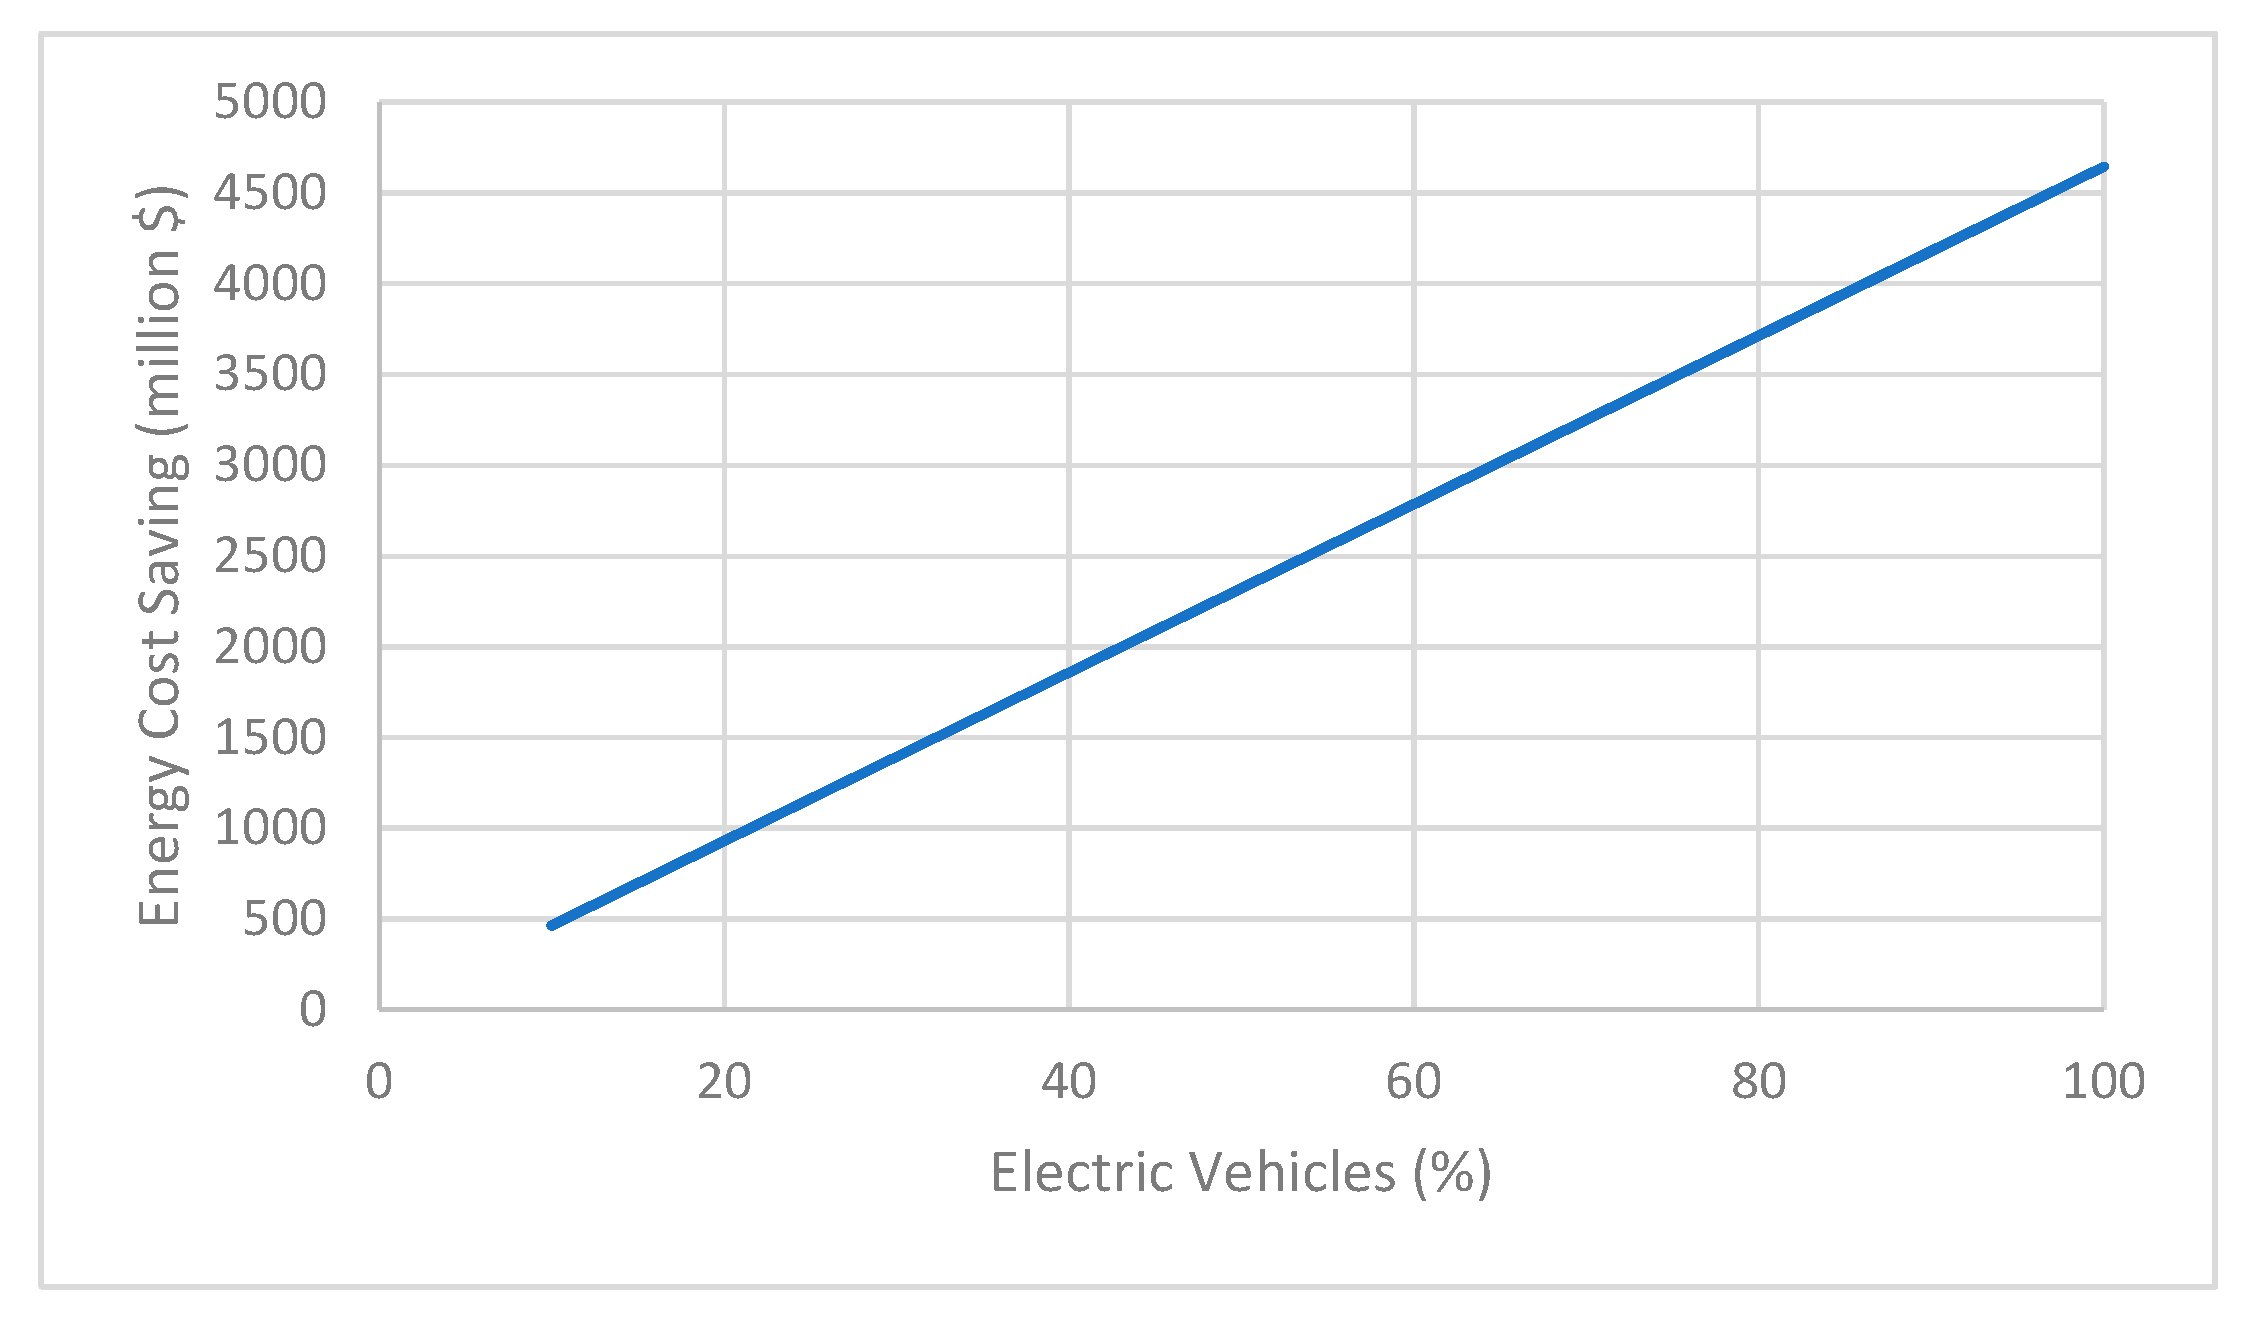
The estimated saving in energy cost in 2030 is USD 464.31 million. According to the Palestinian Central Bureau of Statistics [16], the gross domestic product (GDP) in 2018 was USD 14,616 million. This means that the estimated saving in energy cost in 2030 would be around 3.18% of the GDP. The energy cost benefits of using EVs could be illustrated clearly when a higher percentage of EVs is used, as shown in Figure 10.
5. Conclusions
Energy and environmental implications of EVs vary considerably among regions, mainly due to the variation in electricity sources (oil, natural gas, coal, etc.), fuel rates, electricity rates, total vehicle-kilometers of travel, and other indirect factors. In this study, the data related to these factors have been analyzed. After that, three predictions models have been developed, in order to estimate the energy and environmental implications of EVs in 2030, in case that 10% of the ICVs are replaced by EVs during the next 10 years (2020–2030). The following findings are offered in this study:
- There is a clear environmental benefit of using EVs in Palestine, since the coal-based electricity (21%) is not the major source of electricity; the main sources are oil (42%) and natural gas (35%), which produce less GHG emissions than coal. Therefore, the EVs in Palestine will produce less GHG emissions than other countries that depend mainly on coal-based electricity, such as China, where more than 70% is coal-based electricity.
- Both the rates of electricity and fuels in Palestine are much higher than the world’s average. Nevertheless, the cost of electricity required to operate EVs is still significantly lower than the cost of gasoline and diesel fuels required to operate the equivalent ICVs.
- Replacing 10% of ICVs with EVs during the next 10 years (2020–2030) could save USD 464.31 million of operating energy cost during 2030 (one year of saving). This is equivalent to 3.18% of the Palestinian GDP in 2018.
- In 2030, significant amounts of GHG emissions could be reduced by replacing 10% of ICVs with EVs (2020–2030). The reduction (during 2030) in NH4, N2O, CO2 would be 10.51%, 10%, and 6.86%, respectively.
- The analysis of this study has been conducted based on the current technology of electricity generation and EVs. In case that new technologies are used in electricity production or EVs manufacturing during the next 10 years, the study needs to be modified to include these new technologies.
- For future work, it is highly recommended to study the indirect economic implications of using EVs in Palestine such as taxes, maintenance, and registration fees, in order to show the complete image of the benefits that could be obtained by replacing ICVs with EVs.
Author Contributions
Conceptualization, methodology, software, validation, formal analysis, and writing—original draft preparations were done by F.M.A.H. Writing—review, editing, and visualization were done by K.A.-S. All authors have read and agreed to the published version of the manuscript.
Funding
Self-Funded.
Conflicts of Interest
The authors declare no conflict of interest.
References
- Wu, X.; Freese, D.; Cabrera, A.; Kitch, W.A. Electric Vehicles’ Energy Consumption Measurement and Estimation. Transp. Res. Part. D Transp. Environ. 2015, 34, 52–67. [Google Scholar] [CrossRef]
- Transportation’s Role in Reducing U.S. Greenhouse Gas. Emissions: Synthesis Report; U.S Department of Transportation: Washington, DC, USA, 2010; Volume 1.
- Palestinian Central Bureau of Statistics. In Gas. Emissions Statistics in Palestine; Palestinian Central Bureau of Statistics: Ramallah, Palestine, 2014.
- Palestine General Petroleum Corporation. Fuel Prices in Palestine; Palestinian Central Bureau of Statistics: Ramallah, Palestine, 2019.
- Braun, A.; Rid, W. Energy consumption of an electric and an internal combustion passenger car. A comparative case study from real world data on the Erfurt circuit in Germany. Transp. Res. Procedia 2017, 27, 468–475. [Google Scholar] [CrossRef]
- Huo, H.; Zhang, Q.; Wang, M.Q.; Streets, D.G.; He, K. Environmental Implication of Electric Vehicles in China. Environ. Sci. Technol. 2010, 44, 4856–4861. [Google Scholar] [CrossRef]
- Lang, J.; Cheng, S.; Zhou, Y.; Zhao, B.; Wang, H.; Zhang, S. Energy and Environmental Implications of Hybrid and Electric Vehicles in China. Energies 2013, 6, 2663–2685. [Google Scholar] [CrossRef] [Green Version]
- Brennan, J.W.; Barder, T.E. Battery Electric Vehicles vs. Internal Combustion Engine Vehicles; Arthur D Little: Delhi, India, 2016. [Google Scholar]
- Kawamoto, R.; Mochizuki, H.; Moriguchi, Y.; Nakano, T.; Motohashi, M.; Sakai, Y.; Inaba, A. Estimation of CO2 Emissions of Internal Combustion Engine Vehicle and Battery Electric Vehicle Using LCA. Sustainability 2019, 11, 2690. [Google Scholar] [CrossRef] [Green Version]
- Khaled, A.L.; Sameer, A.B. Traffic Signal Impact on Air Quality and Fuel Consumption in Downtown Nablus City. Najah Univ. J. Res. A Nat. Sci. 2003, 18, 97–114. [Google Scholar]
- Makridakis, S.; Wheelwright, S.C.; Hyndman, R.J. Forecasting: Methods and Applications; Wiley: Hoboken, NJ, USA, 2018. [Google Scholar]
- Ostertagová, E.; Ostertag, O. The Simple Exponential Smoothing Model. In Proceedings of the Forth International Conference of Modelling of Mechanical and Mechatronic Systems, Bratislava, Slovakia, 4 September 2011. [Google Scholar]
- Palestinian Central Bureau of Statistics. Gas. Emissions Statistics in Palestine; Palestinian Central Bureau of Statistics: Ramallah, Palestine, 2018.
- Mohammad, R.; Santoso, I.B. Prediction of CO, CO2, CH4, and N2O Vehicle Emissions from Environmental Impact Assessment (EIA) at Toll Road of Krian-Legundi-Bunder in East Java of Indonesia. Int. J. Chemtech. Res. 2016, 9, 653–664. [Google Scholar]
- Energy Consumption of Full Electric Vehicles. Electric Vehicle Database, 2020, Energy Consumption of Full Electric Vehicles. Available online: https://ev-database.org/cheatsheet/energy-consumption-electric-car (accessed on 29 March 2020).
- Fossil Fuel Support Country Note. Organization for Economic Co-Operation and Development, Paris, France, 2019, Fossil Fuel Support Country Note. Available online: https://stats.oecd.org/wbos/fileview2.aspx?IDFile=43723b1c-d337-435a-aca0-dc24046ea459 (accessed on 2 April 2020).
- Lev-On, M.; Lev-On, P.; Liebes, I.; Ayalon, O. Assessment of Greenhouse Gas. Emissions Intensity from Electricity Generation in Haifa Israel; Samuel Neaman Institute: Haifa, Israel, 2017. [Google Scholar]
- Palestinian Central Bureau of Statistics. Gas. Emissions Statistics in Palestine; Palestinian Central Bureau of Statistics: Ramallah, Palestine, 2019.
Figure 1.
Study methodology process.

Figure 2.
Estimation of energy cost saving by replacing 10% of internal combustion vehicles (ICVs) with electric vehicles (EVs) (2030).
Figure 2.
Estimation of energy cost saving by replacing 10% of internal combustion vehicles (ICVs) with electric vehicles (EVs) (2030).

Figure 3.
Estimation of greenhouse gas (GHG) emissions reduction by replacing 10% of ICVs with EVs (2030).
Figure 3.
Estimation of greenhouse gas (GHG) emissions reduction by replacing 10% of ICVs with EVs (2030).

Figure 4.
Fit and observed data of model for number of vehicles.

Figure 5.
Sources of electricity in Israel (%), 2019.

Figure 6.
Expected emissions at different percentage of EVs.

Figure 7.
Predicted gasoline fuel rates in 2030.

Figure 8.
Predicted diesel fuel rates in 2030.

Figure 9.
Predicted electricity rates in 2030.

Figure 10.
Energy cost savings at different percentages of EVs.


Table 1.
Goodness-of-fit statistics (vehicles’ prediction model).
| Fit Statistics | Mean |
|---|---|
| R-squared | 0.950 |
| RMSE | 14,256.488 |
| MAPE | 7.924 |
| MAE | 11,209.318 |
Table 2.
Estimated amounts of GHG emissions by ICVs (100% ICVs, 0% EVs), 2030.
| Gas Emissions | Gasoline ICVs | Diesel ICVS | Total |
|---|---|---|---|
| CH4 (ton) | 1014.48 | 110.68 | 1125.16 |
| N2O (ton) | 70.45 | 442.72 | 513.17 |
| CO2 (ton) | 3,660,398.83 | 8,093,198.30 | 11,753,597.13 |
Table 3.
Amounts of GHG emissions, based on source of electricity (gm/MWh).
| Source of Electricity | CO2 (gm/MWh) | N2O (gm/MWh) | CH4 (gm/MWh) |
|---|---|---|---|
| Coal | 900,000 | 18 | 9 |
| Oil | 650,000 | 7 | 11 |
| Natural Gas | 470,000 | 1 | 5 |
Table 4.
The reduction in GHG emissions due to replacing 10% of ICVs by EVs, 2030.
| Gas Emissions | Case II | Case I | Difference |
|---|---|---|---|
| CH4 (ton) | 1018.19 | 1125.16 | 106.97 |
| N2O (ton) | 466.55 | 513.17 | 46.62 |
| CO2 (ton) | 10,999,028.90 | 11,753,600.00 | 754,571.10 |
Table 5.
Goodness-of-fit statistics (gasoline rate prediction model).
| Fit Statistic | Mean |
|---|---|
| R-squared | 0.882 |
| RMSE | 0.113 |
| MAPE | 6.043 |
| MAE | 0.087 |
Table 6.
Goodness-of-fit statistics (diesel rate prediction model).
| Fit Statistic | Mean |
|---|---|
| R-squared | 0.933 |
| RMSE | 0.123 |
| MAPE | 10.679 |
| MAE | 0.104 |
Table 7.
Goodness-of-fit statistics (electricity rate prediction model).
| Fit Statistic | Mean |
|---|---|
| R-squared | 0.787 |
| RMSE | 0.008 |
| MAPE | 2.197 |
| MAE | 0.003 |
Table 8.
Saving in energy cost in 2030, in case 50% of ICVs are replaced by EVS during 2020–2030.
| A (100% ICVs) | B (10% EVs) | Saving in Energy Cost | |
|---|---|---|---|
| Energy Cost ($ million) | 5710.6 | 106.75 | 464.31 (A- (90%A + B)) |
© 2020 by the authors. Licensee MDPI, Basel, Switzerland. This article is an open access article distributed under the terms and conditions of the Creative Commons Attribution (CC BY) license (http://creativecommons.org/licenses/by/4.0/).
Share and Cite
MDPI and ACS Style
Hassouna, F.M.A.; Al-Sahili, K. Future Energy and Environmental Implications of Electric Vehicles in Palestine. Sustainability 2020, 12, 5515. https://0-doi-org.brum.beds.ac.uk/10.3390/su12145515
AMA Style
Hassouna FMA, Al-Sahili K. Future Energy and Environmental Implications of Electric Vehicles in Palestine. Sustainability. 2020; 12(14):5515. https://0-doi-org.brum.beds.ac.uk/10.3390/su12145515
Chicago/Turabian StyleHassouna, Fady M. A, and Khaled Al-Sahili. 2020. "Future Energy and Environmental Implications of Electric Vehicles in Palestine" Sustainability 12, no. 14: 5515. https://0-doi-org.brum.beds.ac.uk/10.3390/su12145515
Note that from the first issue of 2016, this journal uses article numbers instead of page numbers. See further details here.