Performance Improvement of PEM Fuel Cell Using Variable Step-Size Incremental Resistance MPPT Technique


1
College of Engineering at Wadi Addawaser, Prince Sattam Bin Abdulaziz University, Wadi Addawaser 11991, Saudi Arabia
2
Electrical Engineering Department, Faculty of Engineering, Minia University, Minia 61517, Egypt
3
Electrical Engineering Department, Faculty of Engineering, Jouf University, Sakaka 72314, Saudi Arabia
4
Electrical Power and Machine Department, Faculty of Engineering, Zagazig University, Zagazig 44519, Egypt
*
Author to whom correspondence should be addressed.
Sustainability 2020, 12(14), 5601; https://0-doi-org.brum.beds.ac.uk/10.3390/su12145601
Submission received: 12 June 2020
/
Revised: 9 July 2020
/
Accepted: 11 July 2020
/
Published: 12 July 2020
(This article belongs to the Special Issue Hydrogen and Fuel Cell Technology)
Abstract
:The output power of a fuel cell mainly depends on the operating conditions such as cell temperature and membrane water content. The fuel cell (FC) power versus FC current graph has a unique maximum power point (MPP). The location of the MPP is variable, depending on the operating condition. Consequently, a maximum power point tracker (MPPT) is highly required to ensure that the fuel cell operates at an MPP to increase its performance. In this research work, a variable step-size incremental resistance (VSS-INR) tracking method was suggested to track the MPP of the proton exchange membrane (PEMFC). Most of MPPT methods used with PEMFC require at least three sensors: temperature sensor, water content sensor, and voltage sensor. However, the proposed VSS-INR needs only two sensors: voltage and current sensors. The step size of the VSS-INR is directly proportional to the error signal. Therefore, the step size will become small as the error becomes very small nearby the maximum power point. Accordingly, the accuracy of the VSS-INR tracking method is high in a steady state. To test and validate the VSS-INR, nine different scenarios of operating conditions, including normal operation, only temperature variation, only variation of water content in the membrane, and both variations of temperature and water content simultaneously, were used. The obtained results were compared with previously proposed methods, including particle swarm optimization (PSO), perturb and observe (P&O), and sliding mode (SM), under different operating conditions. The results of the comparison confirmed the superiority of VSS-INR compared with other methods in terms of the tracking efficiency and steady-state fluctuations.
1. Introduction
Recently, the use of fossil fuels has been limited due to its negative effects on the environment as they cause global warming. Therefore, renewable energy sources (RESs) have emerged as alternatives as they are characterized by cleanliness and they can be considered environmentally friendly. It is important to use an energy storage system with RESs to cover the load when the RESs are unable to do this. Typically, a battery storage bank is installed with RESs. However, batteries suffer from high replacement costs, and their lifetimes are short. In a standalone hybrid renewable system, it is possible to convert the surplus energy to hydrogen using electrolyzer. The produced hydrogen can be stored and used as a source for fuel cells (FCs) during deficit periods. Therefore, FCs which are hydrogen-based storage systems are recommended as alternatives to batteries. FCs convert the chemical reactions to electricity and water; the features of FCs are noise-free and do not cause pollution to the environment. The proton exchange membrane fuel cell (PEMFC) is the most promising type, where hydrogen is used as a fuel while the oxidant air is used at the cathode. The PEMFC current-power curve has a unique maximum power point (MPP) at which it is necessary to operate the cell for enhancing its operation. The MPP can be monitored by a maximum power point tracker (MPPT) that controls the DC-DC converter. Many reported approaches have been implemented in designing an MPPT with FCs. Padmanaban et al. [1] introduced an MPPT simulated via Jaya with the aid of a Cuke converter for hybrid photovoltaic (PV), fuel cell, and ultra-capacitor system connected to the grid. Mohamed et al. [2] used the perturb and observe (P&O) and incremental conductance (IC) approaches in designing an MPPT with a boost converter incorporated with an FC system supplying an electric vehicle (EV). Fathy et al. [3] presented an MPPT based on a metaheuristic optimization approach of a salp swarm algorithm (SSA) to extract the maximum power from the PEMFC; the SSA was employed to optimize a proportional-integral-derivative (PID) controller. The performance of the presented MPPT was confirmed by analyzing different operating conditions. Rana et al. [4] designed an MPPT based on a PID controller optimized via a grey wolf optimizer (GWO) to extract the maximum power of the PEMFC operated under variable conditions. Derbeli et al. [5] employed a backstepping methodology to simulate an MPPT with a PEMFC via a boost converter. A smart drive algorithm has been presented by Derbeli et al. [6] to simulate an MPPT with a boost converter to catch the maximum power of the PEMFC. Ahmadi et al. [7] represented an MPPT for the PEMFC via a PID controller designed by particle swarm optimization (PSO); the output of the controller was the duty cycle fed to a boost converter for extracting the maximum power. An MPPT based on IC with a variable step size simulated via an artificial neural network (ANN) has been presented to enhance the output power of the FC [8]. Harrag et al. [9] designed an MPPT incorporated with an FC using the Fuzzy logic approach. Liu et al. [10] simulated the MPPT controller for the PEMFC by a fractional-order high pass filter designed via traditional extremum seeking control. Harrabi et al. [11] introduced a Fuzzy logic controller constructed based on an IC technique to simulate an MPPT incorporated in a PV/FC system via a controlling buck converter. Phase-shifted converters have been presented as dedicated power converters and employed in simulating an MPPT incorporated in an FC [12]. Priyadarshi et al. [13] designed an MPPT controller using a Fuzzy logic controller optimized via a firefly approach for an FC-based system connected to the grid. Static and dynamic models for the PEMFC have been introduced in Ref. [14] with employing the P&O technique for simulating the MPPT. Reddy et al. [15] simulated an MPPT controller for the PEMFC using an ANN to supply an EV powertrain. Abdelkader et al. [16] presented a series active power filter installed with an FC to enhance the generated power via compensating the voltage deviation caused by quality issues. Derbeli et al. [17] compared two approaches employed in simulating an MPPT installed with a PEMFC: proportional-integral (PI) controller and backstepping approach. Venkateshkumar et al. [18] introduced different approaches of an intelligent-controllers-based MPPT with a PEMFC. Rezk [19] used PSIM to model a PEMFC by considering an incremental resistance (INR) approach to simulate an MPPT. Samal et al. [20] presented a comparative study of the electrical signals of an FC with and without an MPPT controller. Shaw et al. [21] presented a sine cosine algorithm (SCA) to determine the optimal parameters of a PID-based MPPT controller incorporated with an FC. Azri et al. [22] introduced a constant voltage technique to simulate an MPPT in an FC. Karthikeyan et al. [23] introduced a P&O-technique-based MPPT in an FC with the aid of a high step ratio converter. A comparison between Mamdani and Sugeno Fuzzy controller-based MPPT has been introduced [24]. Raj et al. [25] simulated an MPPT incorporated with the PEMFC using an adaptive neuro-fuzzy inference system (ANFIS). Particle swarm optimization (PSO) was employed to optimize the Fuzzy-inference-system-based MPPT for enhancing the output power of an FC [26]. Kumar et al. [27] employed an antlion optimizer (ALO) to design a PID-controller-based MPPT used with an FC via a boost converter. A variable stem IC technique-based MPPT for the PEMFC has been presented [28]. Reddy et al. [29] introduced an ANFIS-based MPPT for the PEMFC powering EV applications. Wang et al. [30] simulated an MPPT via slide mode control (SMC) to enhance the generated power from the PEMFC. Table 1 summarizes the previously reported works.
PEMFC, as a clean and efficient energy source, is penetrating different applications. Among the applications, integrating FCs into microgrids has shown interesting advantages in improving the performance of microgrids and promoting the use of hydrogen energy. Along with the advantages carried by the combination of the two technologies, many challenges lying on multiple domains are faced in the process. For example, most of the reported approaches employed in simulating an MPPT with the PEMFC required three sensors for temperature, water content, and voltage. This leads to an increase in the cost controller system. Therefore, this work avoided this gap by proposing a variable step-size incremental resistance (VSS-INR) tracking approach to monitor the MPP of the PEMFC. It requires only two sensors for the voltage and current. The proposed approach step size is directly proportional to the error signal that helps it to be small as the error becomes very small nearby the maximum power point. Accordingly, the accuracy of the VSS-INR tracking method is high in a steady state.
2. Dynamic Model of the Fuel Cell
In this section, the dynamic model of the PEMFC is presented. Additionally, the Nernst voltage, activation, ohmic, and concentration losses considered in PEMFC equations are introduced. The relation between the gas flow via the FC valve and the partial pressure for both hydrogen and oxygen can be calculated as follows [31]:
where qH2 and qO2 are the hydrogen and oxygen molar flow, PH2 and PO2 are the partial pressures of hydrogen and oxygen (atm), kH2 and kO2 are the molar constants of hydrogen and oxygen (kmol (atm s)−1), kan is the constant of anode valve, and MH2 and MO2 are the hydrogen and oxygen molar masses. The partial pressure derivative can be calculated with a perfect gas formula given as follows:
where R represents the universal gas constant, T is the temperature in kelvin, Van is the volume of the anode, qH2in is the input flow rate of hydrogen, qH2out is the output flow rate of hydrogen, and qH2r represents the flow rate of reacted hydrogen which can be calculated as follows:
where NFC is the number of FCs connected in series, IFC is the FC current, F is the constant of Faraday, and kr is the constant of modeling. By solving Equations (1) and (2), one can get the instantaneous partial pressures of hydrogen and oxygen as follows:
Three types of losses occur in the PEMFC: activation, ohmic, and concentration. Therefore, the terminal voltage of the FC stack can be calculated as follows [32]:
where Vact is the loss of activation loss, Vohm is the loss of ohmic, Vcon is the loss of concentration, and ENernest represents the Nernest voltage that can be calculated as follows [33]:
The equation given in Ref. [34] that represents the FC activation loss is used and expressed as follows:
where ξ1, ξ2, ξ3, and ξ4 represent the parametric coefficients and CO2 is the concentration of oxygen which is expressed as follows:
The ohmic loss is produced via the FC membrane resistance (RM), and it can be expressed as follows:
where l is the membrane thickness, A is the active area of the FC, and λm is the membrane water content. The loss of concentration is produced due to the consumption of the reactant’s concentration gradient, it can be expressed as follows:
where n is the number of participated electrons in the reaction and Imax is the maximum current destiny. Finally, the power generated from the FC stack can be calculated as follows:
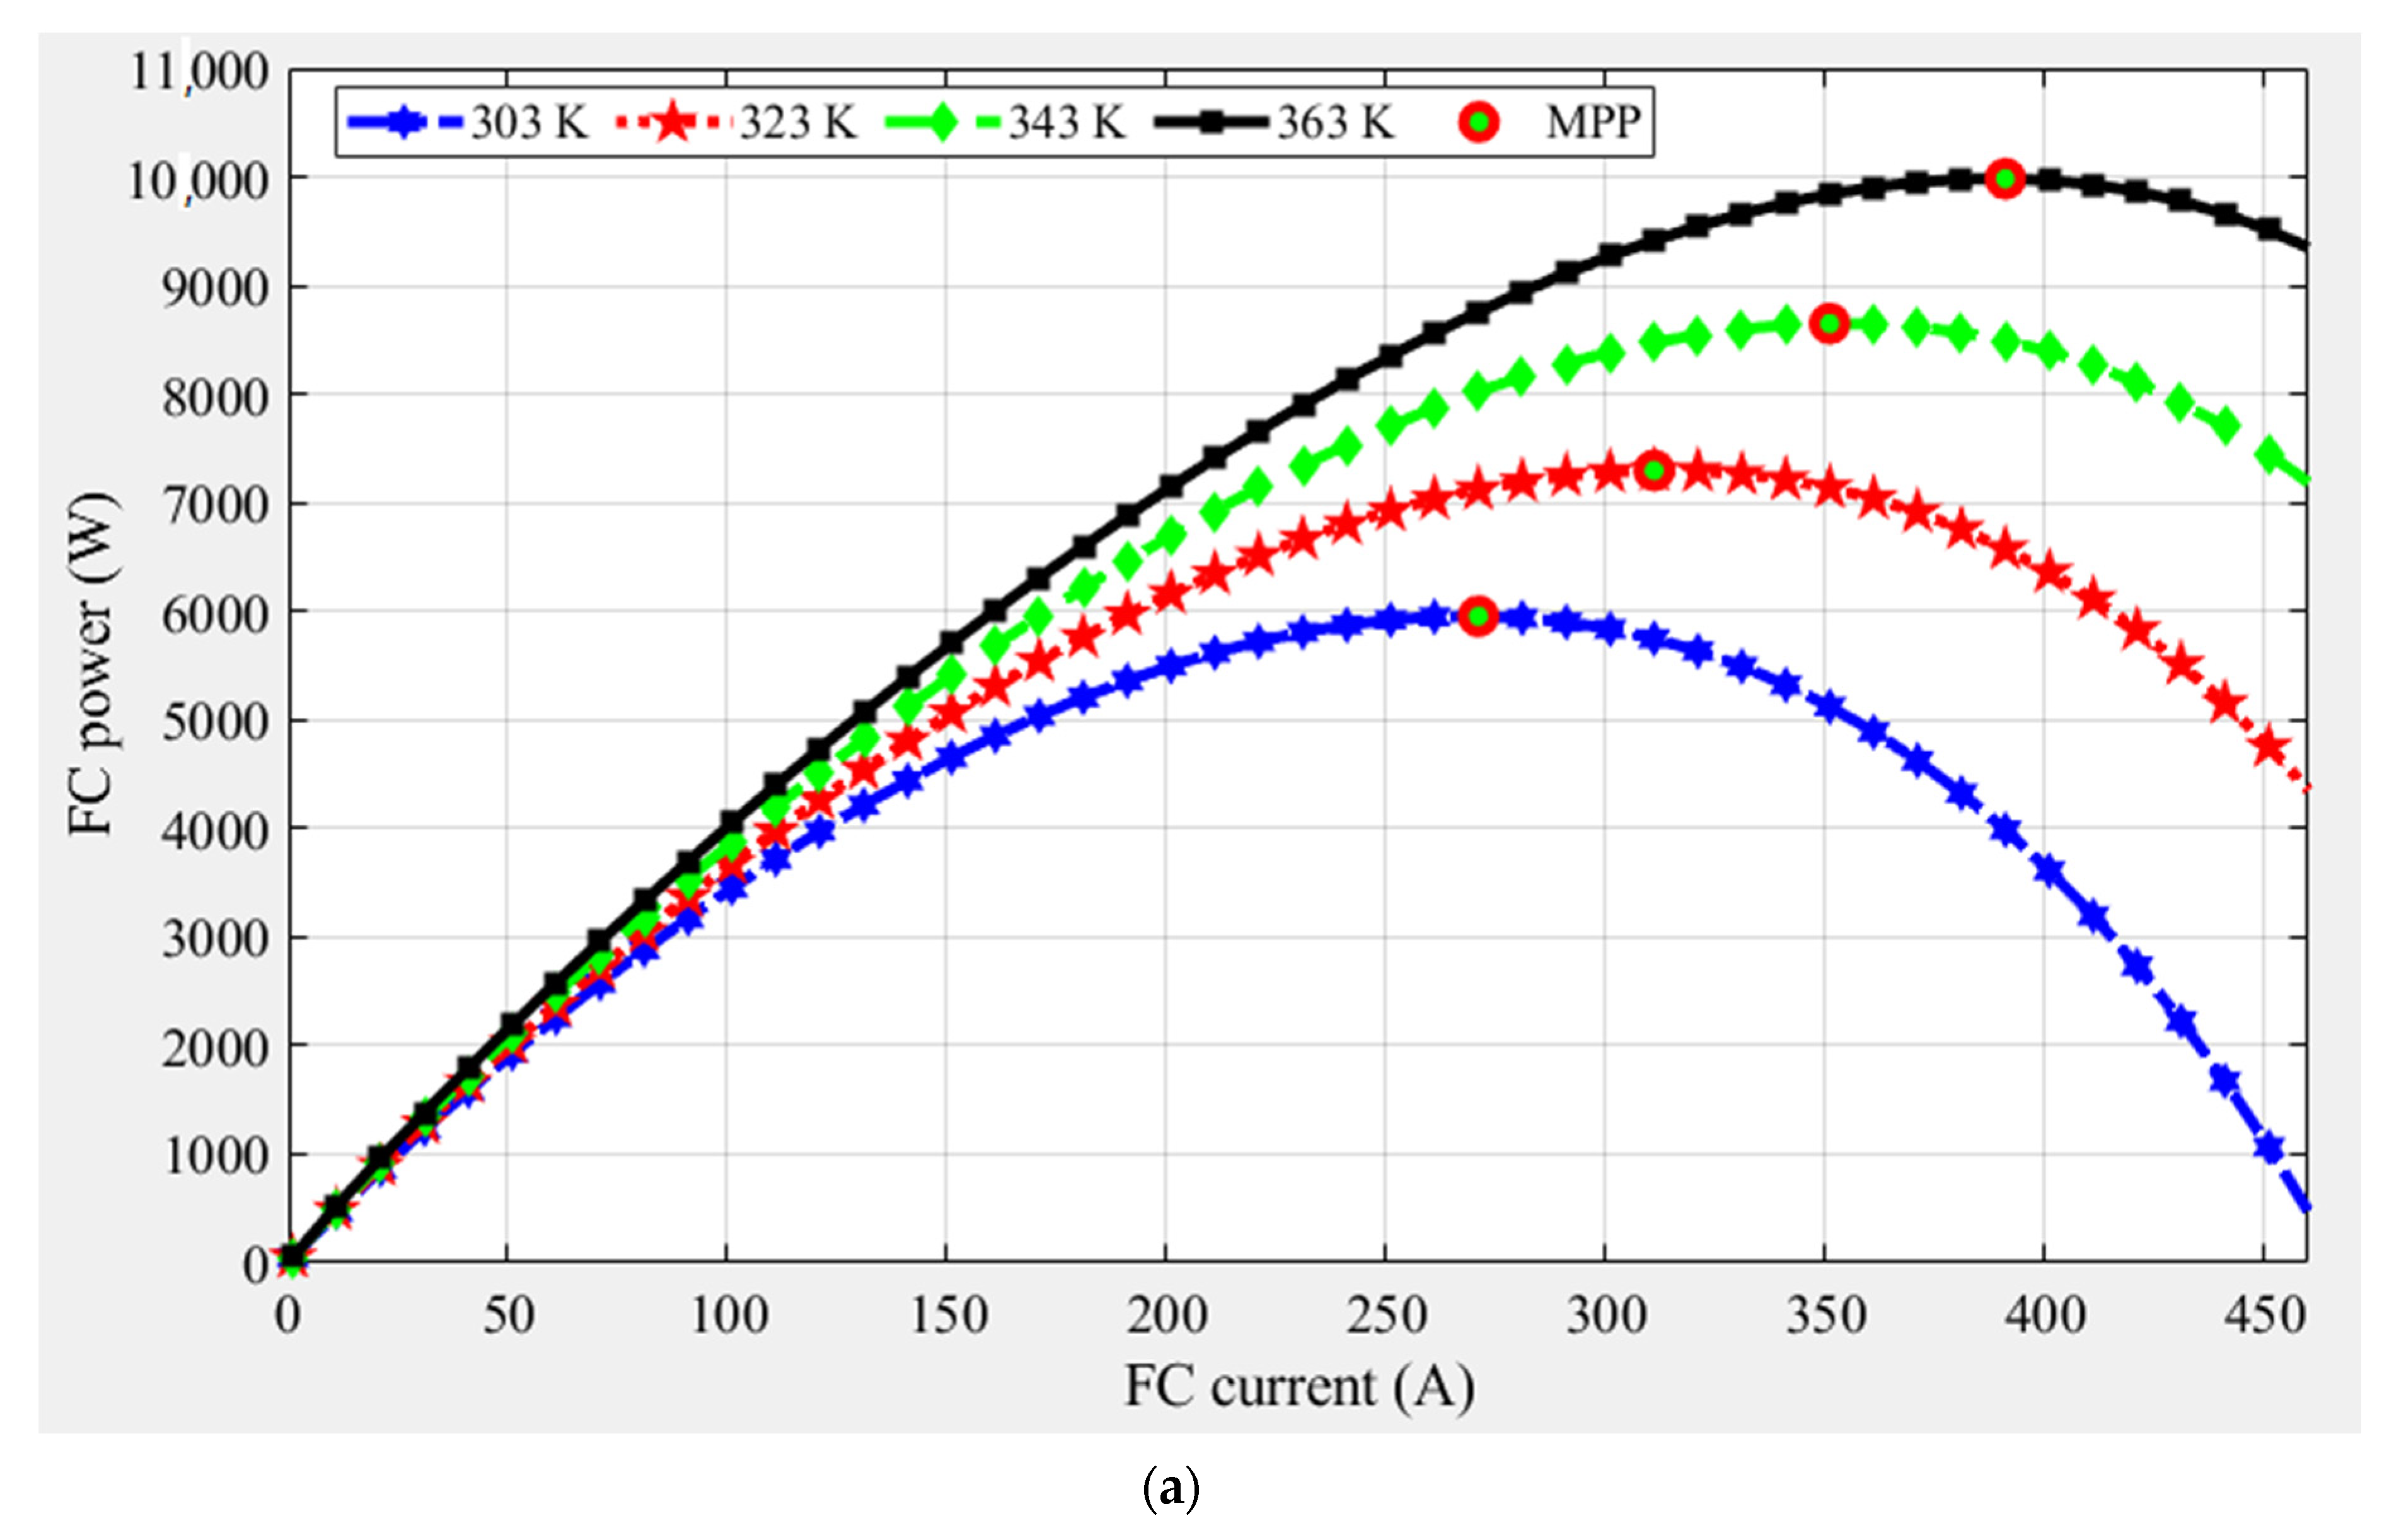
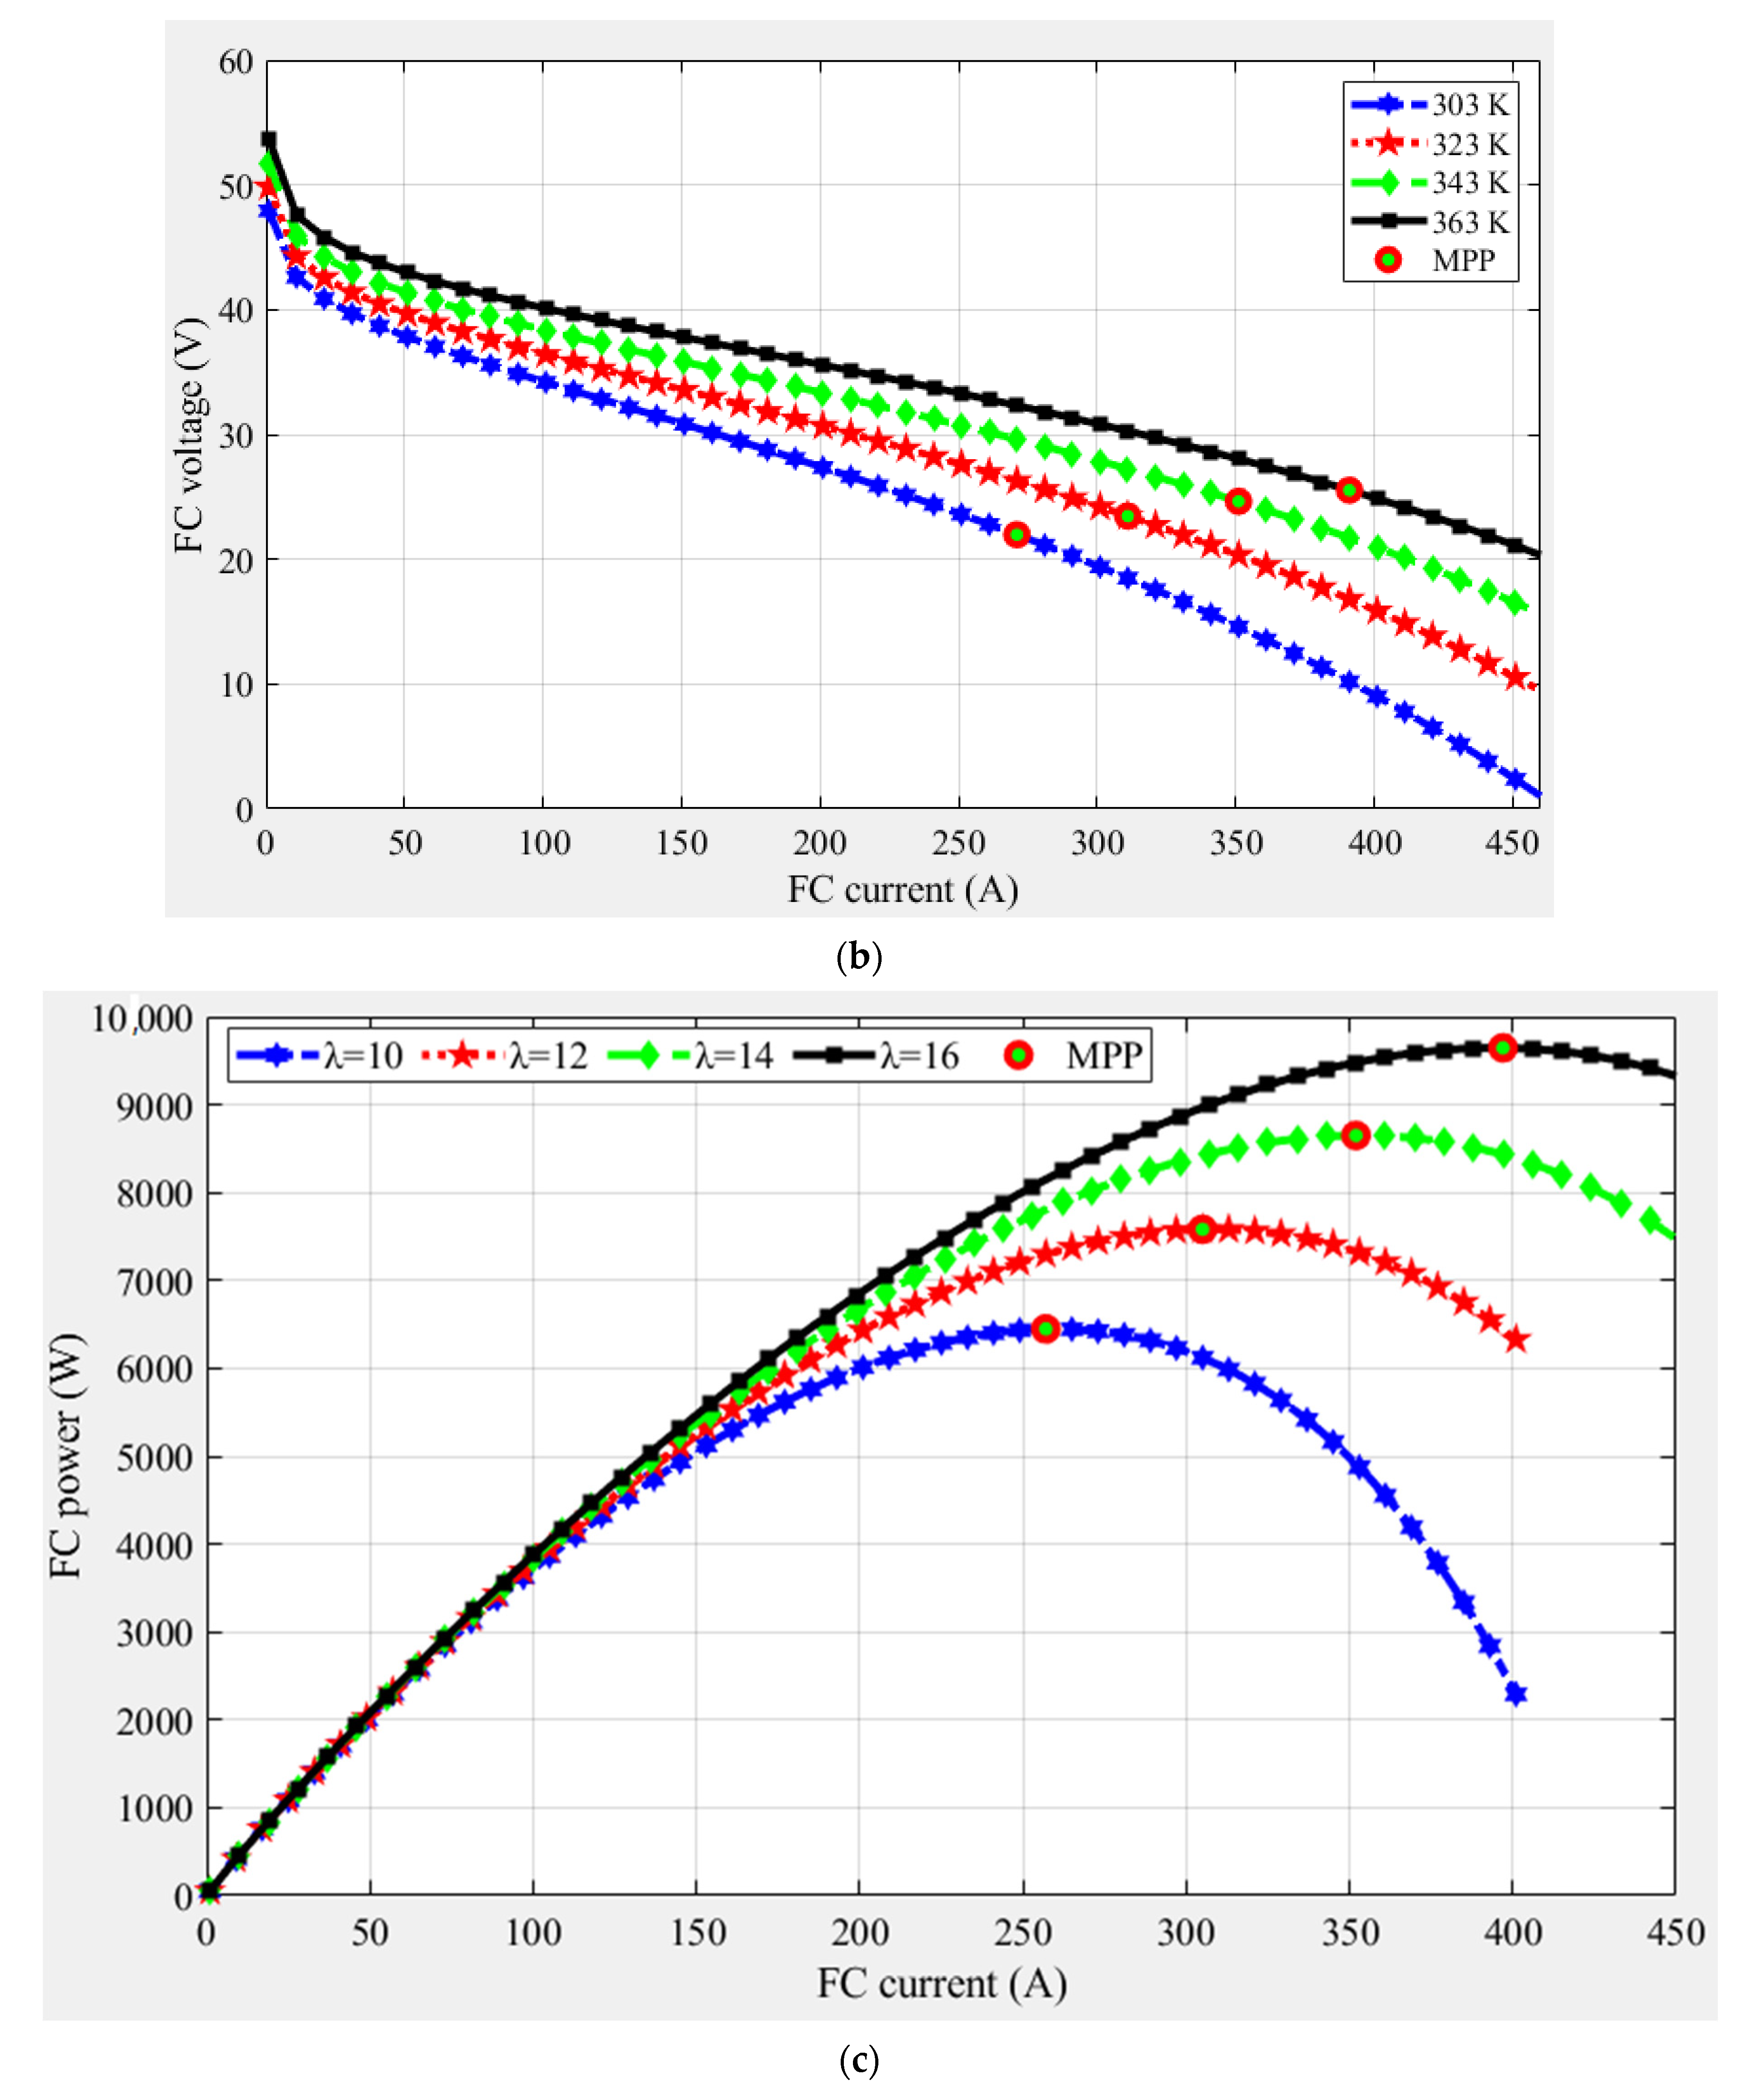
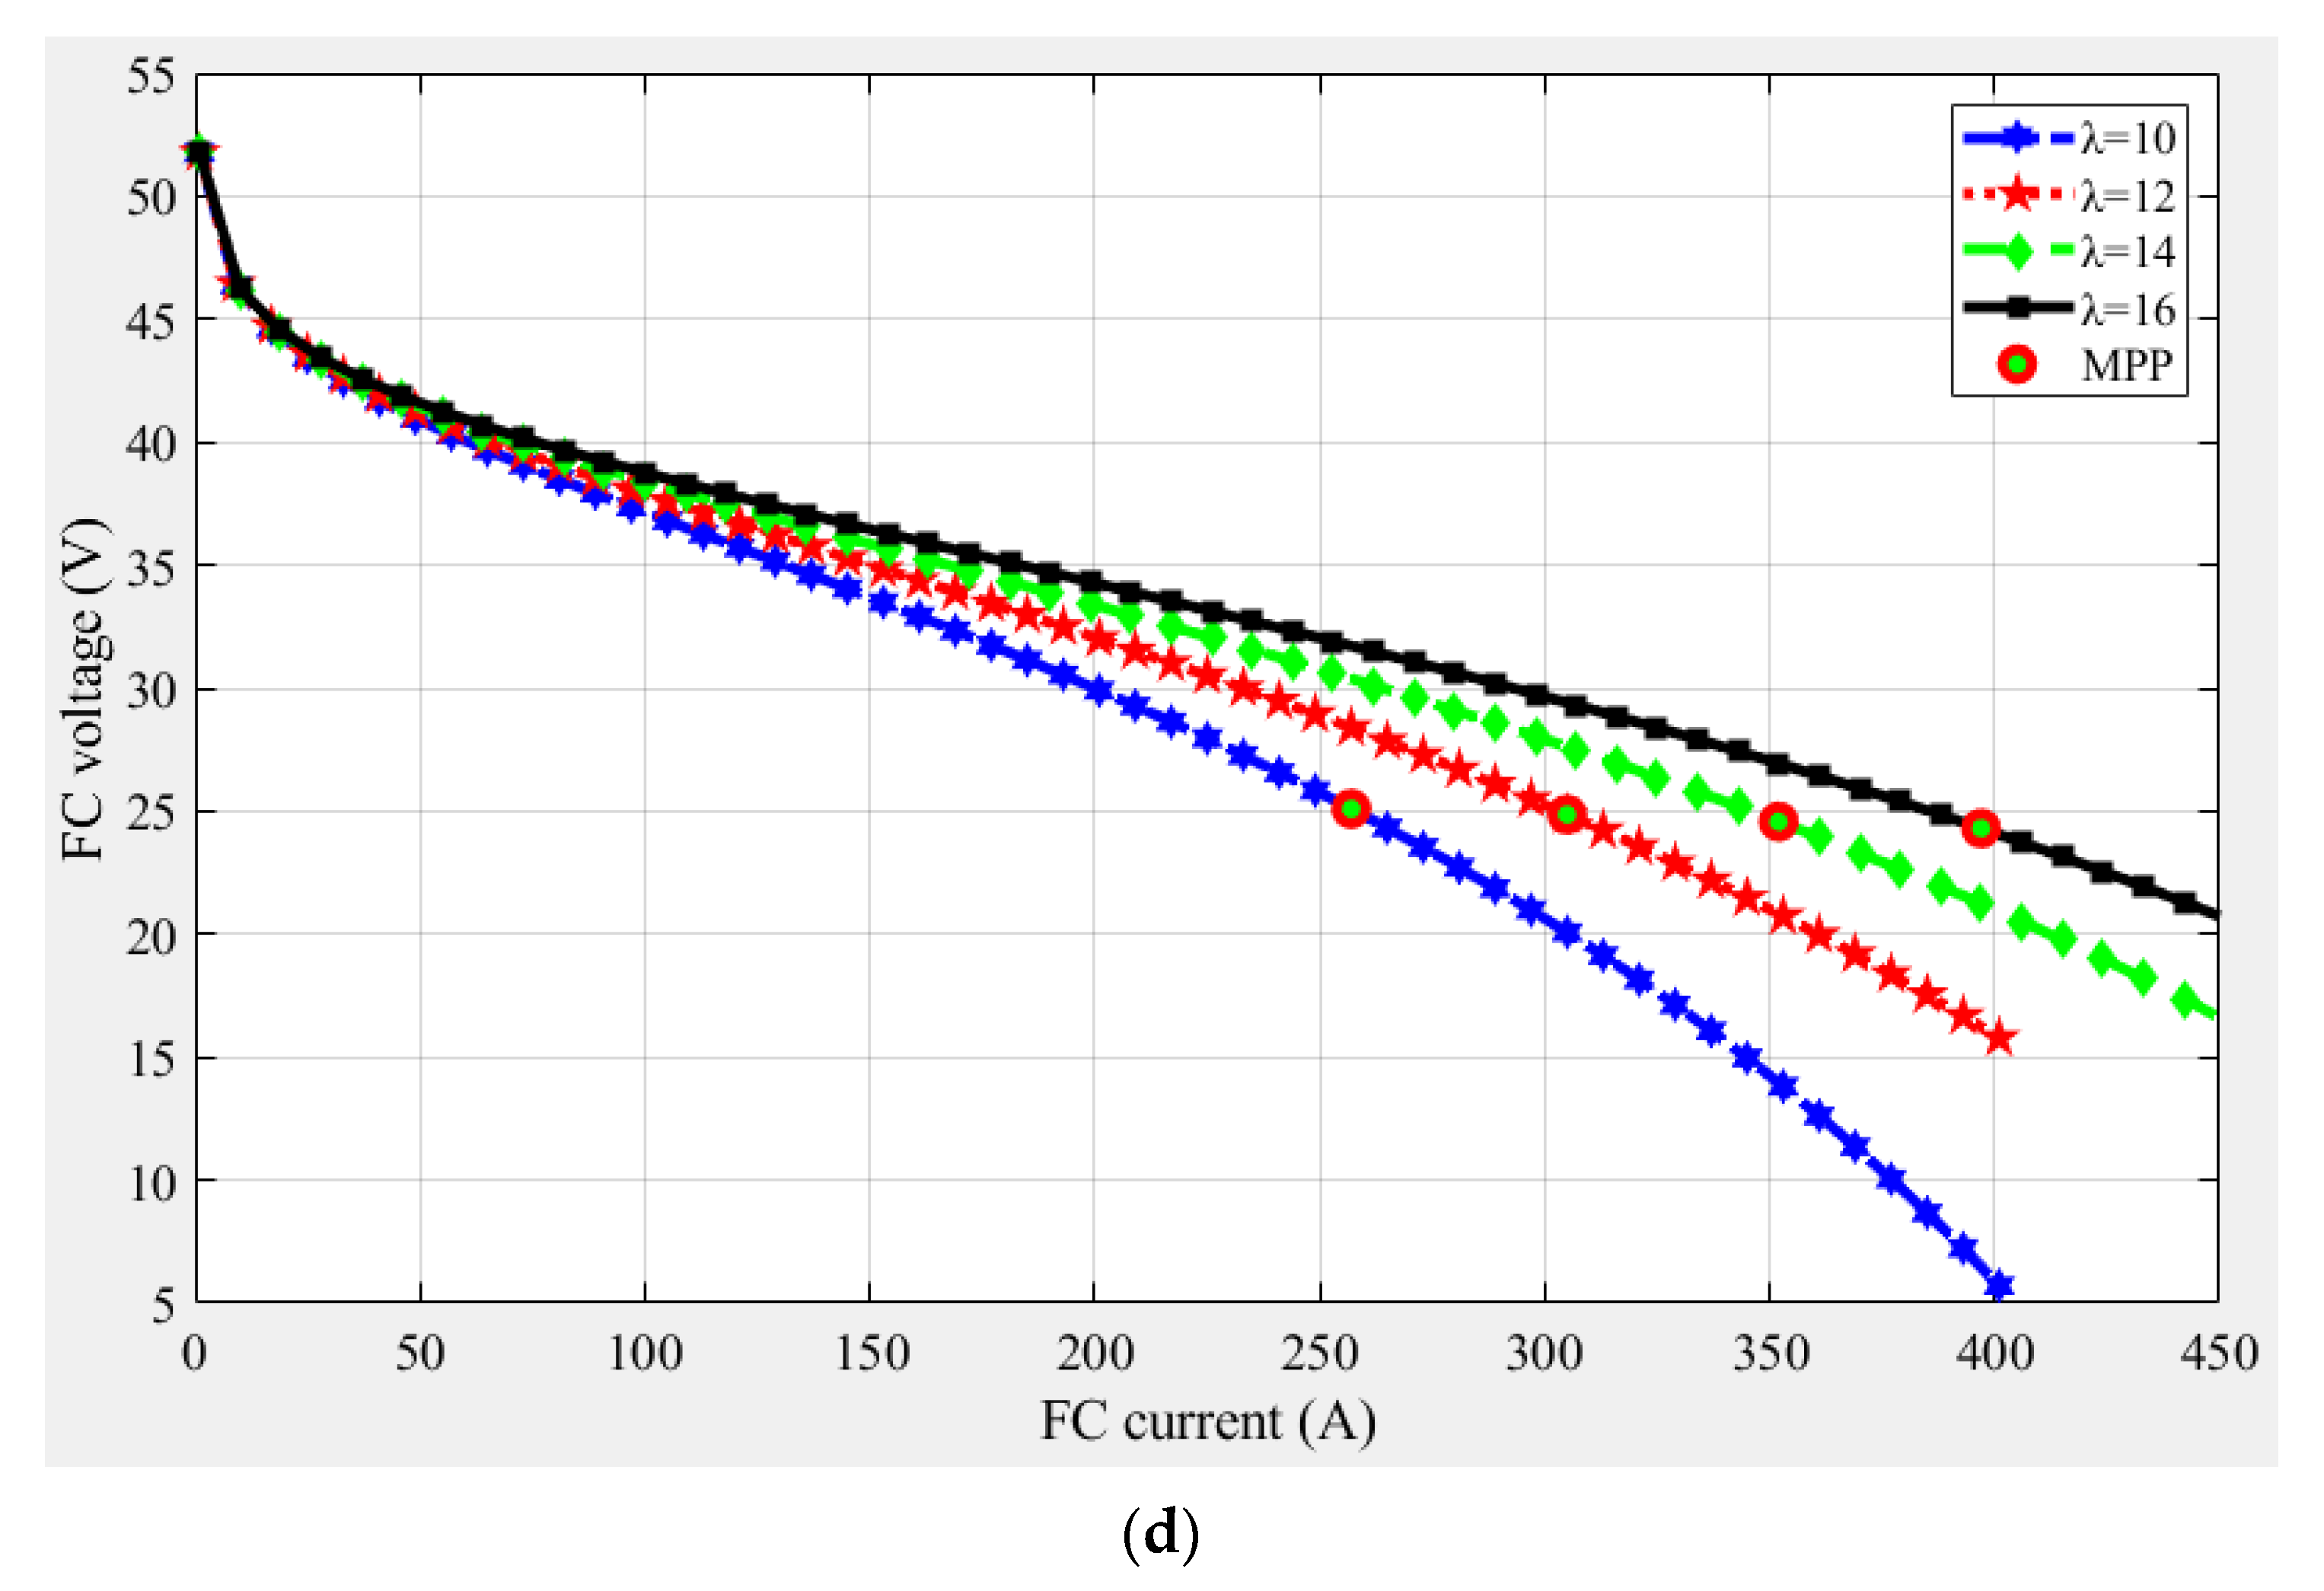
The previous equations are were programmed in Simulink/Matlab and the power-current and voltage-current curves at λm = 12 and different temperatures are shown in Figure 1a,b, respectively. Meanwhile, Figure 1c,d clarifies the power-current and voltage-current curves at T = 343 K and different water content. The curves confirmed that the FC output power was nonlinear with a unique maximum power point (MPP) to be tracked. Therefore, the use of a controller to track MPP is essential to enhance the FC performance.
3. Variable Step-Size Incremental Resistance MPPT
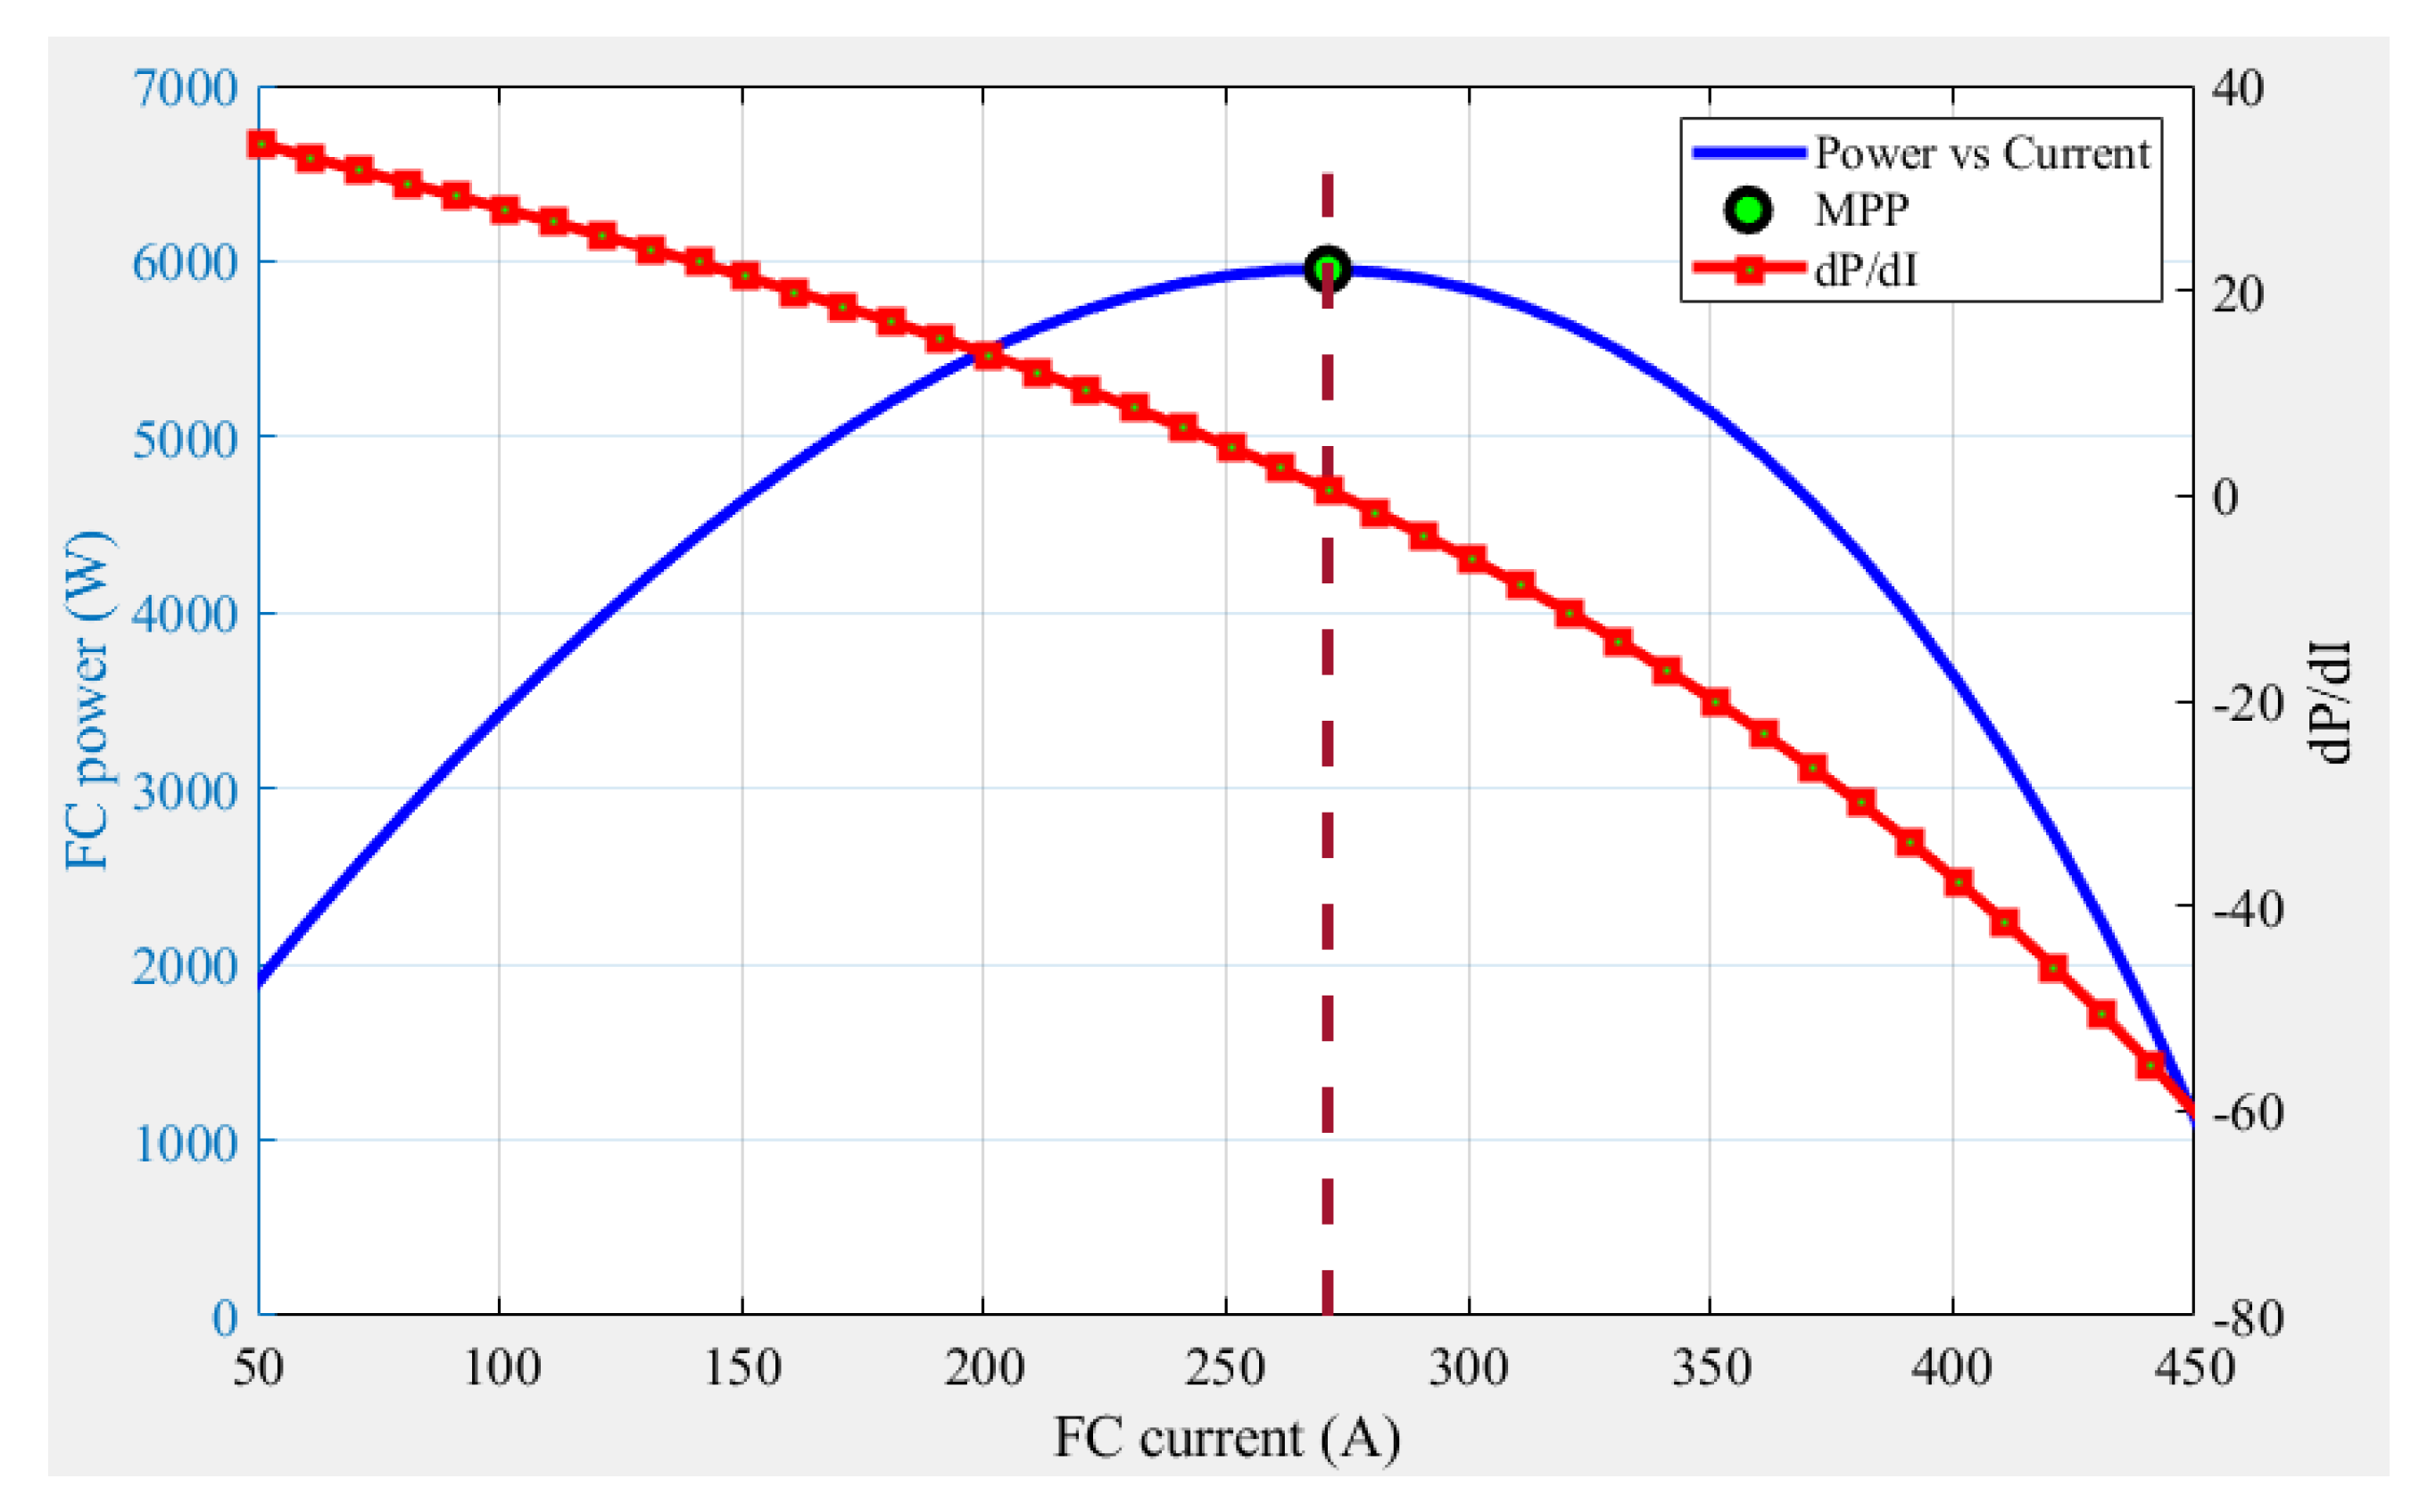
The role of the tracking system is matching the virtual load, seen by the fuel cell, to its real internal resistance by varying the duty cycle of the boost converter for maximizing the FC output power. The MPP tracking transfers the operating point of the system in order to force the fuel cell to operate with a certain current value that will maximize the output power to the load [19]. In order to explain the procedures followed in an INR-based tracker, we will consider Figure 2 that illustrates the relationship of the FC power and FC current under a certain condition. Considering Figure 2, it can be noted that only a single MPP appears on the graph. INR strategy is originated from the fact that the derivative of the FC power related to FC current (dP/dI) is equal to zero at the maximum power point, as illustrated in Figure 2 (red curve). The value of dP/dI is positive for values located on the left side of MPP, whereas it is negative for values located on the right side. Accordingly, the value of dP/dI at MPP can be formulated by Equation (15). Based on Equation (15), the error signal e can be formulated as in Equation (16).
In addition,
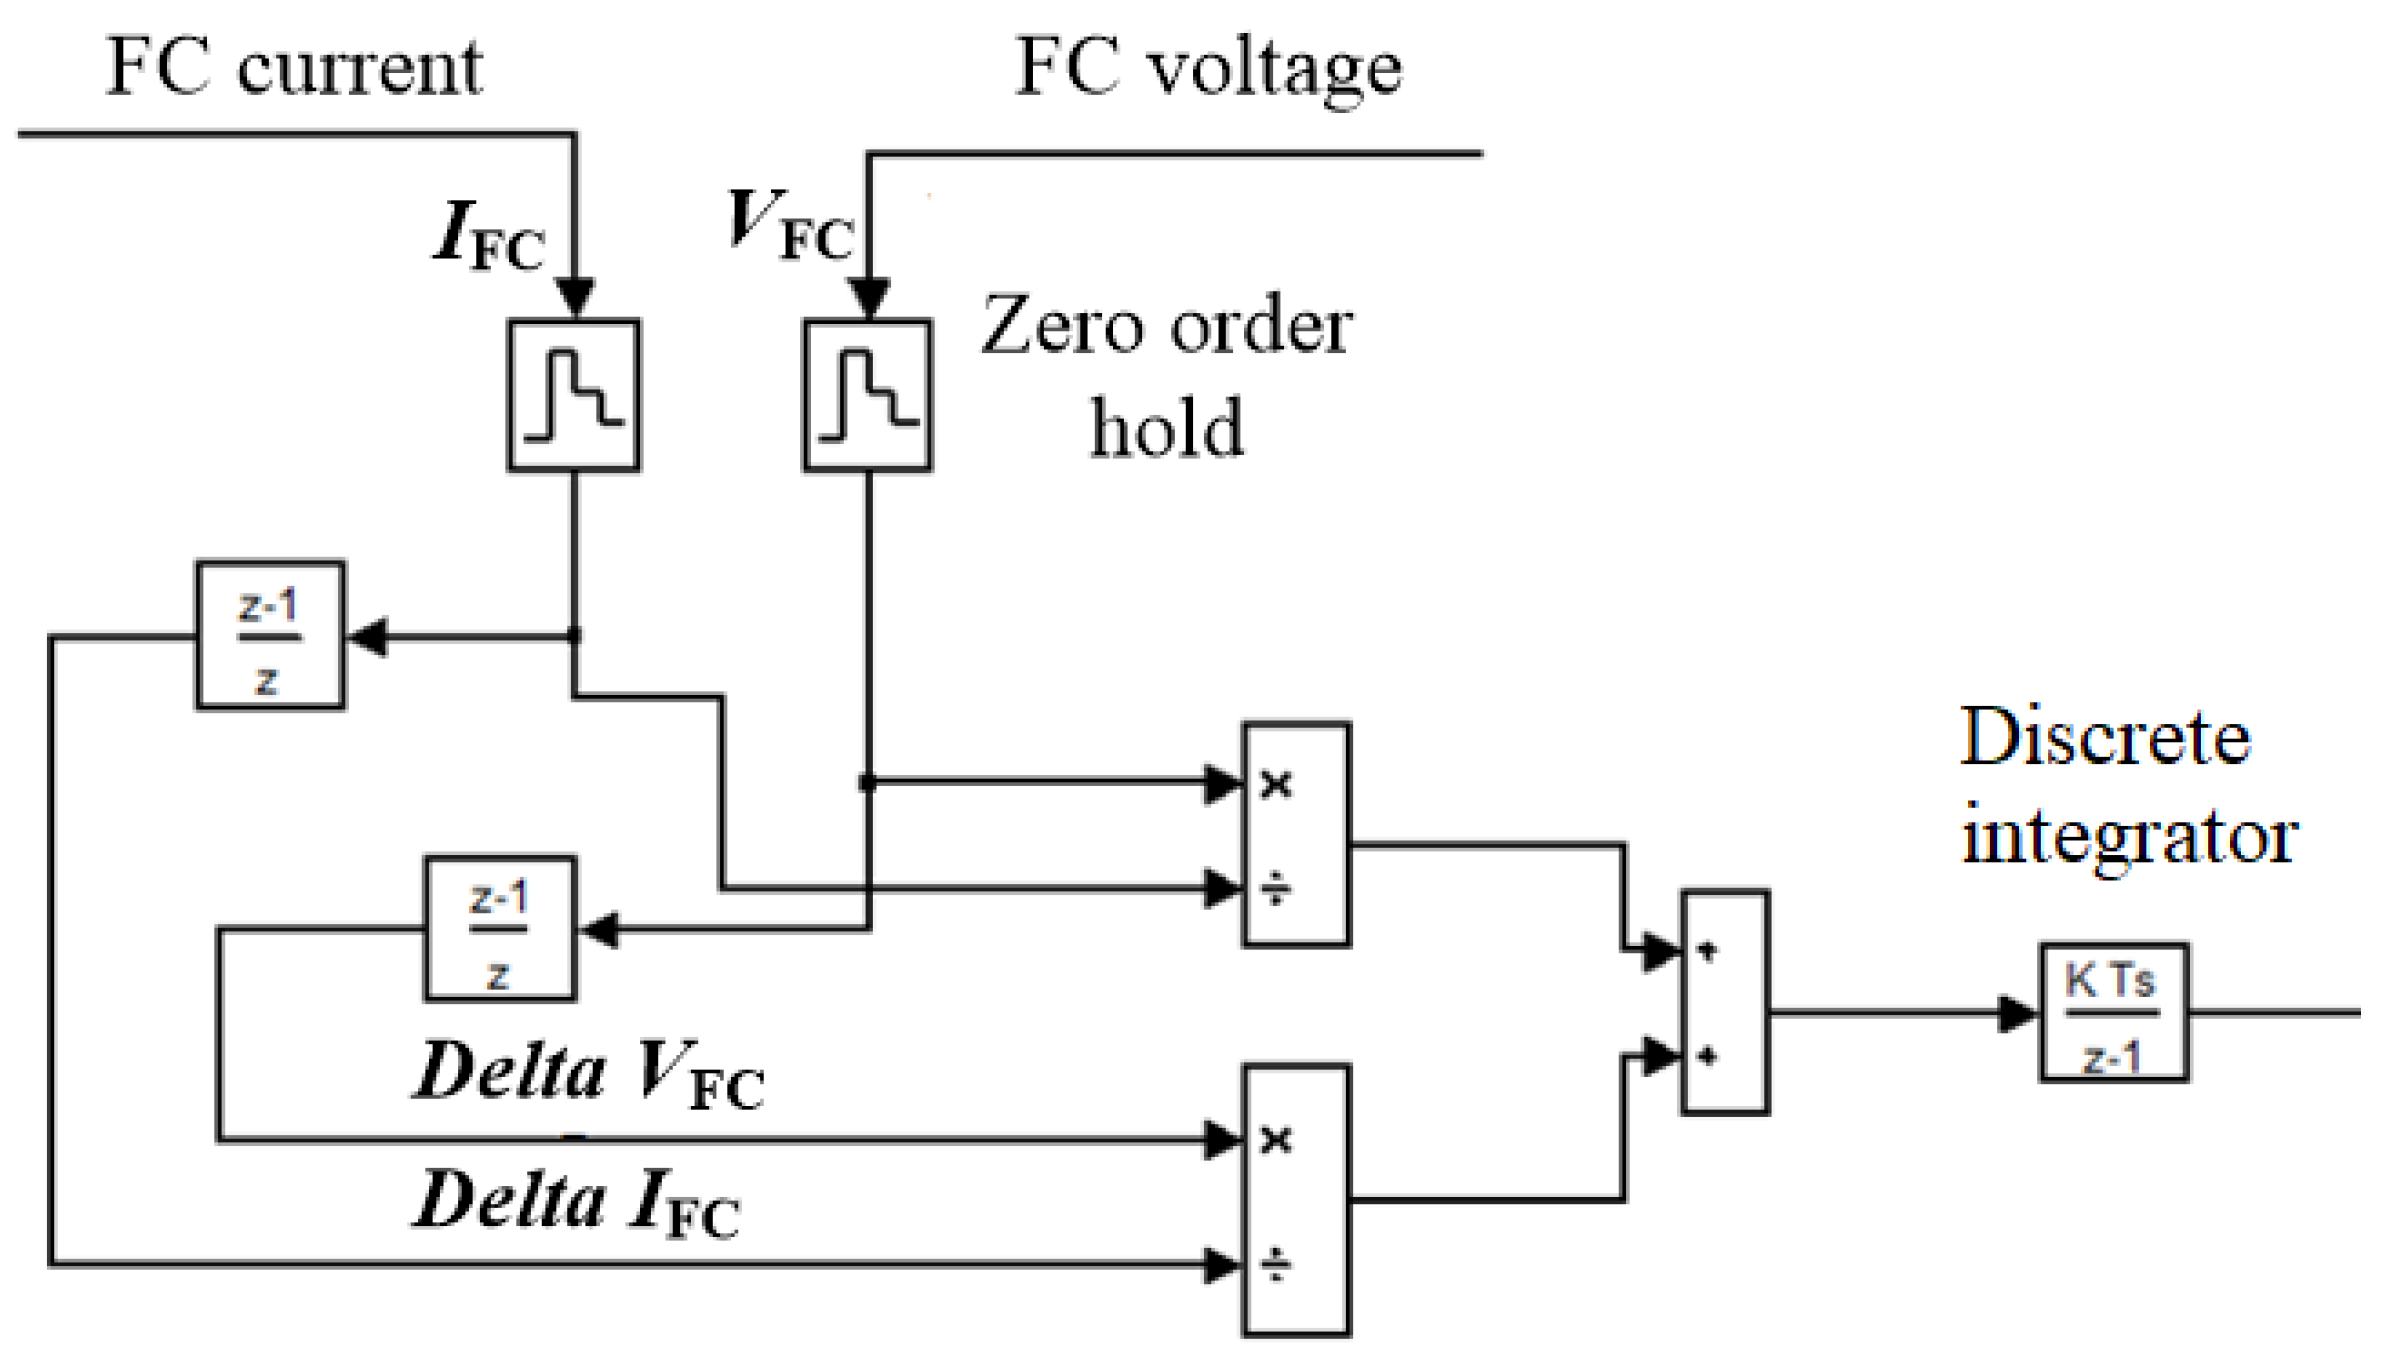
In the case of the variable step-size INR (VSS-INR) method, the size of the step is directly proportional to the error signal. Therefore, the step size will become tiny as the error becomes very small nearby the maximum power point. Consequently, the accuracy of the VSS-INR tracking method is high in a steady state. The VSS-INR can be modeled using a simple discrete integrator with the error signal as the input, and an integrator gain k. The function of the integrator gain k is used to adapt the error signal to a proper range before the integral compensator. Figure 3 illustrates the Matlab model of the INR method.
4. Materials and Methods
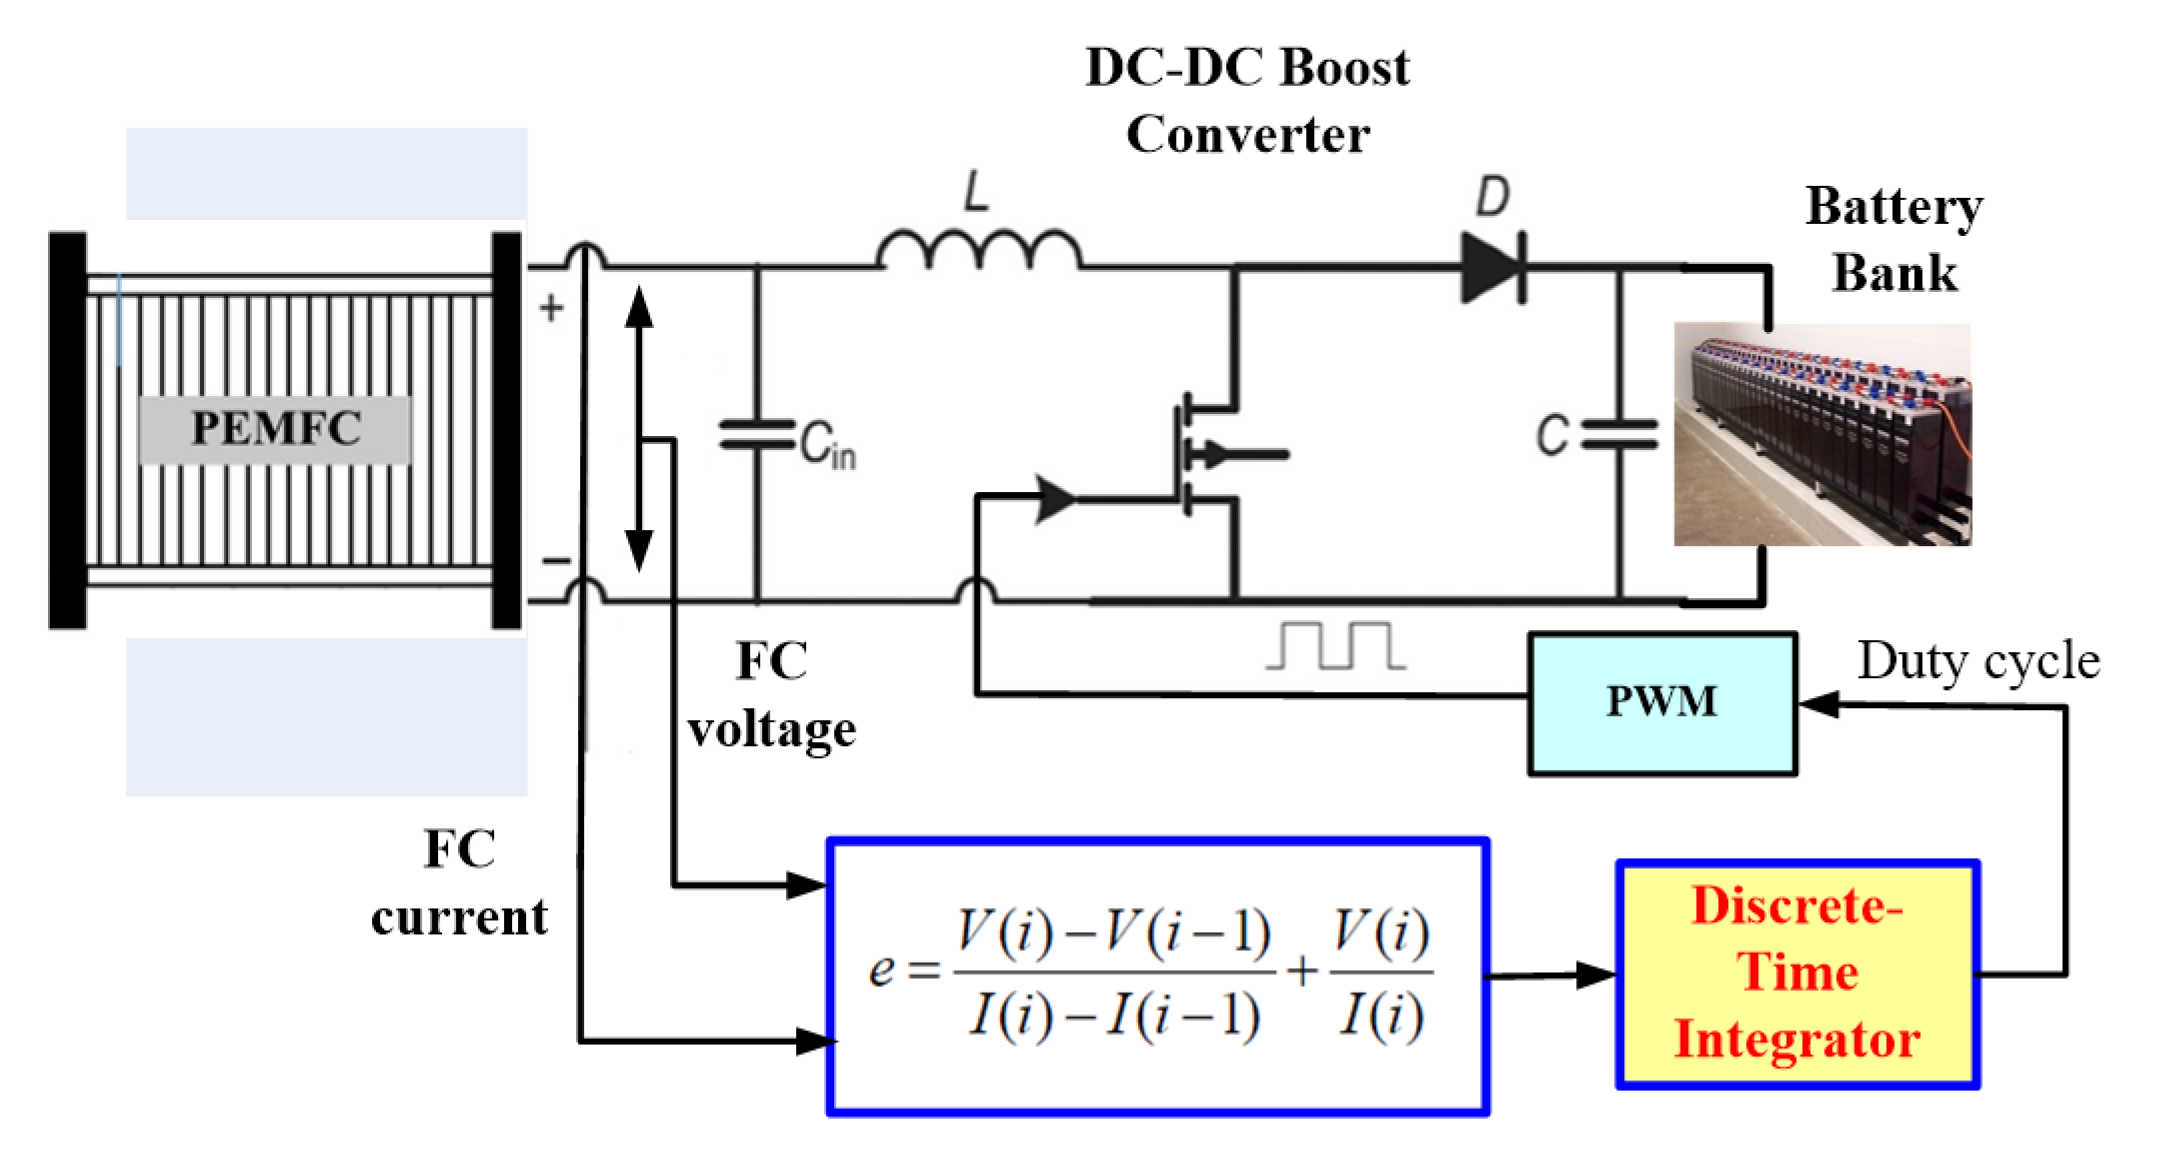
The tracking performances of the VSS-INR method with the PEM fuel system were tested. The PEM fuel system integrated with VSS-INR tracking method is presented in Figure 4. The parameters of the employed FC are given in Table 2. The proposed system includes a PEM fuel cell, a boost converter operating in continuous conducted current mode with switching frequency of 20 kHz, an input inductance of 1 mH, an output capacitor of 50 μF, and 50 V battery bank. Nine different cases of study were considered by varying the temperature and water content. These included five cases of normal operating conditions, one case of variation in cell temperature, two cases of variation in membrane water amount, and one case of simultaneous variation in cell temperature and membrane water content. To demonstrate the performance of the VSS-INR method, the obtained results were compared with particle swarm optimization (PSO), perturb and observe (P&O), and sliding mode (SM) algorithms [7].
5. Results and Discussion
The details of considered scenarios and extracted power with different tracking methods are shown in Table 3. The tracking efficiency for each scenario using different tracking methods can be defined as the ratio between the actual extracted power and the theoretical power.
5.1. Normal Operation Scenario
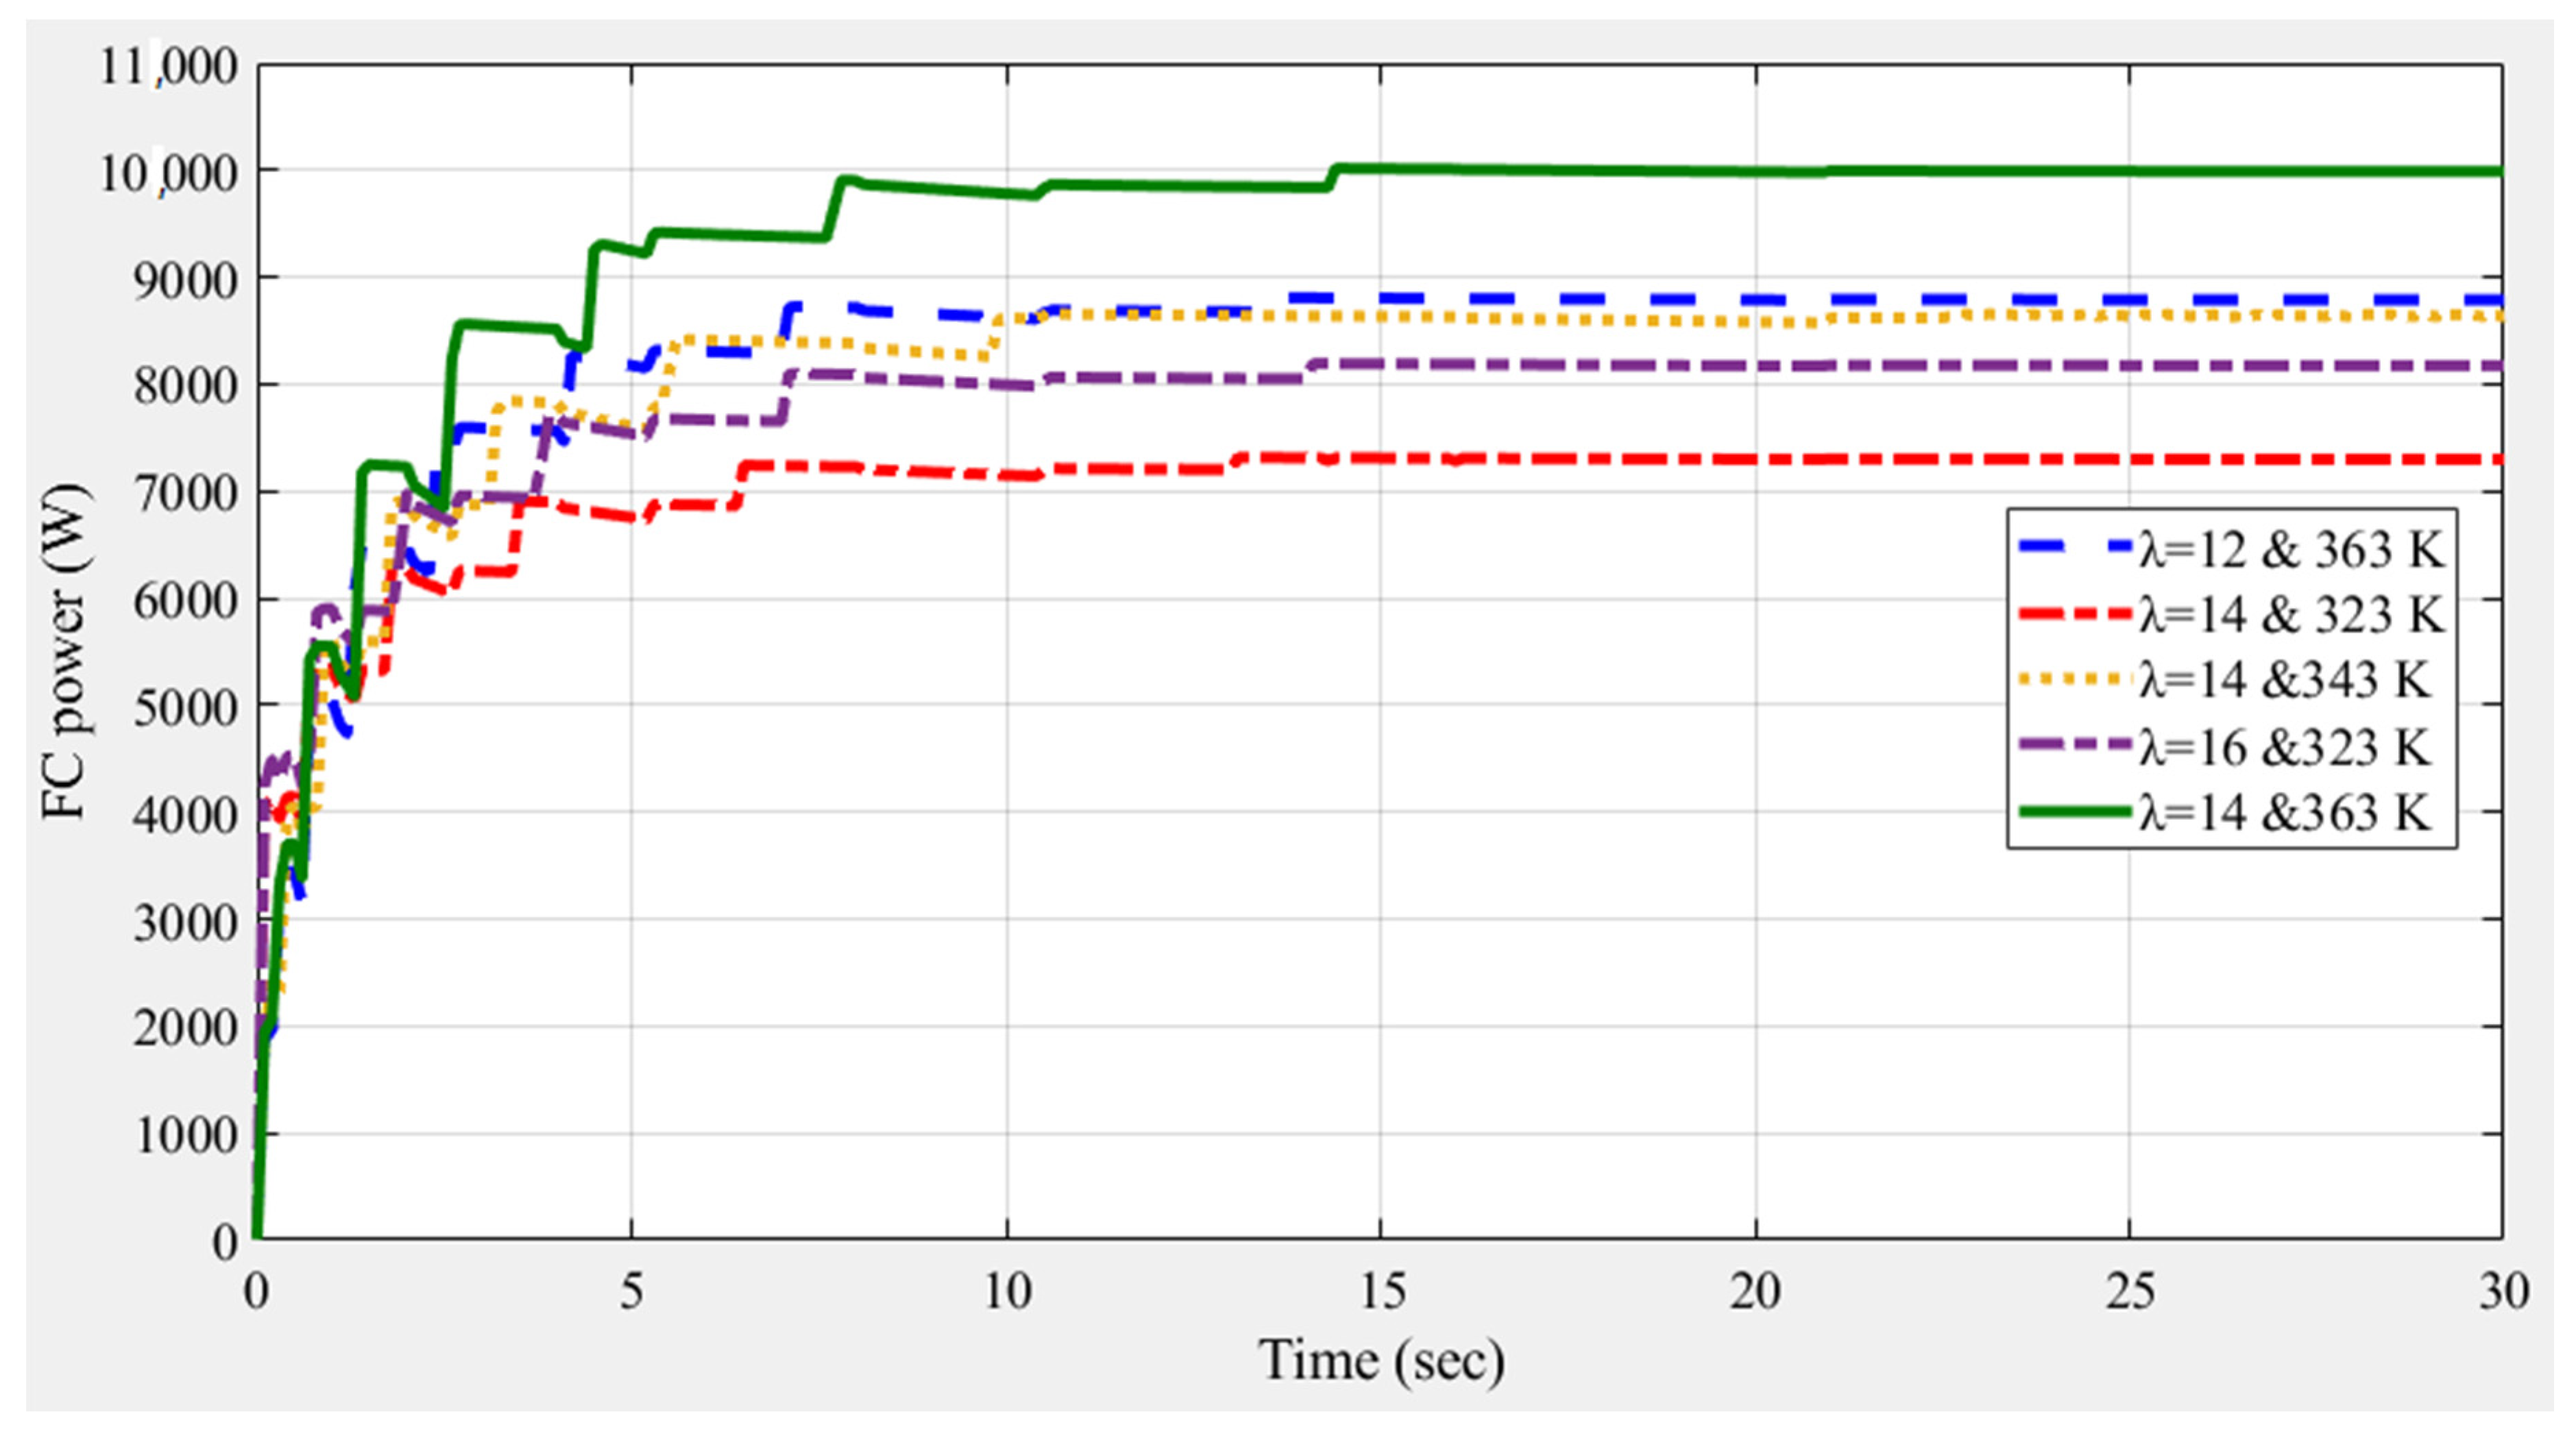
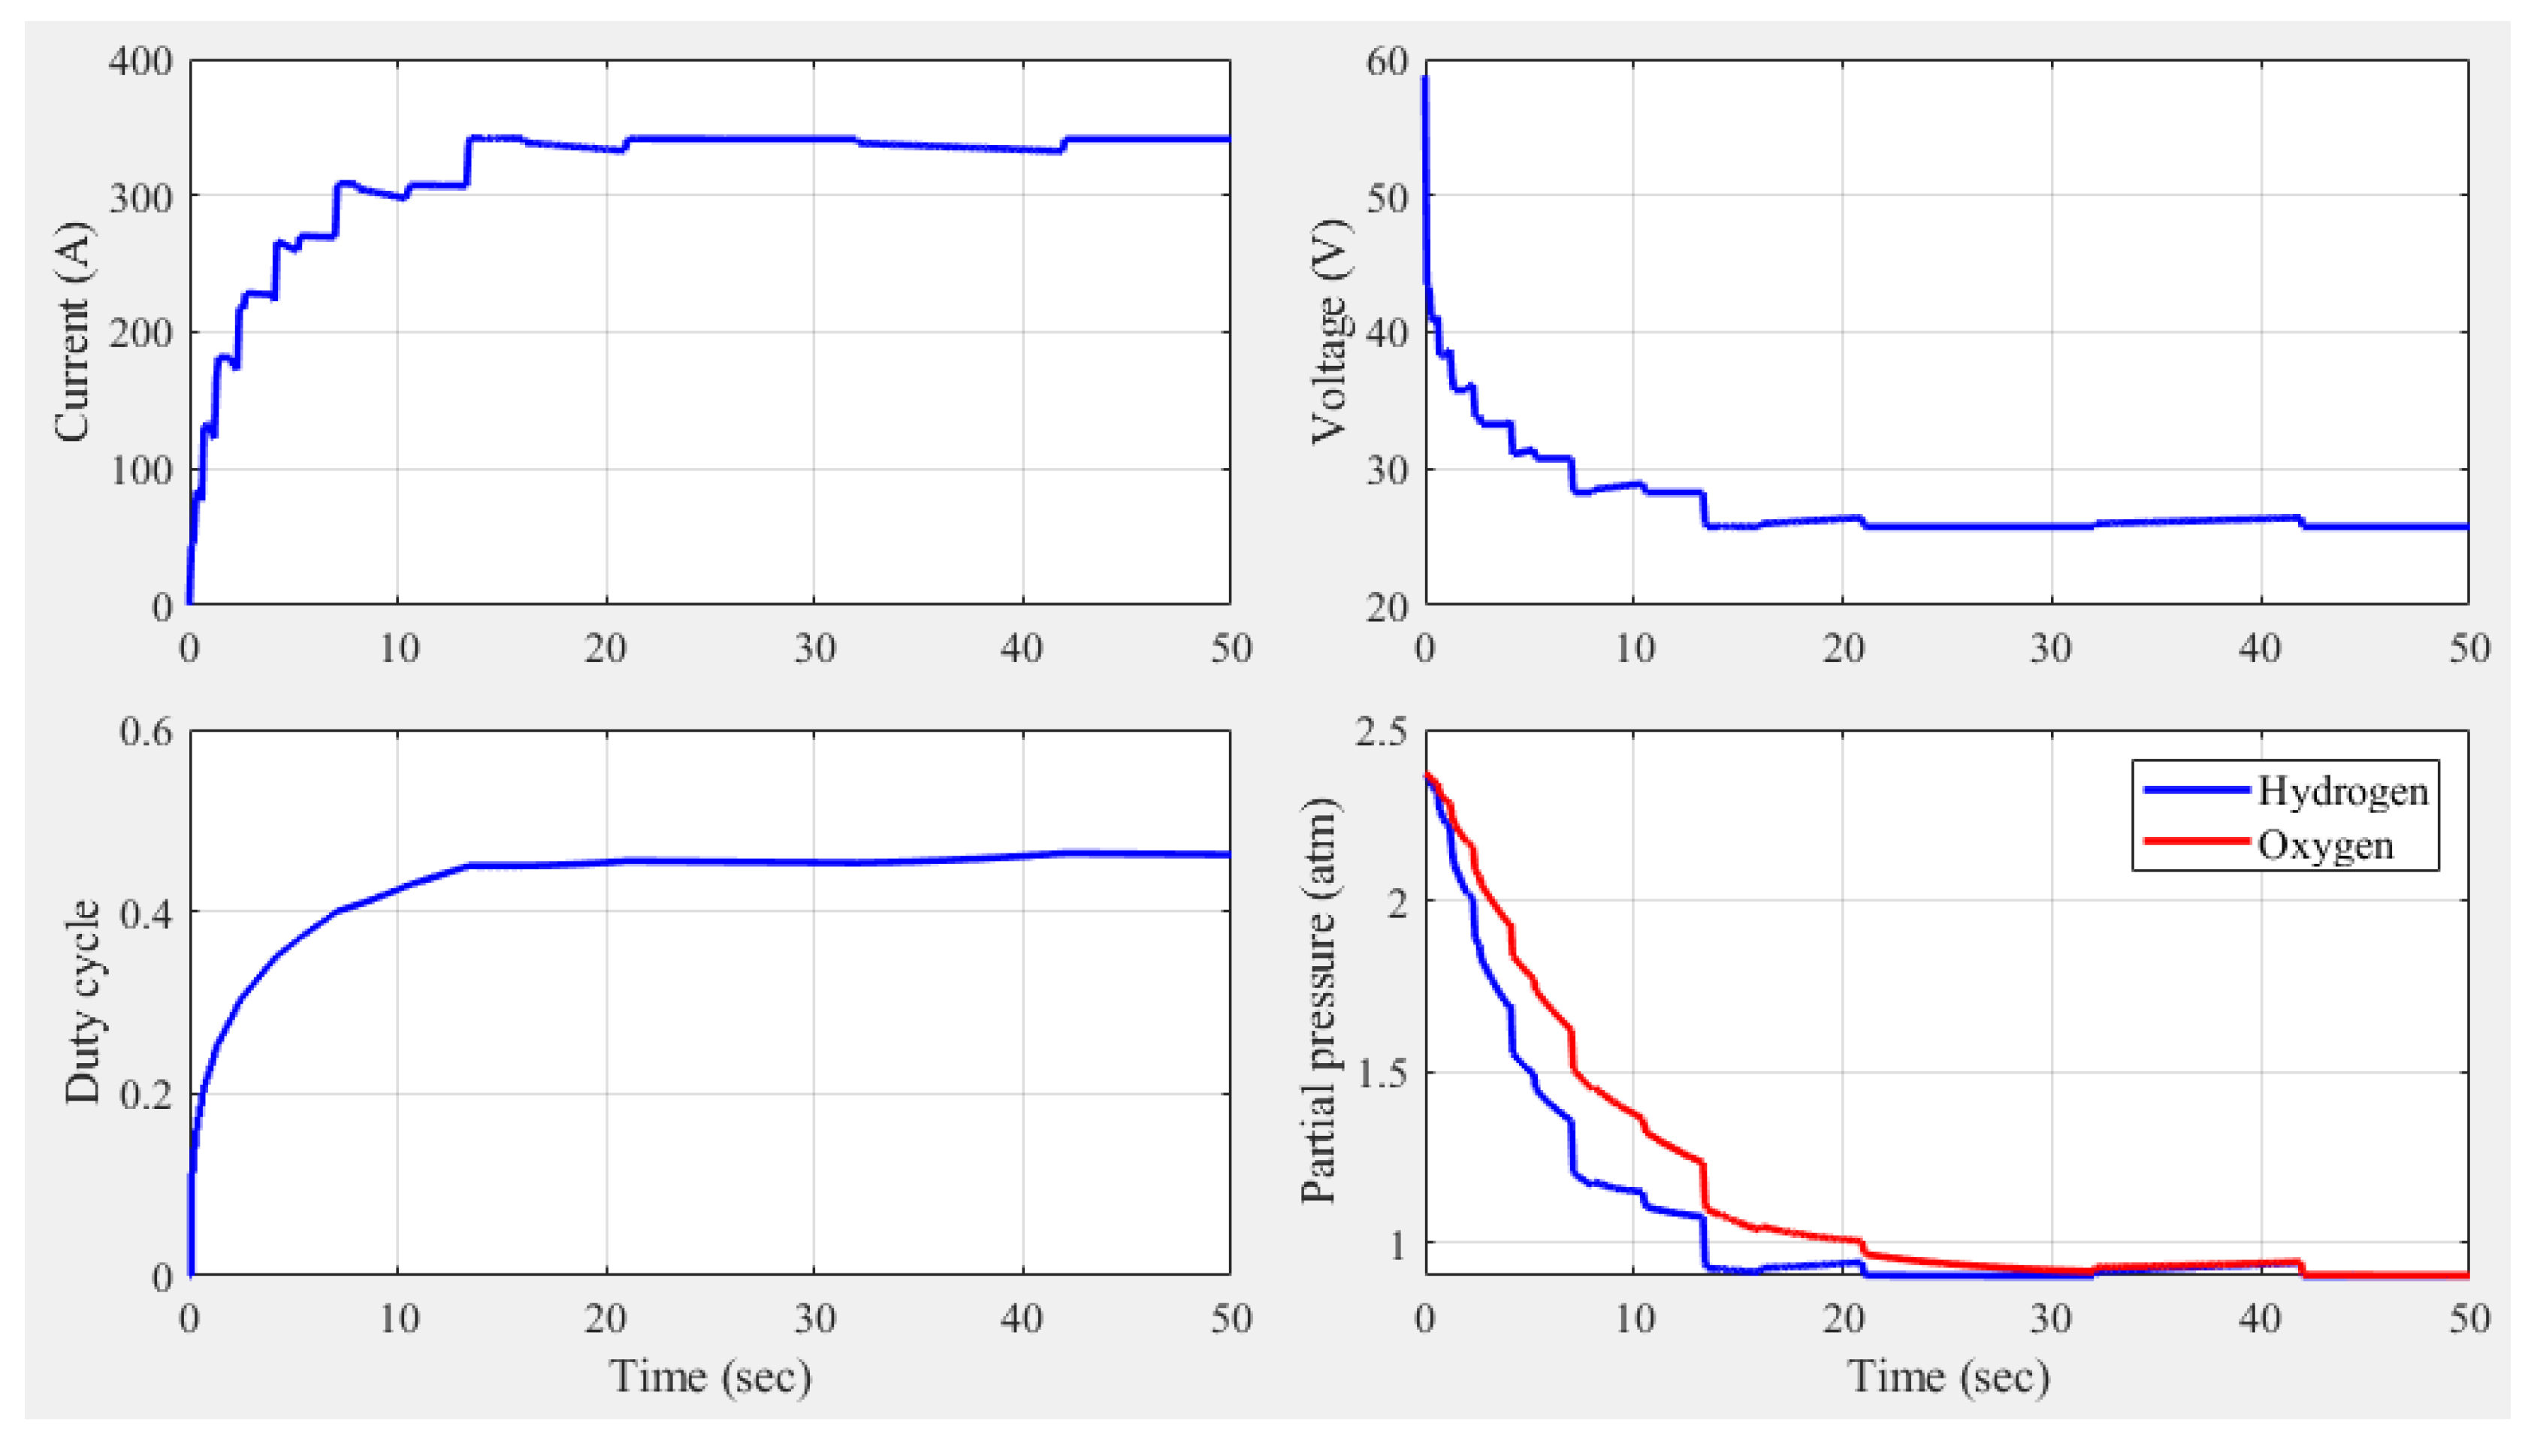
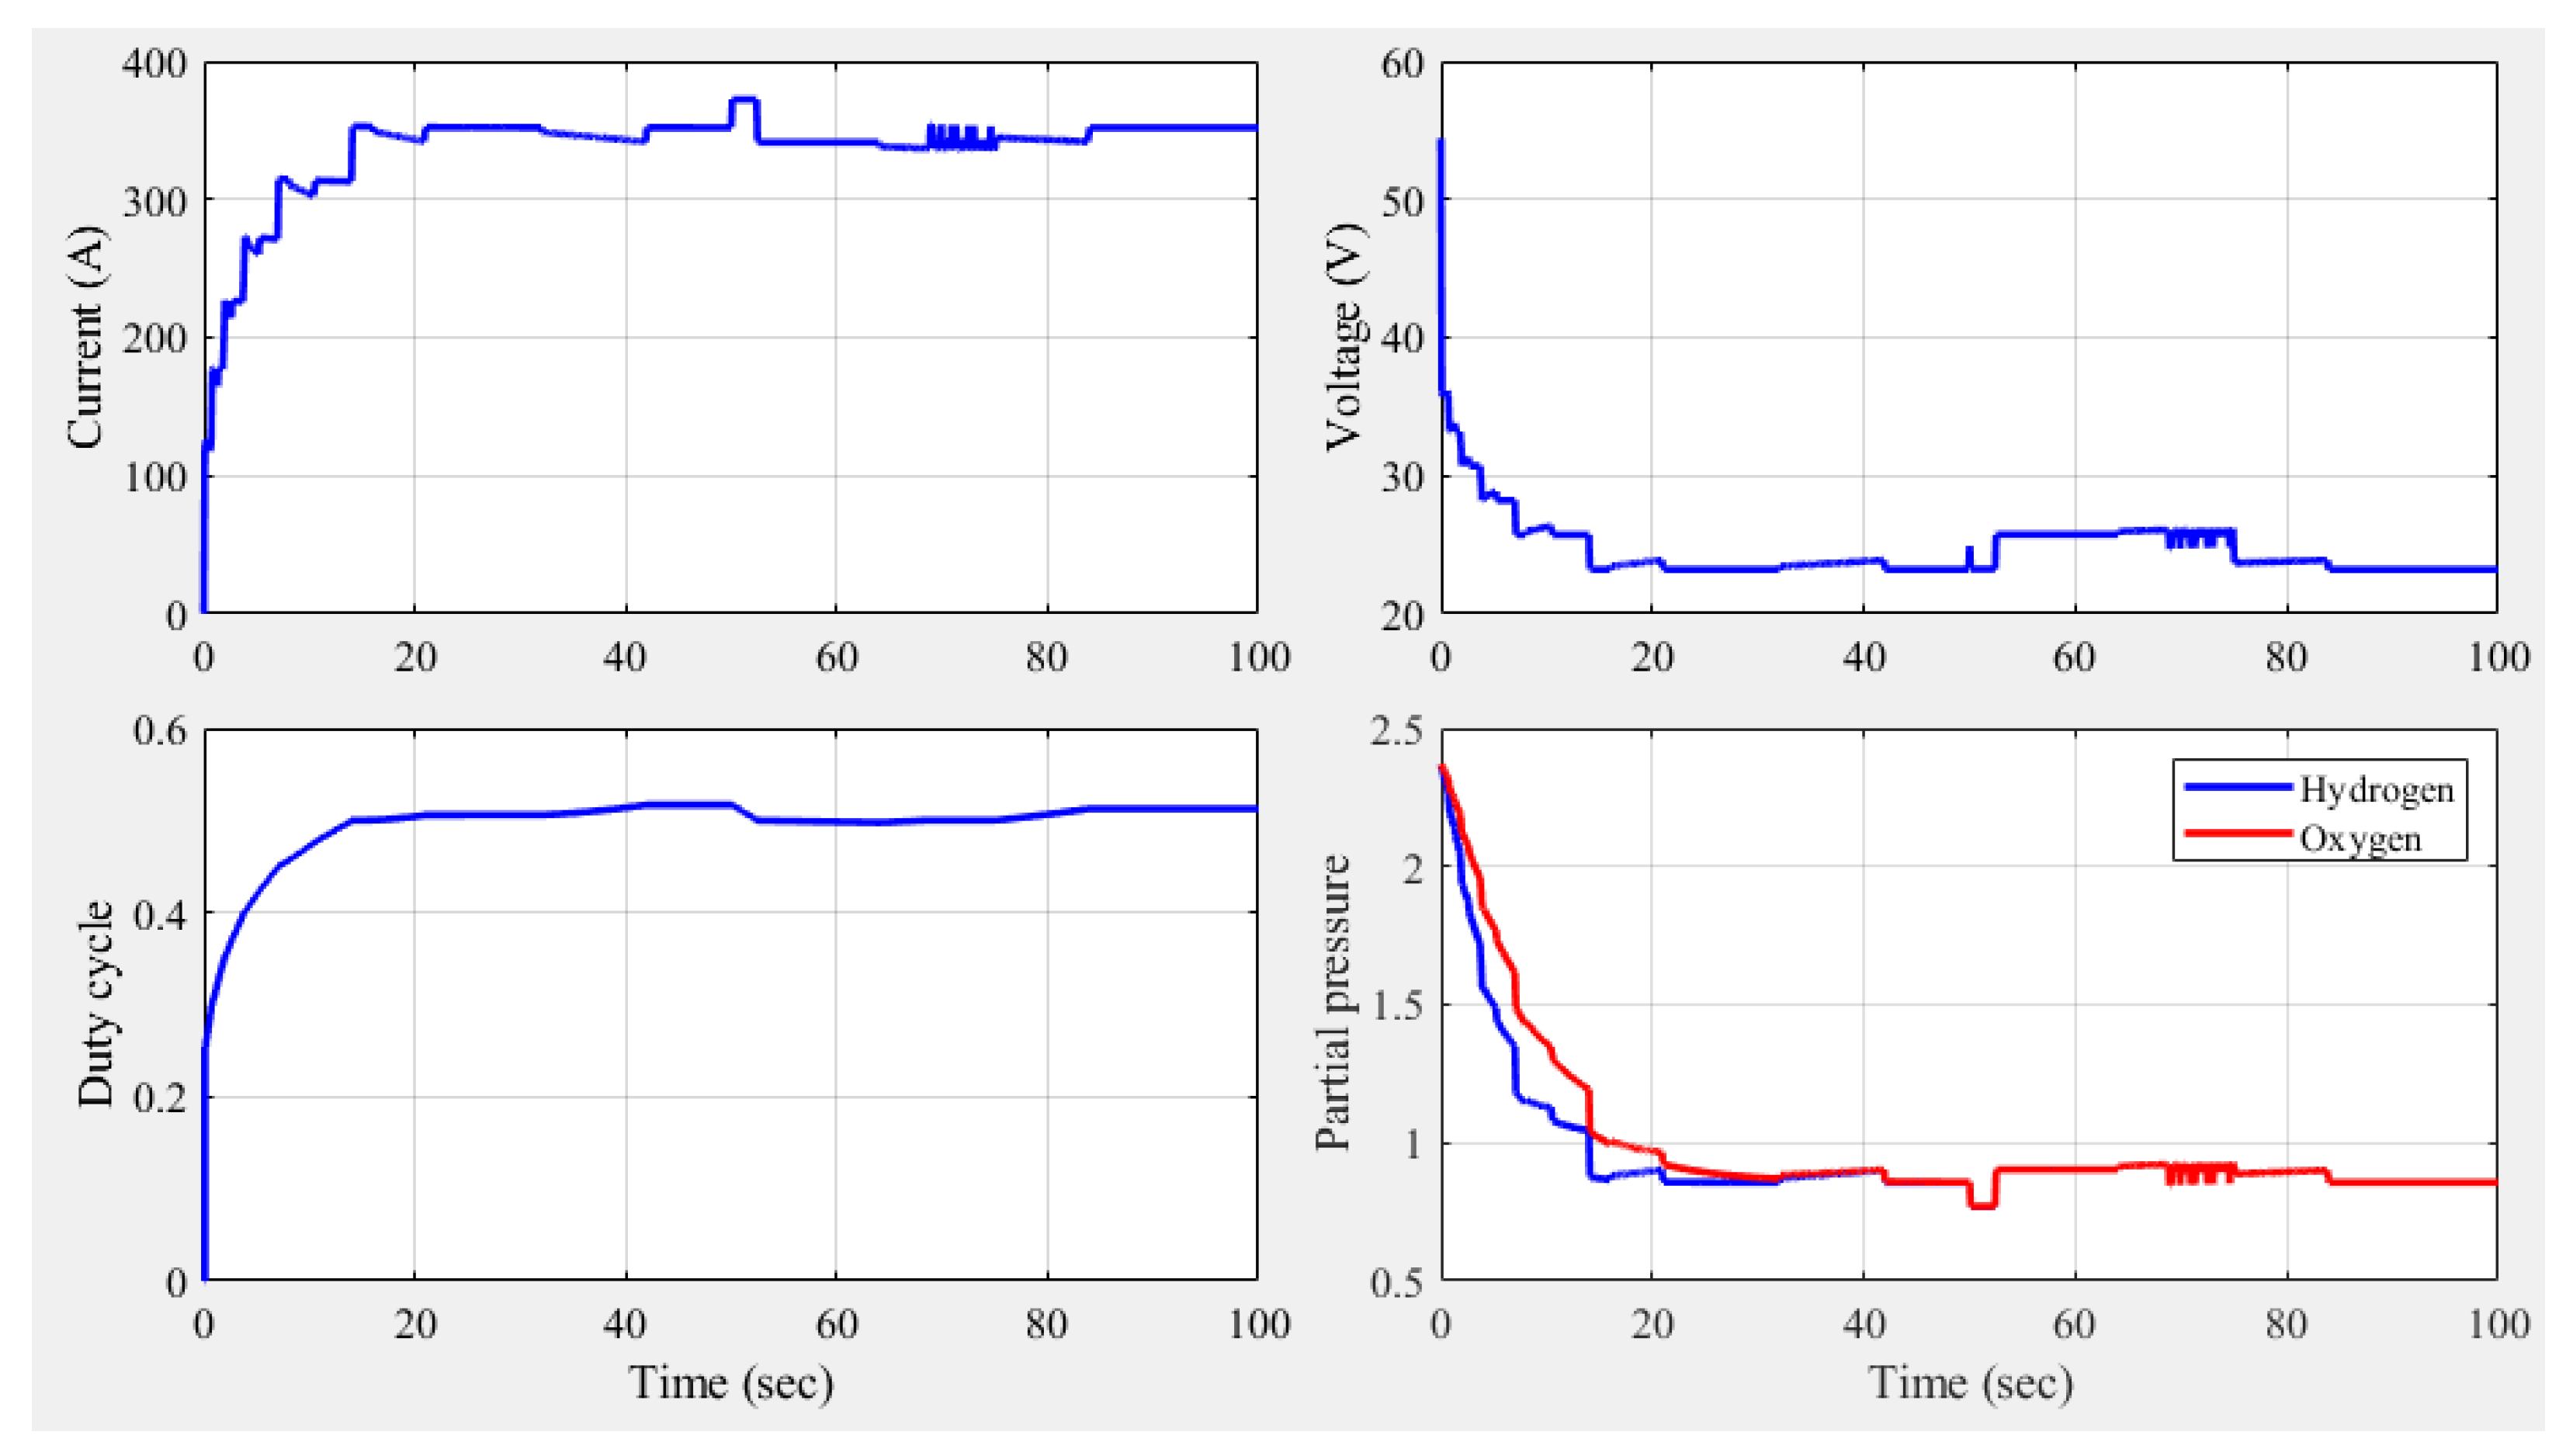
Five scenarios of normal operation under different FC temperature and water content were considered. Considering Table 3, it can be noted that for all scenarios, the VSS-INR method successfully extracted the maximum power with high efficiency. For the second normal operation scenario, the water content and FC temperature were 14 and 343 K, respectively. Under this condition, the theoretical maximum power of the FC and the corresponding current were 8650.3 W and 352 A. The extracted maximum power values were 8511.5 W, 8483.2 W, 8440.7 W, and 8640 W, respectively, for PSO, SM, P&O, and VSS-INR. Using the VSS-INR increased the extracted maximum power by 1.51%, 2.36%, and 1.85%, respectively, compared to PSO, SM, and P&O. The tracking efficiency values were 99.88% and 98.39% for VSS-INR and PSO, respectively. The dynamic FC power curves under normal operation with different conditions using the VSS-INR method are presented in Figure 5. The detailed performance of the FC system during normal operation for scenario 4 using the VSS-INR method as an example is presented in Figure 6. The steady-state values of FC current, voltage, and duty cycle were 341.2 A, 25.75 V, and 0.4523, respectively.
5.2. Temperature Variation in the Fuel Cell
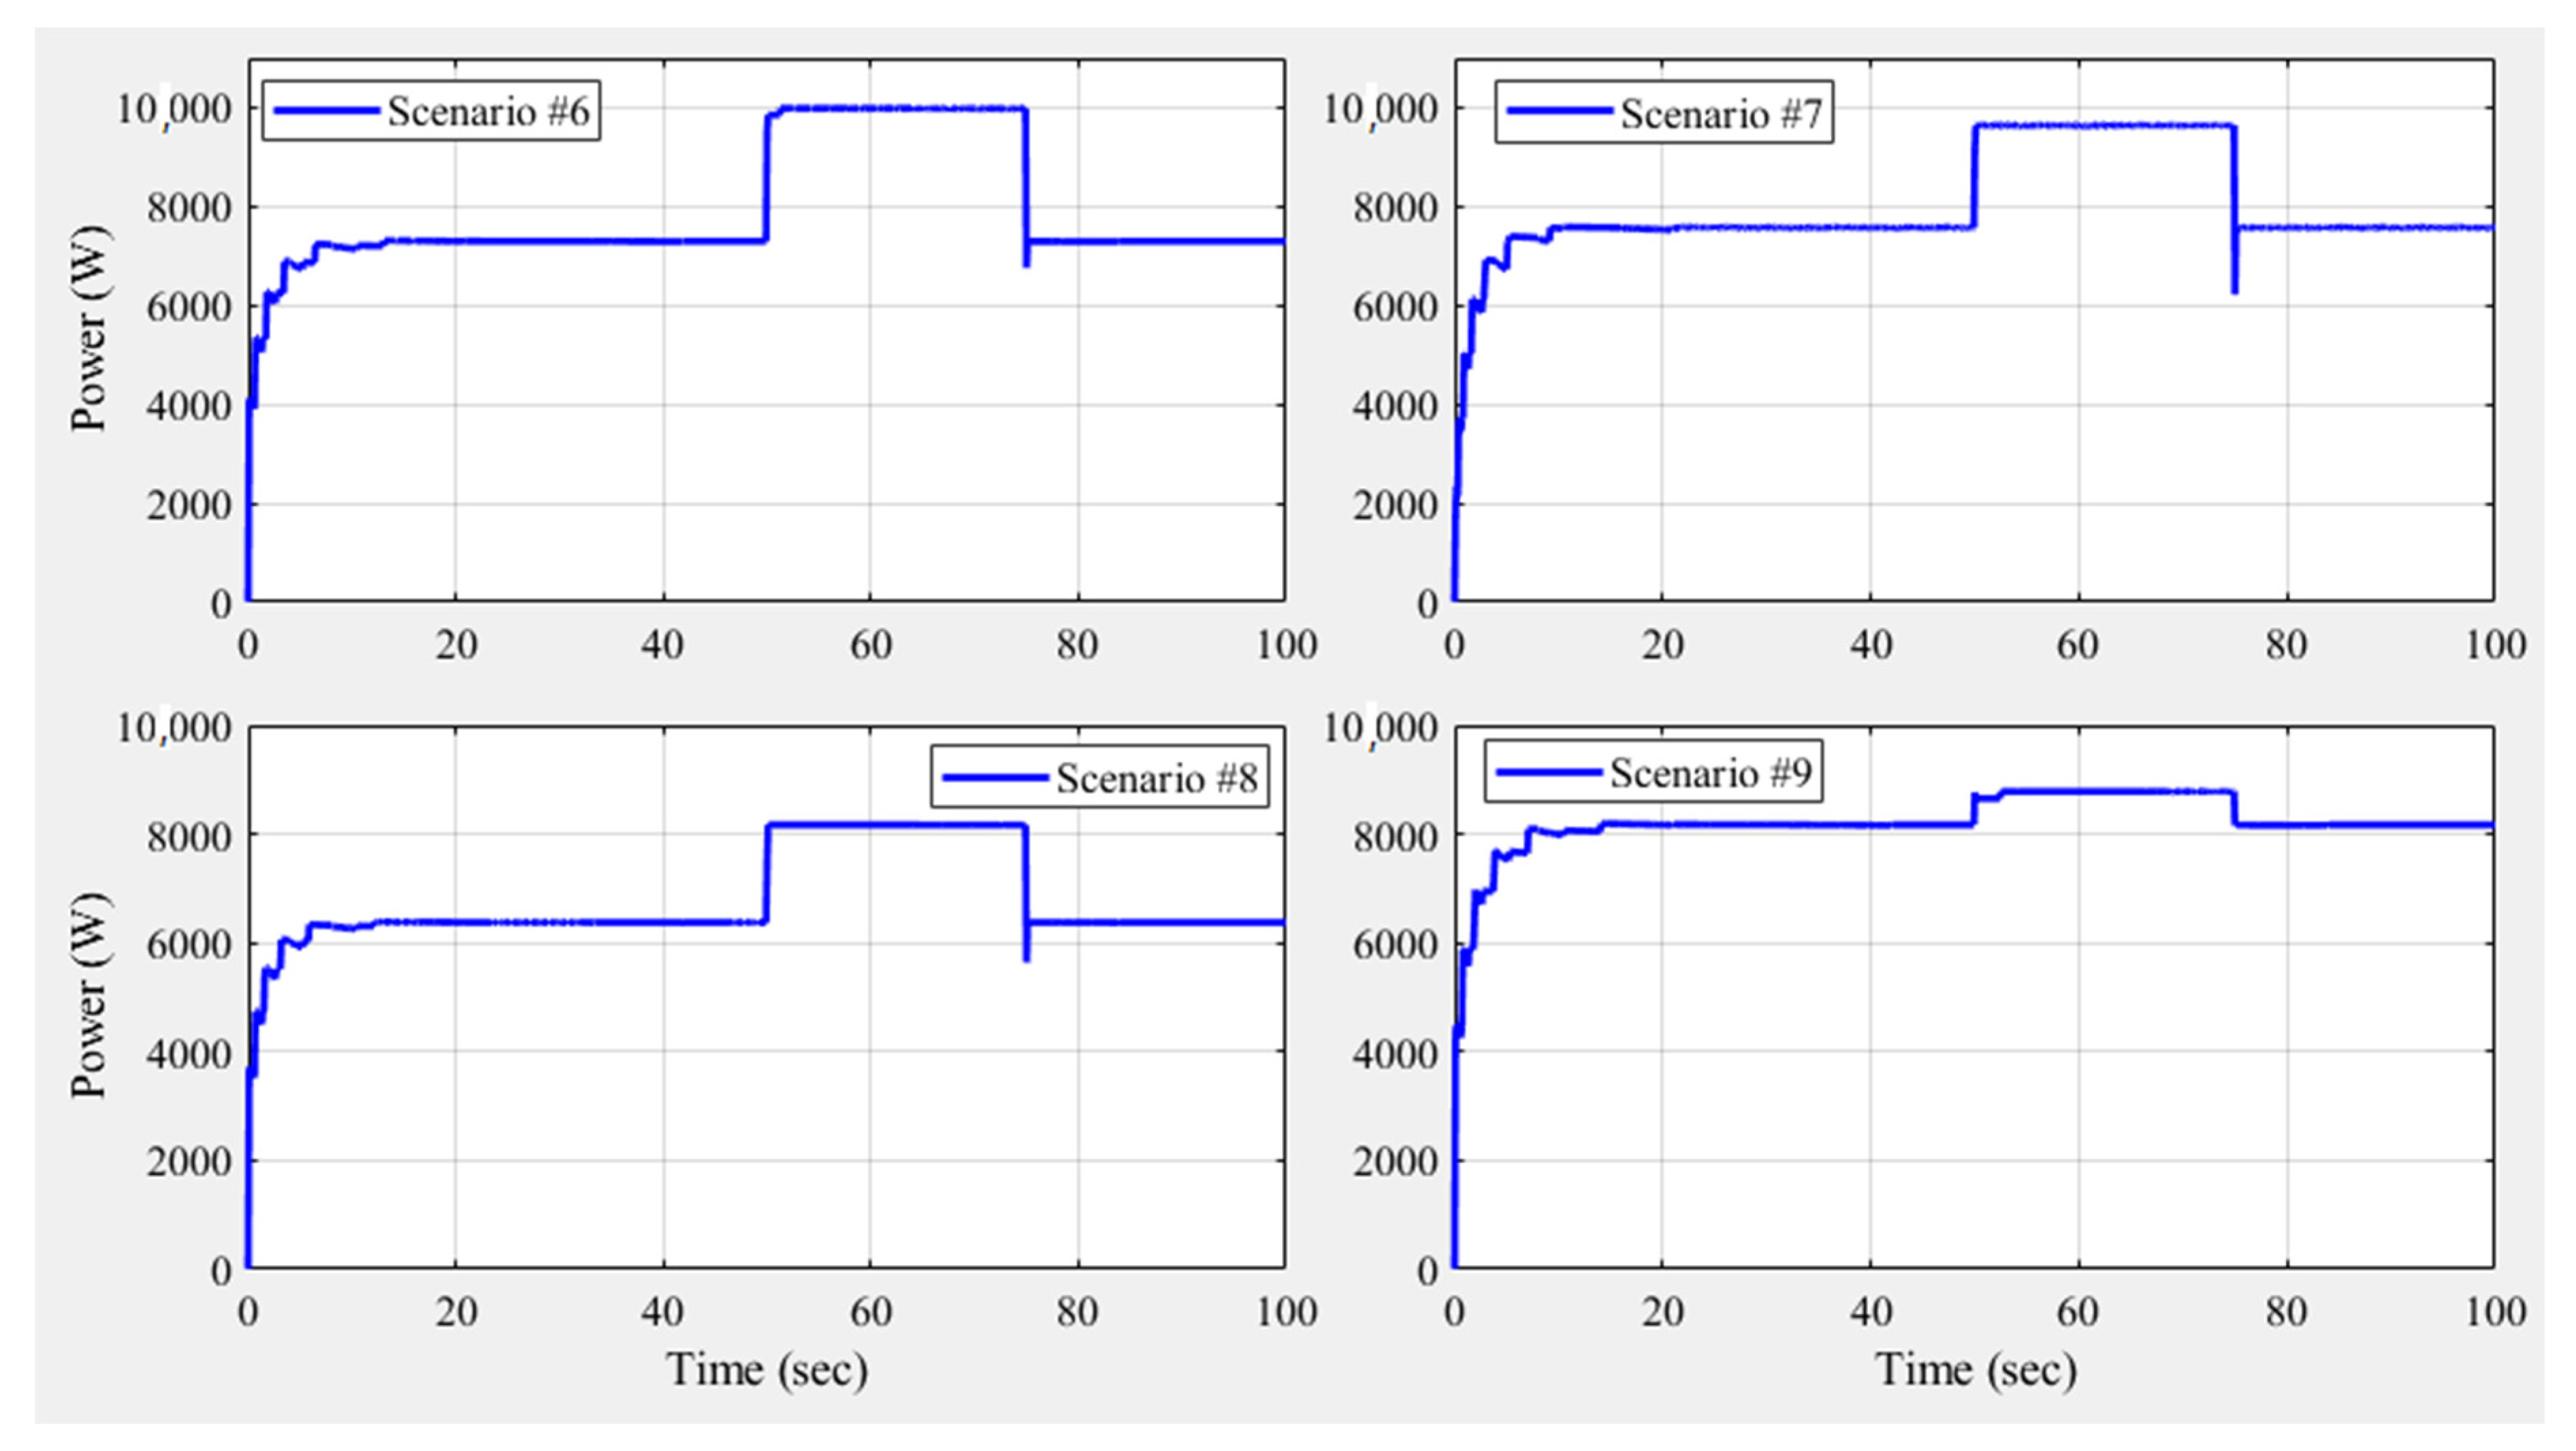
To test the robustness of the VSS-INR tracking method in extracting the maximum power under a sharp variation of fuel cell temperature, scenario 6 was considered. Under this condition, the FC was operated firstly at 323 K, then at the time of 50 s, the temperature value was increased to 363 K, then again at the time of 75 s, the temperature value returned to the initial value of 323 K. During this scenario, the water content value was kept constant (λ = 14). Considering Table 3, for the first period (0 s to 50 s), the theoretical maximum power of the FC and the corresponding current were 7297 W and 316 A. The extracted maximum power values were 7202.5 W, 7174.6 W, 7135.6 W, and 7292 W, respectively, for PSO, SM, P&O, and VSS-INR. Using VSS-INR increased the extracted maximum power by 1.24%, 1.636%, and 2.192%, respectively, compared to PSO, SM, and P&O. The tracking efficiency values were 99.93% and 98.70% for VSS-INR and PSO, respectively. Meanwhile, for the second period (50 s to 75 s), the theoretical maximum power of FC and the corresponding current were 9984.2 W and 388 A. The extracted maximum power values were 9689.5 W, 9666 W, 9612.9 W, and 9980 W, respectively, for PSO, SM, P&O, and VSS-INR. Using VSS-INR increased the extracted maximum power by 2.998%, 3.248%, and 3.82%, respectively, compared to PSO, SM, and P&O. The tracking efficiency values were 99.96% and 97.05% for VSS-INR and PSO, respectively. This means the tracking efficiency increased by 3% by using VSS-INR compared with the PSO strategy. The dynamic FC power curves under the variation of the temperature during scenario 6 using the VSS-INR method are presented in Figure 7 (upper-left).
5.3. Variation of the Membrane Water Content
It is essential to validate the VSS-INR method on an FC operated at different amounts of water in the membrane. Two different scenarios of the variation of water content were considered under two different FC temperature values of 343 K and 323 K, respectively, for scenario 7 and scenario 8. For both scenarios the water content value was 12 at the starting point, then at the time of 50 s, it was increased to 16, then came back to 12 at the time of 75 s. During scenario 7, referring to Table 3, for the first period (0 s to 50 s), the theoretical maximum power of the FC and the corresponding current were 7582.4 W and 305 A. The extracted maximum power values were 7482.8 W, 7456.1W, 7405.5 W, and 7575 W, respectively, for PSO, SM, P&O, and VSS-INR. Using VSS-INR increased the extracted maximum power by 1.23%, 1.59%, and 2.29%, respectively, compared to PSO, SM, and P&O. The tracking efficiency values were 99.90% and 98.69% for VSS-INR and PSO, respectively. Meanwhile, for the second period (50 s to 75 s), the theoretical maximum power of the FC and the corresponding current were 9647.1 W and 397 A. The extracted maximum power values were 9363.5W, 9339.1 W, 9293.3 W, and 9640 W, respectively, for PSO, SM, P&O, and VSS-INR. Using VSS-INR increased the extracted maximum power by 2.95%, 3.22%, and 3.73%, respectively, compared to PSO, SM, and P&O. The tracking efficiency values were 99.93% and 97.06% for VSS-INR and PSO, respectively. This means the tracking efficiency increased by 2.96% when using VSS-INR compared with the PSO strategy. The dynamic FC power curve under variation of the water content during scenario 7 using the VSS-INR method is presented in Figure 6 (upper-right). Whereas the dynamic power during scenario 8 is shown in Figure 7 (bottom-left). For this scenario, the theoretical power values were 6375.9 W, 8171.6 W, and 6375.9 W, respectively, for the first, second, and third periods. With high tracking efficiency, the VSS-INR successfully extracted 6374 W, 8169 W, and 6374 W, respectively, for the first, second, and third periods.
5.4. Fast Variations of the Cell Temperature and the Membrane Water Content Simultaneously
The last scenario considered the variation of both FC temperature and water content in the membrane simultaneously. Under this condition, the FC was operated firstly at a temperature of 323 K and water content of 16. Next, at the time of 50 s, the temperature value was increased to 363 K and at the same time the water content was reduced to 12, then again at the time of 75 s, the FC temperature and water content values were returned to the initial values. Considering Table 3, for the first period (0 s to 50 s), the theoretical maximum power of the FC and the corresponding current were 8171.6 W and 352 A. The extracted maximum power values were 8047.3 W, 8018.2 W, 7984.6 W, and 8170 W, respectively, for PSO, SM, P&O, and VSS-INR. Using VSS-INR increased the extracted maximum power by 1.525%, 1.89%, and 2.322%, respectively, compared to PSO, SM, and P&O. The tracking efficiency values were 99.98% and 98.48% for VSS-INR and PSO, respectively. Meanwhile, for the second period (50 s to 75 s), the theoretical maximum power of the FC and the corresponding current were 8785 W and 343 A. The extracted maximum power values were 8580.4 W, 8556.5 W, 8501.4 W, and 8785 W, respectively, for PSO, SM, P&O, and VSS-INR. Using VSS-INR increased the extracted maximum power by 2.384%, 2.67%, and 3.336%, respectively, compared to PSO, SM, and P&O. The tracking efficiency values were 100.0% and 97.67% for VSS-INR and PSO, respectively. This means the tracking efficiency increased by 2.4% when using VSS-INR compared with the PSO strategy. The dynamic FC power curves under the variation of the temperature during scenario 6 using the VSS-INR method is presented in Figure 7 (bottom-right). The detailed performance of the FC system during scenario 9 using the VSS-INR method is presented in Figure 8. The steady-state values of the FC current, voltage, and duty cycle were 351.9 A, 23.22 V, and 0.513, respectively.
6. Conclusions
A variable step-size incremental resistance (VSS-INR) maximum power point tracking (MPPT) method was presented in this paper to maximize the output power of a PEM fuel cell under varying operating conditions. The VSS-INR MPPT adjusts the operating point of the PEM fuel cell to the maximum power by updating the duty cycle of a DC-DC converter using current and voltage sensors. Nine different scenarios of operating conditions were used to test and evaluate the tracking performance of the VSS-INR method. The results obtained using the VSS-INR were compared with particle swarm optimization (PSO), perturb and observe (P&O), and sliding mode (SM) methods. The results confirmed the effectiveness of the VSS-INR in extracting the maximum power from the PEMFC under any operating conditions. Excellent steady-state performance was achieved since the size of the step of VSS-INR is directly proportional to the error signal. It is small in a steady state as the error becomes very small nearby the maximum power point. As an example, for the second normal operation scenario, the water content and FC temperature were 14 and 343 K, respectively. The theoretical maximum power of FC and the corresponding current were 8650.3 W and 352 A, respectively. The extracted maximum power values were 8511.5 W, 8483.2 W, 8440.7 W, and 8640 W, respectively, for PSO, SM, P&O, and VSS-INR. Using VSS-INR increased the extracted maximum power by 1.51%, 2.36%, and 1.85%, respectively, compared to PSO, SM, and P&O. The tracking efficiency values were 99.88% and 98.39% for VSS-INR and PSO, respectively.
Author Contributions
Conceptualization, H.R. and A.F.; methodology, H.R. and A.F.; software, H.R. and A.F.; validation, A.F.; writing—original draft preparation, A.F.; writing—review and editing, A.F. All authors have read and agreed to the published version of the manuscript.
Funding
This research was funded by the Deanship of Scientific Research at Prince Sattam Bin Abdulaziz University under the research project No. 2020/01/11742.
Conflicts of Interest
No Conflicts of Interest.
References
- Sanjeevikumar, P.; Priyadarshi, N.; Bhaskar, M.S.; Bhaskar, M.S.; Hossain, E.; Azam, F. A Hybrid Photovoltaic-Fuel Cell for Grid Integration with Jaya-Based Maximum Power Point Tracking: Experimental Performance Evaluation. IEEE Access 2019, 7, 82978–82990. [Google Scholar]
- Mohamed, A.P.; Chandrakala, K.R.M.V.; Saravanan, S. Comparative study of maximum power point tracking techniques for fuel cell powered electric vehicle. IOP Conf. Ser. Mater. Sci. Eng. 2019, 577, 012031. [Google Scholar] [CrossRef]
- Fathy, A.; Abdelkareem, M.A.; Olabi, A.G.; Rezk, H. A Novel Strategy Based on Salp Swarm Algorithm for Extracting the Maximum Power of Proton Exchange Membrane Fuel Cell. Available online: https://www.sciencedirect.com/science/article/abs/pii/S0360319920307825 (accessed on 11 July 2020).
- Rana, K.; Kumar, V.; Sehgal, N.; George, S. A Novel dPdI feedback based control scheme using GWO tuned PID controller for efficient MPPT of PEM fuel cell. ISA Trans. 2019, 93, 312–324. [Google Scholar] [CrossRef] [PubMed]
- Derbeli, M.; Barambones, O.; Sbita, L. A Robust Maximum Power Point Tracking Control Method for a PEM Fuel Cell Power System. Appl. Sci. 2018, 8, 2449. [Google Scholar] [CrossRef] [Green Version]
- Derbeli, M.; Sbita, L.; Farhat, M.; Barambones, O. Proton exchange membrane fuel cell—A smart drive algorithm. In Proceedings of the 2017 International Conference on Green Energy Conversion Systems (GECS), Hammamet, Tunisia, 23–25 March 2017; pp. 1–5. [Google Scholar]
- Ahmadi, S.; Abdi, S.; Kakavand, M. Maximum power point tracking of a proton exchange membrane fuel cell system using PSO-PID controller. Int. J. Hydrog. Energy 2017, 42, 20430–20443. [Google Scholar] [CrossRef]
- Harrag, A.; Bahri, H. Novel neural network IC-based variable step size fuel cell MPPT controller. Int. J. Hydrog. Energy 2017, 42, 3549–3563. [Google Scholar] [CrossRef]
- Harrag, A.; Messalti, S. How fuzzy logic can improve PEM fuel cell MPPT performances? Int. J. Hydrog. Energy 2018, 43, 537–550. [Google Scholar] [CrossRef]
- Liu, J.; Zhao, T.; Chen, Y.Q. Maximum power point tracking with fractional order high pass filter for proton exchange membrane fuel cell. IEEE/CAA J. Autom. Sin. 2017, 4, 70–79. [Google Scholar] [CrossRef]
- Harrabi, N.; Souissi, M.; Aitouche, A.; Chaabane, M. Modeling and control of photovoltaic and fuel cell based alternative power systems. Int. J. Hydrog. Energy 2018, 43, 11442–11451. [Google Scholar] [CrossRef]
- Somaiah, B.; Agarwal, V. Distributed Maximum Power Extraction from Fuel Cell Stack Arrays Using Dedicated Power Converters in Series and Parallel Configuration. IEEE Trans. Energy Convers. 2016, 31, 1442–1451. [Google Scholar] [CrossRef]
- Priyadarshi, N.; Sharma, A.K.; Azam, F. A hybrid firefly-asymmetrical fuzzy logic controller based MPPT for PV-wind-fuel grid integration. IJRER 2017, 7, 1546–1560. [Google Scholar]
- Naseri, N.; El Hani, S.; Aghmadi, A.; El Harouri, K.; Heyine, M.S.; Mediouni, H. Proton Exchange Membrane Fuel Cell Modelling and Power Control by P&O Algorithm. In Proceedings of the 2018 6th International Renewable and Sustainable Energy Conference (IRSEC), Rabat, Morocco, 5–8 December 2018; pp. 1–5. [Google Scholar]
- Reddy, K.J.; Sudhakar, N. High Voltage Gain Interleaved Boost Converter with Neural Network Based MPPT Controller for Fuel Cell Based Electric Vehicle Applications. IEEE Access 2018, 6, 3899–3908. [Google Scholar] [CrossRef]
- Abdelkader, A.B.; Abdelkhalek, O.; Mouloudi, Y.; Hartani, M.A.; Slimane, B. Series active power filter supplied by fuel cell for mitigating power quality issues. Int. J. Appl. 2020, 8, 173–192. [Google Scholar]
- Derbeli, M.; Farhat, M.; Barambones, O.; Sbita, L. A robust MPP tracker based on backstepping algorithm for Proton Exchange Membrane Fuel Cell power system. In Proceedings of the 2017 11th IEEE International Conference on Compatibility, Power Electronics and Power Engineering (CPE-POWERENG), Cadiz, Spain, 4–6 April 2017; pp. 424–429. [Google Scholar]
- Venkateshkumar, M.; Indumathi, R. Comparative analysis of hybrid intelligent controller based MPPT of fuel cell power system. In Proceedings of the 2017 IEEE International Conference on Smart Technologies and Management for Computing, Communication, Controls, Energy and Materials (ICSTM), Chennai, India, 2–4 August 2017; pp. 155–159. [Google Scholar]
- Rezk, H. Performance of incremental resistance MPPT based proton exchange membrane fuel cell power system. In Proceedings of the 2016 Eighteenth International Middle East Power Systems Conference (MEPCON), Cairo, Egypt, 27–29 December 2016; pp. 199–205. [Google Scholar]
- Samal, S.; Ramana, M.; Barik, P.K. Modeling and simulation of interleaved boost converter with MPPT for fuel cell application. In Proceedings of the 2018 Technologies for Smart-City Energy Security and Power (ICSESP), Bhubaneswar, India, 28–30 March 2018; pp. 1–5. [Google Scholar]
- Shaw, B.S. Comparison of SCA-Optimized PID and P&O-Based MPPT for an Off-grid Fuel Cell System. In Advances in Intelligent Systems and Computing; Springer Science and Business Media LLC.: Berlin, Germany, 2018; pp. 51–58. [Google Scholar]
- Azri, M.; Abu Khanipah, N.H.; Ibrahim, Z.; Rahim, N.A. Fuel Cell Emulator with MPPT Technique and Boost Converter. Int. J. Power Electron. Drive Syst. 2017, 8, 1852–1862. [Google Scholar] [CrossRef] [Green Version]
- Karthikeyan, V.; Das, P.V.; Blaabjerg, F. Implementation of MPPT Control in Fuel Cell Fed High Step up Ratio DC-DC Converter. In Proceedings of the 2018 2nd IEEE International Conference on Power Electronics, Intelligent Control and Energy Systems (ICPEICES), Delhi, India, 22–24 October 2018; pp. 689–693. [Google Scholar]
- Luta, D.N.; Raji, A. Comparing fuzzy rule-based MPPT techniques for fuel cell stack applications. Energy Procedia 2019, 156, 177–182. [Google Scholar] [CrossRef]
- Raj, A.; Lekhaj, P. An ANFIS Based MPPT Controller for Fuel Cell Powered Induction Motor Drive. In Proceedings of the 2018 International Conference on Smart Grid and Clean Energy Technologies (ICSGCE), Kuala Lumpur, Malaysia, 29 May–1 June 2018; pp. 201–205. [Google Scholar]
- Luta, D.N.; Raji, A. Fuzzy Rule-Based and Particle Swarm Optimisation MPPT Techniques for a Fuel Cell Stack. Energies 2019, 12, 936. [Google Scholar] [CrossRef] [Green Version]
- Kumar, S.; Shaw, B. Design of Off-grid Fuel Cell by Implementing ALO Optimized PID-Based MPPT Controller. In Advances in Intelligent Systems and Computing; Springer Science and Business Media LLC.: Berlin, Germany, 2018; pp. 83–93. [Google Scholar]
- Harrag, A.; Messalti, S. Variable Step Size IC MPPT Controller for PEMFC Power System Improving Static and Dynamic Performances. Fuel Cells 2017, 17, 816–824. [Google Scholar] [CrossRef]
- Reddy, K.J.; Sudhakar, N. ANFIS-MPPT control algorithm for a PEMFC system used in electric vehicle applications. Int. J. Hydrog. Energy 2019, 44, 15355–15369. [Google Scholar] [CrossRef]
- Wang, M.H.; Huang, M.-L.; Liou, K.-J.; Jiang, W.-J. Maximum power point tracking control method for proton exchange membrane fuel cell. IET Renew. Power Gener. 2016, 10, 908–915. [Google Scholar] [CrossRef]
- Zhong, Z.-D.; Huo, H.-B.; Zhu, X.-J.; Cao, G.-Y.; Ren, Y. Adaptive maximum power point tracking control of fuel cell power plants. J. Power Sources 2008, 176, 259–269. [Google Scholar] [CrossRef]
- Al-Baghdadi, M. Modelling of proton exchange membrane fuel cell performance based on semi-empirical equations. Renew. Energy 2005, 30, 1587–1599. [Google Scholar] [CrossRef]
- Saad, N.H.; El-Sattar, A.A.; Mansour, A.M. Adaptive neural controller for maximum power point tracking of ten parameter fuel cell model. J. Electr. Eng. 2013, 13, 233–239. [Google Scholar]
- Lee, J.; Lalk, T.; Appleby, A. Modeling electrochemical performance in large scale proton exchange membrane fuel cell stacks. J. Power Sources 1998, 70, 258–268. [Google Scholar] [CrossRef]
Figure 1.
(a) The FC power versus FC current curve under different temperatures with constant water content (λm = 12). (b) The FC voltage versus FC current curve under different temperatures with constant water content (λm = 12). (c) The FC power versus FC current curve under different water content with constant temperature (343 K). (d) The FC voltage versus FC current curve under different water content with constant temperature (343 K).


Figure 2.
Graph of FC power vs. FC current and its derivative.

Figure 3.
Matlab/Simulink model of the variable step-size incremental resistance (VSS-INR) method.

Figure 4.
Block diagram of the complete PEMFC system.

Figure 5.
The dynamic FC power curve under normal operation with different conditions using the VSS-INR method.
Figure 5.
The dynamic FC power curve under normal operation with different conditions using the VSS-INR method.

Figure 6.
Detailed performance of the FC system during normal operation (scenario 4) using the VSS-INR method.
Figure 6.
Detailed performance of the FC system during normal operation (scenario 4) using the VSS-INR method.

Figure 7.
The dynamic FC power curve under different scenarios using the VSS-INR method.

Figure 8.
Detailed performance of the FC system during scenario 9 using the VSS-INR method.


Table 1.
Summary of the reported approaches employed in designing a maximum power point tracker (MPPT) for fuel cells (FCs). P&O: perturb and observe; IC: incremental conductance; SSA: salp swarm algorithm; GWO: grey wolf optimizer; PSO: particle swarm optimization; ANN: artificial neural network; INR: incremental resistance; SCA: sine cosine algorithm; ANFIS: adaptive neuro-fuzzy inference system; ALO: antlion optimizer; SMC: slide mode control.
| Author | Year | Approach | Metaheuristic | Converter Type | Notes |
|---|---|---|---|---|---|
| Padmanaban et al. [1] | 2019 | Jaya | √ | Cuke | Excessive computational time |
| Mohamed et al. [2] | 2019 | (P&O) and (IC) | × | Boost | Multi-sensors are required |
| Fathy et al. [3] | 2020 | SSA | √ | Boost | Excessive computational time |
| Rana et al. [4] | 2019 | GWO | √ | Boost | Slow convergence and stuck in local optima |
| Derbeli et al. [5] | 2018 | Backstepping | × | Boost | Excessive effort in implantation |
| Derbeli et al. [6] | 2017 | Smart drive algorithm | × | Boost | lack in accuracy |
| Ahmadi et al. [7] | 2017 | PSO | √ | Boost | Easy to stuck in local optima |
| Harrag et al. [8] | 2017 | IC | × | Boost | Multi-sensors are required |
| Harrag et al. [9] | 2018 | Fuzzy logic approach | × | Boost | Fuzzy logic lacks in accuracy |
| Liu et al. [10] | 2017 | Extremum seeking control | × | NA | Slow convergence rate |
| Harrabi et al. [11] | 2018 | Fuzzy logic approach | × | Buck | Fuzzy logic lacks in accuracy |
| Priyadarshi et al. [13] | 2017 | Firefly algorithm | √ | Cuke | Stuck in local optima |
| Naseri et al. [14] | 2018 | P&O | × | Boost | P&O does not guarantee the global solution |
| Reddy et al. [15] | 2018 | ANN | × | Boost | ANN requires excessive data |
| Rezk [19] | 2016 | INR | × | Boost | Multi-sensors are required |
| Shaw et al. [21] | 2019 | SCA | √ | Boost | Complicated in implementation |
| Azri et al. [22] | 2017 | Constant voltage | × | Boost | Low efficiency |
| Karthikeyan et al. [23] | 2018 | P&O | × | High step ratio | P&O does not guarantee the global solution |
| Raj et al. [25] | 2018 | ANFIS | Boost | ANN requires excessive data | |
| Luta et al. [26] | 2019 | PSO | √ | Boost | Easy to stuck in local optima |
| Kumar et al. [27] | 2019 | ALO | √ | Boost | Excessive computational time |
| Harrag et al. [28] | 2017 | IC | × | Boost | Multi-sensors are required |
| Reddy et al. [29] | 2019 | ANFIS | × | Boost | ANN requires excessive data |
| Wang et al. [30] | 2016 | SMC | × | Boost | Design of filter circuit is difficult |
Table 2.
Parameters of the FC.
| Parameter | Value |
|---|---|
| T | 343 K |
| A | 232 cm2 |
| NFC | 35 |
| ξ1 | −0.944 |
| ξ2 | 0.00354 |
| ξ3 | 7.8 × 10⁻⁸ |
| ξ4 | −1.96 × 10⁻⁴ |
| Imax | 2.00 A cm−2 |
| l | 0.0178 cm |
| n | 2 |
| F | 96484600 C kmol−1 |
| R | 8.31447 (J (mol K)−1 |
| kr | 9.07 × 10⁻⁸ |
| KH2 | 4.22 × 10⁻⁵ (kmol (atm S)−1) |
| KO2 (kmol (atm S)−1) | 2.11 × 10⁻⁵ (kmol (atm S)−1) |
| qH2in | 10 × 10−5 (kmol S−1) |
| qO2in | 5 × 10⁻⁵ (kmol S−1) |
Table 3.
The details of considered scenarios and extracted power with different tracking methods.
| Scenario | Input Parameters | Theoretical Data | Extracted Power (W) | Efficiency (%) | |||||||||
|---|---|---|---|---|---|---|---|---|---|---|---|---|---|
| Water content | Temp. K | Power W | Voltage V | Current A | PSO | SM | P&O | VSS-INR | PSO | VSS-INR | |||
| Normal operation | 1 | 14 | 323 | 7297 | 23.09 | 316 | na | na | na | 7297 | na | 100.00 | |
| 2 | 14 | 343 | 8650.3 | 24.57 | 352 | 8511.5 | 8483.2 | 8440.7 | 8640 | 98.39 | 99.88 | ||
| 3 | 14 | 363 | 9984.2 | 25.72 | 388 | na | na | na | 9984.08 | na | 99.99 | ||
| 4 | 12 | 363 | 8785 | 25.61 | 343 | na | na | na | 8785 | na | 100.00 | ||
| 5 | 16 | 323 | 8171.6 | 23.215 | 352 | na | na | na | 8171.6 | na | 100.00 | ||
| Temperature variation | 6 | S1 | 14 | 323 | 7297 | 23.09 | 316 | 7202.5 | 7174.6 | 7135.6 | 7292 | 98.70 | 99.93 |
| S2 | 14 | 363 | 9984.2 | 25.72 | 388 | 9689.5 | 9666.0 | 9612.9 | 9980 | 97.05 | 99.96 | ||
| S3 | 14 | 323 | 7297 | 23.09 | 316 | 7128.9 | 7106.1 | 7059.9 | 7292 | 97.69 | 99.93 | ||
| Water content variation | 7 | S1 | 12 | 343 | 7582.4 | 24.86 | 305 | 7482.8 | 7456.1 | 7405.5 | 7575 | 98.69 | 99.90 |
| S2 | 16 | 343 | 9647.1 | 24.30 | 397 | 9363.5 | 9339.1 | 9293.3 | 9640 | 97.06 | 99.93 | ||
| S3 | 12 | 343 | 7582.4 | 24.86 | 305 | 7407.7 | 7384.8 | 7328.9 | 7570 | 97.39 | 99.84 | ||
| 8 | S1 | 12 | 323 | 6375.9 | 23.53 | 271 | na | na | na | 6374 | na | 99.970 | |
| S2 | 16 | 323 | 8171.6 | 23.22 | 352 | na | na | na | 8169 | na | 99.968 | ||
| S3 | 12 | 323 | 6375.9 | 23.53 | 271 | na | na | na | 6374 | na | 99.970 | ||
| Both Water content & Temp. variation | 9 | S1 | 16 | 323 | 8171.6 | 23.22 | 352 | 8047.3 | 8018.2 | 7984.6 | 8170 | 98.48 | 99.980 |
| S2 | 12 | 363 | 8785 | 25.61 | 343 | 8580.4 | 8556.5 | 8501.4 | 8785 | 97.67 | 100.00 | ||
| S3 | 16 | 323 | 8171.6 | 23.22 | 352 | 7947.2 | 7923.8 | 7882.1 | 8170 | 97.25 | 99.980 | ||
© 2020 by the authors. Licensee MDPI, Basel, Switzerland. This article is an open access article distributed under the terms and conditions of the Creative Commons Attribution (CC BY) license (http://creativecommons.org/licenses/by/4.0/).
Share and Cite
MDPI and ACS Style
Rezk, H.; Fathy, A. Performance Improvement of PEM Fuel Cell Using Variable Step-Size Incremental Resistance MPPT Technique. Sustainability 2020, 12, 5601. https://0-doi-org.brum.beds.ac.uk/10.3390/su12145601
AMA Style
Rezk H, Fathy A. Performance Improvement of PEM Fuel Cell Using Variable Step-Size Incremental Resistance MPPT Technique. Sustainability. 2020; 12(14):5601. https://0-doi-org.brum.beds.ac.uk/10.3390/su12145601
Chicago/Turabian StyleRezk, Hegazy, and Ahmed Fathy. 2020. "Performance Improvement of PEM Fuel Cell Using Variable Step-Size Incremental Resistance MPPT Technique" Sustainability 12, no. 14: 5601. https://0-doi-org.brum.beds.ac.uk/10.3390/su12145601
Note that from the first issue of 2016, this journal uses article numbers instead of page numbers. See further details here.