1. Introduction
Supply chains involve a plethora of actors and operators, such as manufacturers, suppliers, distributors, retailers and customers. The distribution of freight in the supply chain is a key operation that faces various challenges [
1]. One of the most critical challenges that supply chain distribution faces today is the efficient and effective scheduling of deliveries and routing of vehicles. This challenge creates a complex problem in which multiple criteria and limitations must be taken into account at the same time while trying to meet the requirements of each client. In urban areas, both the demand and the challenges faced by the supply chain distributors, i.e., logistics companies, are even more intense, and the use of information systems tends to become a necessity for the scheduling of deliveries and the routing of vehicles.
In addition, over the years, the population of urban areas has been gradually increasing and, consequently, so has the need for Urban Freight Transportation (UFT). UFT represents the last stage (the last mile) in modern supply chain distribution, where the effective and sustainable routing and scheduling of vehicles becomes a necessity. Unfortunately, this situation is continuously deteriorating despite efforts to address it. The steady increase in urbanization, and especially the ever-increasing need to supply these urban areas, has caused the rise of pollution, transportation costs and the risk of traffic accidents [
2]. All these factors tend to create an unsustainable supply chain distribution network where demand cannot be covered without the aid of advanced Information Technology (IT) systems.
In the past, the entire process of scheduling and routing vehicles for urban freight transportation was challenging to carry out because the execution was based almost exclusively on the use of maps of the urban area, and on the empirical knowledge of the person in charge. Today, with the use of information systems, the process has become more accessible by utilizing advanced software and algorithms. However, challenges continue to arise, mainly due to the ever-growing volume of information that needs to be managed. Building such an information system is not an easy task, and involves a significant amount of research for the needs and the challenges of supply chain distribution companies. These companies’ experiences need to be the basis upon which every developer relies in order to be able to build an effective and efficient information system [
3].
In an effort to support supply chain operations, an advanced delivery scheduling and vehicle routing system that supports the needs for supply chain distribution is being developed as part of a research project, co-financed by the European Union, through the collaboration of the Industrial Engineering Laboratory of the National Technical University of Athens (IEL NTUA) with a software development company and a logistics company. The connection of the present work with this specific project results from the fact that a software tool will be selected for the creation of a reference model that will be used to determine the functional requirements and the specifications of the information system.
The creation of the reference model can be achieved by utilizing business process management methodologies and techniques. Business process management is a management approach which aims to analyze, measure and continuously improve processes [
4]. Business Process Modeling (BPM) is a part of business process management that focuses on the representation of business processes in a structured way, using BPM tools in order to carry out its mission [
5]. Modeling processes helps us to understand the structure and operation of businesses, and can be very useful for determining an information system’s requirements, which will be used to support their needs. The decision to use an information system by a company also stems from its need to address business problems. These problems may be related to the individual operations of the company or a combination of them. Success for an information system depends directly on the extent to which its implementation helps the company meet critical goals, such as improving its services, and reducing its costs and idle operation times.
Developing such an information system is a complex process consisting of multiple phases. In order to create an effective information system, in the first phase, the development team needs to identify the problems the system needs to solve. The more clarity and detail achieved in this phase, the more effectively the goals and purpose of the system will be determined. Furthermore, critical questions concerning the development of the system need to be answered, such as how much time will be required, what the cost is, how companies will benefit from its use, if the appropriate infrastructure and know-how exist, how the transition to the system will be made, and how the critical parameters (profit, expenses) will be affected [
6].
The results of this phase are then used in the system’s design phase to create functional requirements and technical specifications. Later in the planning phase, the specifications are converted into program code, while in the test phase, the system is put into trial operation through appropriate control scenarios. Eventually, after completing the tests, the system will start to work. Of course, over time, it is possible to find needs for changes, additions and improvements so that the system is improved. Additionally, during its operation, the system may require maintenance in order to remain efficient.
In most cases, the development of an information system involves many other parties, such as business executives, users and consultants, who all need to support and cooperate with the development team. This cooperation is necessary in order to understand the needs of businesses and the way the system will support them. Practical experience shows that mistakes are often made due to poor communication between these parties and developers, leading to incomplete coverage of business needs by the developed information system. This happens mainly due to the inability of the development team to understand the needs of the companies that will use the system to support their operations. If the system’s needs and functionality are not understood by all parties involved, the system requirements will not be properly identified and the project will eventually fail.
Therefore, the development of a reference model for the system’s functionality before the development phase can prove to be a time saving move. This paper presents the methodology followed for the selection of the business process modeling tool in order to develop a process reference model of a supply chain distribution system. The methodology is based on the multi-criteria decision-making theory, utilizing a combination of the Preference Ranking Organization Method for Enrichment Evaluations (PROMETHEE) I method for the decision-making with the Analytic Hierarchy Process (AHP) method, for calculating the weights of the evaluation criteria. The methodological steps are thoroughly discussed in
Section 3, and the results of the research are presented extensively in
Section 3.8,
Section 3.9 and
Section 4.
The reference model will help bridge this communication and understanding gap between the software company, which develops the freight transportation system, and the logistics companies, in which the system could be implemented to support their operations. The reference model will eventually demonstrate the key processes of logistics companies, related to product distribution, indicating how the delivery scheduling and vehicle routing system needs to be implemented to serve their needs effectively. The reference model will also represent different perspectives on logistics companies’ operations, depicting processes, data, systems and organizational structures, aiming to create a guide or a ‘reference point’ for understanding the functionality of the freight transportation system.
Multi-criteria decision-making (MCDM) has grown as a part of operations research (OR) concerned with designing computational and mathematical tools for supporting the subjective evaluation of performance criteria by decision-makers [
7]. Moreover, MCDA is considered to be a new OR approach towards complex problems, aiming at integrating traditional objective approaches with subjective judgments and preferences. It should be noted, therefore, that MCDA can be merged with other traditional OR approaches, thus exceeding their strictly objective limits [
8]. This combination of approaches for evaluating alternative solutions in order to find the most suitable can lead to more effective mathematical models and operational research algorithms related to the supply chain distribution problem [
9,
10].
Finally, we believe that our study will present a new path for more effective and sustainable supply chain distribution operations with greater utilization of vehicles, fewer undelivered orders, and less unnecessary travel and traveled distance. Additionally, our analysis can also be useful for other supply chain operations [
11]. The Multi-Criteria Decision Analysis (MCDA) that is carried out in this paper can be extended with minimal transformations in order to evaluate any software tool that supports the supply chain. Additionally, the tools that are evaluated in this study can be used to model, analyze, improve and automate other operations of the supply chain, such as procurement, sales, manufacturing and warehouse management. All these benefits arising from our work could lead to more sustainable supply chains with greater efficiency and lower wasted efforts, risks, execution times, costs and errors [
12].
3. Application of the Multi-Criteria Approach
This section aims to present the methodology of selecting a suitable tool for the development of the reference model for the implementation of the distribution system in companies operating in the supply chain. The evaluation of software tools and the selection of the most appropriate one for the design and implementation of the reference model was carried out by applying a multi-criteria decision-making process.
3.1. Methodology
Decision making is the process of selecting a specific alternative from a set of solutions in a systematic and logical way, based on the values and references of the participants in the decision-making [
45]. Alternatively, decision-making can be defined as the process of adequately reducing uncertainty and doubt about alternatives in order to allow a reasonable choice between them [
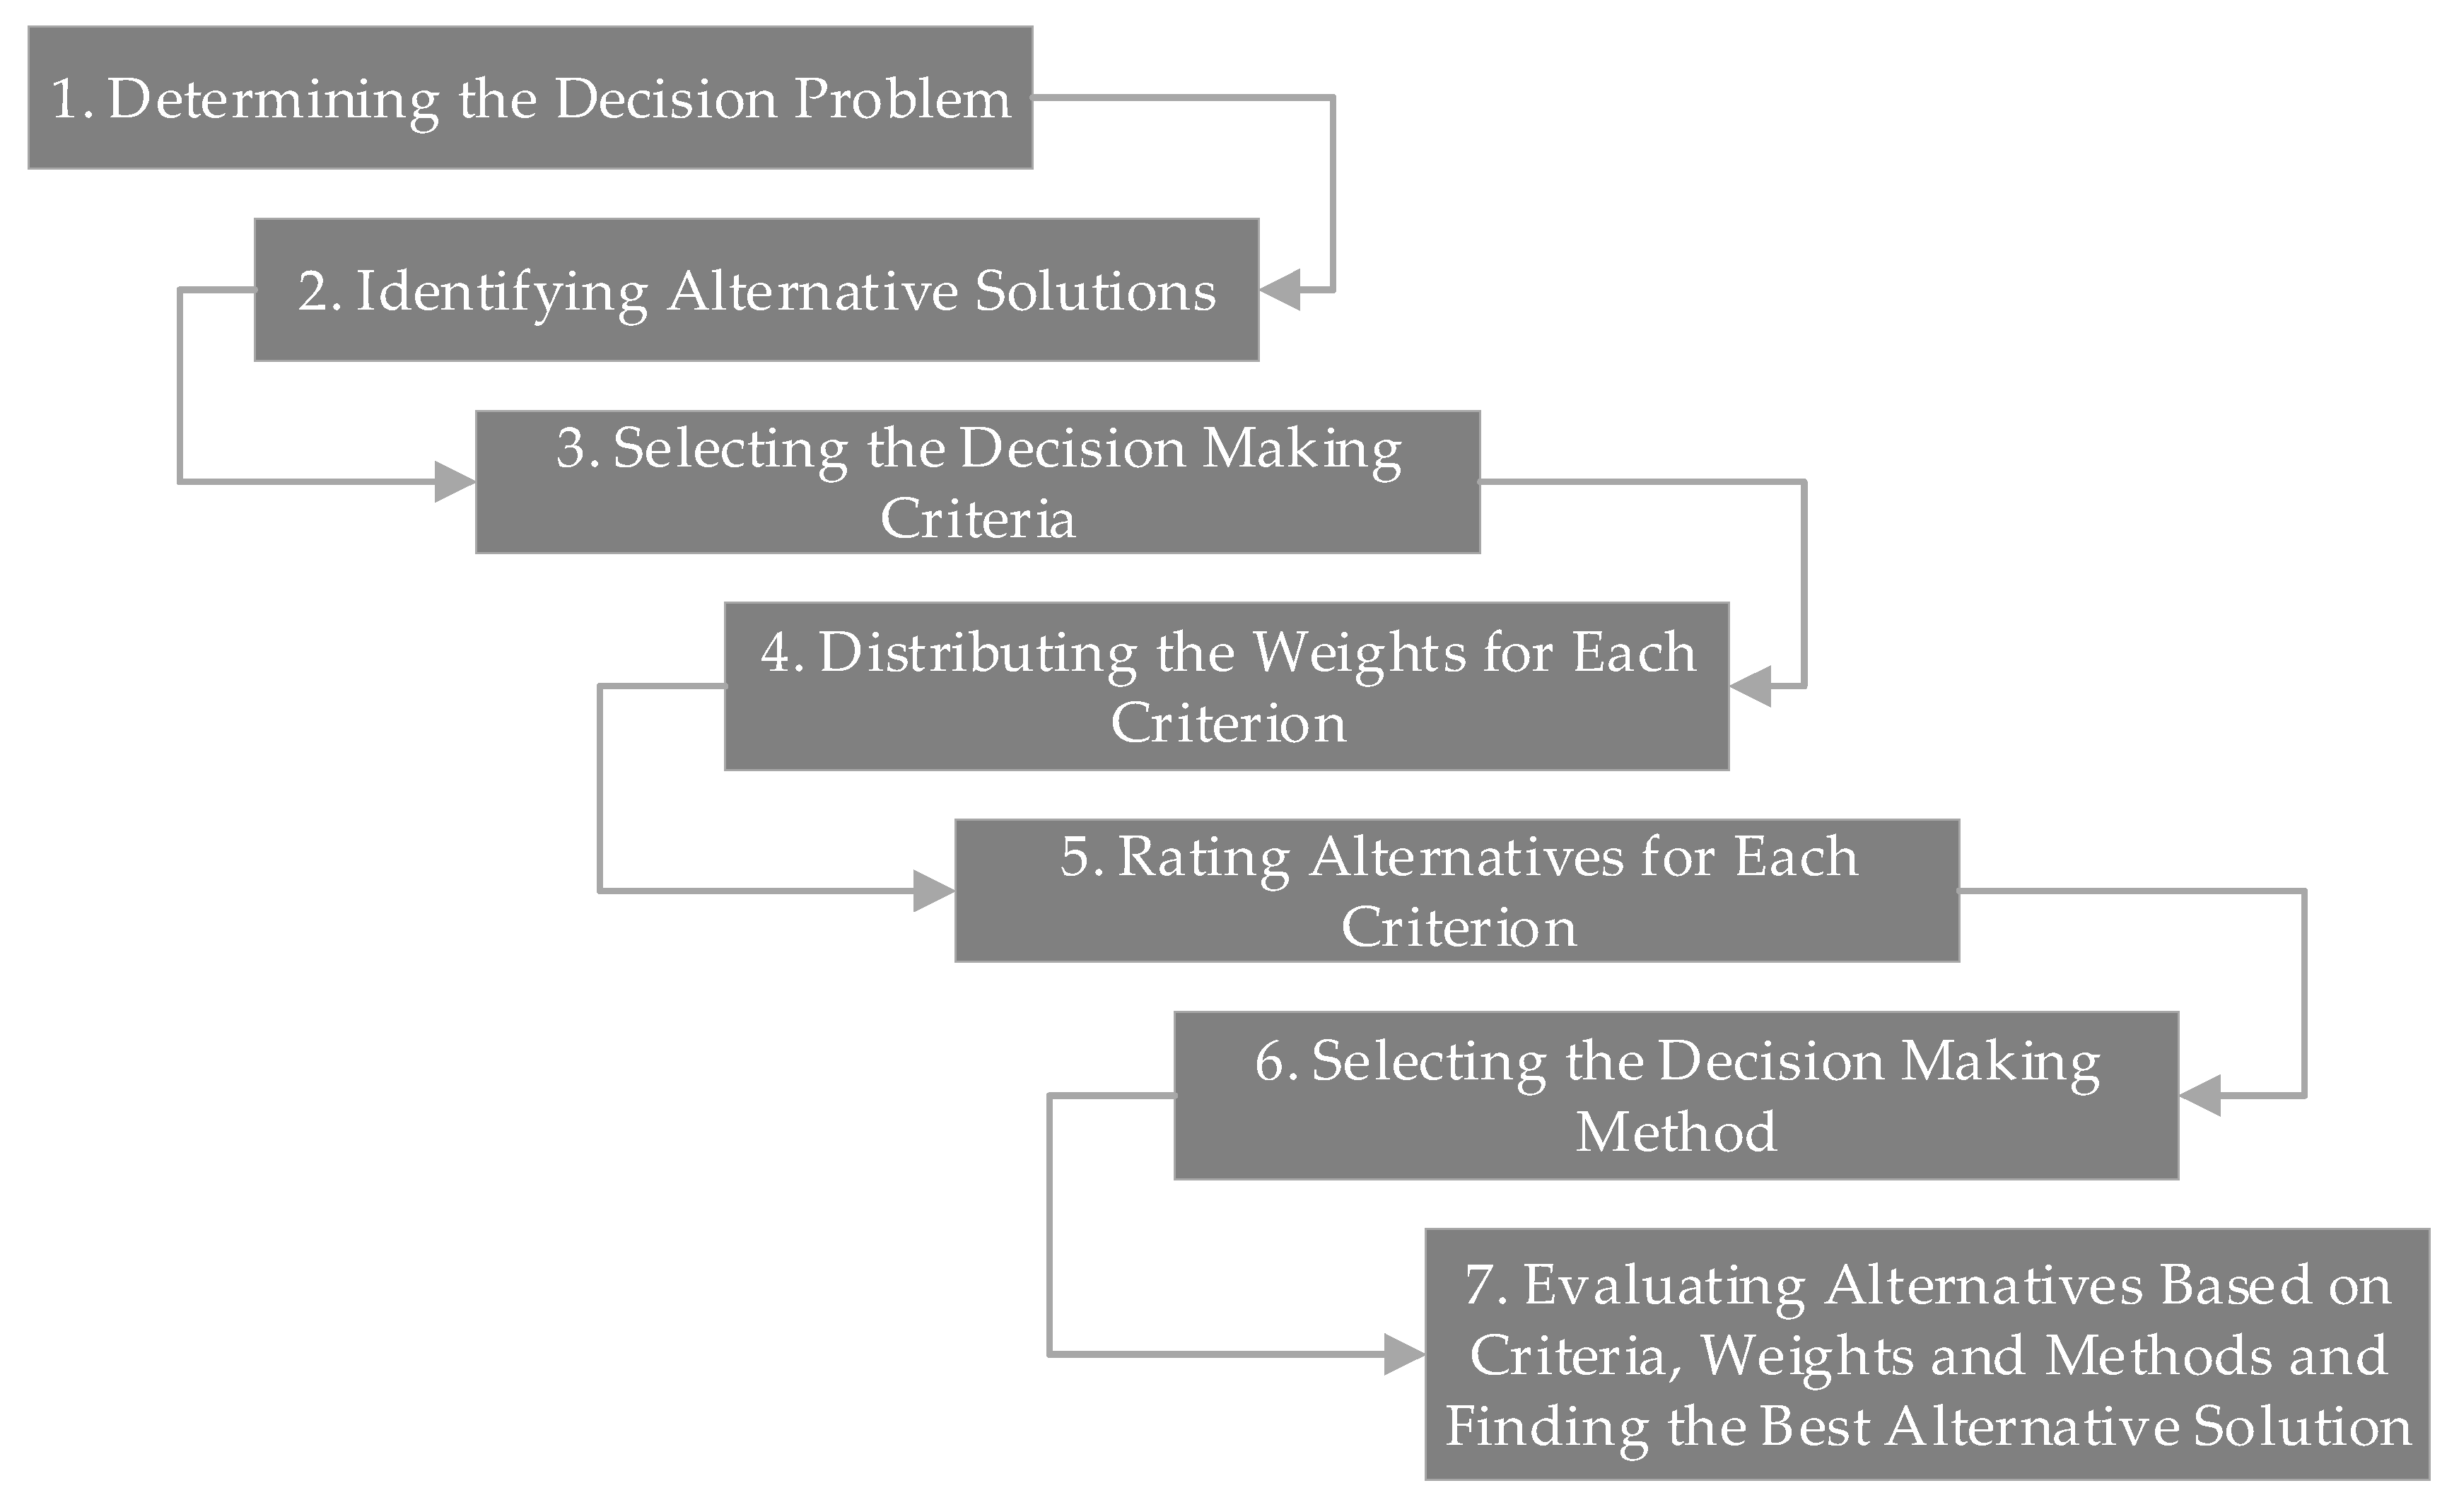
46]. The methodology involved in this specific decision-making process includes the following steps, as shown in
Figure 1, and is influenced by the work of Fülöp [
45]:
Determining the decision problem: decision-makers must be fully aware of the problem of the decision. It is essential that they identify, understand and define the problem before making a decision. This process must be able to identify the root causes, carefully limiting the cases. Problematic categories relate to selection, classification, classification and description.
Identifying alternative solutions: an important part of the decision-making process involves analyzing a finite set of alternatives. This step is performed in parallel with the criterion determination as the two steps determine, to some extent, each other. It is crucial that the choice of alternatives is made with special care, taking care to select only solutions that can be compared with each other.
Selecting the decision-making criteria: the determination of the criteria to be used to make the decision between alternative solutions must be based on objectives. A decision problem that contains a large number of criteria is particularly useful for delivering better alternatives. An ideal set of criteria should be functional, understandable, and should not overlap.
Distributing the weights for each criterion: the weights in the criteria need to be determined after an extended analysis of the problem in order to reflect the importance of the decision-making parameters accurately. Various methods (AHP, SIMOS, ROC, etc.) can be used to facilitate weight distribution.
Rating alternatives for each criterion: before starting to solve the problem, each alternative needs to be graded for each decision-making criterion. Each criterion can have its own rating scale, which can be based on both quantitative and qualitative data. Upon the completion of the grading, a table is created that will be used to solve the problem.
Selecting the decision-making method: based on the inputs from the weights of the criteria and the rating of the alternatives for each criterion, specific methods can be selected and applied that will facilitate the decision making.
Evaluating alternatives based on criteria, weights and methods, and finding the best alternative solution: starting the solution, the appropriate method is applied in order to evaluate the alternatives and to allow the choice of the optimal solution. Finally, if possible, in the last step of the process, the optimal alternative is determined and the goal of the process is achieved.
3.2. Problem Formulation (Step 1)
The decision-making problem concerns the selection of an appropriate tool for the development of the reference model for the implementation of an information system to be used by supply chain distribution companies to facilitate the routing of vehicles and scheduling of deliveries. This problem belongs to the category that is known as ‘selection problems’. To solve this problem, alternative software tools need to be compared with each other, according to the determined criteria, in order to finally find the one that best meets the requirements of the decision-making team.
The entities involved in conducting the multi-criteria decision analysis were the following:
The analysts in the decision-making process were members of the project belonging to the staff of IEL-NTUA (Industrial Engineering Laboratory of School of Mechanical Engineering of the National Technical University of Athens).
The mediator was the scientific director and coordinator of the project, a professor of NTUA, who undertook the communication between the parties involved in the project.
The final decision was carried out by the two companies’ members of the project, namely the software development company who will use the tool to create the reference model and the logistics company, since the system will be used initially, in a pilot context, by that specific company.
All companies in the logistics industry are potential persons of interest, based on the fact that the reference model that will be built based on the tool that will be selected will show how they could use the developed freight transportation system to support their activities.
3.3. Alternative Tools (Step 2)
The alternative tools selected to be evaluated are among the most popular enterprise modeling tools available on the market. In addition, in the judgment of the team of experts, these are the tools that are best suited to solve the formulated problem, as other available tools did not pass the pre-evaluation phase (see
Table 1). The list of the tools that were selected for evaluation is presented in
Table 2. Each of the chosen tools was briefly described in
Section 2 of this paper.
3.4. Evaluation Criteria (Step 3)
The selection of the criteria according to which the appropriate tool will be selected for the construction of the reference model was a rather complex process. In order to conduct the MCDA, an evaluation team was set up, consisting of researchers and faculty members of the IEL-NTUA who have gained significant experience with the specific subject. The director of the logistics company also assisted the team, analyzing the needs, goals and limitations of the company.
Both qualitative and quantitative evaluation criteria were selected, adhering to the basic principles of multi-criteria decision analysis (monotony, adequacy and non-redundancy). Finally, six evaluation criteria were determined, some of which consist of a number of sub-criteria.
3.4.1. Cost
Business process management tools usually work in a cloud environment. This means that users can access them remotely, from wherever they are, while not incurring costs related to installing and maintaining the software. When a company buys such tools, the cost is essentially just the licensing of their use, which depends on the number of licenses that it buys. The cost of acquisition of each alternative tool is based on information found on the tool’s websites and on the web. The unit of measurement is €/user/month, and all costs were normalized to meet the same usage sizes. As the cost of a software tool increases, the possibility to select that tool is reduced.
3.4.2. Modeling Capabilities
Business process modeling is a technique of representing a series of related steps/processes that compose a process; it is the core of business process management tools. Simply put, the more efficient a process is, the less it will cost to complete; therefore, it will lead to reduced business costs. Thus, Business Process Management intends to optimize efficiency in the execution of business processes and activities related to the production of products and services. It includes features associated with the design of processes and other entities involved in business processes, which are then analyzed, studied, executed, checked and corrected repeatedly.
The main goal when doing all these tasks is to improve the performance of processes, determine the possibilities for interconnection with external objects, and perform compliance checks with predefined standards. The scores of the alternatives result from the sum of the individual scores they received for the modeling capabilities they cover, as shown in
Table 3. The unit of measurement is a pure number, and the larger this number is, the better the choice of the specific alternative tool becomes.
3.4.3. Tool Utilization in Related Studies
This criterion examines whether each of the alternative modeling tools:
has been manufactured for use by companies for software development or supply chain operations;
has such companies as customers on its website;
has, according to the literature, been used for a similar purpose as the one in the present study.
A qualitative evaluation scale will be used to evaluate the alternative tools in this criterion, as shown in
Table 4, but the data on which the evaluation will be based are both qualitative and quantitative. The unit of measurement is a pure number; the larger this number is, the better the choice of this alternative tool becomes.
3.4.4. Familiarization of the Team with the Tool
Familiarizing the team with each alternative tool is a factor worth exploring. The team, given its experience, was able, in a short period of time, to sufficiently understand the functionality of each tool. However, by choosing a tool that they are very familiar with, they will be able to implement it in the shortest possible time, avoiding errors and constantly looking for ways to solve them. This criterion is qualitative, and is based entirely on the judgment of analysts. To evaluate the alternatives in this criterion, a qualitative evaluation scale was used, as shown in
Table 5. The unit of measurement is a pure number; the larger this number, the better the choice of this alternative tool becomes.
3.4.5. Ease of Learning by End Users
This criterion is qualitative; it stems from the experience of analysts. It is advisable to choose a tool that, in addition to modeling capabilities, can also be used in practice by end-users. The possible choice of a difficult to use tool may eventually cancel the whole effort. This criterion considers the following:
the ease of learning the tool;
the ease of retaining the knowledge of its use;
the time required to complete specific actions successfully;
the amount of work that can be performed in a predetermined time slot;
the number of attempts required (without assistance) for the successful execution of tasks;
the display system alerts for possible errors;
the perception of errors;
the time required to troubleshoot/eliminate errors;
help through the helper of the tool;
help with tool user manuals;
the number of alternatives that can lead to the same result.
The rating of each alternative results from a qualitative evaluation of the alternative tools by the analysts; the scale used is presented in
Table 6. The unit of measurement is a pure number; the larger this number, the better the choice of this alternative tool becomes.
3.4.6. Reporting Capabilities
In addition to the modeling capabilities of the tools under study, it is advisable to explore the reporting capabilities they offer. Each tool offers a variety of ways to select, filter, sort and group data for real-time decision-making. The report formats range from illustrations of simple static diagrams to complex reports with in-depth analyses and business predictions. Many BPM tools have, in addition to simple statistical analyzes, predefined reports and the ability to modify them by creating complex reports.
The reporting capabilities of the tools play a key role in selecting the best alternative from the MCDA, as they are needed to export the system’s requirements, which will be the final outcome from the reference model. In addition, during the implementation phase, these capabilities will enable the connection of the process steps with all of the involved organizational units and enterprise systems.
The scores of the alternatives result from the sum of the individual scores they receive for the reporting capabilities they cover, as shown in
Table 7. The unit of measurement is a pure number; the larger this number is, the better the choice of the specific alternative becomes.
3.5. Weights of Criteria (Step 4)
To determine the weights of the criteria, the group of analysts used the Analytic Hierarchy Process (AHP) method. AHP was proposed by Saaty in the 80s [
37], and is one of the most widely used multi-criteria decision making methods. This method is a hybrid of MAUT and bilateral comparisons. This method works by converting human subjective assessments into total alternative grades or weights.
AHP first makes bilateral comparisons between two criteria, Ci and Cj, evaluating the importance of one over the other. Comparisons of this type are mainly used to determine the weight of criteria. However, the AHP method can also use these comparisons to find the optimal alternative between a series of solutions. The decision-maker needs to compare the criteria in pairs in order to determine the relative importance of each criterion, using a predefined nine-point scale that shows the relative importance of one criterion over another, and the result of each comparison may be one of the following:
1 = equal importance or preference;
3 = moderate importance or preference for each other;
5 = strong or substantial importance or preference;
7 = very strong or proven importance or preference;
9 = excellent importance or preference;
2, 4, 6, 8 = intermediate prices.
Let Cij be the value that results from comparing the Ci and Cj criteria. The person in charge of decision making is always considered consistent in making judgments for any pair of criteria, i.e., Cij * Cji = 1. Additionally, as understood, a criterion will always be equal to itself, i.e., Cii = 1.
As a result, we will have evaluations for n criteria in order to obtain the required information to determine their weights. Cij comparisons for i, j = 1, n can be ordered with a square table of size Cnn. Once Table C of the bilateral comparisons has been constructed, it needs to be normalized by dividing each Cij cell by the sum of the elements of the column to which it belongs.
Another column can also be calculated, i.e., that of the weights that result from the average of the elements of each line, representing the total score of each criterion. For each criterion, the measure of the consistency value (CV) is calculated, while the total consistency index is also determined. The aim is for the consistency values to have values approximately equal to the number of criteria, and for the total consistency ratio (CR) to be under 0.1 [
45].
Both the experience of the analysts and the needs of the two companies that will make use of the tool played an important role for the bilateral comparisons of the criteria. The following are the results of the AHP method for this problem.
Table 8 presents the calculated weights of the criteria, as well as each one’s CV.
Finally,
Table 9 calculates the other indicators of the method. More specifically:
λ is calculated as the average of the consistency values;
n is the number of criteria;
the CI (Consistency Index) is calculated by the formula ;
the RI (Random Index) is obtained depending on the value of n;
The CR is derived from the CI/RI type; since it has a value below 0.1, it can be concluded that there is a strong consistency between the results.
3.6. Rating of Alternatives for Each of the Criteria (Step 5)
The following are the ratings of the alternatives for each criterion, as presented in
Table 10. For their calculation, both information collected from the tool websites and the bibliography, and the experience of the analysts were used.
3.7. Selection of the Decision-Making Method (Step 6)
As already mentioned, this study concerns a selection problem. In order to find the best suitable solution, the team decided to apply the PROMETHEE I (Preference Ranking Organization METHod for Enrichment Evaluation) method, which ranked the various tools in order to finally select the one that better meets the requirements of the MCDA. As a family of methods, PROMETHEE was first introduced in 1986 by J.-P. Brans, P. Vincke, and B. Mareschal, and has since been widely used in various fields [
47].
Utilizing PROMETHEE I in an MCDA enables decision-makers to both fully and partially sort alternatives; as a decision-making method, it is generally effective when dealing with complex problems, especially those that have multiple criteria including various parties involved in the judgment. In addition, as a method, it is one of the most user-friendly and easy to understand, and has also been used with great success in a number of real-world problems [
45].
The PROMETHEE I method is based on the outranking theory by making bilateral comparisons between the various alternatives, and giving as a final result a ranking of the alternatives. This method expands the meaning of the criteria by offering the decision-maker a library with predefined criteria functions and enabling him to achieve a greater level of configuration than other methods.
In the PROMETHEE I method, only the agreement is checked, thus presenting less complexity than other methods, such as ELimination Et Choix Traduisant la REalité (ELECTRE) 1, that check both agreement and disagreement. The bilateral comparisons lead to the calculation of the input and output flows. These in turn lead to the net flow of each alternative, which is the measure of evaluation for the ranking of the alternatives.
3.8. Rating Alternatives for Each of the Criteria & Determining the Best Solution (Step 7)
In all the criteria related to quality evaluation, the evaluation was selected according to the linear preference criterion. The preference threshold chosen was such as that it reflected the difference in the scores appropriately. More specifically, according to this criterion, if one alternative excels by one unit relative to another, it is considered to be relatively superior, and receives 0.5 points in the superiority table, while for 2 points of difference and above it is considered to be clearly superior, and receives 1 point.
According to the linear preference criterion, if the scoring superiority of alternative i over alternative j is less than or equal to a pk preference threshold, then the preference hk value of i from j is given by the equation hk = , while if is greater than pk, it then takes the value 1.
In the remaining quantitative criteria, a criterion of a linear preference and indifference area was selected, due to its ability to effectively represent the transition from 0 to 1, estimating appropriate values for the indifference (q) and preference (p) thresholds, resulting from the experience of analysts and their familiarity with the subject.
According to the criterion of linear preference and the area of indifference, if the scoring superiority of alternative i versus alternative j is less than or equal to a threshold of indifference q
k, then the degree of preference h
k of i from j takes the value 0. Respectively, if its scoring superiority alternative i versus alternative j is higher than a preference threshold p
k, then the degree of preference h
k of i from j takes the value 1. Finally, for space difference (q
k, p
k], the degree of preference h
k is given by the equation h
k =
.
Table 11 summarizes the data needed to solve the problem.
Having completed the two-dimensional comparisons of each individual criterion, we then present the results of the PROMETHEE method (see
Table 12). More specifically, this table contains the values
=
, with
. resulting from the corresponding values of the two-dimensional comparisons for each of the criteria. Then, the input flow φ
−(x
i) =
the output flow φ
+(x
i) =
and the net flow φ(x
i) = φ
+(x
i) − φ
−(x
i) are calculated.
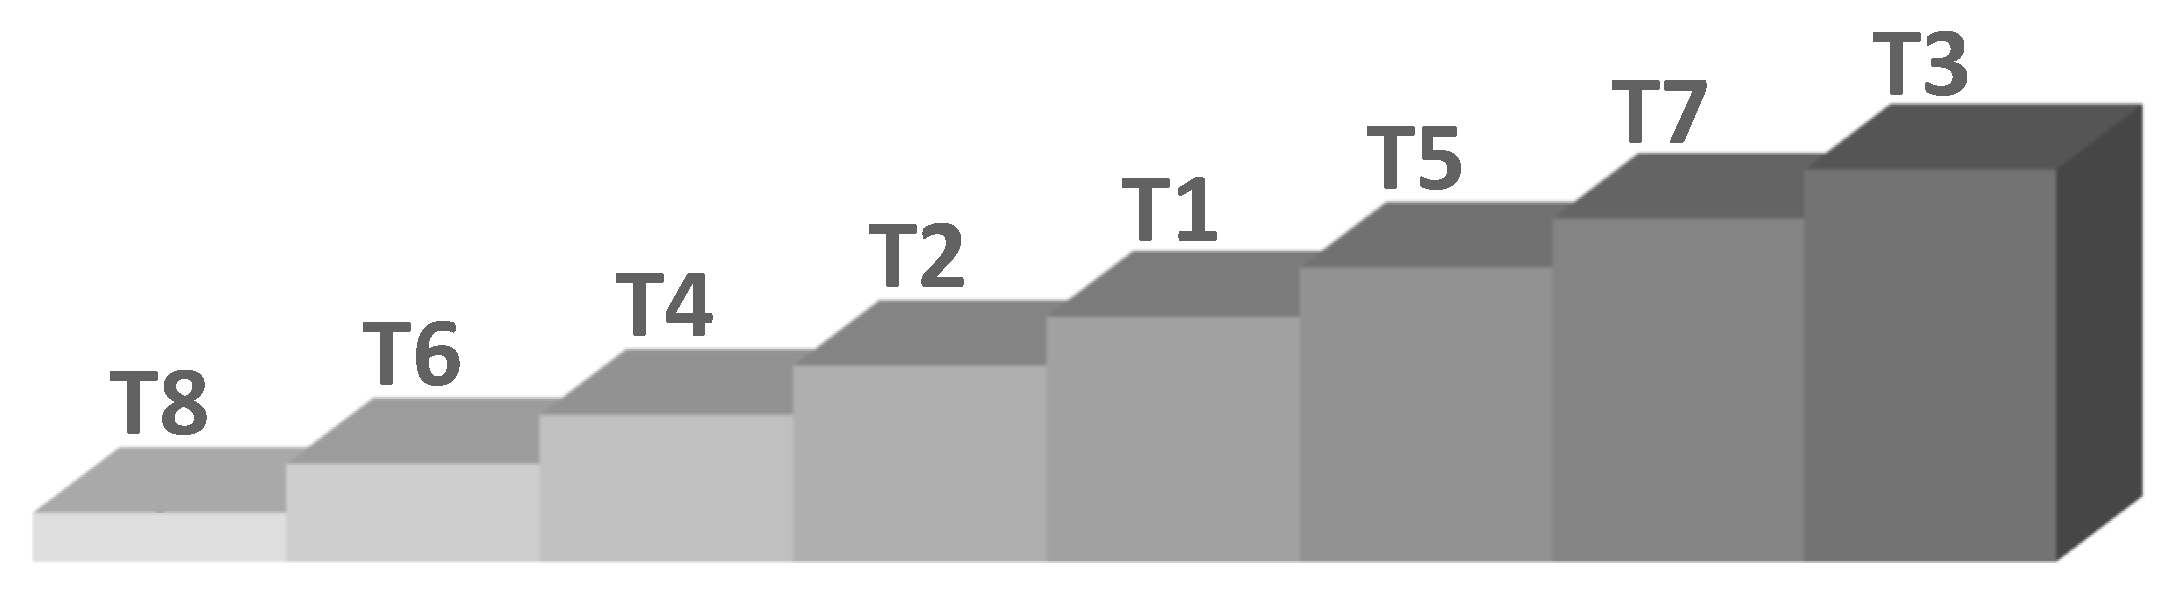
According to the results of the method shown in
Table 11, the order of the classification of the alternative tools is shown in
Figure 2.
3.9. Sensitivity Analysis
In order to find whether the results of this application of MCDA are robust, the team decided to undertake a sensitivity analysis. The sensitivity analysis presents the changes in the rankings of the alternative tools based on the modifications of the weights of the criteria.
Therefore, 10 different scenarios were executed, each of which presented different criteria weight distributions. All these scenarios are demonstrated in
Table 13. Scenario 0 includes the initial weights as provided by the AHP method. The other 10 scenarios have modified criteria weights compared to S0, aiming to identify whether S0′s results are robust by illustrating different use-cases of weight determination.
Effort was made to present a set of significantly different scenarios aiming at avoiding repetitions of similar problem situations and repetitive patterns. Additionally, in most cases, the team tried to lower the weights of those criteria where the initially selected tool presents favorable results and increase the others. This was to ensure that the original S0 didn’t lead to circumstantial results due to the potentially higher or lower weights of the criteria.
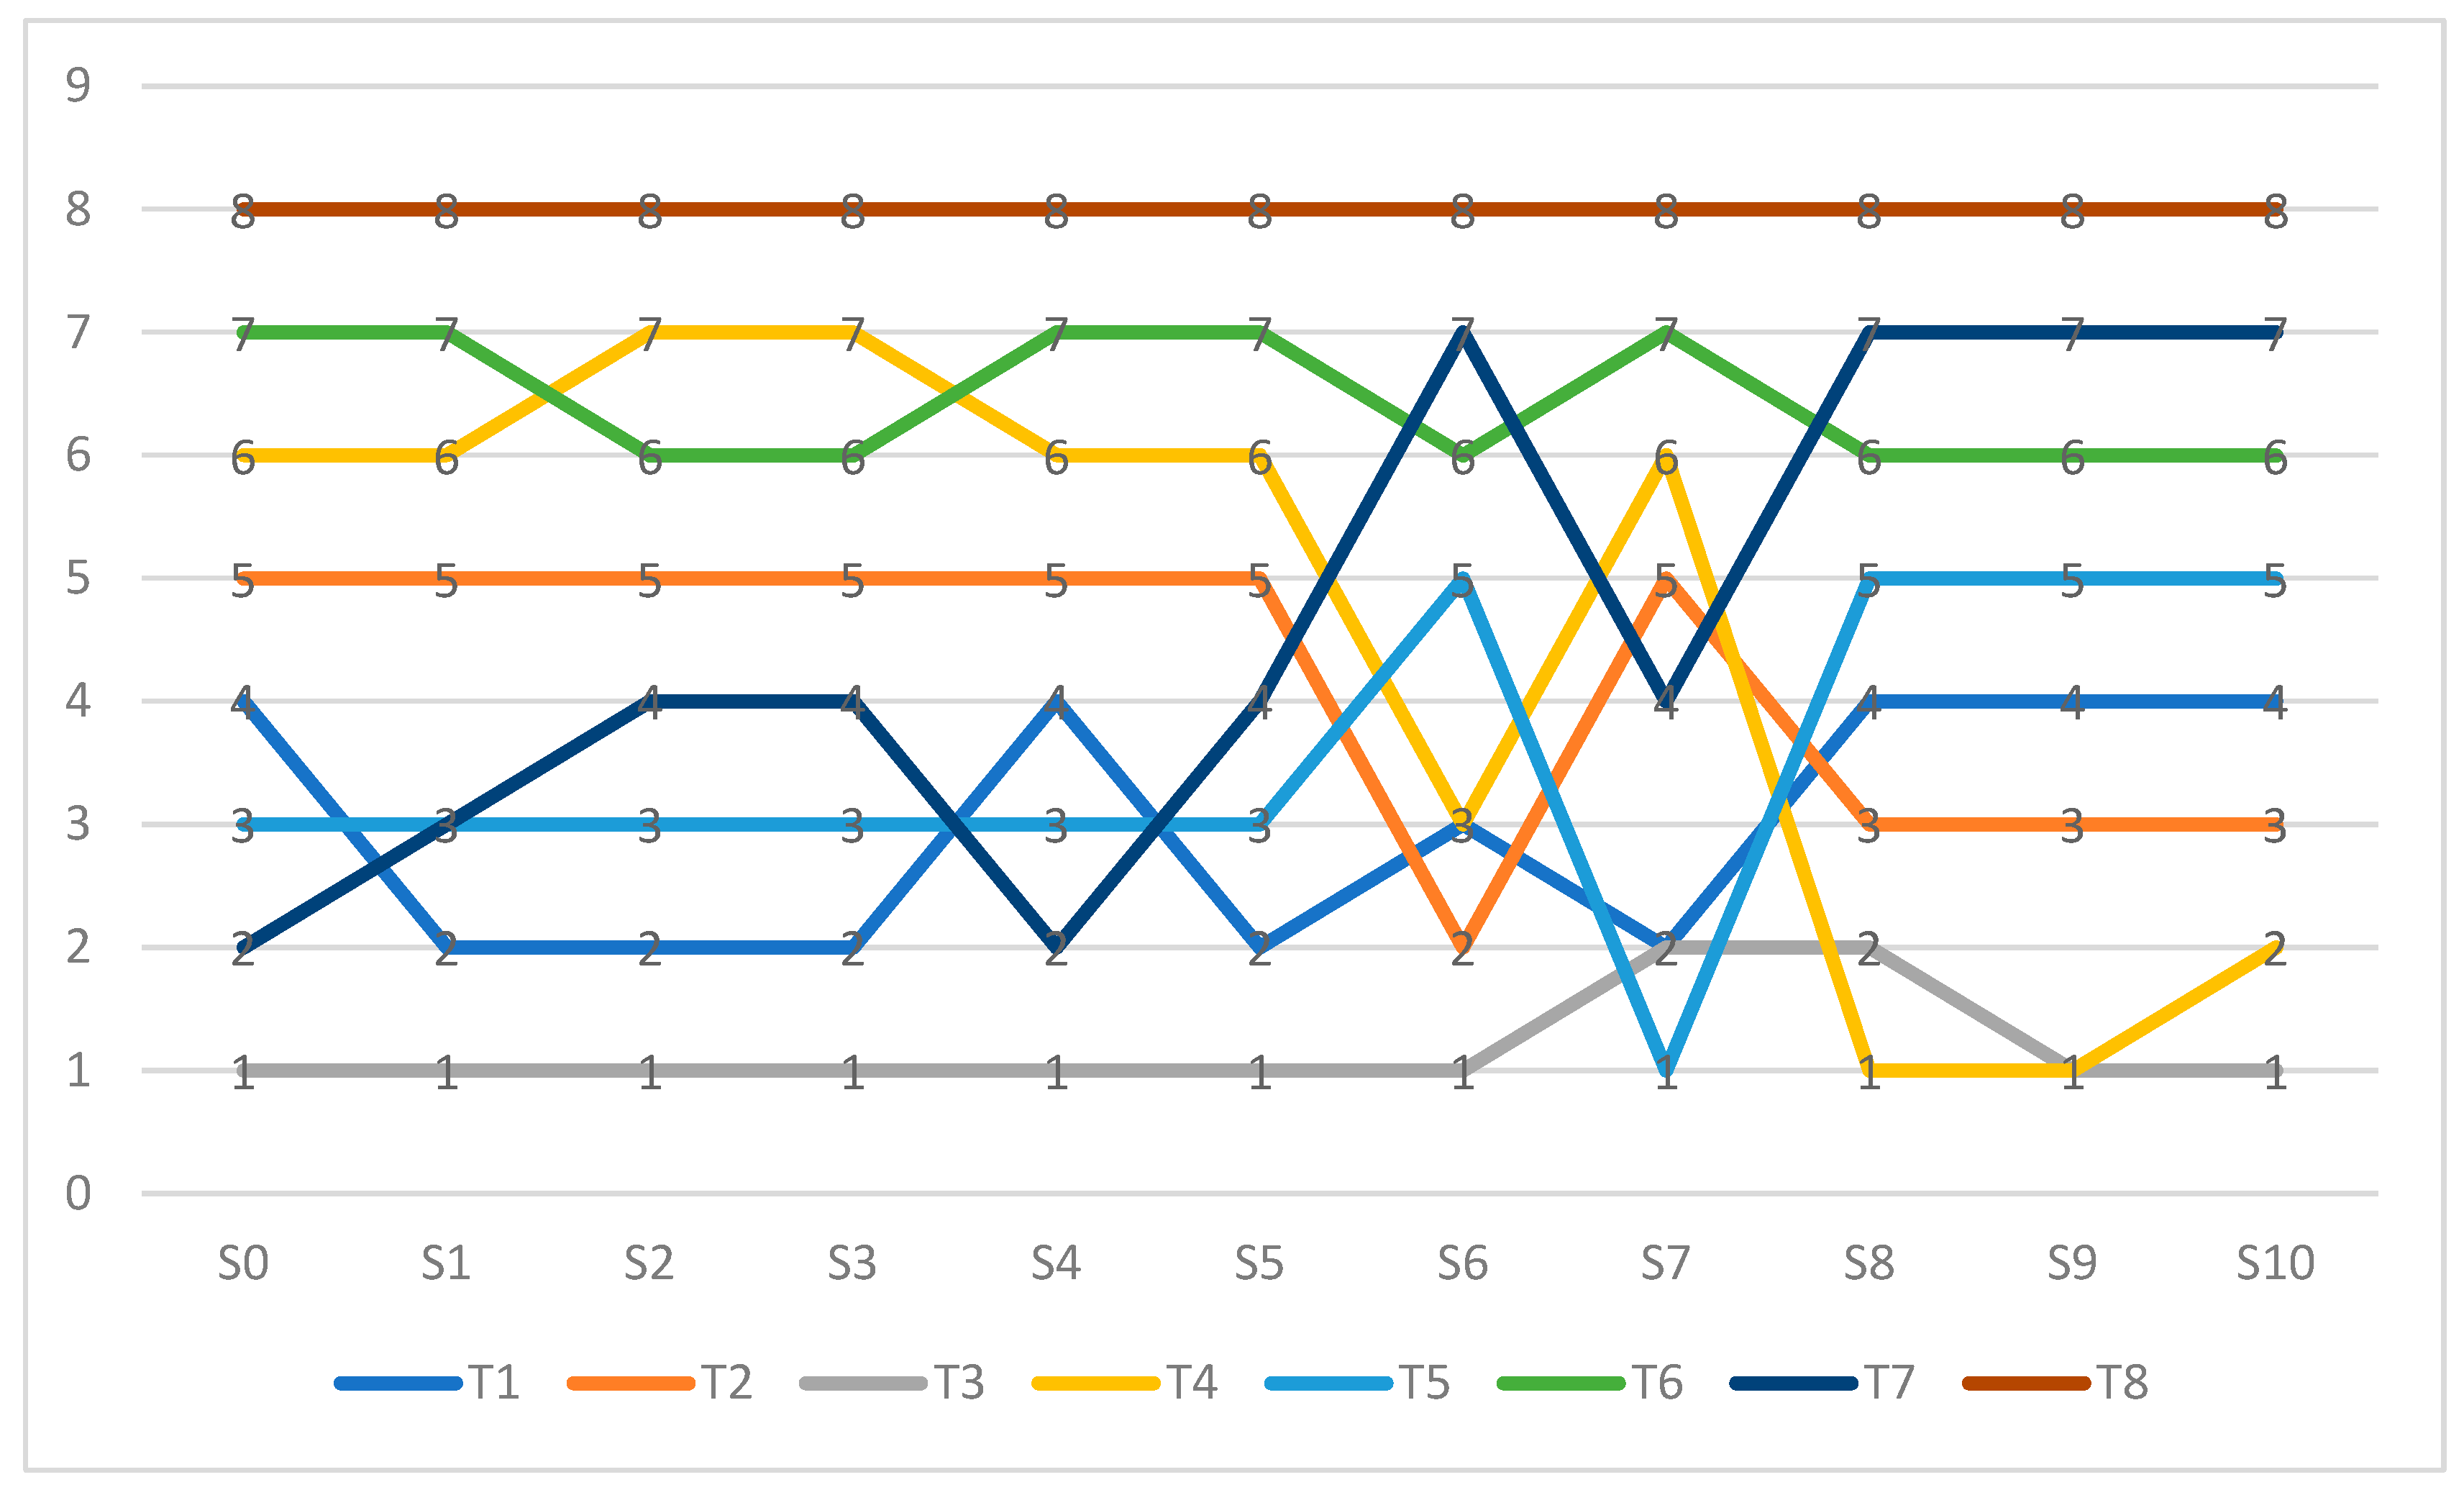
The ranking of the software tool providers based on the 10 scenarios of sensitivity analysis is presented in
Table 14 and
Figure 3. These scenarios were created to cover different points of view and concerns that were discussed during the implementation of the MCDA. For example, S2 represents a nearly equal distribution of the weights, and could be useful in cases where it is difficult to weight the criteria or when the criteria are of nearly equal importance. S5 largely reduces the importance of modeling and reporting capabilities, focusing more on the ease of learning, the tool utilization in related studies and the familiarization of the team with the tool, and could be used in cases focusing on the ease of use of a tool. Finally, S9 presents a case similar to the original one (S0), but with increased importance for the cost, and could be useful when the cost plays a more significant role, i.e., for companies on a tight budget.
Based on the sensitivity analysis results, it becomes clear that T3 presents the highest consistency among the tools that are ranked in the top places. Other tools may outrank this tool in specific scenarios, but in most cases, they are ranked way below this tool, showing lower consistency. However, some tools, such as T1, T4 and T5, were also considered as alternative preferred solutions, and the various scenarios were presented to the logistics company, which was the one to make the final decision.
4. Discussion
According to the results of the MCDA, the team of analysts proposed the T3: ARIS Architect & Designer software tool for designing the reference model for the implementation of the delivery scheduling and vehicle routing system in logistics companies. This tool was ranked at first place in the original S0 scenario, and also showed the highest consistency between the alternative tools that were also ranked high in various scenarios. It should be noted that, despite the fact that the rest of the tools are not suitable alternatives for our specific case, this doesn’t mean that they can’t be suitable in any case. Indeed, if the cost of acquisition had a higher importance, then other tools that were highly ranked in most scenarios would definitely be selected. Additionally, as with most MCDA cases, the personal view of the analysts plays an important role, and therefore the final results are subjective.
The final choice of the tool, ARIS Architect & Designer, was made by the decision-makers, namely the software development and logistics companies that participate in the project. The analysts presented the MCDA’s results to the two companies and, finally, after a thorough meeting, the final choice was made. We believe that our study presents a new path for the utilization of MCDA, which has been, to the best of our knowledge, mostly used in other domains, such as financial, environmental, manufacturing and energy management. This new path enables the selection of appropriate software providers aiming to meet the specific needs of companies.
Finally, we believe that both the MCDA and the BPM tools that were evaluated can lead to the more effective adoption and usage of routing and scheduling software, which can assist companies to minimize traveled distance, unnecessary travel and undelivered orders, and increase the utilization of vehicles. All these improvements can lead to more sustainable supply chain distribution operations, especially in urban areas. In fact, the study can be expanded, with minimal changes and effort, to evaluate software tools that can help with modeling of processes for other supply chain operations, like procurement, sales, manufacturing and warehouse management, and not just the distribution operations that were the concern of this research.

 ,
, 


