Identifying Vulnerable Households Using Machine Learning

1
Data Scientist at Facebook, Inc., Seattle, WA 98109, USA
2
Department of Agricultural Economics at Texas A&M University in College Station, College Station, TX 77845, USA
*
Author to whom correspondence should be addressed.
Sustainability 2020, 12(15), 6002; https://0-doi-org.brum.beds.ac.uk/10.3390/su12156002
Submission received: 2 June 2020
/
Revised: 21 July 2020
/
Accepted: 23 July 2020
/
Published: 26 July 2020
Abstract
:Many Afghanistan households face food insecurity (FI), and this threatens sustainable development. Policymakers and international donors are trying to alleviate FI using food aid, development assistance, and outreach. This study identified household characteristics that discriminate between food-insecure and food-secure households, facilitating accurate assistance targeting in Afghanistan. We used machine learning classification models (classification decision tree and random forest model) and applied to a household survey. This was done using equal priors and 1.5:1 misclassification penalties. The resulting model is able to correctly identify 80% of food-insecure households. Characteristics in six major categories are found important. Unsurprisingly traditional key variables, such as (1) income and expenditure items, (2) household size, (3) farm-related measures; (4) access to particular resources, and (5) short term shocks are important determinants of food security level. We also found the relevance of long-term household characteristics, such as dwelling wall composition, which are not generally addressed in the existing literature. We argue that these are reflective of accumulated household wealth and this supports the idea that some factors determining food security are persistent. We also found that commonly used demographic variables were not important.
1. Introduction
Afghanistan has suffered from severe weather conditions and conflict. The majority of the country’s population is living under the poverty line, with many food-insecure (FI) households [1,2,3]. This threatens sustainable development. One way of alleviating such issues is the provision of development assistance. However, the capability to provide financial and food aid is limited and insufficient if it is to be distributed to all households. Thus, it is essential to target aid toward only FI households, and this requires a means of identifying the food-insecure households [4] A number of existing studies have addressed FI household identification via causal models linking shocks to FI status [5,6,7,8,9]. However, such shocks are generally known afterwards, and it takes time to initiate aid efforts. Thus, there is a lack of real-time and anticipatory identification of FI households.
In addition, some scholars believe that persistent FI alters household characteristics, thus there may be bidirectional influences at work which may bias the results of causal models [10,11,12]. Given this background, perhaps it is desirable to use a less causal approach. The machine learning framework, especially decision tree approaches, offers powerful tools to do this. In this study, we use machine learning models to identify household characteristics that strongly discriminate between FI and not FI households.
To the best of our knowledge, only a few studies have used machine learning methods to address FI household targeting, but these studies used limited datasets. In this study, we use the machine learning method to identify the food insecurity indicators in Afghanistan using a countywide comprehensive dataset that arises from the Afghanistan National Risk and Vulnerability Assessment (NRVA) survey. This survey provides data on over 500 household characteristics.
The important variables we find that are associated with FI are robust across the models we used. Unsurprisingly and as found in other studies, household size, income, access to resources and farm production, and assets-related measures are relevant. However, we found persistent forces at work and not just short-term shocks that affect FI, such as the incidence of household stresses and negative household conditions from previous years, and long-term household characteristics such as quality of housing. These persistent characteristics are commonly omitted in prior studies. We also found that many commonly used explanatory demographic variables were less important. Overall, the use of a broader set of characteristics improved our ability to discriminate between FI and food-secure households, and this may be relevant in broader FI research.
2. Literature Review
FI threatens the life of people and the sustainability of development efforts, not only in Afghanistan but also in many Asian and African countries. Common approaches to overcome FI issues involve the provision of development assistance. However, the capacity to provide such assistance is limited, and targeting assistance to those most in need is critical. However, there is no “gold standard” means of targeting FI households [13], and the use of commonly identified indicators such as Hoddinott’s [14] list of a) food intake, b) household energy acquisition, c) dietary diversity, and d) coping strategies requires the availability of costly household-level information. Therefore, many studies focus on the estimation of FI probability models using econometrics.
Such studies have commonly used several major classes of variables. These include a) demographic measures, such as age of the household head, the gender of household head, the education level of the household head, and the household size; b) farming-related measures, such as farm size, livestock holdings, fertilizer application; and c) economic status-related measures, such as occupation, off-farm income, credit access, and the region of the country [15,16,17,18,19]. However, there might be bi-directional relationships between the above classes of variables and household food security. For example, an increase in off-farm income can decrease FI. However, an increase in FI can lead to a decrease in the off-farm income, because the increase in FI can lead to health issues, thus reducing off-farm income. Meanwhile, there might be omitted variable problems due to a lack of household-level information. Bi-directional causal relationships and omitted variables cause endogeneity problems [20]. The use of instrumental variables (IV) is then in order, but the regression result is sensitive to IV selection [21].
In terms of econometric model selection, censored data (mainly logistic) regression models are most commonly used, as the food security or food insecurity variable is binary [15,16,17,18,19]. Limited by degrees of freedom, researchers usually choose several variables that are potentially explanatory, which raises the problem of explanatory and instrumental variable selection when endogeneity occurs.
Machine-learning approaches, especially decision trees and random forests, relax causal assumptions and have been widely used to identify indicators from data. Studies have addressed such things as indicators of cancer (e.g., [22,23]) and loan defaults (e.g., [24,25]). Machine-learning models commonly start with a large number of possible household characteristics that could be used (also called features) then select the best set, which avoids the a priori variable selection issue. In machine learning, the GUIDE (GUIDE Classification and Regression Trees and Forests) procedure is designed to yield an unbiased estimation [26,27].
Few machine learning studies have addressed FI or poverty. Barbosa and Nelson addressed FI in Brazil and found a model able to identify FI households with a 75% accuracy [28]. They did this employing a Support Vector Machine (SVM) method using 75 household characteristic features. However, they did not report the nature of the characteristic features that enabled them to classify FI households. Mwebaze et al. addressed FI identification in Uganda using a household crop survey coupled with satellite data [11]. They only included 13 features in their model. Hossain et al. predicted FI households in Bangladesh [4]. They found equal performance between machine learning and non-machine learning methods. In their models, less than 30 features were included.
As stated above, none of these studies worked on relatively large datasets with hundreds of household characteristic features that could be used in model estimation. Thus, our study extends the FI analysis using machine learning over a large dataset with hundreds of possible household characteristic features and, in turn, using less restrictive assumptions to efficiently identify FI households.
3. Methodology
Among machine learning methods, decision tree formation is a common approach for classification. Generally, the approach recursively partitions the explanatory characteristics into relevant and irrelevant groups, and in doing this the misclassification cost should be reduced. The best partition for the variables is determined as the one with the least misclassification cost in classification discrimination. In turn, the results are displayed in the form of a “decision tree”, where the status of a particular household characteristic is investigated, and based on the nature of that household status the households are classified. At the top of the tree model is the so-called “Root” node. This is the status of the most important household characteristic that is selected as the one with the highest classification potential among all of the investigated household characteristics. This process is then repeated to find the next most discriminating household feature and the FI classification or the need to investigate the additional characteristics it implies. In doing this, the algorithm runs an exhaustive search across all household features to determine the most important one and tests how household status within that characteristic is associated with FI status to determine the nature of the decision tree split. After addressing a number of household characteristic features, the procedure ends at a leaf node where the household is given an FI classification status. Both the order of importance of the independent variables and the way the tree splits toward ultimate FI classification are calculated iteratively using methods such as the split method, the Gini index split method, or the information gain method. For this study, we used the GUIDE classification, regression trees and regression forests method (version 34.0). Loh indicates that, relative to other decision tree models, GUIDE has the advantage of producing unbiased predictors and is better at treating missing values [26,27].
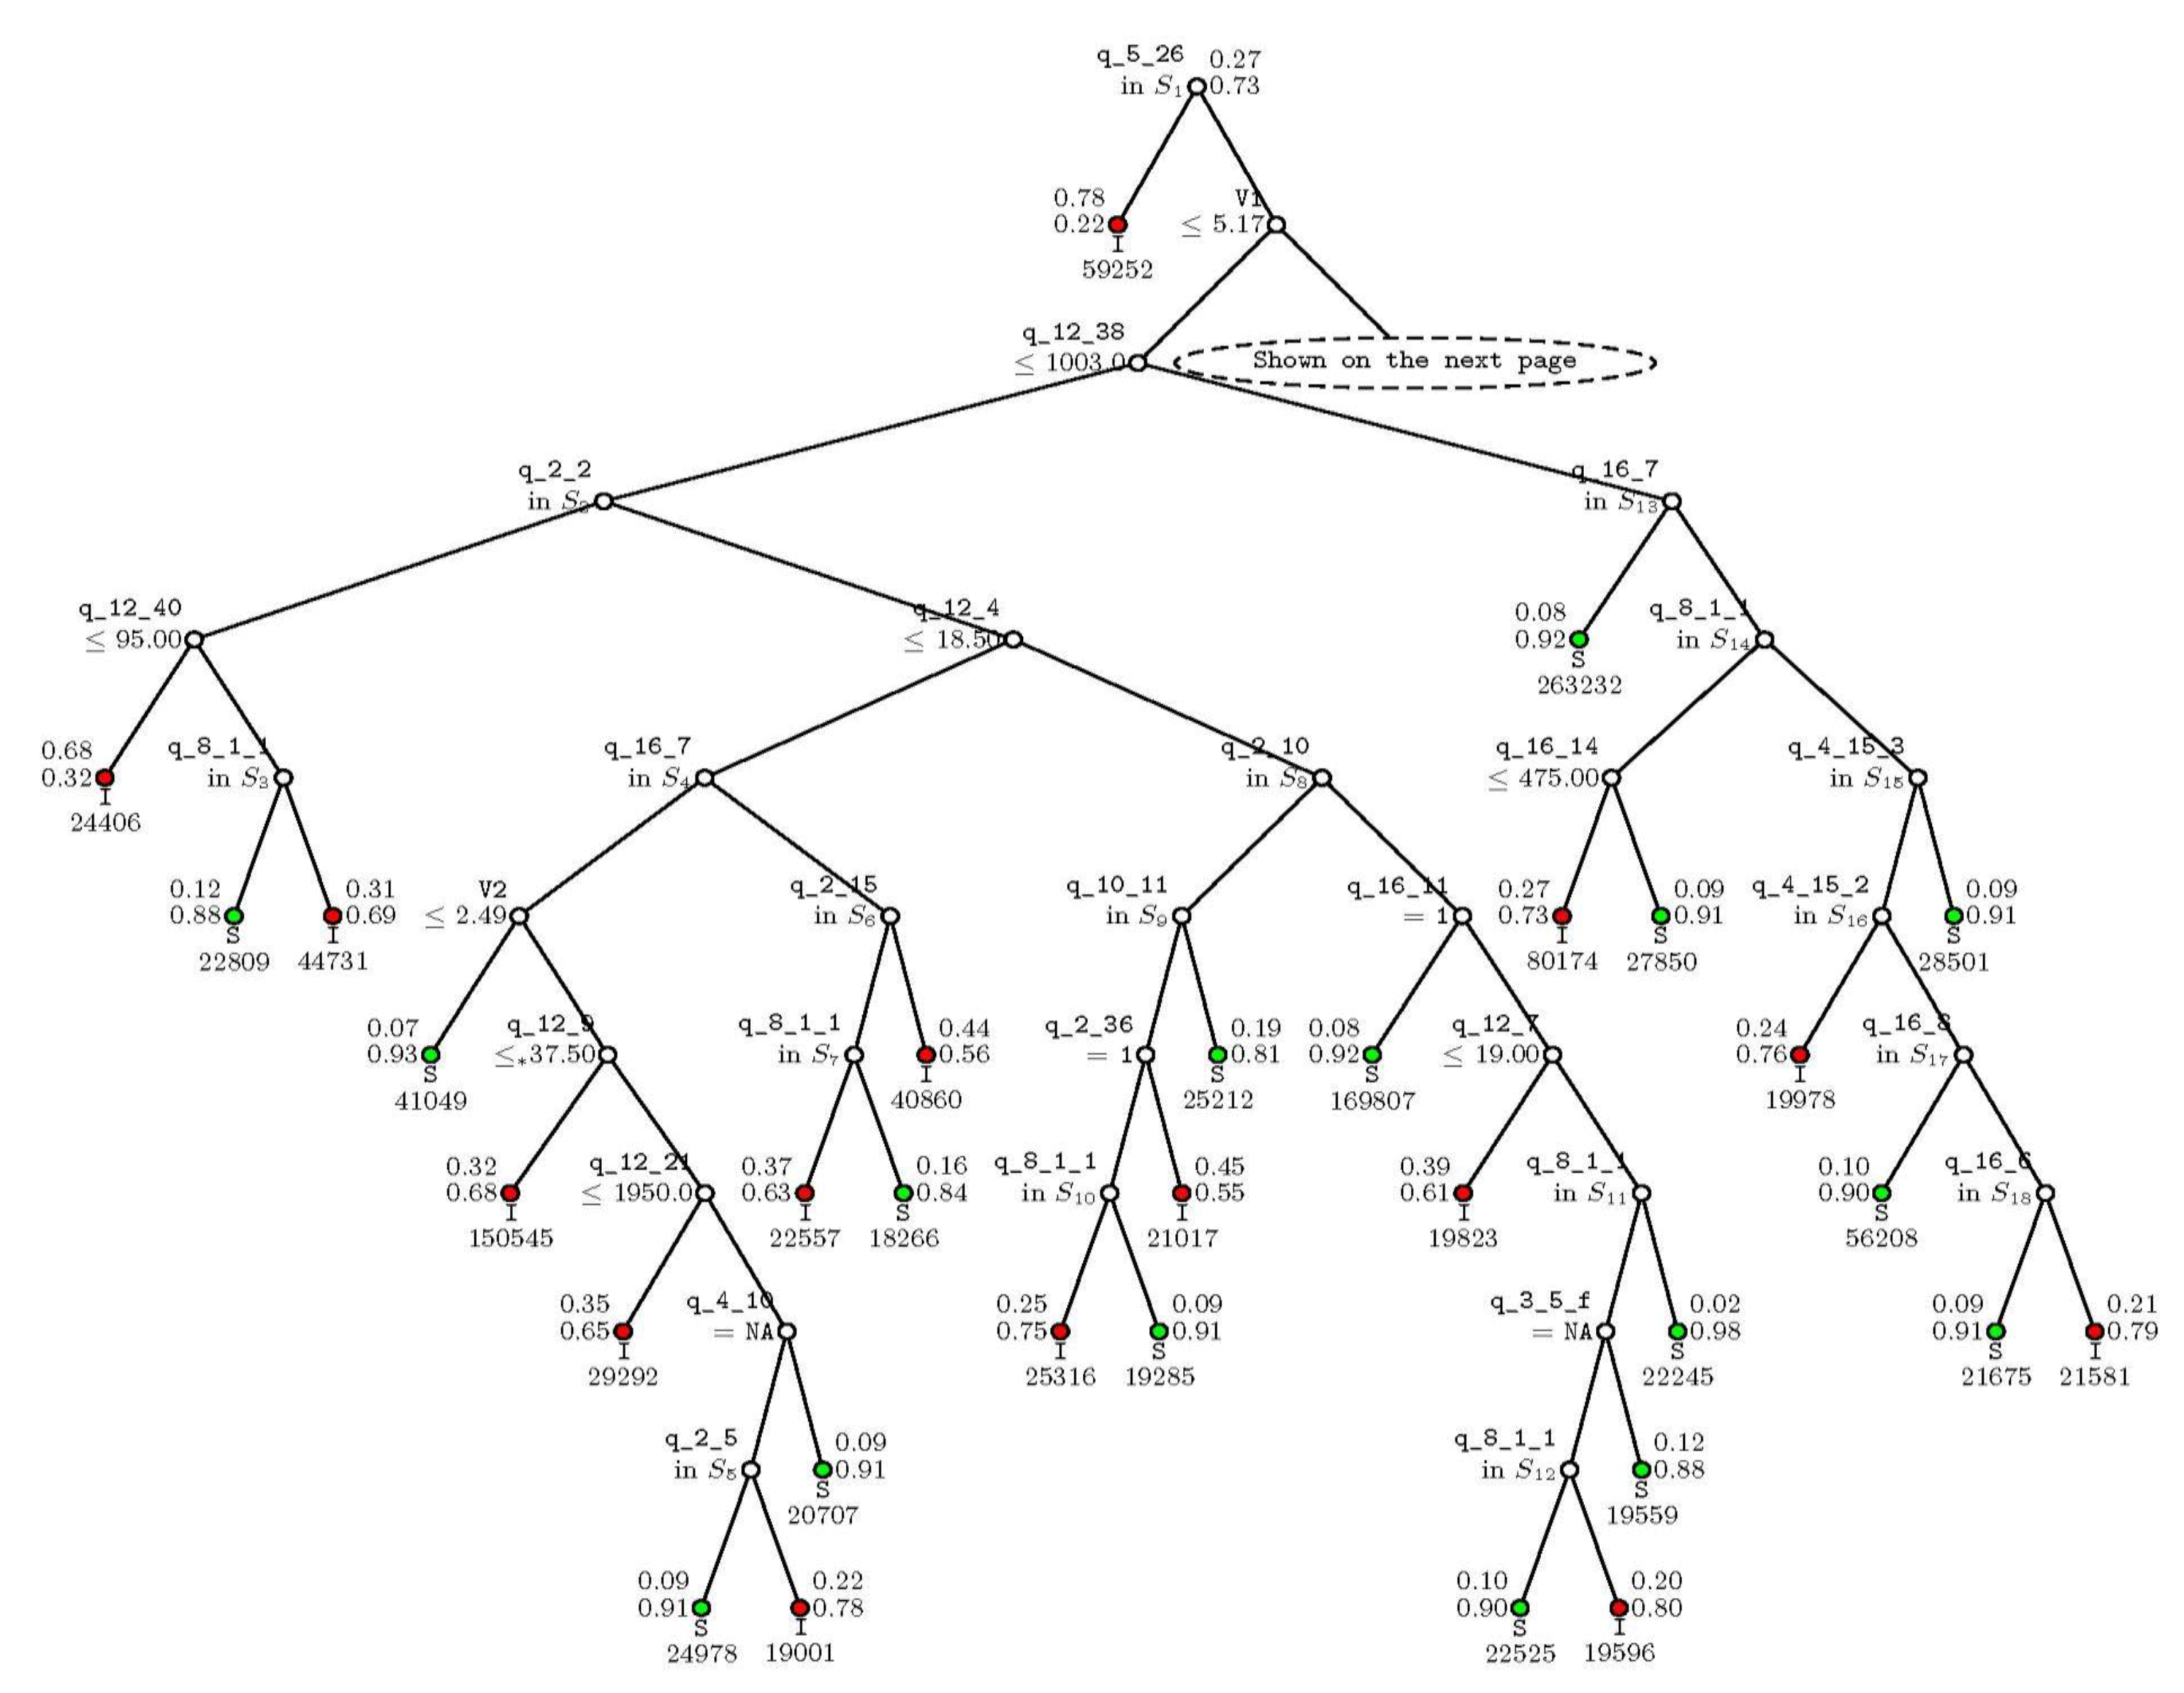
In this study, the split method is used. The household characteristic feature selection and split criterion calculation will keep developing the decision tree until the available features are exhausted or a stopping criterion is met [27,29,30,31]. To avoid overfitting, the tree is pruned using 10-fold cross validation [26]. The leaf node will be removed if the overall cost of the cross validation could be reduced without this node. The resultant final tree is presented like a series of household status questions. For each household, it evaluates the status relative to the feature addressed in the root and then, if needed, in subsequent nodes. If the observation positively exhibits the characteristic that is the subject of that node (i.e., the response to the root node about the source of financing (q_5_26) is that one would mortgage the house or land, as portrayed by the answer being in S1 as in Figure 1), it goes to the next node on the left (predicted as an FI household). Otherwise, it goes to the next node on the right (check if the effective household size is smaller than 5.17). Then, the next most important characteristic is investigated and the inquiries move according to the tree. The process is repeated until a leaf node is reached. As that point, the household at hand is assigned the relevant FI classification.
As the importance of some factors may be biased by sampling noise, we also use the random forest approach to build multiple trees using feature and sample subsets [32]. Then, we build a final tree that reflects the majority of the relevant features that appear within the trees in the “forest”. Each tree in the forest is built using a subset of features and observations. Therefore, the random forest method minimizes the chance of overfitting and the associated bias caused by particular variables and observations. The random forest also produces a probability for each household that it is FI. In our study, 500 trees were formed using the random forest approach.
Finally, we needed to deal with the issue of an unbalanced sample, as we had unequal numbers of FI and non-FI households. After constructing the FI indicator across our dataset (as discussed below), we found that about 27% households were classified as FI and 73% were not. Such an unbalanced dataset can cause a null tree or poor splits [33,34]. To overcome this, we adopted the assumption of equal prior FI and non-FI household probabilities (instead of empirical priors) and uneven misclassification costs. We used the cost of 1.5:1 for misclassifying a FI household as non-FI, where we used a penalty cost of 1.5 when misclassifying a non-FI household as FI and a penalty cost of 1 when misclassifying an FI household as non-FI. The use of equal priors causes GUIDE to emphasize the search for key variables that can separate FI from non-FI households. The use of the uneven classification costs makes it more “costly” to classify FI households as non-FI ones relative to the opposite case, and reduces the likelihood of FI misclassification.
4. Data Description
The data used were drawn from the 2008 Afghanistan National Risk and Vulnerability Assessment (NRVA) Survey. That survey covers 20,511 randomly selected households across the whole country. The results contain demographic information, indicators of living condition, food security, labor market participation, education, health, and many other items. The URL to the full questionnaire is provided in Appendix A. Numerical yes or no answers (coded as 0/1) and not applicable responses are included in the data. A separate answer was created for missing or not applicable responses.
4.1. Handling Sample Weights
The sampling was randomized and, in use, the dataset contains weights for each observation that are designed to represent all households in the country [35]. These weights differ by household, and since the estimation procedures we used did not directly handle differential weighting, we replicated each observation according to the weights so that each resultant observation was equally likely. This resulted in 3,426,445 observations. The response to each survey question is treated as an individual feature in the dataset. We used all of the household responses to questions as possible indicators of food security, except those for food consumption. Food consumption questions were used to construct the FI indicator. This resulted in the dataset having 581 features that could be selected by the mode. Each feature represented the answer to 581 of the survey questions. The household observations in the dataset were randomly divided into a set for model training (80% of the cases) and a set for out of sample testing (20%).
4.2. Construction of FI indicator
The per capita sufficiency of calorie intake was used as the FI indicator. This is calculated based on the responses to the survey questions on food consumption quantities and the needed per capita calorie amount. Consumption amounts were given for 90 different foods in 10 different categories. We also accounted for calories from meals dining outside and subtracted calories for meals consumed by guests.
The broad categories are: 1) bread and cereals, 2) meat and fish, 3) dairy and eggs, 4) oil, 5) vegetables, 6) fruits, 7) nuts, 8) sugar and sweets, 9) beverages, and 10) spices. We then calculated the calorie intake by household members based on the calories in food consumed during the past week. We used caloric information from the United States Department of Agriculture Food Composition Databases [36]. We then calculated the sufficiency relative to needs, as they vary by the age and gender of household members based on the recommended dietary requirement provided by National Research Council (US) [37] (See Appendix B Table A1 for details). As a result, we computed a calorie requirement of 2550 calories per household member and classified a household as FI if the per capita calorie intake is below that. Otherwise, the household is indicated as food-secure. The result was that we classified 26.7% of the households as FI.
4.3. Constructing a Household Income Measure
A per capita household income measure was also needed, but there was not a direct question on this in the survey. However, questions on the amount of income from the main household source were asked as its proportion relative to the household’s total annual income. We then calculated the total household income (HHincome) as:
where MI is the annual income from the main income generating activities (q.8.4) and PMI is the proportion of the household’s total income from the main income source (max (q.8.2.1 to 8.2.6)).
We calculated the income per capita (IpC) as:
where HHIncome is the total household income and HHsize is the effective household size.
4.4. Resultant Statistics
A table of summary statistics for the selected items, including those calculated by the authors, is reported in Table 1. This table only shows the 15 most important FI determining household characteristics identified and ranked by GUIDE. The ranking will be discussed in detail in the next section.
The summary statistics are grouped by the household FI type and show the average difference between the FI and food-secure household groups.
5. Model Validation
To validate the models we built, we randomly split the dataset into training (80% households) and testing subsets (20% of the households). All the models were built using the training set (in sample). We then evaluated the model performance using the testing set. In particular, we used our estimated model to predict the food security status of each household and evaluated how well the prediction matched up with the household FI status. Recall rate, which is the number of FI households that were successfully predicted as FI divided by the total number of FI households in the dataset, is used as the model validation indicator. In turn, if the recall rates in the training and testing datasets are similar, then this shows our models are well calibrated. The resultant calculated recall rates are shown in Table 2.
For the decision tree model, the recall rate was 80% and it was 79% in the testing set. When we only used the 100 most important variables in the model training, which resulted in the training dataset recall rate increasing to 81%, while the testing recall rate remained at 79%.
For the random forest model, the recall rate was about 82% in the training set and 80% in the testing set. The closeness of these recall rates across the model versions and datasets leads us to conclude that our models are well calibrated.
6. Results and Discussion
The estimated decision tree pruned by 10-fold cross validation is shown in Figure 1 and Figure 2. The first split variable involves the response to the question “If your household had to borrow money in the future, who is the first source you would borrow from?” (q_5_26). If the answer to this question is “Mortgaging land/house” (set S1), those households are classified as FI. The numbers beside this node show that in the testing set, 78% of the households that gave this answer were truly FI.
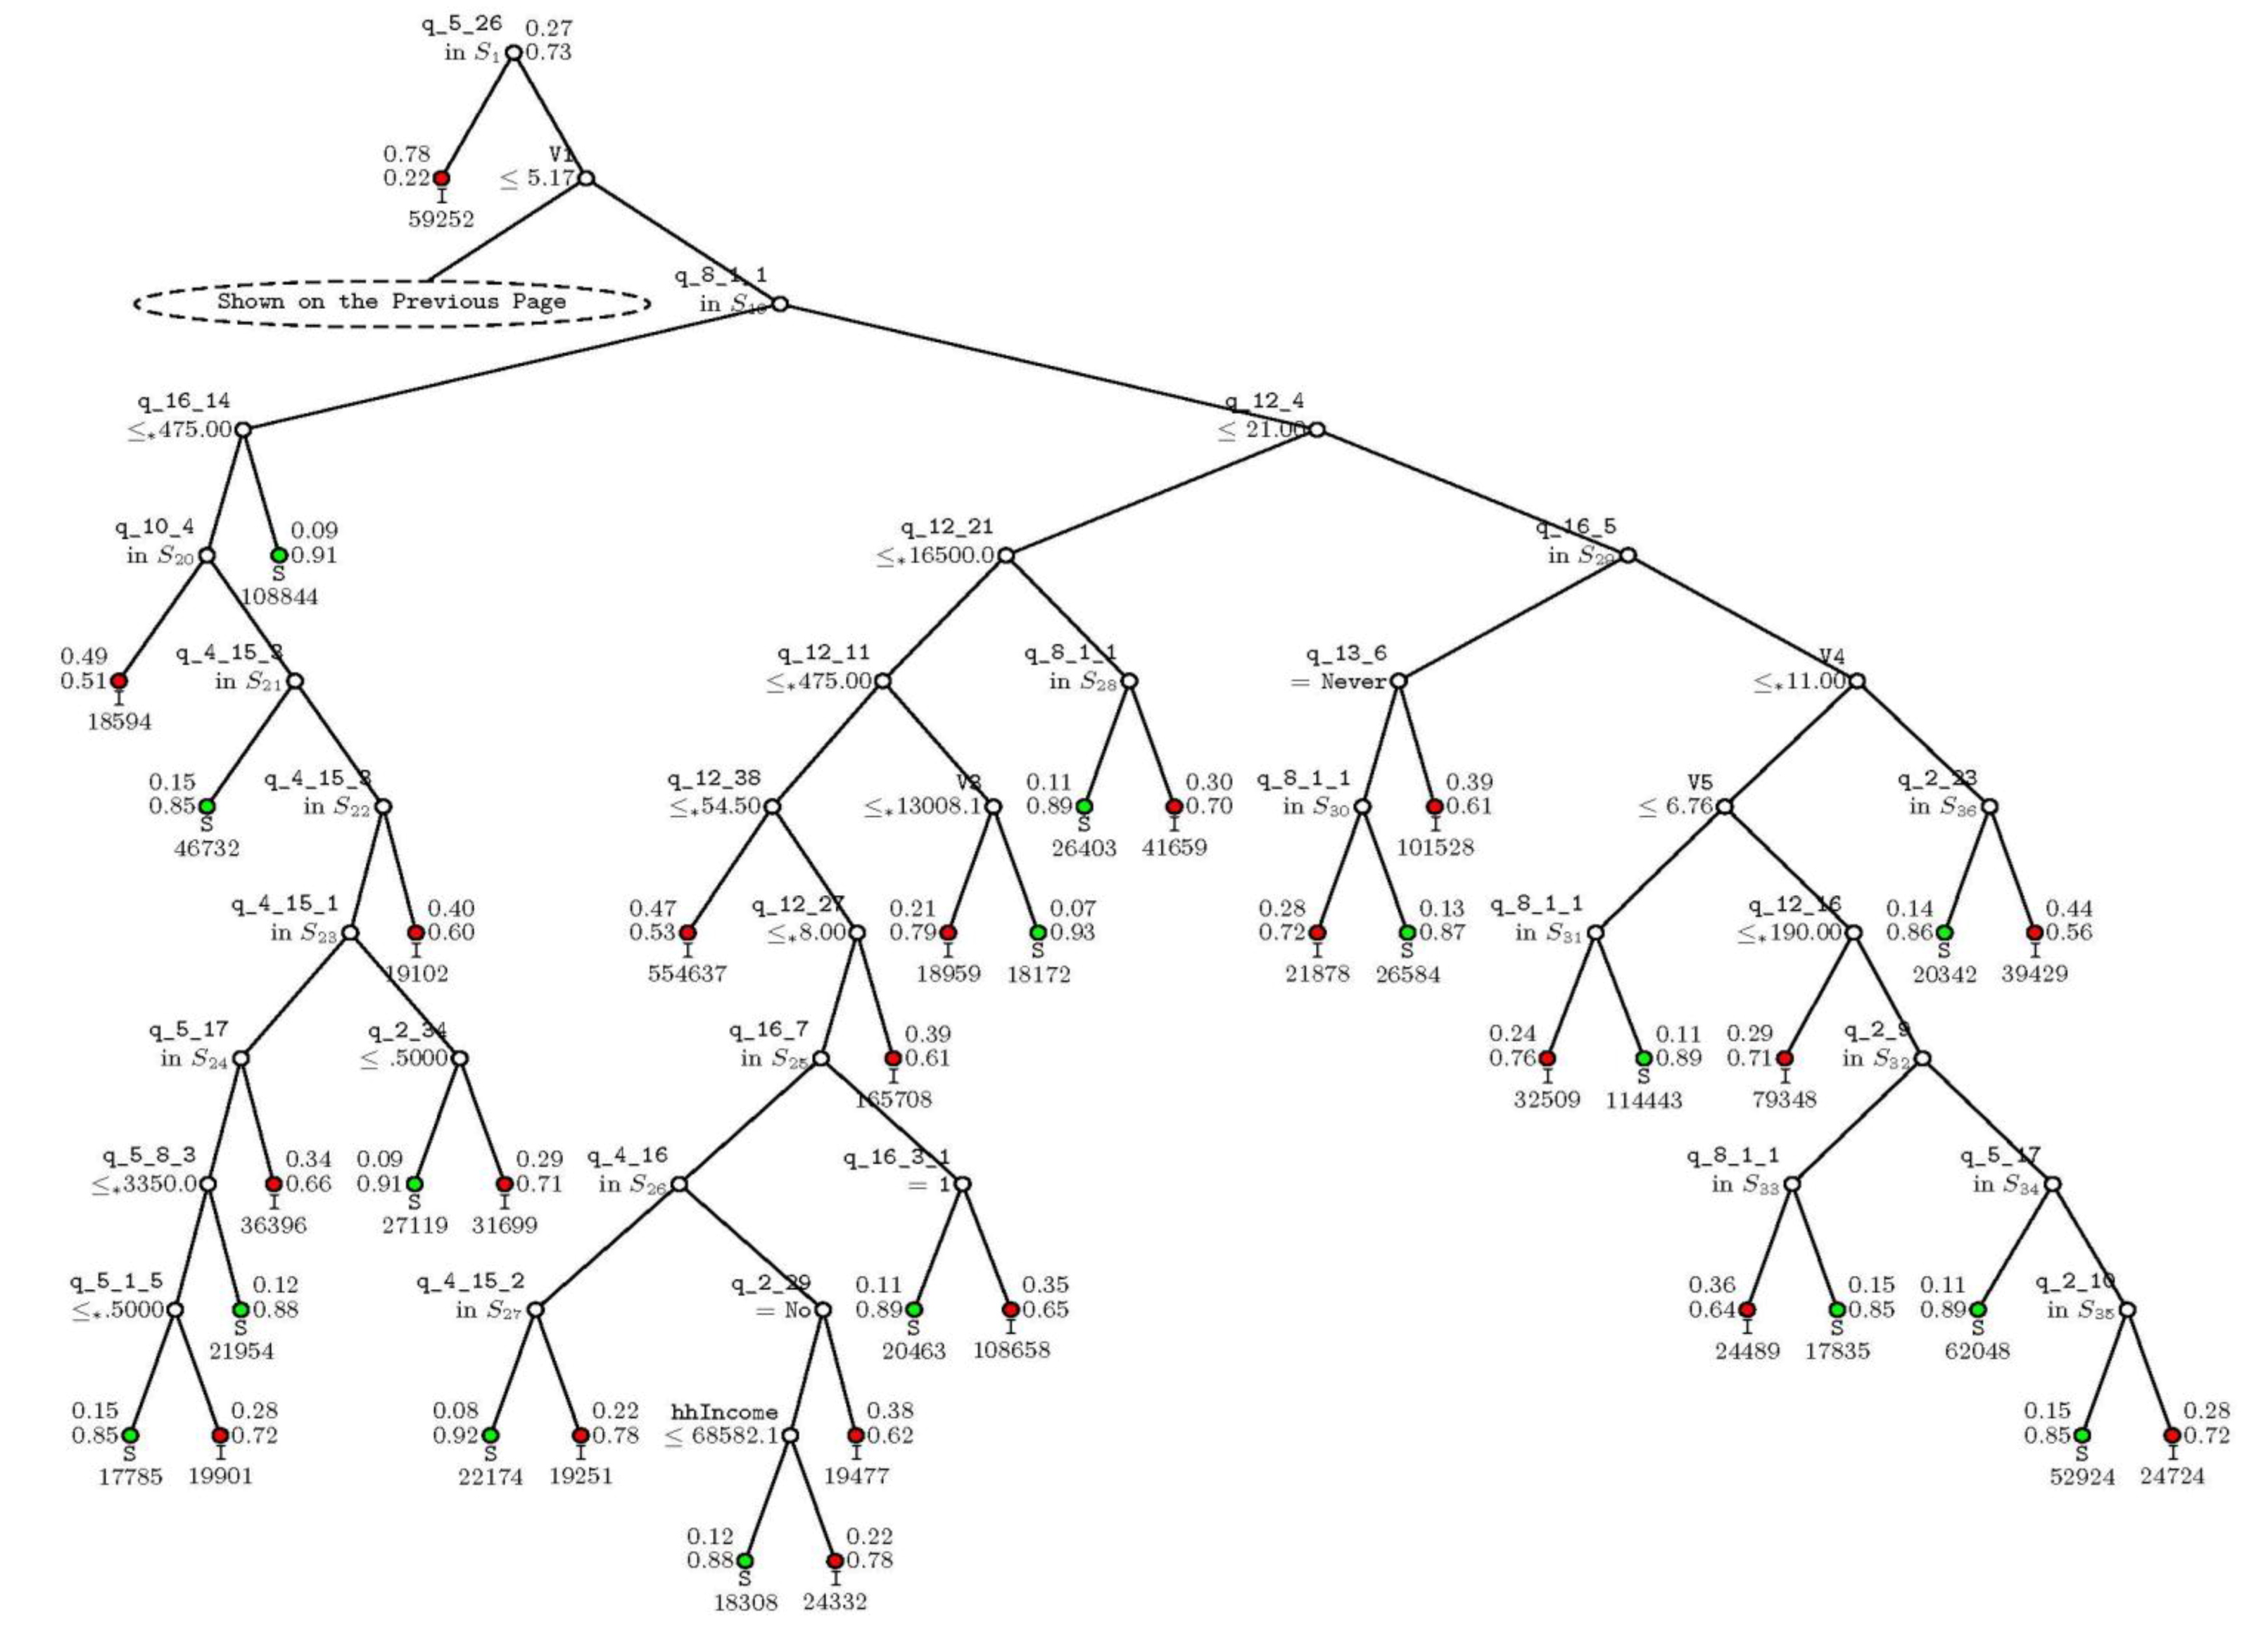
If the household responds that it used other sources for borrowing, the next question is whether the household size (V1) is less than 5.17 people. If the household is smaller than that, the applicable node is to the left, where the tree addresses whether expenditures on “Annual celebrations and charitable donations” (q_12_38) are less than or equal to 1003 Afghanis. Otherwise, the applicable node is to the right, where the next characteristic involves what is the most important household income-generating activity (q_8_1_1, the right branches on Figure 2). The questioning then proceeds until a leaf node is reached (where the questions run out). The class denoted at that leaf node is the predicted class for the household, where “I” (or a red node) indicates an FI household and “S” (or the green node) stands for a non-FI household. The questions for each node and the responses used to split the nodes are listed in Appendix C.
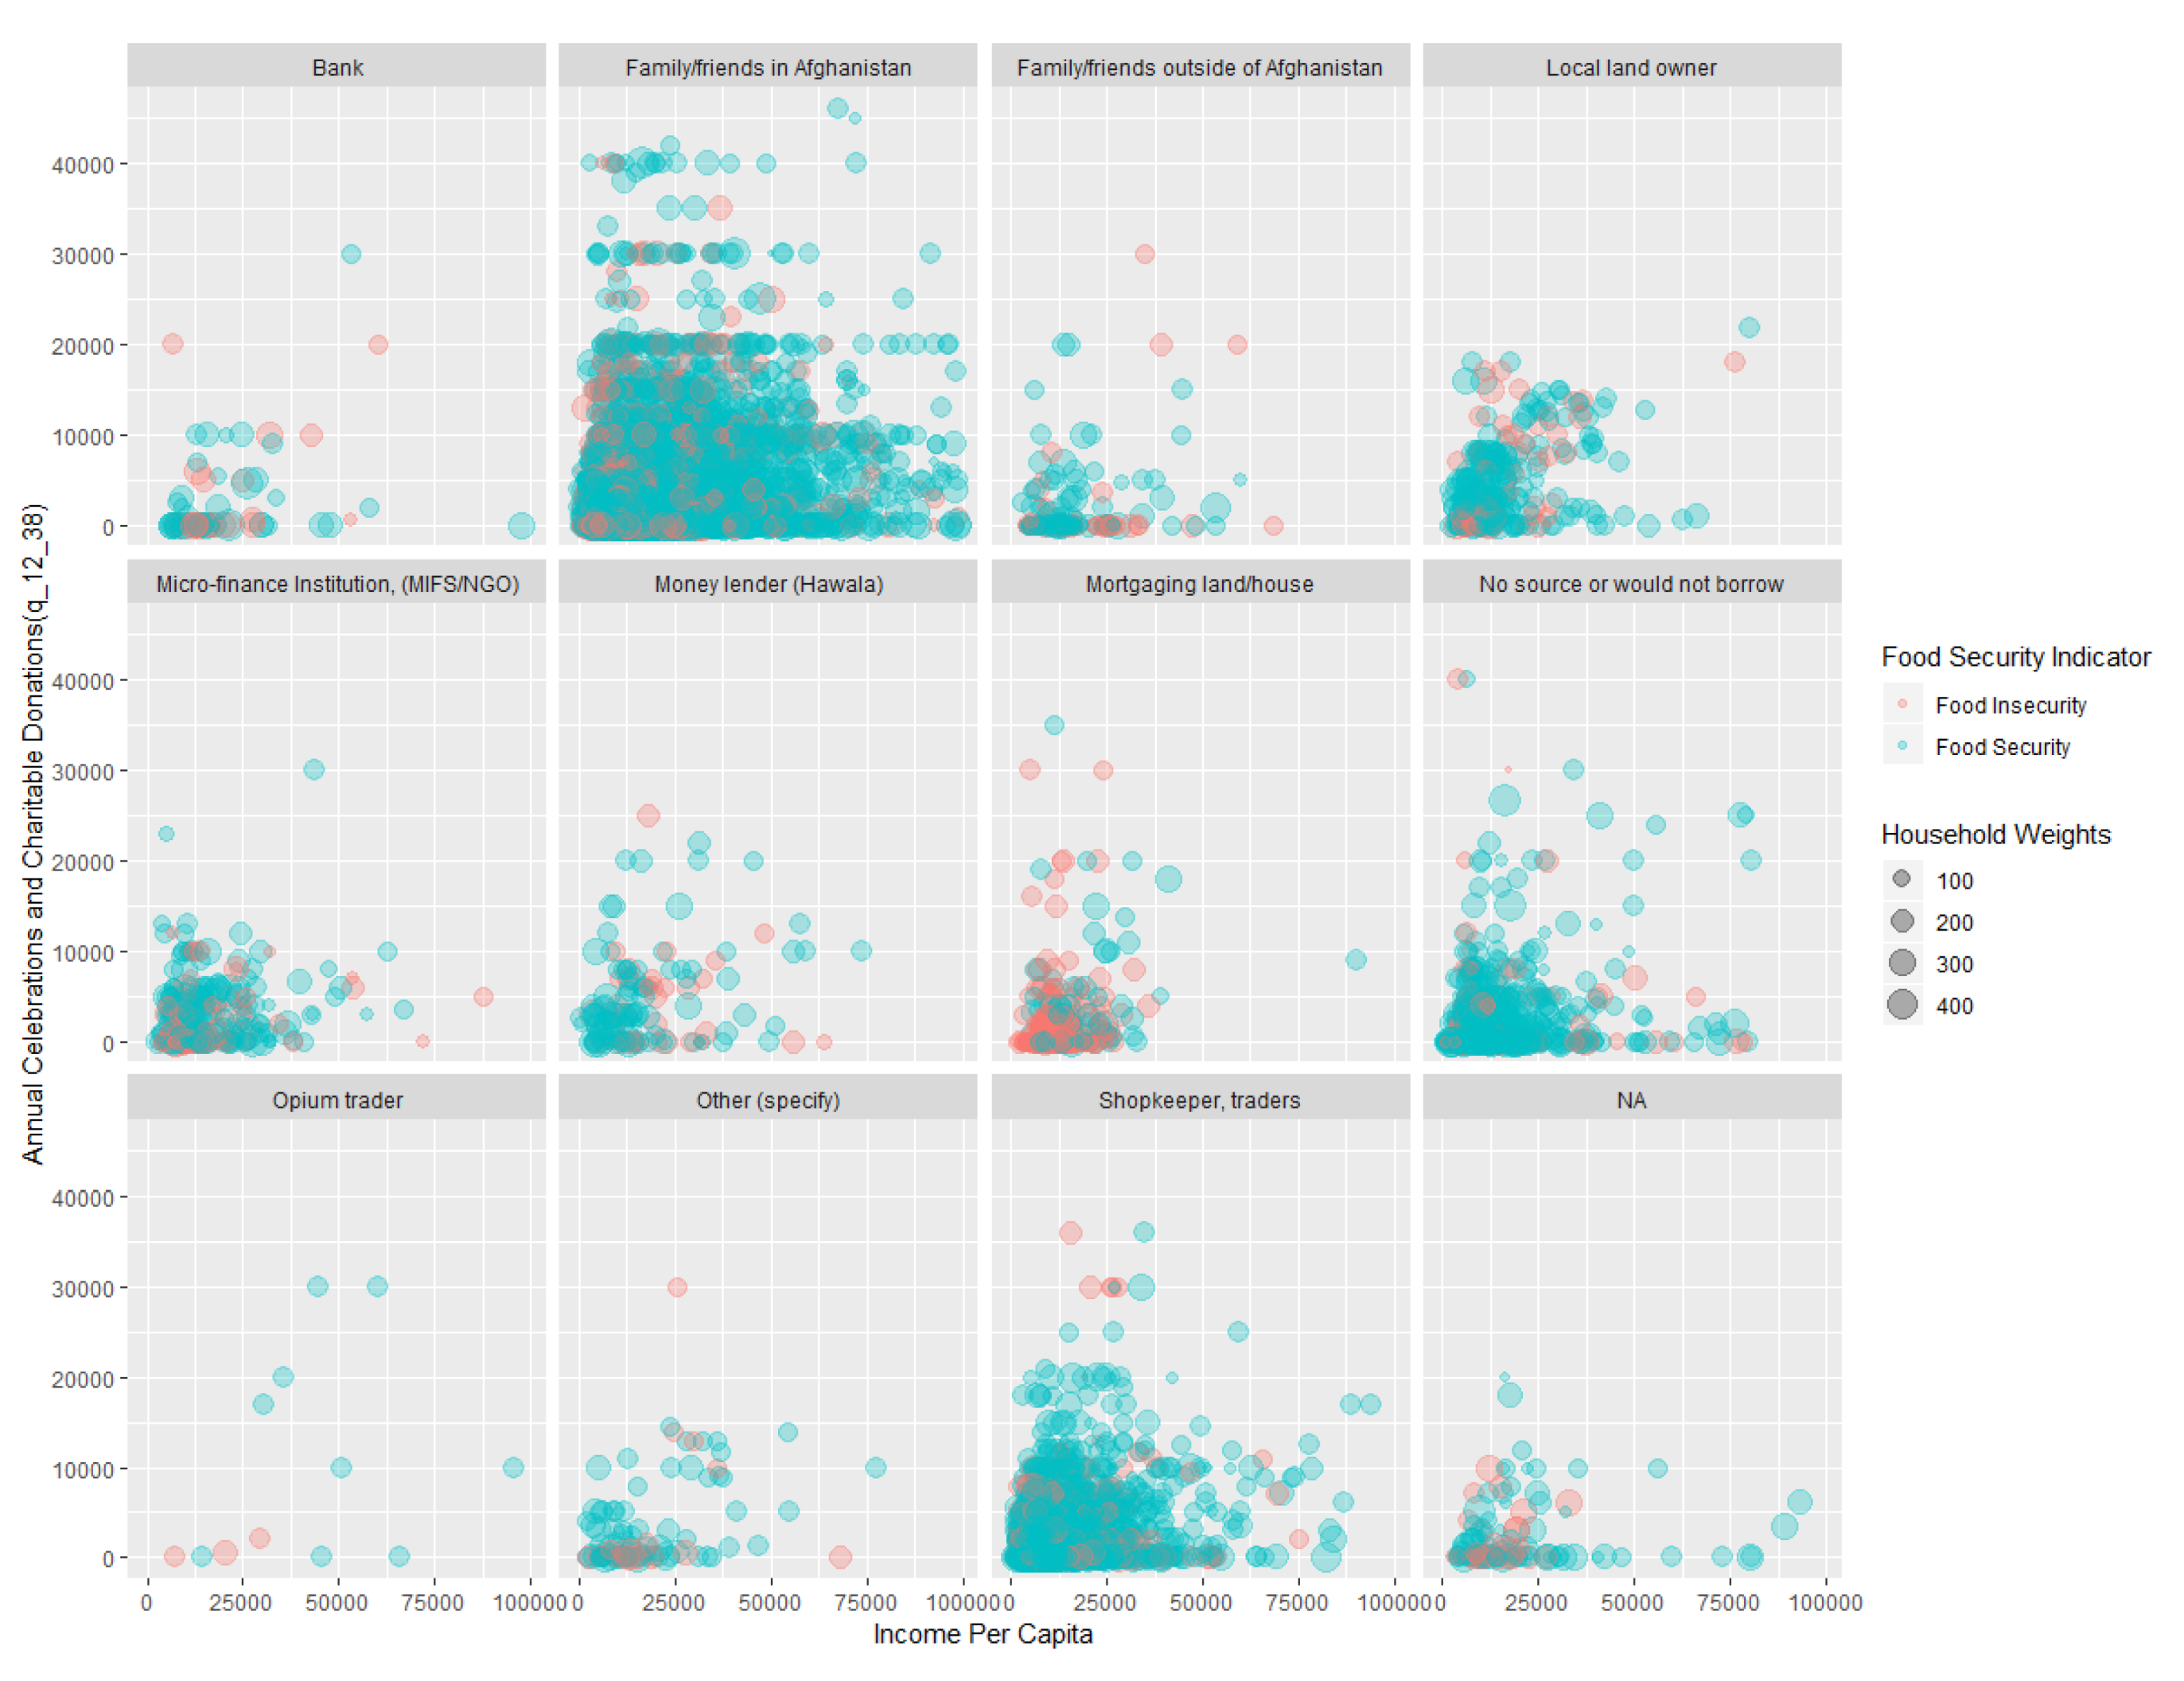
For a better demonstration of classification, Figure 3 shows the association of FI with the “Annual Celebrations and Charitable Donations” and income per capita in the training set, with separate panels for each different response on money borrowing sources. The red dots represent FI households, while the green dots represents food-secure households, with the size of the dots showing the number of households each dot represents. Recall that the tree classifies households having to mortgage land or house for money as FI. It is clear in the figure that most households in the “Mortgaging land/house” category (third plot in the second row) are FI.
While it is not surprising that household income or expenditure-related variables are important, the decision tree also contains several housing-related variables such as “What is the major construction material of the exterior walls of dwelling” (referencing question q_2_2 as listed in the appendix), as well as some variables describing potential short run stresses faced by the households, such as “How would you compare the overall economic situation of the household with 1 year ago?” (q_16_7). We can divide the selected variables into six major classes:
- Income and expenditure patterns such as expenditures on medicines (q_12_21), transportation fare (q_12_16), laundry charges (q_12_11), income per capita (V4), and annual celebrations and charitable donations (q_12_38).
- Household size (V1).
- Farm-related measures, such as the three most important crops harvested in the last cultivation season—e.g., wheat, maize, barley, etc.—and the area of the land that was rented out in the last summer cultivation season (q_4_10, q_4_15_1, q_4_15_2, and q_4_15_3).
- Realized stresses, such as “How would you compare the overall economic situation of the household with 1 year ago?” (q_16_7) and “ How often in the last year did you have problems satisfying the food needs of the household?” (q_16_8).
- Long-term household characteristics representative of accumulated wealth, such as the construction material used in the exterior walls of dwellings (q_2_2), the type of kitchen/cooking facility in the dwelling (q_2_15), and the ownership of the dwelling (q_2_10).
- Access to resources, such as the connection to sewage (q_2_29), the distance to the main source of water (q_2_34), the ability to access the main water source at any time (q_2_36), the main source of irrigation water (q_4_16), the knowledge of iodized salt (q_16_3_1), and the purchase of iodized salt (q_16_5 and q_16_6)
In the previous literature, income and expenditure and farm-related measures are commonly used [4,15,16,17,18,19,38]. Access to resources and the incidence of short-term shocks are used in some studies, but not often. Abdula [38] used distance from a main road and market access. We could not find the use of long-term household characteristics other than an attempt in Hossain et al. [4], who tried building materials but did not find them important. We do note that Carter and Barrett [39] and Mammen, Bauer, and Richards [40] argue that purely treating the food security problem for households as a current problem with current causes is not always appropriate, arguing for the importance of persistent forces. Our result supports their conclusion.
Another thing shown by our key results is that the association between the food security problem and the indicators can be bidirectional. Not only does a low income cause FI, but it also tends to cause lower quality housing through low wealth accumulation. In addition, FI causes a limited ability to work, which likely lowers the income and the ability to own higher quality housing. Thus, while the selected independent variables are associated with FI, we do not assert that they are the cause of it.
As there is no coverage in the survey that addresses wealth or assets directly, the model is likely to select variables such as the material of the dwellings as a proxy. We feel it would be good to include long-term wealth-related questions in future surveys. We believe that our results indicate that the long-term household financial status influences FI and that it would be good to have direct information on this for use in FI classification.
We also found limited demographic FI associations, with effective household size being the only selected demographic feature. This implies that when there is enough information on other characteristics of the household, the demographic information may well be superseded in importance. Future research may not need to dwell so much on demographics to develop FI classifications.
To better show the importance of each feature in the model, we calculated their importance scores following Loh [27] and Loh, He, and Man [41]. Table 3 shows the 15 most important variables selected. As the importance score calculations consider the number of observations, the order shown in Table 3 is slightly different from that in the model. Again, these most important variables are a combination of expected and unexpected forces.
Most of the 581 household characteristic features were not found to contribute to FI identification relative to the ones we list above, but created noise in the estimation. The model was re-estimated with the first 100 variables in the importance score ranking. With the smaller set of variables as the input, the mean misclassification cost improves to 0.3606 (a 1.5% reduction) on the testing set.
7. Robustness Tests
As the importance of some factors may be biased by the noise in the sample, we move on to build a random forest model with 500 trees. In turn, we find that there are 35 features that were selected across all the 500 trees. The ones selected are similar to those presented above for the decision tree model. Another random forest was built with only the top 100 most important features and the AUC for measurement was boosted from 0.845 to 0.851 (The AUC is a commonly used way to evaluate the performance of a classifier. A pure random classifier will lead to an AUC of 0.5, while a perfect classifier will cause AUC to equal 1.). However, the FI features selected by the models are all similar. We believe the random forest does not add much, and thus we do not cover the selected features or a composite tree.
8. Conclusions and Policy Implications
Food aid and other household assistance resources are limited but are vital to sustainable development in settings like Afghanistan. Thus, it is vitally important to accurately target households that need assistance. This study identified household characteristics that discriminate between food-insecure and food-secure households, facilitating accurate assistance targeting.
Our procedure involves using machine learning classification models to identify key household characteristic features that are associated with the likelihood that a household is food-insecure. We employ a classification decision tree and random forest model to do this using equal prior and 1.5:1 misclassification penalties. The resulting model is able to correctly identify 80% of the food-insecure households.
Across the study, 35 key household characteristic features were selected to identify FI households among 581 possible characteristics. Six major groupings of characteristics were identified: a) income and expenditure items, such as income per capita and expenditures for some goods; b) household size; c) farm-related measures, such as the major crops harvested; d) access to particular resources, such as the distance to water sources and the usage of iodized salt; e) short term shocks—e.g., “How would you compare the overall economic situation of the household with 1 year ago?”; and f) household dwelling characteristics, such as the material of the exterior walls of the dwelling, the type of kitchen, and the ownership. The first five types of variables are more commonly used in previous studies. However, we could not find studies that successfully used dwelling attributes as explanatory variables to estimate or predict food insecurity. We believe the dwelling attributes reflect household wealth, which implies that food security is a long-term problem affected by the overall household economic condition and is not just an issue caused by short-term shocks [39,40].
In addition, our findings support the idea that the food security problem persists and has a bidirectional relationship with other variables. Thus, long-term household wealth-related variables are recommended for inclusion in future surveys and in exercises identifying food-insecure households. Moreover, long-term household characteristics are also more easily observed and can be more objectively identified, which may reduce the cost of identifying FI households.
We also found that the demographic variables, such as the gender and education level of the household head, which were commonly used in previous research, were not selected as key indicators, and this may imply that other information is key in predicting food insecurity.
In summary, this study advances a key set of household characteristics that could be used to quickly identify FI households and increase the financial assistance-targeting accuracy. We recommend the use of income, family size, farm-related measures, incidence of short-term stresses, dwelling characteristics, and access to resources. This is a mix of short and long-term indicators.
Finally, we should mention the limitations of our work. The results are based on only one dataset for one somewhat dated year from Afghanistan. There is a need to explore the indicators we identify in other settings over time and space to confirm the importance of the identified characteristics on household food insecurity.
Author Contributions
Conceptualization, C.G. and C.J.F.; methodology, C.G.; formal analysis, C.G.; data curation, C.J.F.; writing—original draft preparation, C.G.; writing—review and editing, C.J.F., B.A.M. and D.J.L. All authors have read and agreed to the published version of the manuscript.
Funding
This research received no external funding.
Conflicts of Interest
The authors declare no conflicts of interest.
Appendix A. Survey Questions
The complete NRVA questionnaires are available at https://sites.google.com/tamu.edu/chengcheng-fei/research?authuser=1.
Appendix B. Reference of Food Security Indicator Construction

Table A1.
Recommended Dietary Allowances (RDAs) and adjustment index for calories and protein intake.
Table A1.
Recommended Dietary Allowances (RDAs) and adjustment index for calories and protein intake.
| Age | Calories (kCal) | Protein (g) | Calories Index | |
|---|---|---|---|---|
| Infants | 0.0–0.5 | 650 | 13 | 0.255 |
| 0.5–1.0 | 850 | 14 | 0.333 | |
| Children | 1–3 | 1300 | 16 | 0.510 |
| 4–6 | 1800 | 24 | 0.706 | |
| 7–10 | 2000 | 28 | 0.784 | |
| Males | 11–14 | 2500 | 45 | 0.980 |
| 15–18 | 3000 | 59 | 1.176 | |
| 19–24 | 2900 | 58 | 1.137 | |
| 25–50 | 2900 | 63 | 1.137 | |
| 51+ | 2300 | 63 | 0.902 | |
| Females | 11–14 | 2200 | 46 | 0.863 |
| 15–18 | 2200 | 44 | 0.863 | |
| 19–24 | 2200 | 46 | 0.863 | |
| 25–50 | 2200 | 50 | 0.863 | |
| 51+ | 1900 | 50 | 0.745 |
Data Source: RDAs refer to Recommended Dietary Allowances: 10th Edition (National Research Council (US) 1989). The index was calculated by the authors based on the RDA level for each group.
Appendix C. Questions and Responses to Categorical Variables to Split the Nodes in the Decision Tree
- Questions:
q_2_2: What is the major construction material of the exterior walls of dwelling, in the main living area of the family?
q_2_5: When was this dwelling built?
q_2_9: How did you acquire this current dwelling or what is your occupancy status?
q_2_10: Do you have any document that shows ownership of this dwelling?
q_2_15: What kind of kitchen/cooking facilities does this dwelling have?
q_2_21_1b: During this past 30 days, how many days on average has electricity from electric grid been supplied to your household?
q_2_23: In the past 30 days, what has been the household’s main source of cooking fuel?
q_2_29: Is your dwelling connected to a sewage system?
q_2_34: How many minutes does it take to walk, one way, to the main source of water? If do not have to walk, put ‘0’
q_2_36: Are you able to access this main water source whenever you want?
q_3_5_f: Which household member mainly manage goats?
q_4_10: How many jeribs of irrigated land did you or your household rent out during the most recent summer cultivation season?
q_4_15_1: What were the first important crops you harvested in the last summer cultivation season?
q_4_15_2: What were the second important crops you harvested in the last summer cultivation season?
q_4_15_3: What were the third important crops you harvested in the last summer cultivation season?
q_4_16: What was the main source of irrigation for the majority of the irrigated land you cultivated during the summer cultivation season?
q_5_1_5: How many Radio machine does your household own?
q_5_8_3: According to the current prices, how much do you think you could get if you sold all of gilim, satrangi, namad, fash (other carpet production)?
q_5_17: What was the main use of the largest loan taken in the last year?
q_5_26: If your household had to borrow money in the future, who is the first source you would borrow from?
q_8_1_1: What are your household’s income generating activities in order of importance (first order)?
q_10_4: Why did none of your household members participate in any cash-for-work programme or income generating programme or projects during the past 12 months? Mark one main reason
q_10_11: Why did none of your household members participate in any food aid programmes during the past 12 months? Mark one main reason
q_12_4: What has the household spent in the last 30 days for matches?
q_12_7: What has the household spent in the last 30 days for shampoo?
q_12_9: What has the household spent in the last 30 days for personal grooming (haircuts, etc) for males?
q_12_11: What has the household spent in the last 30 days for laundry charges?
q_12_16: What has the household spent in the last 30 days for transportation fare–bus and taxis?
q_12_21: What has the household spent in the last 30 days for medicines?
q_12_27: What has the household spent in the last 30 days for other stationery?
q_12_38: What has the household spent in the last 30 days for Annual celebrations and charitable donations?
q_12_40: Of all the rice consumed by the household the last 12 months, what percentage was imported rice?
q_13_6: How often in the last year did you have problems satisfying the food needs of the household?
q_16_3_1: Have you heard about iodized salt from radio?
q_16_5: Could I see the original salt bag of packages?
q_16_6: We would like to check whether the salt used in your household is iodized. May I see a small sample of the salt used for cooking? [interviewer: conduct salt test with the kit provided to you]
q_16_7: How would you compare the overall economic situation of the household with 1 year ago?
q_16_8: How often in the last year did you have problems satisfying the food needs of the household?
q_16_11: Have you heard of a disease that can be transmitted from birds to humans?
q_16_14: What has the household spent in the last 12 months for Tahwiz/Shoyest (talismans for health)? (asked in the female questionnaire)
V1 = Effective Household Size.
V2 = Effective Household Size.
V3 = Income per Cap.
V4 = q_2_21_1b.
V5 = Effective Household Size.
- Responses of categorical variables to split the nodes:
Set S1 = [Mortgaging land/house].
Set S2 = [Concrete, Fired brick/stone, Other (specify)].
Set S3 = [Agricultural wage labor (Non Opium), Crop production for home consumption, Miller, Other Government benefits, Other wage labor, Pension, Prod & sales of cash crops (except Opium), Production & sale of opium, Remittances from family members living permanently away, Rental income, Sale of food aid].
Set S4 = [Same, Slightly better, Slightly worse].
Set S5 = [2 -< 5 years ago, 20 - <30 years ago, More than 30 years ago, less than 2 years ago].
Set S6 = [Cooking room separate outside of dwelling, Kitchen is part of another room within dwelling].
Set S7 = [Agricultural wage labor (Non Opium), Begging, Crop production for home consumption, Other wage labor, Pension, Petty trade/ shop keeping, Prod & sales of orchard products, Salary/Government job/Teacher/NGO/UN, Skilled labor, Taxi/transport].
Set S8 = [NA, Yes, deed (registered)].
Set S9 = [Household members were not selected by project manager, No program in area].
Set S10 = [Agricultural wage labor (Non Opium), Borrowing, Crop production for home consumption, Military service, Other (specify), Petty trade/ shop keeping, Prod & sales of cash crops (except Opium), Prod & sales of livestock & products, Prod & sales of orchard products, Shepherding, Skilled labor, Small business].
Set S11 = [Begging, Crop production for home consumption, Handicrafts (sewing, embroidery, etc.), Other (specify), Other wage labor, Pension, Prod & sales of cash crops (except Opium), Prod & sales of livestock & products, Prod & sales of orchard products, Production & sale of field crops, Salary/Government job/Teacher/NGO/UN, Shepherding, Taxi/transport].
Set S12 = [Other (specify), Other wage labor, Prod & sales of livestock & products, Prod & sales of orchard products, Shepherding].
Set S13 = [Much better, Same, Slightly better].
Set S14 = [Begging, Borrowing, Handicrafts (sewing, embroidery, etc.), Military service, Miller, Other wage labor, Prod & sales of livestock & products, Production & sale of field crops, Rental income, Salary/Government job/Teacher/NGO/UN, Sale of food aid, Shepherding, Small business, Taxi/transport].
Set S15 = [Barley, Eggplant, Flax, Melon/ Watermelon, NA, Potatoes].
Set S16 = [Barley, Maize/ Sorghum, Onions, Other (specify), Potatoes, Tomato, Wheat].
Set S17 = [2, 3, 5].
Set S18 = [No color change].
Set S19 = [Agricultural wage labor (Non Opium), Cross border trade, Livestock production for home consumption, Miller, Opium wage labor, Other Government benefits, Prod & sales of cash crops (except Opium), Prod & sales of orchard products, Production & sale of field crops, Production & sale of opium, Remittances from seasonal migrants, Rental income].
Set S20 = [Household members not selected by Male shura, Not selected by project manager].
Set S21 = [Alfalfa/clover/other fodder, Barley, Beans, Flax, Kourgit, Millet, Opium].
Set S22 = [Eggplant, Maize/ Sorghum, Melon/ Watermelon, NA, Other (specify)].
Set S23 = [Alfalfa/clover/other fodder, Barley, Eggplant, Melon/ Watermelon, NA, Okra, Other (specify)].
Set S24 = [Bride price/ wedding, Construction other than home, Food purchases, House rental/ Rental advance, Opium cultivation].
Set S25 = [Much better, Same, Slightly better].
Set S26 = [Absialab, snow melt, flood, Irrigated-river, canal, dam, Kariz fed, Spring fed].
Set S27 = [Alfalfa/clover/other fodder, Beans, Kourgit, Melon/ Watermelon, NA, Opium, Rice, Wheat].
Set S28 = [Begging, Military service, Mining, NA, Other (specify), Prod & sales of livestock & products, Salary/Government job/Teacher/NGO/UN, Skilled labor, Taxi/transport].
Set S29 = [Family uses rock salt, Saw original salt package not labeled iodized].
Set S30 = [Handicrafts (sewing, embroidery, etc.), NA, Other wage labor, Petty trade/ shop keeping, Remittances from family members living permanently away, Salary/Government job/Teacher/NGO/UN, Skilled labor].
Set S31 = [Borrowing, Carpet weaving, Firewood /charcoal sales, Handicrafts (sewing, embroidery, etc.), Military service, Other (specify), Skilled labor, Small business, Taxi/transport].
Set S32 = [Constructed dwelling, Other (specify), Relative or friend of owner].
Set S33 = [Crop production for home consumption, Other wage labor, Remittances from family members living permanently away, Salary/Government job/Teacher/NGO/UN, Skilled labor, Small business].
Set S34 = [Agricultural inputs, Construction other than home, Funeral, Haj, Land purchase, NA, Private business investment].
Set S35 = [I don’t know, No, Yes, deed (registered)].
Set S36 = [Animal dung, Bushes (ping)/ twigs, branches, Other (specify)].
References
- von Grebmer, K.; Ruel, M.T.; Menon, P.; Nestorova, B.; Olofinbiyi, T.; Fritschel, H.; Yohannes, Y.; von Oppeln, C.; Towey, O.; Golden, K.; et al. Global Hunger Index 2010. In The Challenge of Hunger, Focus on the Crisis of Child Undernutrition; CABI: Wallingford, UK, 2010. [Google Scholar]
- Von Grebmer, K.; Bernstein, J.; de Waal, A.; Prasai, N.; Yin, S.; Yohannes, Y. 2015 Global Hunger Index: Armed Conflict and the Challenge of Hunger; International Food Policy Research Institute: Washington, DC, USA, 2015. [Google Scholar]
- Jain, R. Afghanistan’s Poverty Rate Rises as Economy Suffers. 2018. Available online: https://www.reuters.com/article/us-afghanistan-economy-idUSKBN1I818X (accessed on 12 August 2018).
- Hossain, M.; Mullally, C.; Asadullah, M.N. Alternatives to calorie-based indicators of food security: An application of machine learning methods. Food Policy 2019, 84, 77–91. [Google Scholar] [CrossRef]
- Lobell, D.B.; Burke, M.B.; Tebaldi, C.; Mastrandrea, M.D.; Falcon, W.P.; Naylor, R.L. Prioritizing Climate Change Adaptation Needs for Food Security in 2030. Science 2008, 319, 607–610. [Google Scholar] [CrossRef] [PubMed]
- D’Souza, A.; Jolliffe, D. Rising Food Prices and Coping Strategies: Household-Level Evidence from Afghanistan; The World Bank: Washington, DC, USA, 2010. [Google Scholar]
- Ye, L.; Xiong, W.; Li, Z.; Yang, P.; Wu, W.; Yang, G.; Fu, Y.; Zou, J.; Chen, Z.; Van Ranst, E.; et al. Climate change impact on China food security in 2050. Agron. Sustain. Dev. 2013, 33, 363–374. [Google Scholar] [CrossRef] [Green Version]
- D’Souza, A.; Jolliffe, D. Food Insecurity in Vulnerable Populations: Coping with Food Price Shocks in Afghanistan. Am. J. Agric. Econ. 2014, 96, 790–812. [Google Scholar] [CrossRef] [Green Version]
- Porter, J.R.; Xie, L.; Challinor, A.J.; Cochrane, K.; Howden, S.M.; Iqbal, M.M.; Lobell, D.B.; Travasso, M.I. Chapter 7: Food Security and Food Production Systems. In Climate Change 2014: Impacts, Adaptation, and Vulnerability. Part A: Global and Sectoral Aspects. Contribution of Working Group II to the Fifth Assessment Report of the Intergovernmental Panel on Climate Change; Cambridge University Press: Cambridge, UK, 2014; pp. 485–533. [Google Scholar]
- Altman, M.; Hart, T.; Jacobs, P. Food security in South Africa; Centre for Poverty, Employment and Growth: Cape Town, South Africa, 2010. [Google Scholar]
- Mwebaze, E.; Okori, W.; Quinn, J.A. Causal Structure Learning for Famine Prediction. In Proceedings of the AAAI Spring Symposium: Artificial Intelligence for Development, Stanford, CA, USA, 22–24 March 2010. [Google Scholar]
- Weiser, S.D.; Young, S.L.; Cohen, C.R.; Kushel, M.B.; Tsai, A.C.; Tien, P.C.; Hatcher, A.M.; Frongillo, E.A.; Bangsberg, D.R. Conceptual framework for understanding the bidirectional links between food insecurity and HIV/AIDS. Am. J. Clin. Nutr. 2011, 94, 1729S–1739S. [Google Scholar] [CrossRef]
- Lokosang, L.B.; Ramroop, S.; Hendriks, S.L. Establishing a robust technique for monitoring and early warning of food insecurity in post-conflict South Sudan using ordinal logistic regression. Agrekon 2011, 50, 101–130. [Google Scholar] [CrossRef] [Green Version]
- Hoddinott, J. Choosing Outcome Indicators of Household Food Security; Citeseer: Princeton, NJ, USA, 1999. [Google Scholar]
- Arene, C.J.; Anyaeji, R.C. Determinants of food security among households in Nsukka Metropolis of Enugu State, Nigeria. Pak. J. Soc. Sci. 2010, 30, 9–16. [Google Scholar]
- Maharjan, K.L.; Joshi, N.P. Determinants of household food security in Nepal: A binary logistic regression analysis. J. Mt. Sci. 2011, 8, 403–413. [Google Scholar] [CrossRef] [Green Version]
- Aidoo, R.; Mensah, J.O.; Tuffour, T. Determinants of household food security in the Sekyere-Afram plains district of Ghana. Eur. Sci. J. 2013, 9, 514–521. [Google Scholar]
- Ifeoma, I.; Agwu, A. Assessment of food security situation among farming households in rural areas of Kano state, Nigeria. J. Cent. Eur. Agric. 2014, 15, 94–107. [Google Scholar] [CrossRef]
- Zhou, D.; Shah, T.; Ali, S.; Ahmad, W.; Din, I.U.; Ilyas, A. Factors affecting household food security in rural northern hinterland of Pakistan. J. Saudi Soc. Agric. Sci. 2019, 18, 201–210. [Google Scholar]
- Wooldridge, J.M. Introductory Econometrics: A Modern Approach; Nelson Education: Toronto, ON, Canada, 2016. [Google Scholar]
- Magombeyi, M.T.; Odhiambo, N.M. Causal relationship between FDI and poverty reduction in South Africa. Cogent Econ. Financ. 2017, 5, 1357901. [Google Scholar] [CrossRef]
- Kourou, K.; Exarchos, T.P.; Exarchos, K.P.; Karamouzis, M.V.; Fotiadis, D.I. Machine learning applications in cancer prognosis and prediction. Comput. Struct. Biotechnol. J. 2015, 13, 8–17. [Google Scholar] [CrossRef] [PubMed] [Green Version]
- Tan, A.C.; Gilbert, D. Ensemble machine learning on gene expression data for cancer classification. Appl. Bioinform. 2003, 2, S75–S83. [Google Scholar]
- Brown, I.; Mues, C. An experimental comparison of classification algorithms for imbalanced credit scoring data sets. Expert Syst. Appl. 2012, 39, 3446–3453. [Google Scholar] [CrossRef] [Green Version]
- Khandani, A.E.; Kim, A.J.; Lo, A.W. Consumer credit-risk models via machine-learning algorithms. J. Bank. Financ. 2010, 34, 2767–2787. [Google Scholar] [CrossRef] [Green Version]
- Loh, W.-Y. Classification and regression trees. Wires Data Min. Knowl. Discov. 2011, 1, 14–23. [Google Scholar] [CrossRef]
- Loh, W.-Y. Variable Selection for Classification and Regression in Large p, Small n Problems. In Probability Approximations and Beyond; Barbour, A., Chan, H.P., Siegmund, D., Eds.; Springer: New York, NY, USA, 2012; pp. 135–159. [Google Scholar]
- Barbosa, R.M.; Nelson, D.R. The Use of Support Vector Machine to Analyze Food Security in a Region of Brazil. Appl. Artif. Intell. 2016, 30, 318–330. [Google Scholar] [CrossRef]
- Loh, W.-Y. Regression tress with unbiased variable selection and interaction detection. Stat. Sin. 2002, 12, 361–386. [Google Scholar]
- Loh, W.-Y. Improving the precision of classification trees. Ann. Appl. Stat. 2009, 3, 1710–1737. [Google Scholar] [CrossRef] [Green Version]
- Loh, W.-Y. Classification and Regression Tree Methods. In Wiley StatsRef: Statistics Reference Online; American Cancer Society: New York, NY, USA, 2014. [Google Scholar]
- Hastie, T.; Tibshirani, R.; Friedman, J. The Elements of Statistical Learning: Data Mining, Inference, and Prediction; Springer: New York, NY, USA, 2001. [Google Scholar]
- Padmaja, T.M.; Dhulipalla, N.; Bapi, R.S.; Krishna, P.R. Unbalanced data classification using extreme outlier elimination and sampling techniques for fraud detection. In Proceedings of the 15th International Conference on Advanced Computing and Communications (ADCOM 2007), Guwahati, India, 18–21 December 2007; pp. 511–516. [Google Scholar]
- Bhowan, U.; Johnston, M.; Zhang, M.; Yao, X. Evolving Diverse Ensembles Using Genetic Programming for Classification With Unbalanced Data. Ieee Trans. Evol. Comput. 2013, 17, 368–386. [Google Scholar] [CrossRef] [Green Version]
- Central Statistics Organization (Afghanistan). National Risk and Vulnerability Assessment 2007–2008; Central Statistics Organization: Kabul, Afghanistan, 2008. [Google Scholar]
- US Department of Agriculture Agricultural Research Service: Food Composition Databases. Available online: https://ndb.nal.usda.gov/ndb/search/list (accessed on 12 August 2018).
- National Research Council (US). Recommended Dietary Allowances, 10th ed.; National Academies Press (US): Washington, DC, USA, 1989. [Google Scholar]
- Abdula, R.D. Computable General Equilibrium Analysis of the Economic and Land-use Interfaces of Bio-energy Development. Presented at the 2006 Annual Meeting of the International Association of Agricultural Economists, Queensland, Australia, 12 August 2006. [Google Scholar]
- Carter, P.M.R.; Barrett, C.B. The economics of poverty traps and persistent poverty: An asset-based approach. J. Dev. Stud. 2006, 42, 178–199. [Google Scholar] [CrossRef] [Green Version]
- Mammen, S.; Bauer, J.W.; Richards, L. Understanding Persistent Food Insecurity: A Paradox of Place and Circumstance. Soc. Indic. Res. 2008, 92, 151. [Google Scholar] [CrossRef] [Green Version]
- Loh, W.-Y.; He, X.; Man, M. A regression tree approach to identifying subgroups with differential treatment effects. Stat. Med. 2015, 34, 1818–1833. [Google Scholar] [CrossRef] [Green Version]
Figure 1.
Pruned decision tree (left branches). Note: The figures portray the classification tree. At each split, an observation goes to the left branch if and only if the node question is satisfied. For splits on categorical variables, the responses presented in the split set (e.g., S1, S2) go to the left. Predicted classes and sample sizes are printed below the terminal nodes; class proportions for the food security indicator = I (food-insecure) and S (food-secure) are beside the nodes.

Figure 2.
Pruned decision tree (right branches). Note: The figures portray the classification tree. At each split, an observation goes to the left branch if and only if the node question is satisfied. For splits on categorical variables, the responses presented in the split set (e.g., S1, S2) go to the left. Predicted classes and sample sizes are printed below the terminal nodes; the class proportions for food security indicator = I (food-insecure) and S (food-secure) are beside the nodes.

Figure 3.
The association of food security with the income per capita and annual celebrations and charitable donations (q_12_38) separated by money borrowing sources (q_5_26). Note: This figure shows the intuition of the first split from the model. The majority of the households having to mortgage their house or land for money borrowing have a food security problem. For other categories of q_5_26, the two classes of food security are messy. This figure is produced with uninflated data, so that each dot represents a household without compounding by its weight.

Table 1.
Summary statistics of the 15 most important numeric variables aggregated by the food security index group.
Table 1.
Summary statistics of the 15 most important numeric variables aggregated by the food security index group.
| ---------------Food Insecure Households ----------- | ------------Food Secure Households------------- | |||||||
|---|---|---|---|---|---|---|---|---|
| Mean | Standard Deviation | Minimum | Maximum | Mean | Standard Deviation | Minimum | Maximum | |
| Number of observations | 913,470 | 2,512,975 | ||||||
| Celebration/Donation Expenditures | 2045 | 5307 | 0 | 100,000 | 290 | 6374 | 0 | 200,000 |
| Income per Capita | 12,928 | 11,740 | 125 | 215,517 | 16,977 | 18,427 | 0.86 | 600,000 |
| Matches Expenditure | 21 | 16 | 0 | 200 | 24 | 19 | 0 | 900 |
| Effective Household Size | 7 | 3 | 1 | 22 | 6 | 3 | 1 | 28 |
| Fuel Oil Expenditure | 152 | 211 | 0 | 8600 | 193 | 269 | 0 | 9999 |
| Doctor Expenditure | 648 | 1791 | 0 | 90,000 | 814 | 1722 | 0 | 100,000 |
| Medicines Expenditure | 4813 | 8632 | 0 | 320,000 | 6185 | 15,404 | 0 | 999,999 |
| UREA Fertilizer Usage | 139 | 168 | 0 | 999 | 206 | 225 | 0 | 999 |
| DAP Fertilizer Usage | 87 | 116 | 0 | 999 | 130 | 163 | 0 | 999 |
| Shampoo Expenditure | 57 | 65 | 0 | 900 | 68 | 76 | 0 | 1800 |
| Other Misc Expenditure | 636 | 1189 | 0 | 12,000 | 921 | 1710 | 0 | 60,000 |
| Expense on Talismans | 125 | 534 | 0 | 20,000 | 304 | 1294 | 0 | 60,000 |
| School Supplies Expenditure | 180 | 332 | 0 | 5000 | 170 | 427 | 0 | 9000 |
| Soap Expenditure | 35 | 41 | 0 | 700 | 41 | 60 | 0 | 3000 |
| Distance to 2nd Water Source | 12 | 17 | 0 | 240 | 15 | 29 | 0 | 480 |
Note: This table shows the summary statistics for the top 15 most important numeric variables in the dataset. The importance is determined by the importance scores calculated later. All the monetary variables are in Afghanistan currency, Afghanis. The distance to a second water source is measured in minutes of walking. Celebration expenditure, doctor’s fee, medicine expenditure, expense on talismans, and school supplies expenditure are measured annually. All other expenditures are measured for the past 30 days. Fertilizer usages are measured in KG.
Table 2.
Recall rates for different model forms between the training and testing datasets.
| Decision Tree | Decision Tree (with 100 Variables) | Random Forest | |
|---|---|---|---|
| Training Sample Recall Rate | 80% | 81% | 82% |
| Testing Sample Recall Rate | 79% | 79% | 80% |
Table 3.
List of the top 15 most important variables.
| Variable | Question Number | Example of Answers | Rank | Importance Score |
|---|---|---|---|---|
| Primary Income Source for the Household | Q_8_1_1 | Crop production, Skilled Labor, Salary, Sale of Food Aid | 1 | 15,087 |
| Spending on Annual Celebrations and Charitable Donations | Q_12_38 | Amount in Afghanis | 2 | 14,841 |
| Income per Capita | Income_per_cap | Amount in Afghanis | 3 | 13,623 |
| Spending on Matches in Last 30 Days | Q_12_4 | Amount in Afghanis | 4 | 12,845 |
| Effective Household Size | EffecHHsize | Standard Index | 5 | 12,273 |
| Fuel Oil spending in Last 30 Days | Q_2_25_c | Amount in Afghanis | 6 | 10,283 |
| Shocks Not Specifically Listed | Q_13_1_32 | Yes (specify), No | 7 | 10,210 |
| Annual Expenditures on Doctors | Q_12_22 | Amount in Afghanis | 8 | 9779 |
| Material of the Exterior of Dwelling | Q_2_2 | Concrete, Wood, Mud | 9 | 9496 |
| Availability of Main Water Source | Q_2_36 | Always available, Usually available, Cannot access | 10 | 9175 |
| Was there a Food Problem Last Year (Female Questionnaire) | Q_16_8 | Never, Often, Mostly | 11 | 9028 |
| Times you had Food Problem Last Year (Male Questionnaire) | Q_13_6 | Rarely, Sometimes, Often | 12 | 8803 |
| First Source of Borrowed Money | Q_5_26 | Family, Landlord, Mortgaging house | 13 | 8672 |
| Reason why NOT in Food Aid Program | Q_10_11 | No program, Not aware, Not selected | 14 | 8482 |
| Annual Medicine Expenses | Q_12_21 | Amount in Afghanis | 15 | 8456 |
Note: This table shows the 15 most important household characteristics with their associated question numbers in the survey, examples of answers, and corresponding importance scores. Characteristics with higher importance scores are found to be important in food insecurity (FI) identification. Variables with importance scores of less than 1 are considered not to be important in FI identification. Please refer to the questionnaire for the complete questions and answers.
© 2020 by the authors. Licensee MDPI, Basel, Switzerland. This article is an open access article distributed under the terms and conditions of the Creative Commons Attribution (CC BY) license (http://creativecommons.org/licenses/by/4.0/).
Share and Cite
MDPI and ACS Style
Gao, C.; Fei, C.J.; McCarl, B.A.; Leatham, D.J. Identifying Vulnerable Households Using Machine Learning. Sustainability 2020, 12, 6002. https://0-doi-org.brum.beds.ac.uk/10.3390/su12156002
AMA Style
Gao C, Fei CJ, McCarl BA, Leatham DJ. Identifying Vulnerable Households Using Machine Learning. Sustainability. 2020; 12(15):6002. https://0-doi-org.brum.beds.ac.uk/10.3390/su12156002
Chicago/Turabian StyleGao, Chen, Chengcheng J. Fei, Bruce A. McCarl, and David J. Leatham. 2020. "Identifying Vulnerable Households Using Machine Learning" Sustainability 12, no. 15: 6002. https://0-doi-org.brum.beds.ac.uk/10.3390/su12156002
Note that from the first issue of 2016, this journal uses article numbers instead of page numbers. See further details here.