Article

Sustainable and Resilient Smart House Using the Internal Combustion Engine of Plug-in Hybrid Electric Vehicles

1
School of Electrical Engineering, Iran University of Science and Technology, Tehran 16846-13114, Iran
2
Department of Electrical Engineering, KU Leuven, 3001 Leuven, Belgium
3
School of Technology and Innovations, University of Vaasa, 65200 Vaasa, Finland
*
Authors to whom correspondence should be addressed.
Sustainability 2020, 12(15), 6046; https://0-doi-org.brum.beds.ac.uk/10.3390/su12156046
Submission received: 27 June 2020 / Revised: 22 July 2020 / Accepted: 25 July 2020 / Published: 28 July 2020
(This article belongs to the Special Issue Developing Multi-Energy Systems: Technologies, Methods and Models)

Abstract

:
Nowadays, due to the increasing number of disasters, improving distribution system resiliency is a new challenging issue for researchers. One of the main methods for improving the resiliency in distribution systems is to supply critical loads after disasters during the power outage and before system restorations. In this paper, a “Sustainable and resilient smart house” is introduced for the first time by using plug-in hybrid electric vehicles (PHEVs). PHEVs have the ability to use their fuel for generating electricity in emergency situations as the Vehicle to Grid (V2G) scheme. This ability, besides smart house control management, provides an opportunity for distribution system operators to use their extra energy for supplying a critical load in the system. The proposed control strategy in this paper is dedicated to a short duration power outage, which includes a large percent of the events. Then, improvement of the resiliency of distribution systems is investigated through supplying smart residential customers and injecting extra power to the main grid. A novel formulation is proposed for increasing the injected power of the smart house to the main grid using PHEVs. The effectiveness of the proposed method in increasing power injection during power outages is shown in simulation results.

1. Introduction

Disasters are inevitable and have become more frequent and intense because of recent climate changes. This leads to a considerable increase in power outage frequency and severity. Recent power outages occurring in the world, such as hurricane Sandy, which caused a power outage of about 7.5 million customers across Washington and 15 states, highlight the need to introduce a new concept as a resiliency which fulfils other power system issues such as reliability, security, risk, and stability in studying high impact low frequency (HILF) incidents. A lot of research effort is devoted to the resiliency concept—[1,2,3,4,5,6] describes the basic framework of it. Grid resilience has become increasingly critical because of the rising number of outages in disasters such as hurricanes, floods, blizzards, earthquakes, and other extreme events [7]. In a variety of different disasters, severe weather has the highest number of power outages. As shown in [8], weather disasters are involved in 87% of power outages in the United States. Moreover, distribution systems are usually more vulnerable to such kinds of events. For example, according to [8], about 90% of power outages in the United States occur in distribution systems. According to [9], “system resilience is the ability to prepare for and adapt to changing conditions, withstand, and recover rapidly from disruptions”. In other words, power system resiliency includes three major parts; prevention, survivability, and recovery. This paper attempts to introduce a method for increasing survivability capability by using plug-in hybrid electric vehicles (PHEVs) in distribution systems. Although some appliances are used as the power supply in emergency situations in residential areas such as diesel generators, uninterruptable power supply (UPS), and distributed generators, most of them are not cost effective and are costly to customers. Thus, these devices are not extensively used nowadays. Penetration of electric vehicles (EVs) is increasing considerably. The number of electric vehicles will reach 250 million by 2030, according to the International Energy Agency (IEA) [10]. The vehicle-to-grid (V2G) technology has the significant capability to provide power to the grid. With this technology, EVs provide cost effective solutions for supplying residential loads in emergency situations. Although distributed generation plays the main role in increasing the resiliency of the distribution systems, EVs can help beside them and provide a considerable amount of energy as back up generation. Noteworthy research has been carried out in the V2G concept. Authors in [11,12,13,14,15] consider voltage and frequency control through V2G. In [16,17,18], storage and renewable energy were studied with the integration of V2G concepts. Vehicle-to-home (V2H) is defined as a small version of V2G in supplying homes with the power of electric cars. It is to be noted that electric utilities are responsible for increasing the resiliency and decreasing the amount of outage as much as they can in the distribution systems. So, it is their responsibility to provide a situation and considerable incentives for EV owners in order to persuade them to participate as back up generation. Therefore, a sizeable amount of energy storage will be available for distribution system operators in order to improve the resiliency of the system.
There are few papers that consider PHEVs as a power source [19,20,21,22]. In [19,21], the concept of using PHEVs was introduced with integrating rooftop photovoltaic (PV). With the help of PHEVs’ battery, the off-grid operation of PV was enabled. In this case, the energy for supplying appliances in the house was obtained by PHEVs’ battery and onboard engine in addition to PV generation. It is to be noted that the house is completely isolated from the main grid because of the power outage. The fuel tank in PHEVs provides considerable energy back up in emergency situations. In [20], a smart strategy was introduced for controlling the battery and engine generator. The focus of this paper was on increasing back up duration and it did not consider the capability of smart houses. In [21], the optimized V2H system was presented for secure long back up duration to survive in the long power outage. In this paper, the onboard engine generator was modeled for solving optimization models. This paper also did not consider smart house capabilities. In [22], PHEVs and EVs were considered as a back-up energy supply in homes. The consumption of fuel was analyzed for different types of EVs and PHEVs. A building energy management system (BEMS) was used for decreasing the house consumption in emergency and extreme emergency situations.
The energy management system is essential in the future smart house. An energy scheduling method for a building to minimize the total energy cost has been presented in [23]. A load management system was presented in [24]. The problem of minimizing the sum of energy cost and thermal discomfort cost for a sustainable smart house with a ventilation, heating, and air conditioning load was investigated. The sub-aggregators involved in a residential complex, including a parking lot and a smart building, was presented in [25]. However, in the above papers, customers could set their loads by the price signal. Moreover, in the above papers, the role of PHEVs was also not considered in supporting back up energy in emergency conditions in the smart houses.
In the above papers, PHEVs were used for supplying the energy of houses in emergency conditions, assuming that houses were isolated from the main grid. In these papers, authors tried to increase the backup duration by smart management and tried to model the accurate consumption of gasoline. As explained in the next section, there are various kinds of disasters that cause short time outages and the power outage in these cases usually occurs within a period shorter than one day. In such situations, there is no need to increase back up duration; however, it is required to decrease the power outage of distribution systems as much as possible. Providing energy for loads is the main concern of distribution system operators. Many studies have been done on using available energy resources for increasing the resiliency and supplying the critical loads. Providing the energy resources is a challenge in the mentioned methods. Houses with the capability of V2G should be used to generate energy for both other customers and themselves. Thus, the aim, in this case, is to produce maximum energy and power to local distribution grids to energize other customers. Smart houses can have considerable effects on increasing produced energy. In this paper, we intend to present the model for sustainable smart houses that improve the resiliency of the system and fill the abovementioned gaps.
The contributions of this paper are:
  • Introducing a novel model for sustainable and resilient smart houses
  • Use of gasoline energy of PHEVs in smart house management
  • Use of smart houses for increasing power injected to distribution power systems in emergency situations
  • Considering the effect of residents’ comfort levels on the amount of energy production.
The rest of the paper is organized as follows: in Section 2, the capability of PHEVs is considered in using gasoline storage for generating energy. The motivation to use PHEVs is also explained in emergency situations. In Section 3, the V2G operation formulation is presented under power outage. Section 4 presents the simulations and the results are discussed in Section 5. Finally, in Section 6, we conclude the paper.

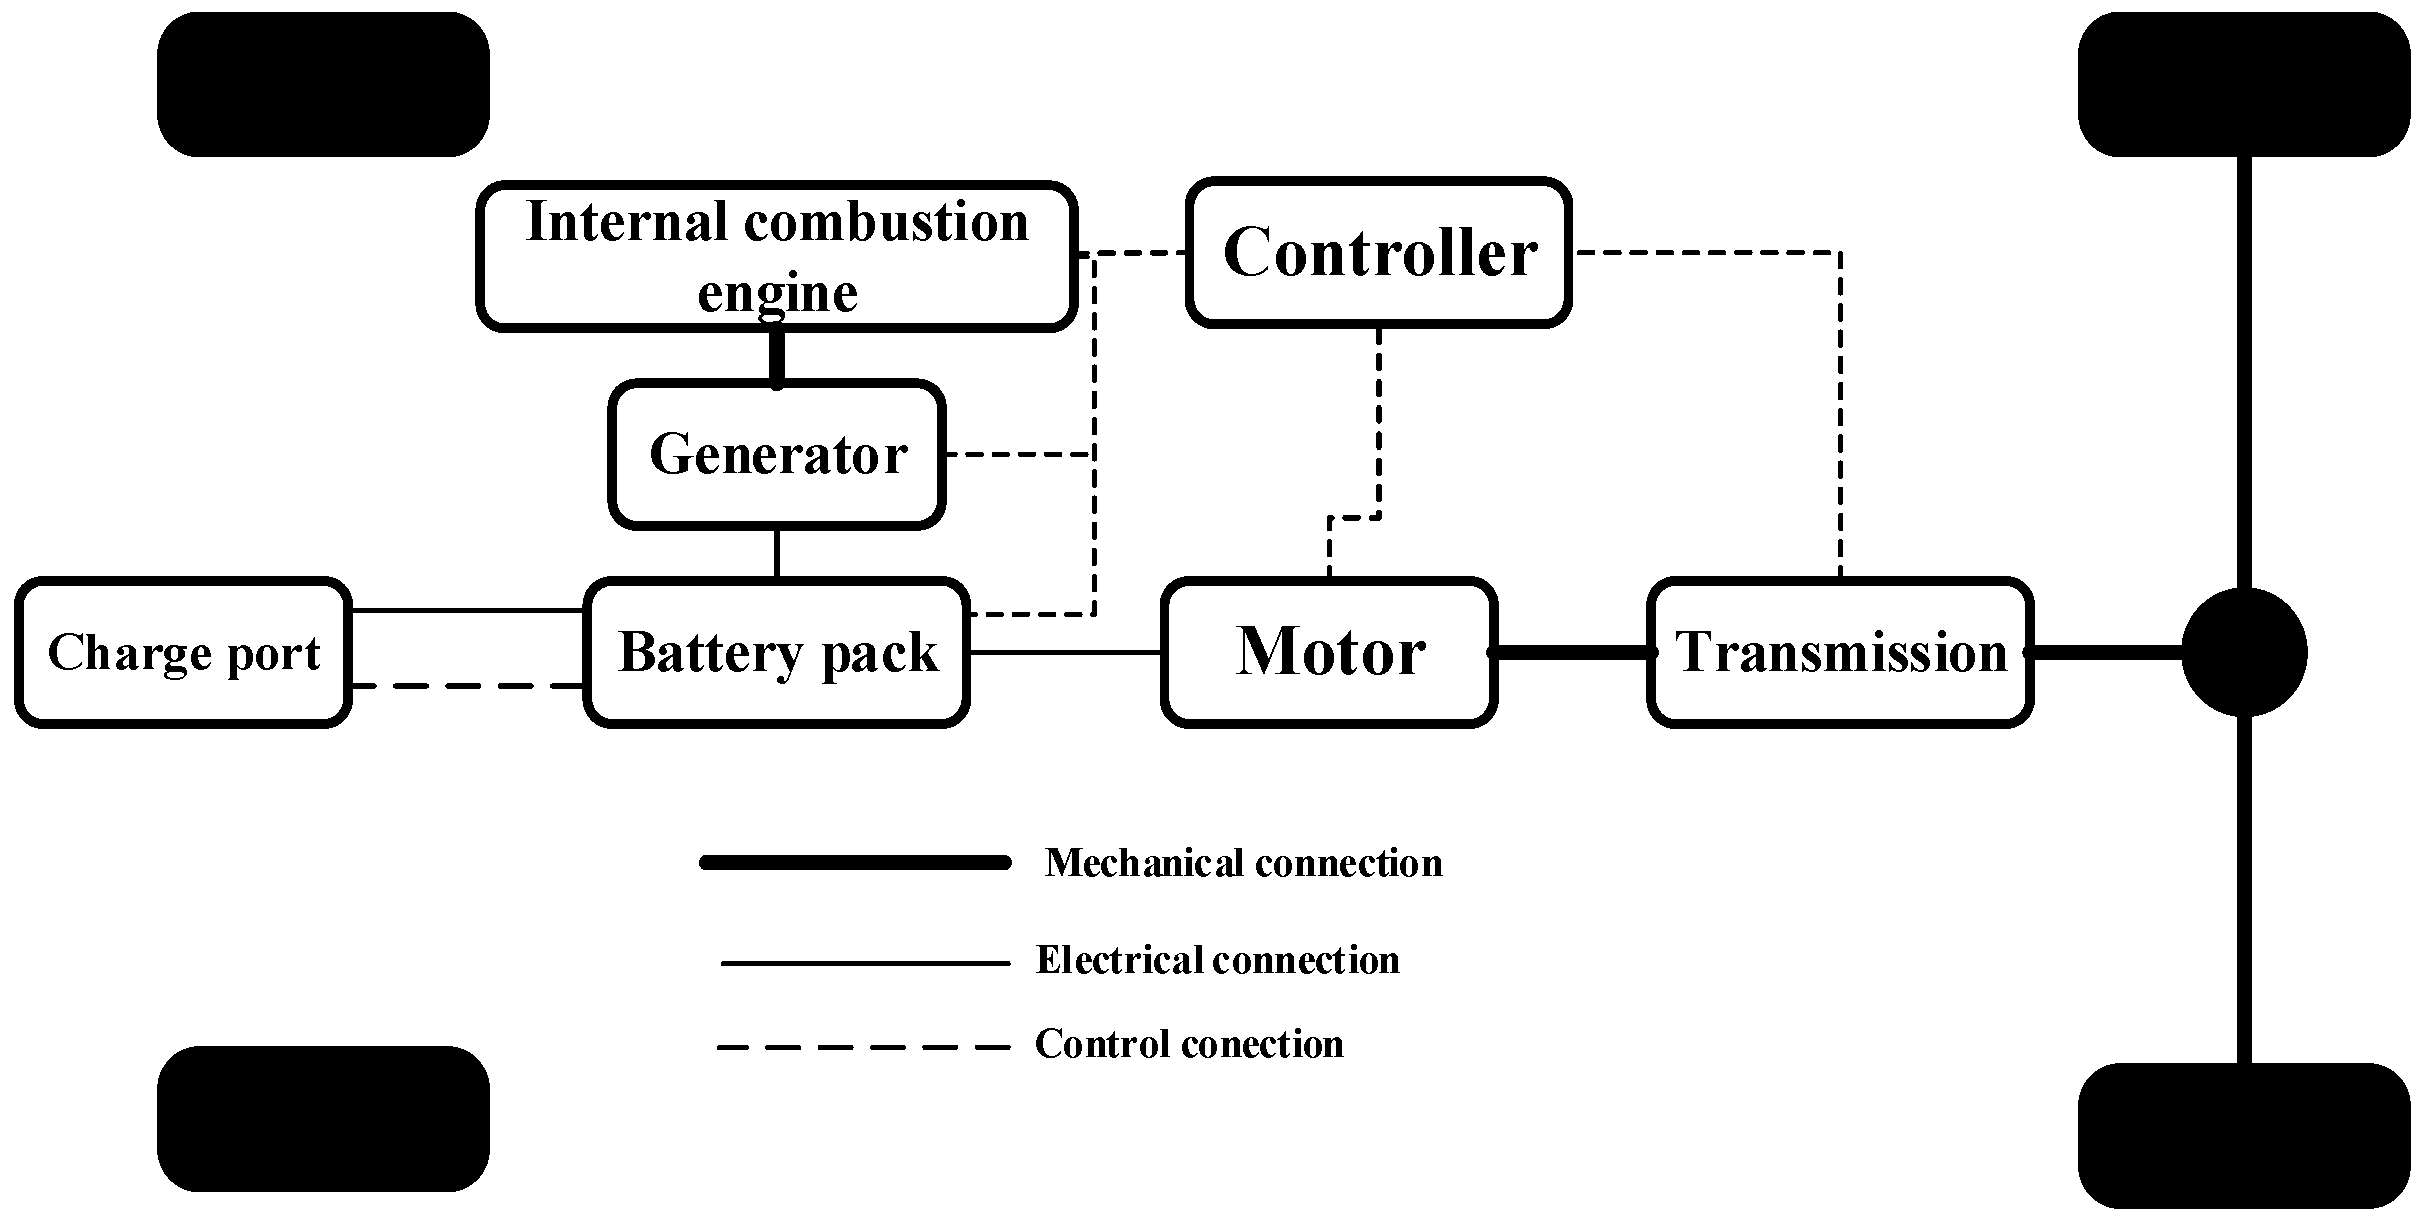
2. Plug-In Hybrid Electric Vehicles

PHEVs are vehicles that have both an electric motor and an internal combustion engine motor. They have rechargeable batteries that have the capability of being charged by external electric power sources. The battery capacity is usually larger than the one in conventional hybrid electric vehicles. Internal combustion engines provide energy for electric motor traction as power generation (according to the series hybrid mode) or provide energy for both the drive system and power generation (according to the parallel hybrid mode) [26]. In both modes, plug-in hybrid electric vehicles have the capability to charge the battery [26]. As depicted in Figure 1, PHEVs have engine generators that produce electric energy for charging the battery as well as for driving the electric motor and internal consumption of the car. The engine generator usually has an upper bound than the conventional alternator. For example, according to [20], the Mitsubishi PHEV Outlander has a 55 kW engine generator, which provides considerable energy for the electric system of the car.
In order to use PHEVs as back up generation, the V2G system, which includes a power electronic interface, must be used. There are some practical experiences in using PHEVs as backup power [27,28]. So, it is understood from the current practical experiences that this concept can be carried out in real situations. In these cases, it is assumed that only battery storage is used for supplying houses because of pollution constraints. The usual and practical methods for producing power in emergency situations are using a bidirectional level 2 charger or fast charging stations with the capability of the V2H system. Authors in [20] use an engine generator of PHEVs for producing energy. Although the range of power in the engine generator is considerably high, there is no standard way to deliver the energy of the engine generator to the main grid, making this method impractical nowadays. In this paper, we assume that the energy of PHEVs is delivered only through the standard plug and standard charging station. According to the above explanation, PHEVs and their fuel tank can be used as backup power in emergency situations. It is to be noted that the interaction between the EVs and the utilities is the same as V2G systems and the communication architecture is not changed.
In this paper, authors attempt to use PHEVs in providing backup energy in the smart house and introduce the “sustainable and resilient smart house” concept.
According to the study conducted in [1], weather-based disasters usually last shorter than one day and also can be predictable, as depicted in Table 1. Thus, strategies used for supplying power for house areas should be designed for this period. As explained in the previous section, PHEVs can be used as emergency backup power and minutes are needed to prepare the car for this purpose. The predictability of weather-based disasters gives us the needed time and there will be no problem for connecting PHEVs to V2G systems. In this paper, the proposed strategy is introduced for disasters that have short affecting time where the power system is restored quickly. It is to be noted that the affecting time is predictable by power system experts according to the level of damages occurring in distribution systems. The strategy chosen in this paper focuses on providing maximum power and energy to the main grid in addition to supplying the energy of house appliances during the power outage. In fact, the method introduced in this paper provides an energy source for the power system operator to restore the system faster than before and decrease power outage considerably. It is to be noted that it is assumed that the houses may be able to deliver the extra energy to the main grid. This situation occurs in an area that disasters destroy a part of distribution systems and other parts can work, and the main problem is providing energy for the house without power.

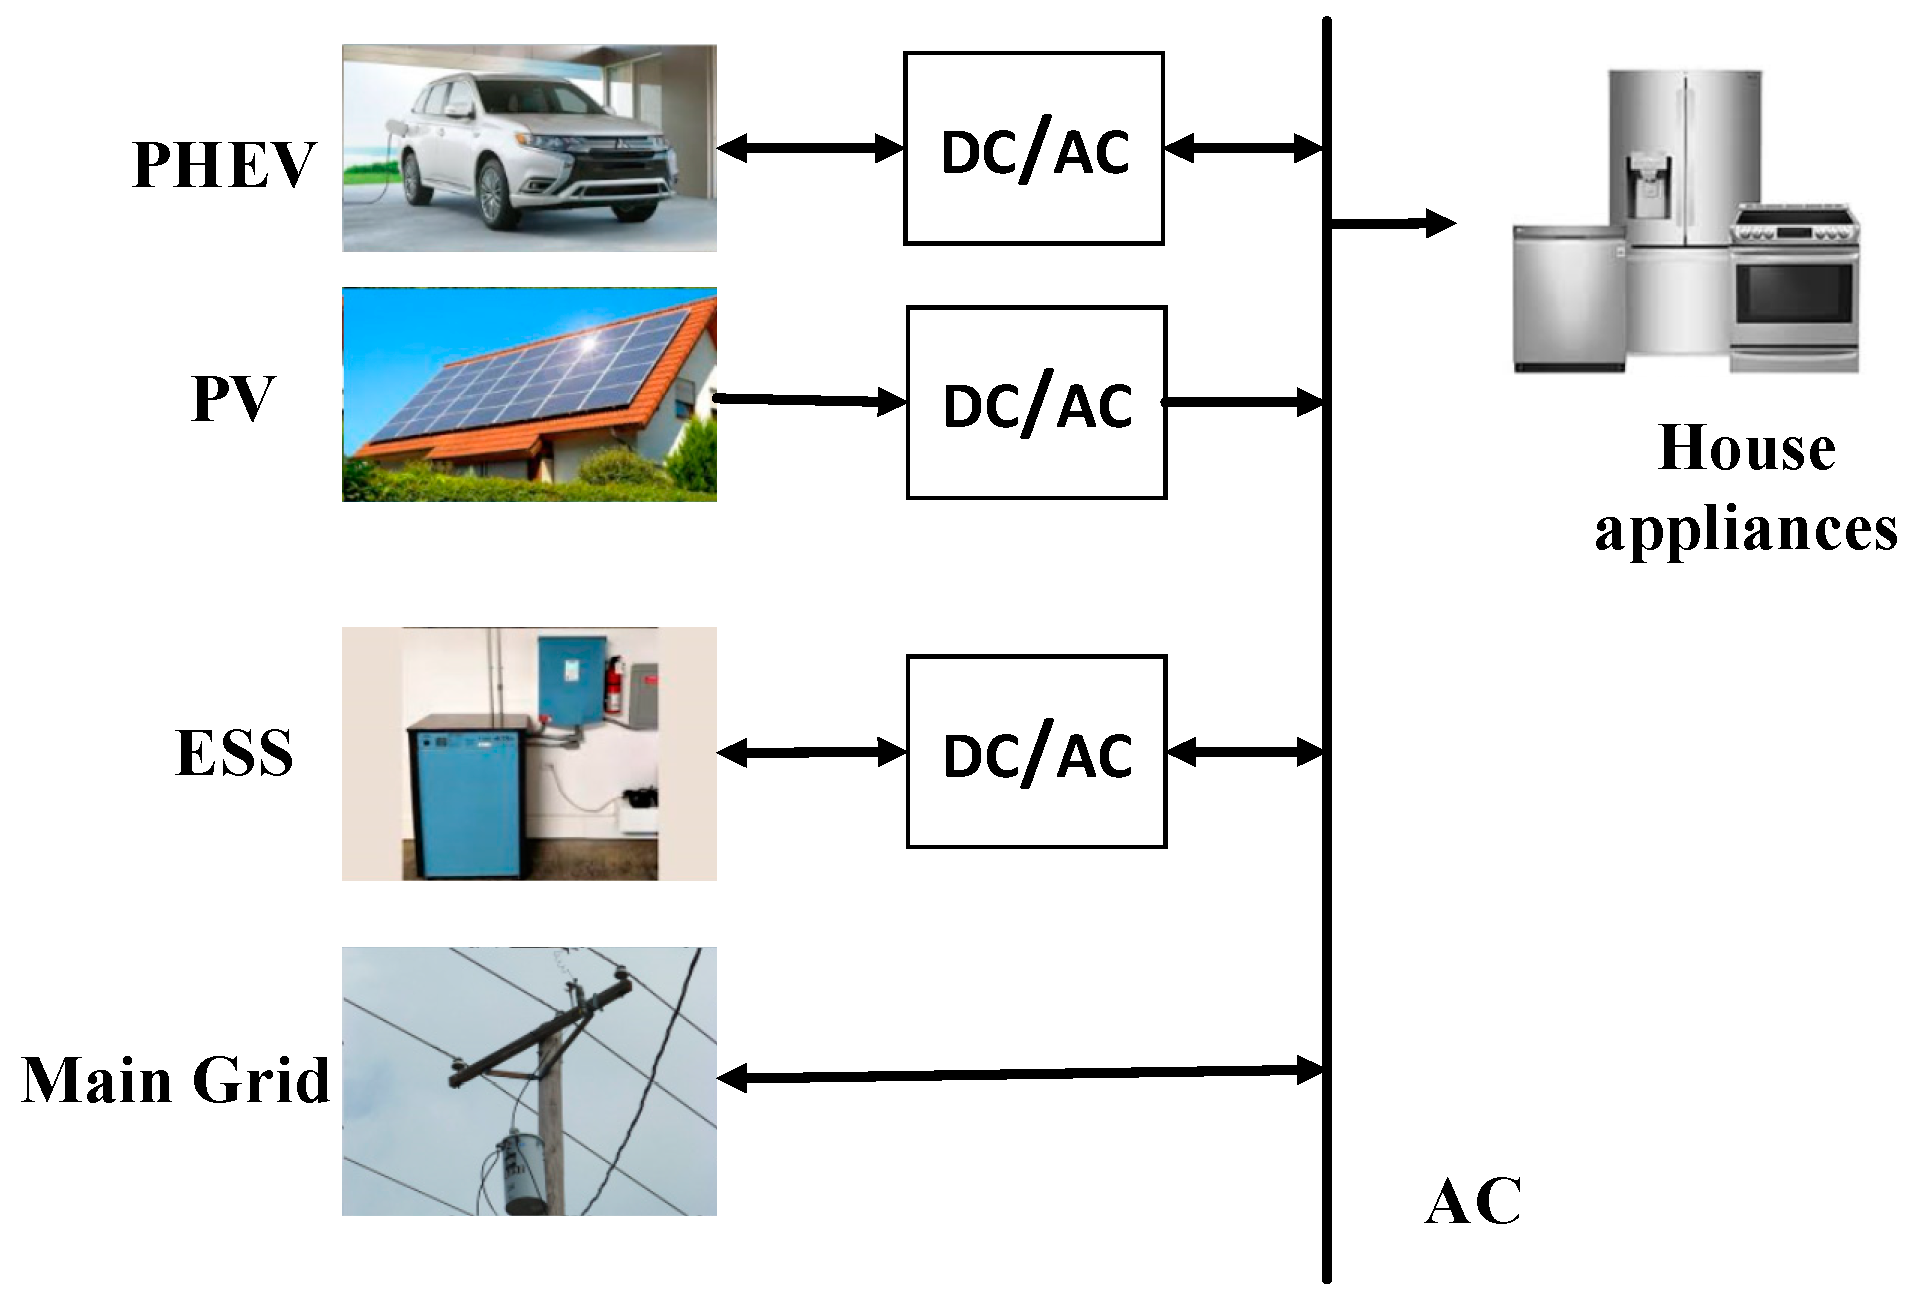
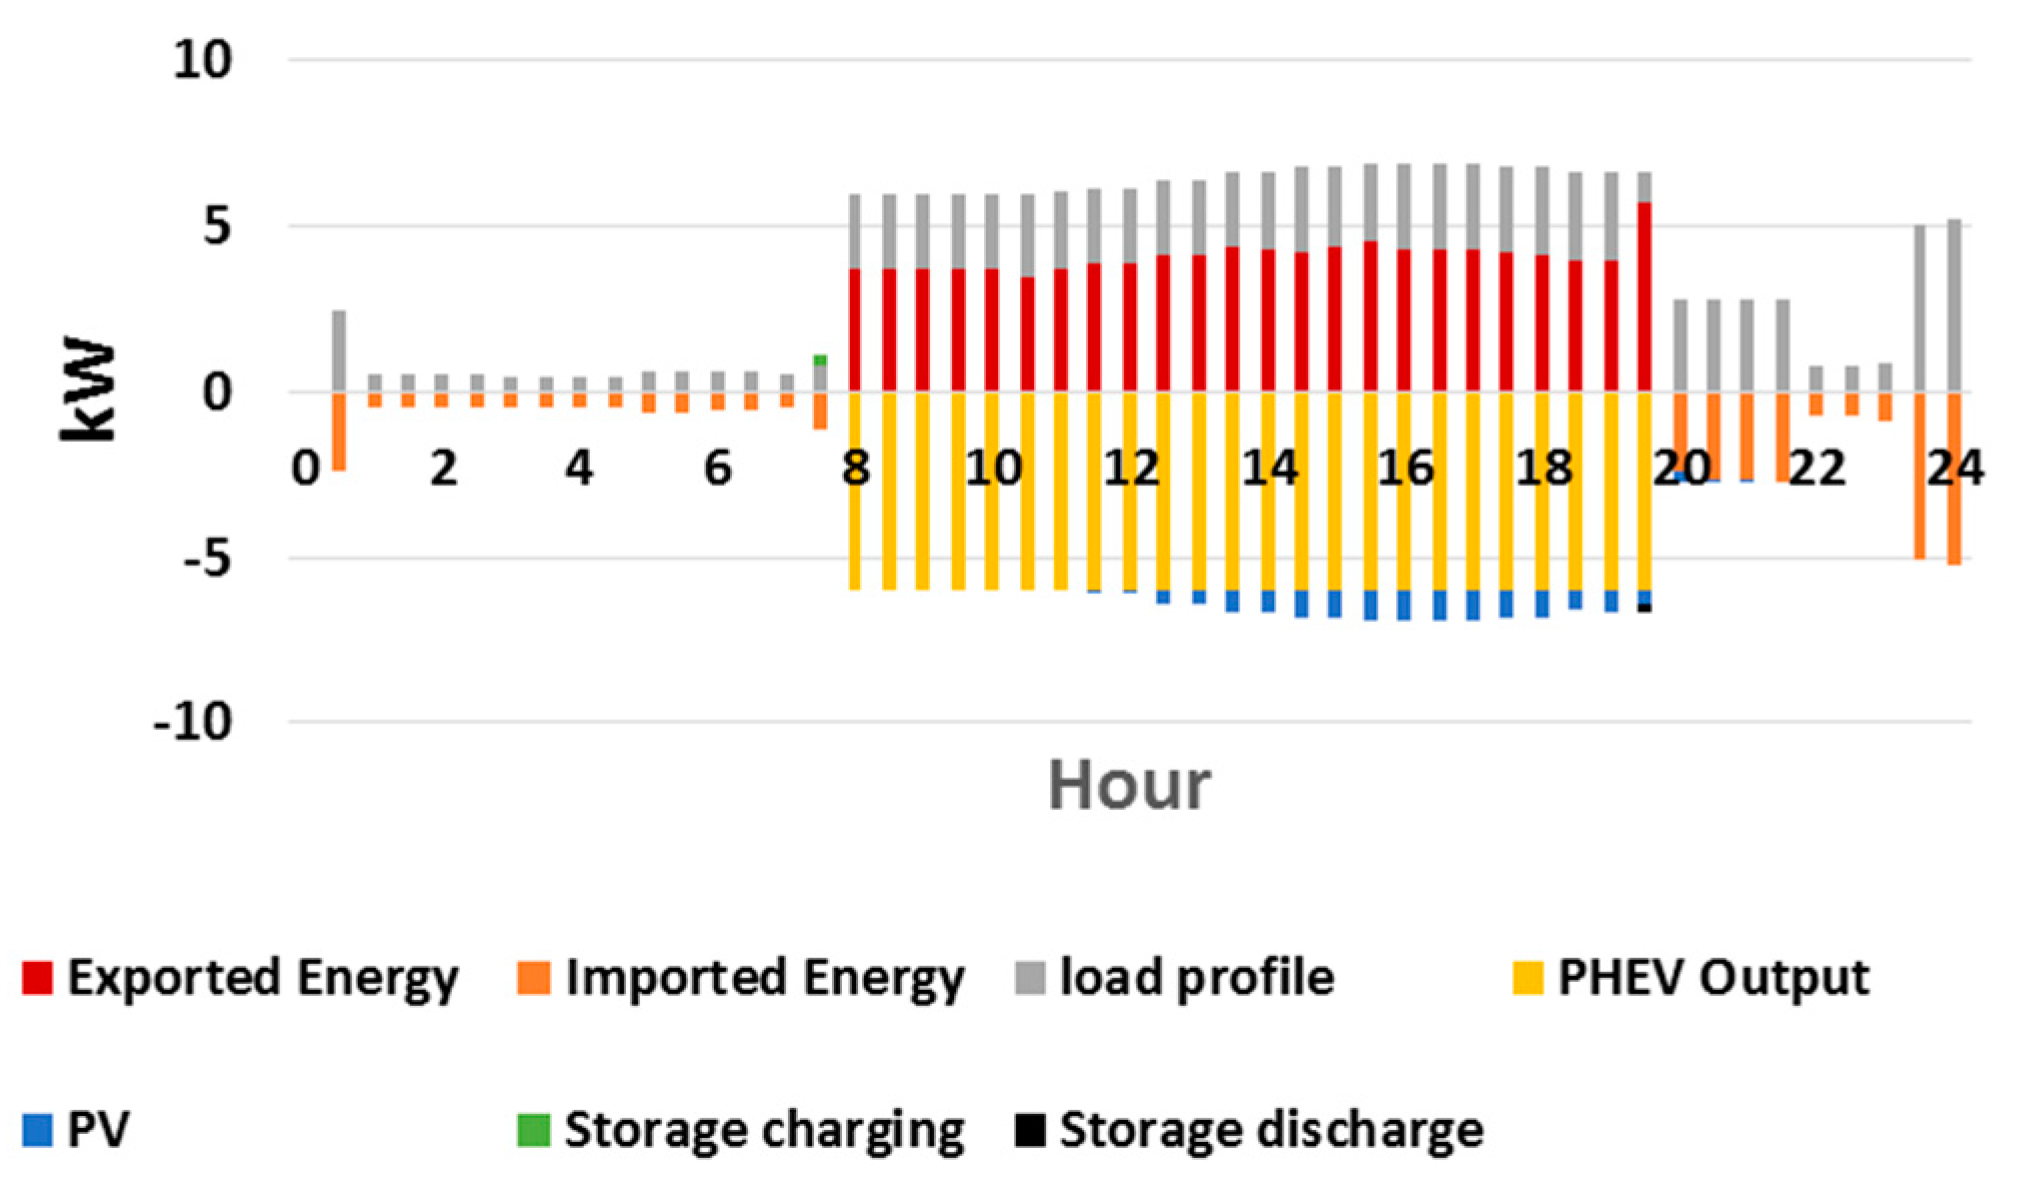
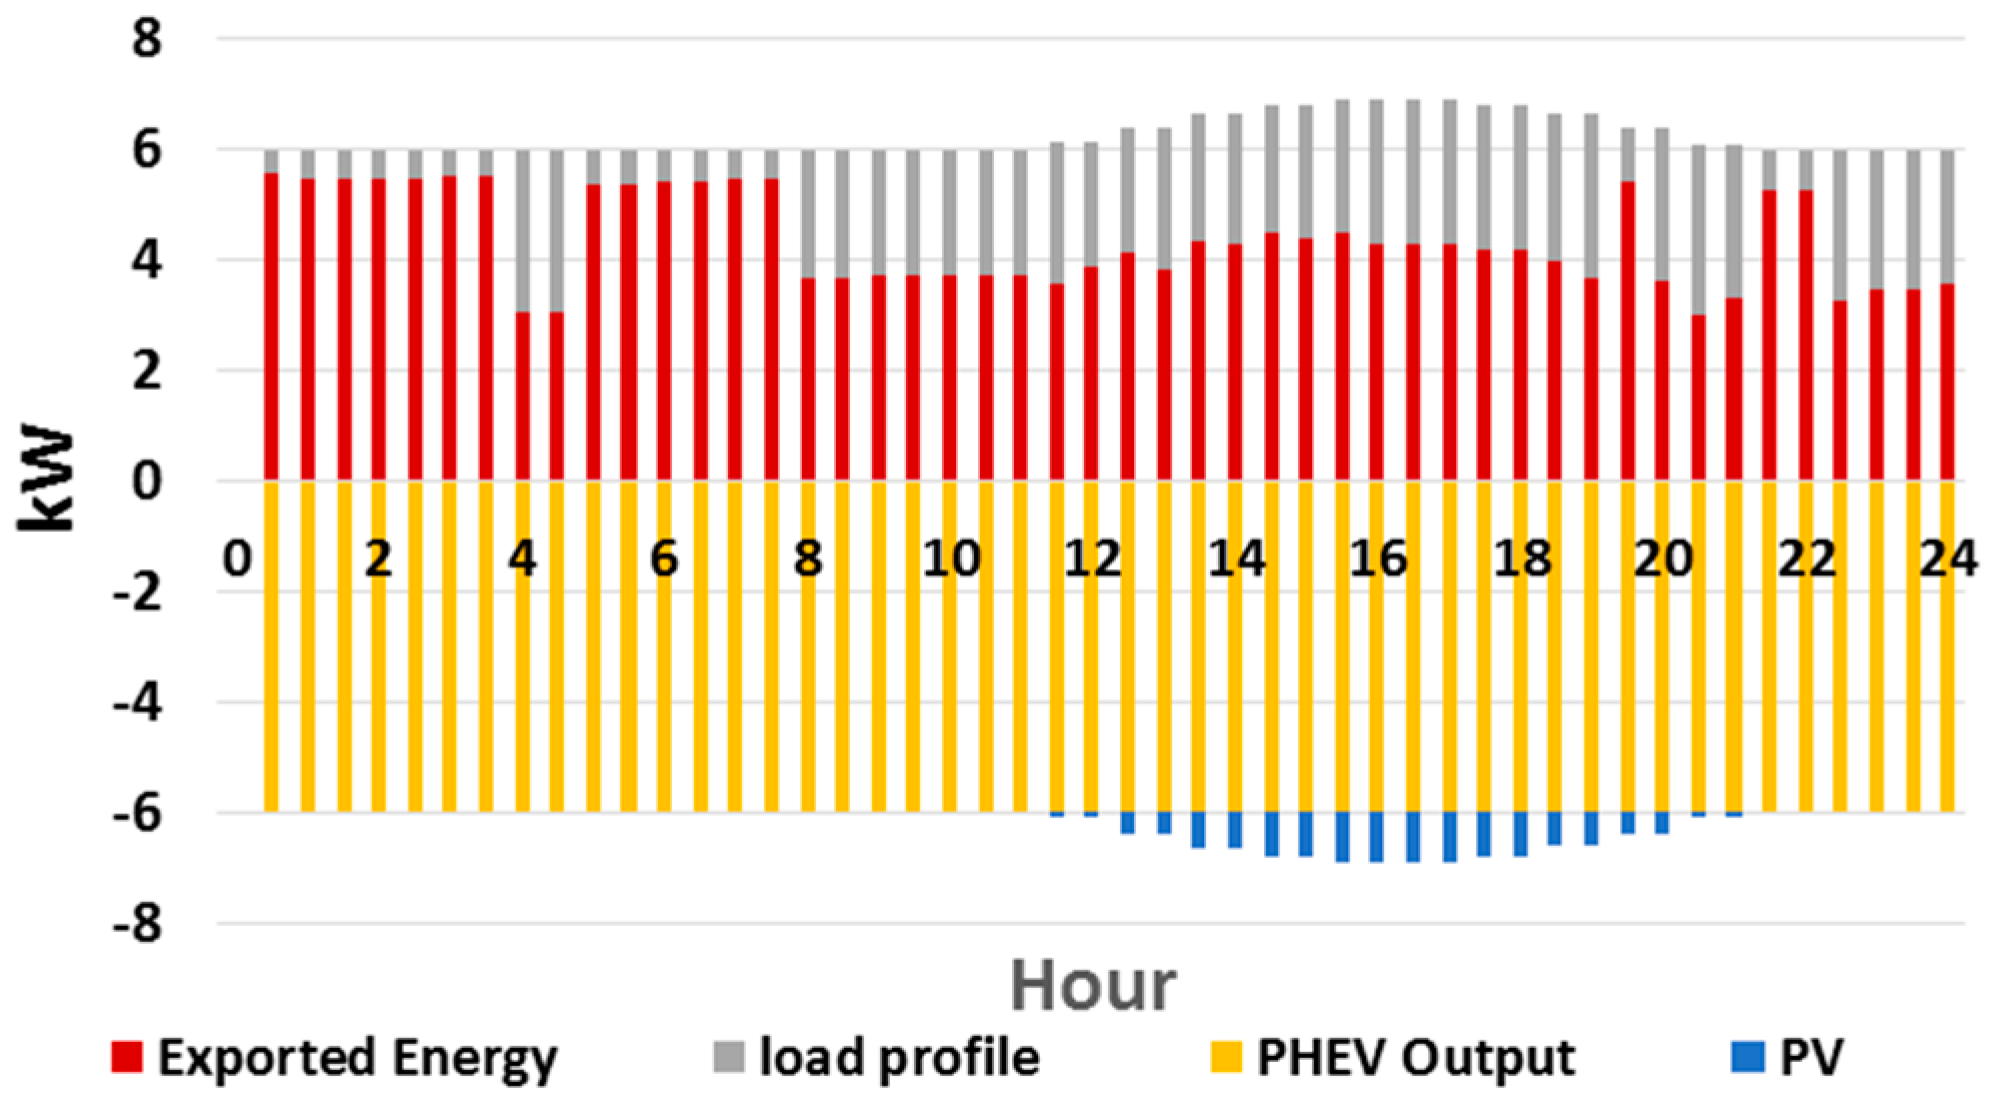
3. Vehicle to Grid (V2G) Operation under Grid Outage

In this section, a formulation is explained for maximizing the injected power to the main grid in the V2G system during the power outage. The proposed optimization model finds the maximum backup power for helping the distribution system in resiliency mode. The power supply in the smart house is assumed to be carried out with a photovoltaic panel (PV), main grid, energy storage system (ESS) discharging, and PHEVs (see Figure 2). PHEVs’ fuel tanks are supposed to work only in emergency situations because of air pollution constraints. The loads in the smart house include Electrically Controllable Appliances (ECA), Optically Controllable Appliances (OCA), and Thermostatically Controllable Appliances (TCA) and are controlled in order to maximize the power injection to the main grid. It is to be noted that the running duration of the proposed optimization model is the power outage duration and the periods out of it are not considered in this paper. Figure 2 depicts the smart house appliances and its energy resources. PVs, ESSs, and PHEVs are connected through AC-DC converters to the main bus of the house, which is an AC system. In the smart house, a control center is responsible for communicating between different appliances and also energy resources. This device is also responsible for control tasks and implementing the algorithms for managing devices. It should be noted that the house owner, according to the discomfort levels that he/she can tolerate, proposes price steps to distribution system operator (DSO). By considering the distribution system condition and also the severity of the disasters, DSO determines the best price step in each time interval. This is because in this paper, only a smart house is considered and the interaction between other smart houses and DSO is not studied. We consider the behavior of smart house in different discomfort levels.

3.1. Objective Function

As explained before, the main goal of the proposed model is to increase the injection power to the main grid during emergency situations, which causes a short duration power outage in distribution systems. Therefore, the objective function is to maximize the sum of power injection during the studied period as below:
O b j = T i n T o u t E P t I N J _ G R D   t [ T i n , T o u t ] ,
where O b j is the objective function, E P t I N J _ G R D is the amount of power injection at the time t, and T i n and T o u t are the start time of the event (the start time of power outages) and the end time of the power outage, respectively. It should be noted that it is assumed that T i n and T o u t depict the worst case scenario for the outage period.

3.2. Generations

The proposed energy management system exploits solar energy in order to maximize the injected power. In this study, a simple model of the PV system was considered, including the solar irradiance, environment temperature, array area, and efficiency of PV modules. In the PV system [29], power output E P t P V is represented by:
E P t P V = η P V . A P V . I t . ( 1 0.005 ( T t O U T 25 ) ) ,
where ηPV is the conversion efficiency of solar cell array (%), APV is array area (m2), It is the sun irradiation at time t (kW/m2), and TtOUT is the outside air temperature (°C). The hourly distribution of sun radiations can be modeled with a bimodal distribution, which is explained in [29].

3.3. Energy Storage System

In order to engage the renewable source’s output and PHEVs’ power generation more efficiently in a normal and emergency condition operation, the ESS was used.
Electricity stored in the ESS at time t is presented by (3)–(4) and the electricity charged, the electricity discharged, and also self-discharging rate are considered. During the charging or discharging process, electrical energy would be lost, so turn-around efficiency of ESS is considered.
E E t E S S = E E t 1 E S S + δ . η E S S . E P t C H E S S δ . E P t D C H E S S / η E S S δ . S t E S S E P E S S , s d c , t > 1
E E t E S S = E E i n i E S S + δ . η E S S . E P t C H E S S δ . E P t D C H E S S / η E S S δ . S t e s s E P e s s , s d c , t = 1
, S t e s s = { 1 ,   i f   E S S   i s   O N 0 ,   i f   E S S   i s   O F F
where E E t E S S is ESS energy at time t, time interval duration is shown by δ , η E S S is ESS efficiency, E P t D C H E S S is ESS discharge at time t, E P t C H E S S is ESS charge at time t, S t e s s is ESS status at time t, and E P e s s , s d c is ESS self-discharging rate. E E i n i E S S depicts initial value of ESS at the beginning of the period. In order to prevent net accumulation and keeping the status of the ESS the same before and after the outage period, it is assumed that the ESS returns to its initial value at the end of the period.
E E t E S S = E E i n i E S S ,   t = T i n ,   t = T o u t .
Equations (7)–(9) illustrate the limits on discharge or charge rate, which are defined by the manufacturer.
E P t C H E S S E P U B C H E S S
E P t D C H E S S E P U B D C H E S S
E E t E S S E E U B E S S ,
where E P U B C H E S S is the upper bound of ESS charge rate; E P U B D C H E S S is the upper bound of ESS discharge rate, and E E U B E S S is the upper bound of ESS energy.

3.4. Appliance

Three classifications for electrical house appliances have been presented in this study, namely Electrically Controllable Appliances, Thermostatically Controllable Appliances, and Optically Controllable Appliances. The formulation and related studies for each type of appliance are outlined in the following.

3.4.1. Electrically Controllable Appliances

An optimal method to schedule all the ECAs is proposed based on the maximizing power injection in the V2G scheme. The ECAs can be run within an interval and users do not have to run them in a specific time. Hence, the operational parameters for each ECA have to be set, which are Earliest Starting Time (EST), Latest Finishing Time (LFT), and Length of Operation Time (LOT), along with power consumption. The ECA is run in an interval starting from EST and ending with LFT. In this study, these parameters were adopted from [30].
The starting probability of each appliance, P s t a r t can be calculated through (2):
P s t a r t ( A , W , δ , σ f l a t , h , d ) = P s e a s o n ( A , W ) P h o u r ( A , h , d ) P s t e p ( δ ) P s o c i a l ( σ f l a t ) ,
where A is the ECA appliance, h stands for the hour of the day, d is the day of the week and W represents the week of the year, and δ is the computational time step (second or minute). The effects of social factor and weather on the consumption pattern of customers are considered in Psocial and σ f l a t is the standard deviation of it.
Seasonal changes are modeled with the Pseason as the seasonal probability factor, Phour models the activity levels during the day, and Pstep is the step size scaling factor, which scales the probabilities in accordance with δ . Pstart is a variable that takes a value between 0 and 1 and when it is more than the threshold value, the appliance will be turned on. When the length of operation (LOT) is accomplished, the appliance will be turned off [31]. The mathematical model of ECAs are as follows:
h = 1 H P h o u r ( A E C A , h , d ) = 1
w = 1 W a P s e a s o n ( A , W ) W a = 1 ,
where W a is 52 and H is 24. By adding the daily starting frequencies, the mean yearly starting frequency can be achieved.
N y e a r , m e a n ( A ) = W = 1 W a d = 1 D a h = 1 H s t e p s P s t a r t ( A , h , d , W , δ , σ f l a t ) = [ ( W = 1 52 P s e a s o n ( A , W ) d = 1 D a h = 1 H P h o u r ( A , h , d ) s t e p P s t e p ( δ ) ) P s o c i a l ( σ f l a t ) ]
where D a is 7. It is assumed that each appliance is turned on/off once in a day.
E S T t L F T L O T S i , t s t a r t = 1 , i E C A
E S T + L O T t L F T S i , t f i n i s h = 1 , i E C A ,
where S i , t s t a r t is a binary variable stating the starting status of the appliance i. It is 1 if the appliance turns on in the period t and is 0 in all other times. S i , t f i n i s h is the appliance i finishing status and is 1 if the appliance turns off and is 0 in all other times, respectively.
S i , t s t a r t = { 1 , t = t i , S T 0 , o t h e r w i s e
S i , t f i n i s h = { 1 , t = t i , F N 0 , o t h e r w i s e
S i , t = { 1 , t i , S T t t i , F N 0 , o t h e r w i s e
t i , F N = t i , S T + L O T i ,
where t i , S T and t i , F N are the appliance i starting and finishing time, respectively.
The overall electricity consumption of an appliance in each interval is the sum of the power consumption of all running ECAs.
E P t E C A = i E C A E P i . S i , t ,
where E P t E C A is the total demand of ECAs at the time t; E P i is the power consumption of the appliance i, and S i , t is a binary variable indicating the status of the ith appliance at the time t.

3.4.2. Thermostatically Controllable Appliances

The TCAs are scheduled based on the thermal and electrical constraints. The indoor, fridge, and freezer temperatures are the parameters, which are controlled in TCA considering acceptable temperature ranges. These parameters are limited by the following equations:
T min i n T t i n T max i n
T min f r z < T t f r z < T max f r z
T min f r < T t f r < T max f r ,
where T min i n , T min f r , and T min f r z are the lower bounds of indoor, fridge, and freezer temperatures, respectively and, T max i n , T max f r , and T max f r z represent the upper bounds of indoor, fridge, and freezer temperatures. The customers’ defined the preferred range of temperatures themselves. However, it should be noted that the more convenience customers have, the more money they have to pay for the energy.
(a) Fridge and Freezer
The power consumption of the fridge and freezer are related to operating compressors and their consumptions are not constant. The principals of fridge and freezer systems are analogous and common sets of equations can be used for both of them. They are different in their value of parameters such as upper and lower bounds of temperature and activity probability.
The status of the fridge compressor is defined through (24)–(26). It is assumed that the compressor of the fridge is turned on at the beginning of the scheduling period.
O S t f r = { 0   or   1   if   t T W f r 0   if   t T W f r
O S t f r = { 1   if   T f r ( t = 0 ) > T max f r 0   if   T f r ( t = 0 ) < T min f r  
T t f r = T t 1 f r + δ ( β f r E P t f r α f r O S t f r + γ f r ) .
The temperature of the fridge at time t is relevant to the temperature of the fridge at time t−1, activity probability of the fridge at time t, and its heat losses. The effect of the activity probability on the temperature of the fridge is modeled by means of β f r ; where more activity probability will lead to more cooling demand on the fridge, which is defined as the number of times the fridge door is opened and closed during each time interval. The effect of thermal leakage on fridge temperature is modeled by γ f r . Here, α f r and γ f r model the impact of the on and off status on the temperature of the fridge.
(b) Air Conditioning and Heating
The indoor temperature at time t is a function of habitants’ activity, the indoor temperature at time t−1, and the difference between the indoor and outdoor temperature. The related equations are as follows:
O S t a c = { 0   or   1   if   t T W a c 0   if   t T W a c
O S t a c = { 1   if   T a c ( t = 0 ) > T max i n 0   if   T a c ( t = 0 ) < T min i n  
T t i n = T t 1 i n + δ ( β a c E P t α a c O S t a c + ρ a c ( T t o u t T t i n ) )
O S t h t = { 0   or   1   if   t T W h t 0   if   t T W h t
O S t h t = { 1   if   T h t ( t = 0 ) < T min i n 0   if   T h t ( t = 0 ) > T max i n  
T t i n = T t 1 i n + δ ( β h t E P t + α h t O S t h t ρ h t ( T t i n T t o u t ) )
O S t h t + O S t a c 1 .
The air conditioner and heater are operated in an interval, which are shown by TWac and TWht, respectively. It is assumed that the air conditioner (heater) is turned on at the beginning of the scheduling period. The air conditioner and heater do not run at the same time and inequality (33) guarantees that. The thermodynamic equations for indoor temperature are shown in (29) and (32). The effect of habitants’ activity on the indoor temperature is considered through β a c / β h t , where more activity will lead to more cooling/heating demand. The effect of outdoor temperature on indoor temperature is modeled by ρ a c and ρ h t .

3.4.3. Optically Controllable Appliances

The optically controllable appliances can be scheduled based on the activity probability and the illumination level index. The needed illumination can be obtained by means of the lighting system, besides outdoor illumination. The house has different zones and each zone has a different minimum required illumination based on its use. The load of lighting for the Zth zone of the house is expressed as follows:
L t z + L t O U T ( 1 + K t ) L t z , min .
The illumination constraints are met through the abovementioned inequality. The Kt declares the “discomfort elasticity” of the lighting load. When the discomfort level is high, the residents tend to decrease illumination. This means that a higher discomfort level leads to lower Kt.

3.5. Energy Balance

In the normal condition, the electricity demand is supplied by the grid, along with distributed energy resources (DERs). In the emergency situation, after the occurrence of the event, PHEVs are added to cooperate in supplying power. The bidirectional energy flows with the storage are considered by E P t D C H _ E S S and E P t C H _ E S S as well as with the grid, which are considered through E P t I M P _ G R D and E P t I N J _ G R D .
E P t E C A + E P t T C A + E P t O C A = [ E P t P V + E P t D C H _ E S S + E P t I M P _ G R D E P t C H _ E S S E P t I N J _ G R D + E P t D C H _ P H E V s E P t C H _ P H E V s ]
E P t I N J _ G R D M i n j e c t i o n , E P t I M P _ G R D M i n j e c t i o n ,
where E P t D C H _ P H E V s is the electrical power of PHEVs in emergency situations. The stored energy in the ESS at time t is presented by E E t E S S . The ESS charge and discharge are represented by E P t C H _ E S S and E P t D C H _ E S S , respectively. E P t I N J _ G R D and E P t I M P _ G R D are the amounts of energy, which are injected or imported to/from the grid, respectively. M i n j e c t i o n is maximum power flow of the connection.

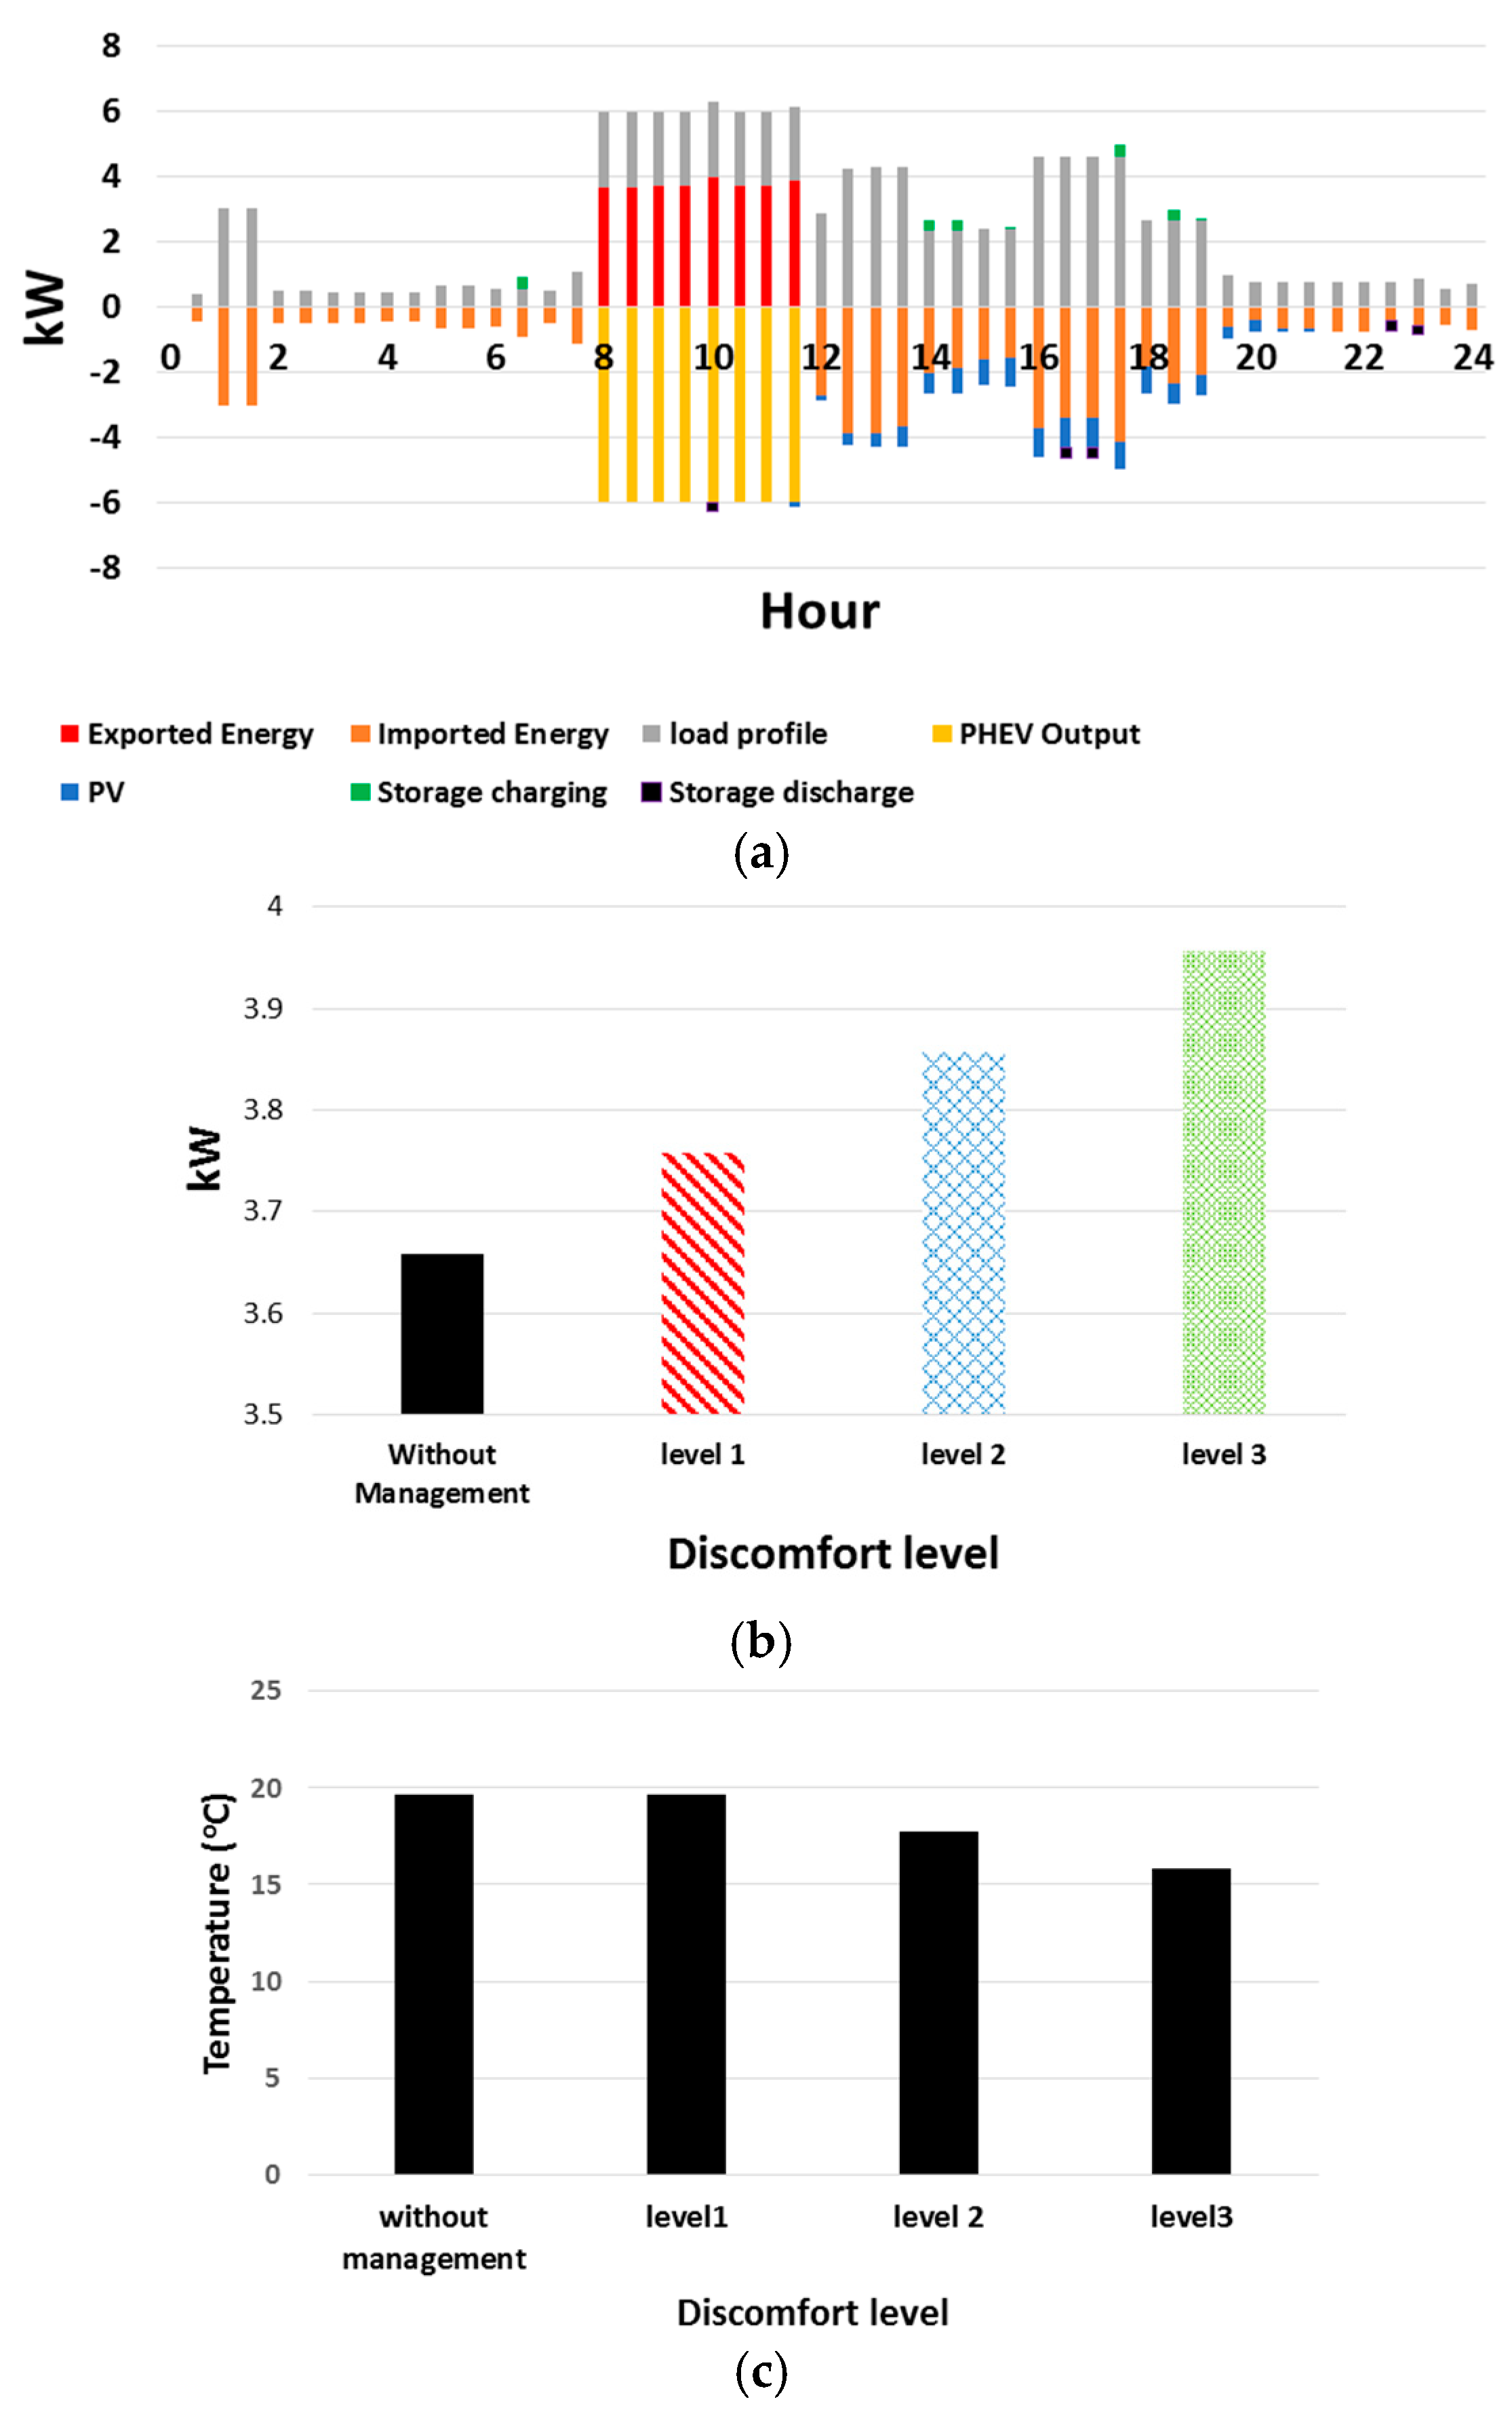
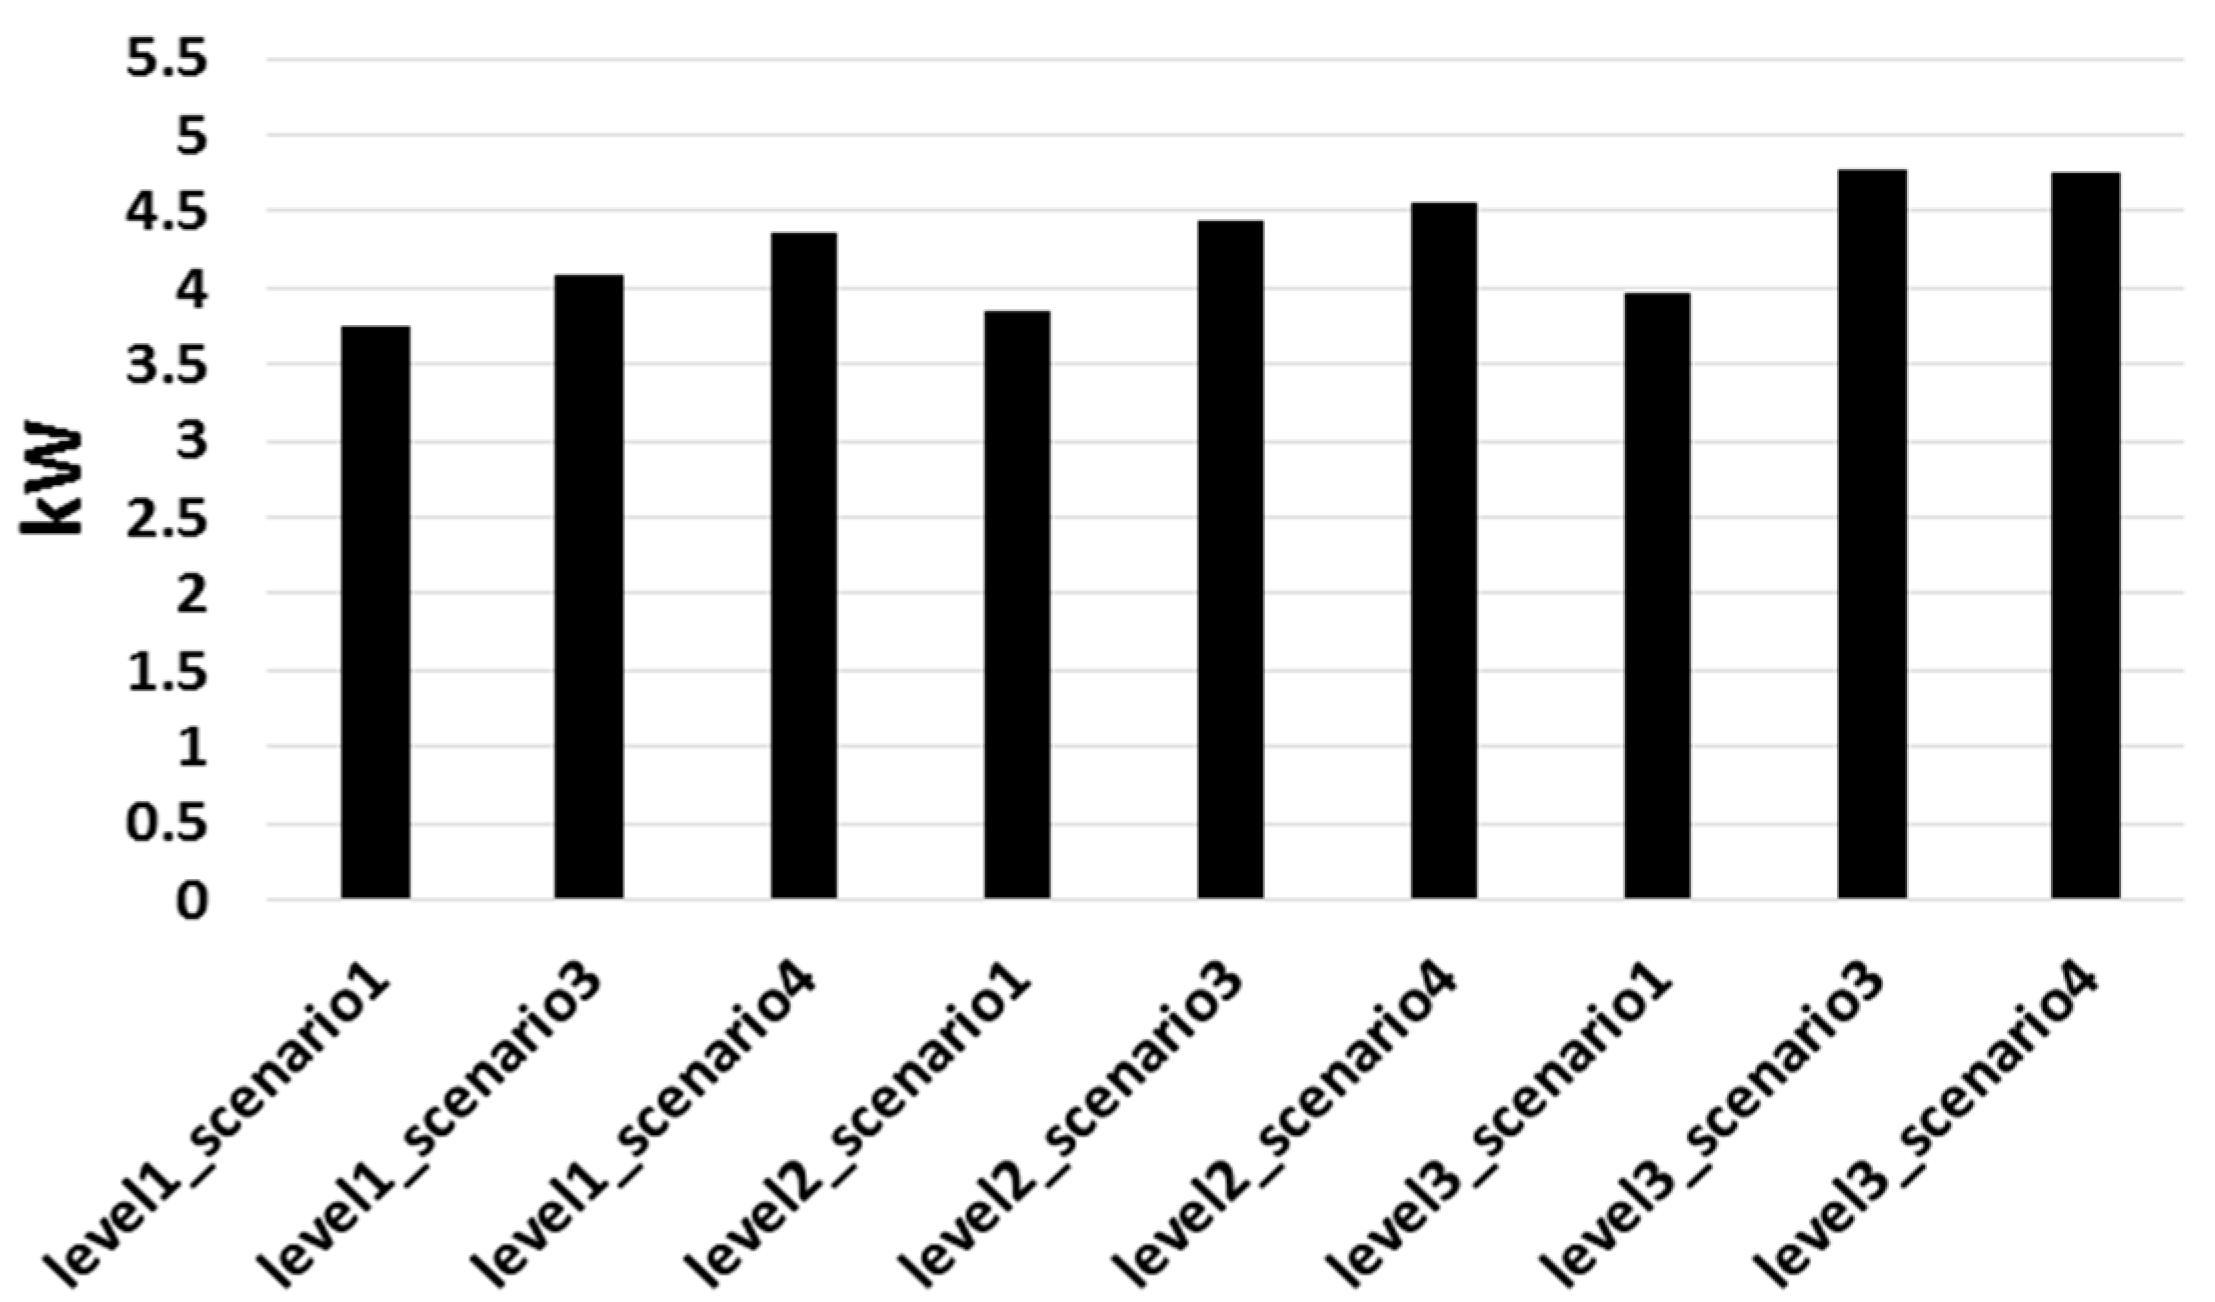
3.6. Discomfort Index

The discomfort index (DI) is defined as “the deviation from the most desired values”. The related equations are explained in [31] and are shown as below.
D I = t T ( | T t f r T d e s f r | + | T t f r z T d e s f r z | + | T t I N T d e s I N | ) + i A p p l i a n c e t T | t i , S T E S T i | ,
where T d e s f r , T d e s f r z , T d e s I N , and E S T i are desired temperature of the fridge, freezer, indoor, and time of appliances. In this paper, discomfort is considered as a constraint in the optimization model and is the limit that the house owner determined before starting the process and can be different in each event.

3.7. PHEVs

In the emergency situation after the event occurrence, PHEVs are used to supply the house and also inject the extra power to the main grid. In PHEVs, the engine generator uses fuel for supplying the needed energy of the battery. The bidirectional charger extracts energy from the traction battery, supplies the house, and injects extra energy to the main grid. PHEVs formulation includes two main parts: battery and fuel consumption. It should be mentioned that PHEVs formulation is for the power outage period.
E n g t = η t a n k F t u s a g e 9 T i n t T o u t
E n g t = 0 t < T i n a n d t > T o u t
F t u s a g e = 0 t < T i n a n d t > T o u t ,
where E n g t is the kWh equivalent of the engine generator produced energy according to the thermal efficiency η t a n k . Here, F t u s a g e depicts fuel usage at time t. Moreover, 9 is the equivalent kWh energy of one liter fuel [22]. It should be noted that a linearized relation between fuel consumption and kWh output is assumed. Constraints related to the fuel tank and battery capacity are modeled in Equations (41)–(50).
C a p t t a n k = C a p F u l l _ t a n k F t u s a g e t = T i n
C a p t + 1 t a n k = C a p t t a n k F t u s a g e T i n < t < T o u t
C a p t t a n k C a p F u l l _ t a n k T i n t T o u t
C a p t + 1 b a t t e r y = [ C a p t b a t t e r y δ . E P t D C H _ P H E V s η i n v e r t e r + δ . E P t C H _ P H E V s η i n v e r t e r + δ . E n g t η i n v e r t e r ] , T i n t < T o u t
C a p t b a t t e r y = I b a t t e r y i n i t i a l C a p F u l l _ b a t t e r y , t = T i n
C a p t t a n k I t a n k f i n a l C a p F u l l _ t a n k , t = T o u t
E P t D C H _ P H E V s P max d i s c h a r g e M t d i s c h a r g e , T i n t T o u t
E P t C H _ P H E V s P max c h a r g e M t c h a r g e , t < T i n a n d t > T o u t
E P t C H _ P H E V s = 0 , T i n t T o u t
M t d i s c h a r g e + M t c h a r g e 1 ,
where C a p t t a n k is the fuel tank current capacity at t. C a p F u l l , t a n k shows the maximum capacity (initial capacity) of the fuel tank. Equation (40) depicts the calculation of fuel capacity in the first interval. Equation (44) explains the relation between the battery capacity and charge and discharge processes, in which E P t D C H _ P H E V s and E P t C H _ P H E V s are the discharge and charge power of PHEVs. E n g t shows the output power of engine generators and is modeled the same as charging power from the main grid in the equation. C a p t b a t t e r y is the battery state of charge (SoC) and the initial condition before the disaster is calculated according to Equation (45). C a p F u l l _ b a t t e r y is the maximum capacity and I b a t t e r y i n i t i a l is the initial condition (percent) of the battery before the event. η i n v e r t e r is the inverter efficiency of the PHEV charger and the engine generator’s inverter. With I t a n k f i n a l , the final condition of the fuel tank is constrained. Equations (47)–(49) depict the constraints on the charge and discharge of PHEVs. M t c h a r g e and M t d i s c h a r g e are binary variables for charging and discharging, respectively. P max c h a r g e and P max d i s c h a r g e depict the maximum charging and discharging amounts.

4. Simulation Framework

In order to demonstrate the ability of the proposed model, it has been implemented on a house consisting of different types of appliances and domestic energy resources such as the PV and upstream grid. The authors have used GAMS 2010 software to conduct the simulations. The requisite data for optimizing the energy usage of the house are taken from [29]. Since the main goal in this paper is to study the house control center treatment after the occurrence of the disaster and before power system restoration (during power outage duration), it is assumed that PHEVs do not charge and discharge before disasters and after power system restoration. In order to apply different outage conditions such as duration and starting time, four different scenarios are deployed, with their beginning and ending hours shown in Table 2. In order to consider the worst case scenario, it is assumed that each appliance is turned on/off once a day.
The efficiency of the inverter ( η i n v e r t e r ) is assumed to be 0.9; this amount is the practical efficiency of an AC-DC converter in many recent studies. I b a t t e r y i n i t i a l is 0.5 and I t a n k f i n a l is 0.2. The initial capacity of the fuel tank is assumed to be full. The house has one PHEV and its charge and discharge rate is considered to be 6.6 kW and 6 kW, respectively.
In order to study the effect of the discomfort level on the results, three situations with three levels of discomforts were considered and their data are shown in Table 3 and Table 4. Level 3 has a harder condition than levels 2 and 1. Level 2 also has a harder condition than level 1. For comparing the proposed method with the normal condition, the input data for the normal condition is given in Table 3 and Table 4. The results of applying the above-mentioned scenarios, including PV generation, ESS charge and discharge, imported and exported electricity from/to the grid, as well as load profile are shown in Figure 3, Figure 4, Figure 5 and Figure 6, which illustrate the smart house management strategy for maximizing the injected power to the main grid. In order to study the effect of duration length on the proposed method, average power injection in different discomfort levels was considered for the three scenarios (scenario 1, 3, and 4), which is shown in Figure 7. Figure 8 shows a comparison of average temperature.

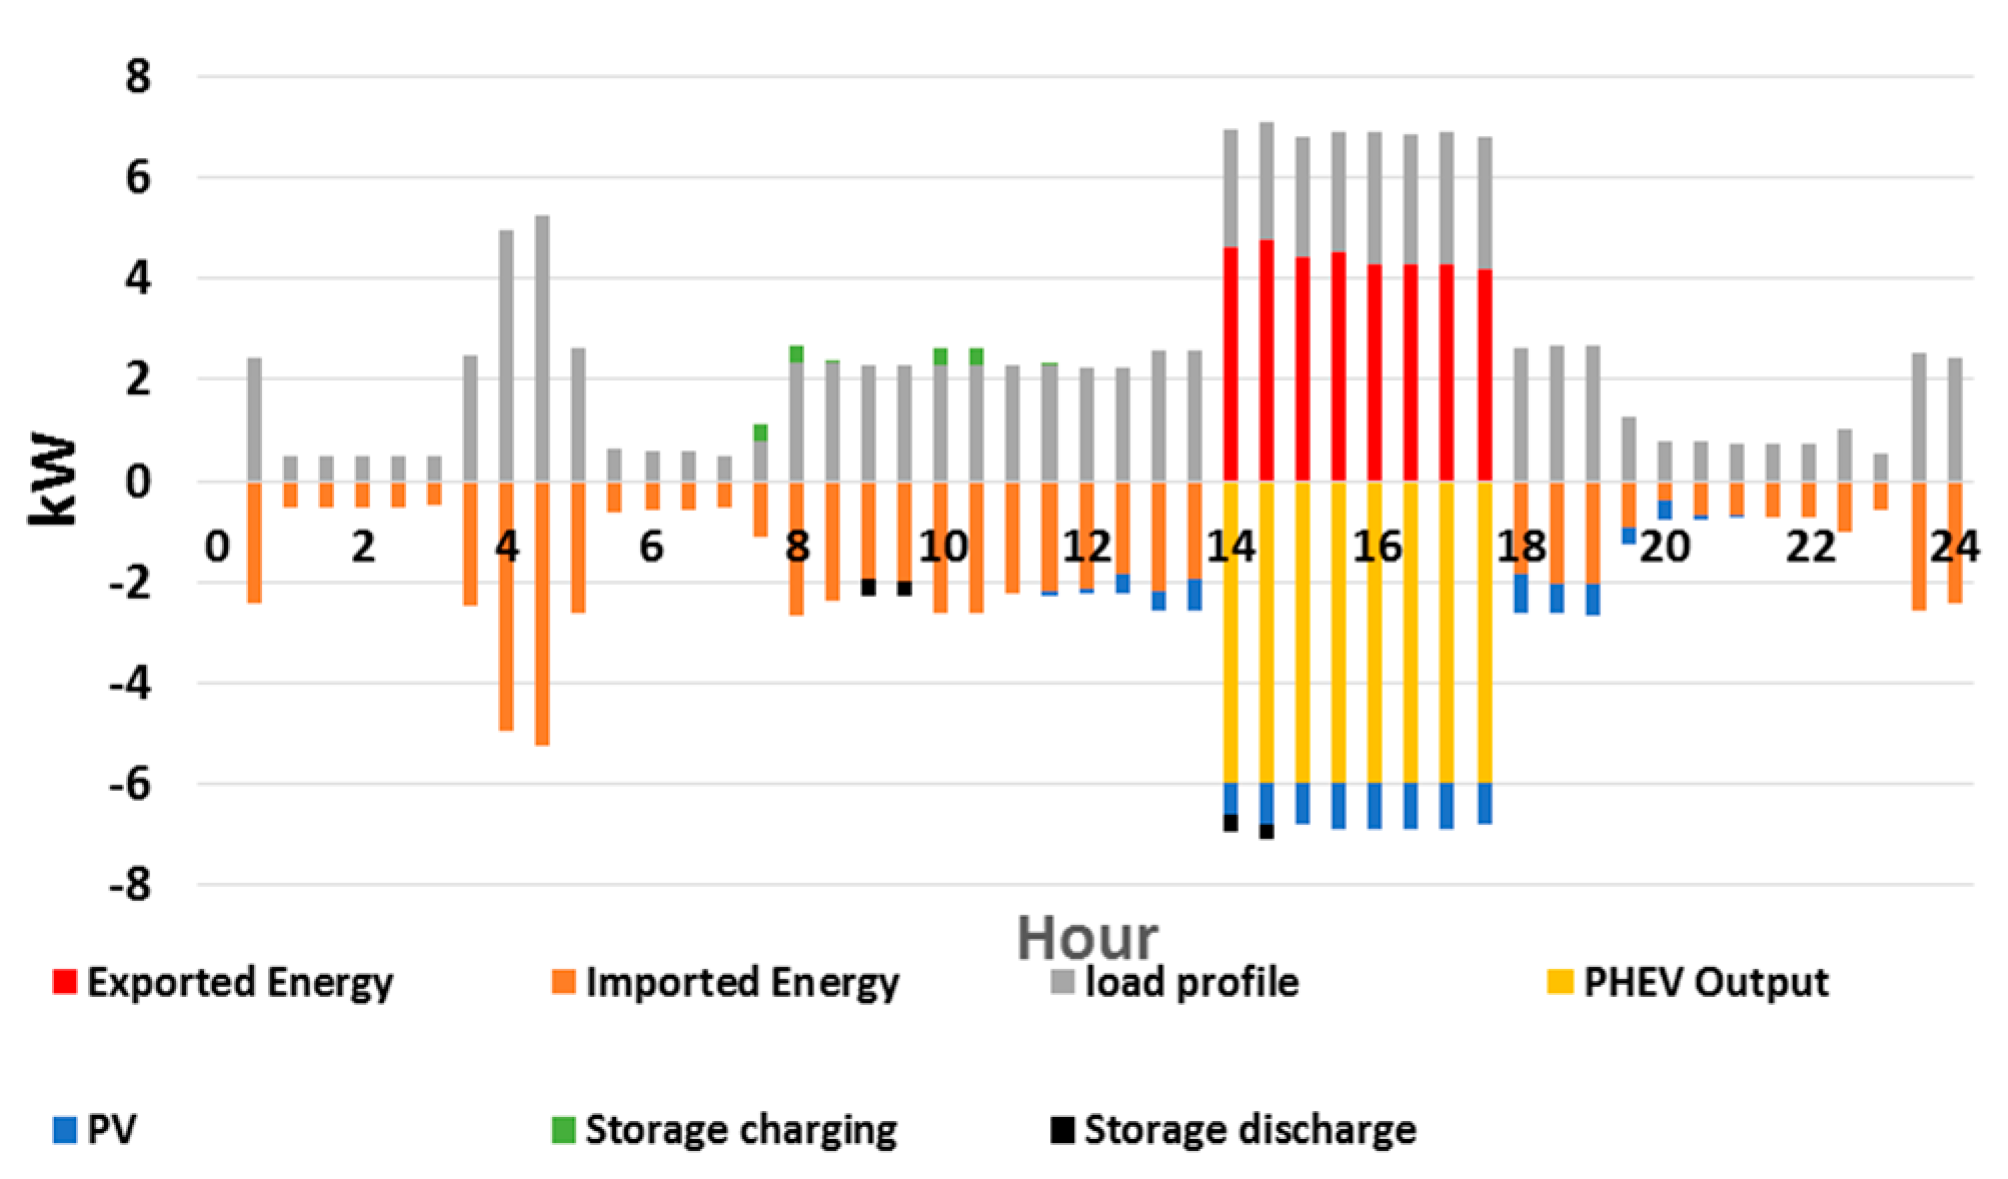
5. Results and Discussion

As depicted in Figure 3, during the power outage, the PHEV acts as a source and supplies house appliances and also injects the excess power into the main grid (the discomfort level in this scenario is 1). According to Figure 3b, the injected power for discomfort level 3 is higher than that for the other levels, which imposes a harder situation for homeowners. The amount of power in level 3 is about 4 kW and is 400 W more than the without management state. It is shown in Figure 3c that average temperature in discomfort level 3 is lower than that in the other levels, which shows the harder condition. Adding 400 W to the injected power leads to a 4-degree reduction in temperature, which can be reasonable during short period outages. As illustrated in Figure 3c, the reduction in temperature and the injected power increase do not have a linear relationship. Thus, by reducing the discomfort level, more energy can be extracted. A similar study has been carried out on other scenarios. Only smart house management strategies are shown in Figure 4, Figure 5 and Figure 6. As depicted in Figure 4, the power outage period as compared to scenario 1 is only changed and the duration is the same as scenario 1. The smart house control center controls appliances and the PHEV in order to inject maximum power to the grid. For studying the performance of the proposed method on a long duration power outage in a day, scenarios 3 and 4 were implemented. Figure 5 depicts the smart house management in scenario 3. As can be observed, PHEV can supply the requested load and also inject the excess power to the main grid. PV cooperates in supplying appliances in this period. The procedure is the same for scenario 4, as shown in Figure 6. It can be observed that PHEV has the ability to supply house appliances and also inject the extra power to the main grid.
In order to study the effect of duration length on the proposed method, the average power injection in different discomfort levels was considered for the three scenarios (scenario 1, 3, and 4). As depicted in Figure 7, for a longer power outage duration, the average injected power is higher than other scenarios. The reason for this is that the control center has more time to implement its control strategies. It is shown that when the discomfort level is low, if the length of outage becomes more, power injection will also become more. In level 1, the house owner imposes more limits on the house conditions; so, the control center does not have enough flexibility. When the discomfort levels are levels 2 and 3, the average injected power in scenarios 3 and 4 are approximately the same. The difference between the scenarios in level 1 is more than level 2 and 3. This means that the smart house can perform better by changing its discomfort level in long period power outages. An average temperature comparison is shown in Figure 8. As is depicted, the average temperature in scenario 1 is lower than that in scenario 4 in the same level. Because of the short duration in scenario 1, the proposed control center has to decrease the temperature for a short period in order to inject more power to the grid. This means that in the occurrence of short period outages, the control center poses a harder situation on the homeowner to inject more power. In levels 2 and 3, the average temperature is lower than that in level 1 and the reason for this is the harder condition that homeowners can tolerate.

6. Conclusions

In this paper, the sustainable smart house is introduced. The new model for a resilient house was presented, including PV, PHEV, and energy storage system. The proposed method maximizes the injected power to the main grid during the power outage. Smart house management controls appliances and PHEVs in order to increase the maximum power injection. The simulation results show that PHEVs have the ability to supply house appliances and also inject the excess power to the main grid. The combination of PHEV’s fuel-based capability and the smart home appliances in addition to a PV system provides a sustainable energy system and allows house owners to participate in distribution system resiliency improvement strategies by considering their welfare. The results show that smart houses increase the injected power by about 8%. Average power injection shows that the proposed control method has better performance (about 5.5%) for easier conditions (higher discomfort level). In addition, the proposed control method injects more power when the power outage lasts longer. For future works, authors suggest implementing an experimental validation of using fuel-based capabilities of PHEVs in a smart house and also inclusion of the degradation of devices, namely batteries, within the optimization model.

Author Contributions

Conceptualization, A.A.; Methodology, A.A. and E.S.; Writing, A.A. and E.S.; Investigation, E.S. and S.J.; Reviewing and Editing, S.J. and M.S.-k.; Validation, E.S., S.J. and M.S.-k.; Supervision, S.J. All authors have read and agreed to the published version of the manuscript.

Funding

This research received no external funding.

Acknowledgments

M. Shafie-khah acknowledges the FLEXIMAR-project (Novel marketplace for energy flexibility) from Business Finland Smart Energy Program, 2017–2021.

Conflicts of Interest

The authors declare no conflict of interest.

References

  1. Wang, Y.; Chen, C.; Wang, J.; Baldick, R. Research on resilience of power systems under natural disasters, A review. IEEE Trans. Power Syst. 2016, 31, 1604–1613. [Google Scholar] [CrossRef]
  2. Chen, C.; Wang, J.; Qiu, F.; Zhao, D. Resilient Distribution System by Microgrids Formation after Natural Disasters. IEEE Trans. Smart Grid 2016, 7, 958–966. [Google Scholar] [CrossRef]
  3. Xu, Y.; Liu, C.-C.; Schneider, K.P.; Ton, D.T. Toward a resilient distribution system. In Proceedings of the Power & Energy Society General Meeting, Denver, CO, USA, 26–30 July 2015; pp. 1–5. [Google Scholar]
  4. Haessig, P.; Bourdais, R.; Guéguen, H. Resilience in energy management system: A study case. IFAC PapersOnLine 2019, 52, 395–400. [Google Scholar]
  5. Chanda, S.; Srivastava, A.K. Defining and enabling resiliency of electric distribution systems with multiple microgrids. IEEE Trans. Smart Grid 2016, 7, 2859–2868. [Google Scholar] [CrossRef]
  6. Momen, H.; Abessi, A.; Jadid, S. Using EVs as Distributed Energy Resources for Critical Load Restoration in Resilient Power Distribution Systems. IET Gener. Transm. Distrib. 2020. [Google Scholar] [CrossRef]
  7. House, W. Economic Benefits of Increasing Electric Grid Resilience to Weather Outages; Executive Office of the President: Washington, DC, USA, 2013. [Google Scholar]
  8. Arghandeh, R.; Brown, M.; Del Rosso, A.; Ghatikar, G.; Stewart, E.; Vojdani, A.; von Meier, A. The Local Team: Leveraging Distributed Resources to Improve Resilience. IEEE Power Energy Mag. 2014, 12, 76–83. [Google Scholar] [CrossRef] [Green Version]
  9. Gritzalis, D.; Theocharidou, M.; Stergiopoulos, G. Critical Infrastructure Security and Resilience; Springer: Berlin, Germany, 2019. [Google Scholar] [CrossRef]
  10. IEA. Global EV Outlook to Electric Mobility; IEA: Paris, France, 2019. [Google Scholar]
  11. Liu, C.; Chau, K.T.; Wu, D.; Gao, S. Opportunities and challenges of vehicle-to-home, vehicle-to-vehicle, and vehicle-to-grid technologies. Proc. IEEE 2013, 101, 2409–2427. [Google Scholar] [CrossRef] [Green Version]
  12. Brenna, M.; Foiadelli, F.; Longo, M. The exploitation of vehicle-to-grid function for power quality improvement in a smart grid. IEEE Trans. Intell. Transp. Syst. 2014, 15, 2169–2177. [Google Scholar] [CrossRef] [Green Version]
  13. Abessi, A.; Zakariazadeh, A.; Vahidinasab, V.; Ghazizadeh, M.S.; Mehran, K. End-user participation in a collaborative distributed voltage control and demand response program. IET Gener. Transm. Distrib. 2018, 12, 3079–3085. [Google Scholar] [CrossRef]
  14. Turker, H.; Bacha, S. Optimal minimization of plug-in electric vehicle charging cost with vehicle-to-home and vehicle-to-grid concepts. IEEE Trans. Veh. Technol. 2018, 67, 10281–10292. [Google Scholar] [CrossRef]
  15. Nunna, H.K.; Battula, S.; Doolla, S.; Srinivasan, D. Energy management in smart distribution systems with vehicle-to-grid integrated microgrids. IEEE Trans. Smart Grid 2016, 9, 4004–4016. [Google Scholar] [CrossRef]
  16. Atasoy, T.; Akınç, H.E.; Erçin, Ö. An analysis on smart grid applications and grid integration of renewable energy systems in smart cities. In Proceedings of the 2015 International Conference on Renewable Energy Research and Applications (ICRERA), Palermo, Italy, 22–25 November 2015; pp. 547–550. [Google Scholar]
  17. Yazdani, S.; Ahadi, R.; Rezaee Khabooshan, B. Optimal electric vehicle charging station placing with integration of renewable energy. In Proceedings of the 15th Iran International Industrial Engineering Conference, Yazd, Iran, 23–24 January 2019. [Google Scholar]
  18. Jin, C.; Sheng, X.; Ghosh, P. Optimized electric vehicle charging with intermittent renewable energy sources. IEEE J. Sel. Top. Signal Process. 2014, 8, 1063–1072. [Google Scholar] [CrossRef]
  19. Tuttle, D.P.; Baldick, R. The evolution of plug-in electric vehicle-grid interactions. IEEE Trans. Smart Grid 2012, 3, 500–505. [Google Scholar] [CrossRef]
  20. Shin, H.; Baldick, R. Plug-in electric vehicle to home (V2H) operation under a grid outage. IEEE Trans. Smart Grid 2016, 8, 2032–2041. [Google Scholar] [CrossRef]
  21. Tuttle, D.P.; Fares, R.L.; Baldick, R.; Webber, M.E. Plug-in vehicle to home (V2H) duration and power output capability. In Proceedings of the 2013 IEEE Transportation Electrification Conference and Expo (ITEC), Detroit, MI, USA, 16–19 June 2013; pp. 1–7. [Google Scholar]
  22. Rahimi, K.; Davoudi, M. Electric vehicles for improving resilience of distribution systems. Sustain. Cities Soc. 2018, 36, 246–256. [Google Scholar] [CrossRef]
  23. Shirazi, E.; Jadid, S. Optimal residential appliance scheduling under dynamic pricing scheme via HEMDAS. Energy Build. 2015, 93, 40–49. [Google Scholar] [CrossRef]
  24. Yu, L.; Jiang, T.; Zou, Y. Online energy management for a sustainable smart home with an HVAC load and random occupancy. IEEE Trans. Smart Grid 2017, 10, 1646–1659. [Google Scholar] [CrossRef] [Green Version]
  25. Amirioun, M.H.; Kazemi, A. A new model based on optimal scheduling of combined energy exchange modes for aggregation of electric vehicles in a residential complex. Energy 2014, 69, 186–198. [Google Scholar] [CrossRef]
  26. Samadani, E.; Mastali, M.; Farhad, S.; Fraser, R.A.; Fowler, M. Li-ion battery performance and degradation in electric vehicles under different usage scenarios. Int. J. Energy Res. 2016, 40, 379–392. [Google Scholar] [CrossRef]
  27. García-Villalobos, J.; Zamora, I.; San Martín, J.I.; Junquera, I.; Eguía, P. Delivering energy from PEV batteries: V2G V2B and V2H approaches. In Proceedings of the International Conference on Renewable Energies and Power Quality, La Coruña, Spain, 25–27 March 2015; Volume 15, pp. 215–247. [Google Scholar]
  28. Mitsubishi Outlander PHEV, Catalog. 2020. Available online: https://www.mistubishi-motors.ca (accessed on 10 March 2020).
  29. Shirazi, E.; Jadid, S. Cost reduction and peak shaving through domestic load shifting and DERs. Energy 2017, 124, 146–159. [Google Scholar] [CrossRef]
  30. Zhang, D.; Shah, N.; Papageorgiou, L.G. Efficient energy consumption and operation management in a smart building with microgrid. Energy Convers. Manag. 2013, 74, 209–222. [Google Scholar] [CrossRef]
  31. Shirazi, E.; Zakariazadeh, A.; Jadid, S. Optimal joint scheduling of electrical and thermal appliances in a smart home environment. Energy Convers. Manag. 2015, 106, 181–193. [Google Scholar] [CrossRef]
Figure 1. A plug-in hybrid electric vehicle structure.
Sustainability 12 06046 g001
Figure 2. A smart house and its energy resources.
Sustainability 12 06046 g002
Figure 3. Smart home management in the scenario 1-discomfort level 1: (a) load profile in addition to plug-in hybrid electric vehicles (PHEV) production; (b) average power injection with different discomfort levels; (c) average temperature with different discomfort levels.
Sustainability 12 06046 g003
Figure 4. Smart home management in scenario 2.
Sustainability 12 06046 g004
Figure 5. Smart home management in scenario 3.
Sustainability 12 06046 g005
Figure 6. Smart home management in scenario 4.
Sustainability 12 06046 g006
Figure 7. Average power injection comparison between different scenarios for three discomfort levels.
Sustainability 12 06046 g007
Figure 8. Average temperature comparison between two scenarios for three discomfort levels.
Sustainability 12 06046 g008
Table 1. The illustration of disaster characteristics based on affecting time.
TypePredictabilityAffecting Time
Hurricane, tropical storm24–72 hHours to days
Tornado0–2 hMinutes to hours
Blizzard, Ice storm24–72 hHours to days
TsunamiMinutes to hoursMinutes to hours
Table 2. Scenarios.
Table 2. Scenarios.
ScenarioStarting Hours of OutageEnding Hours of Outage
1812
21418
3820
4024
Table 3. Different discomfort levels.
Discomfort LevelIndoor °C (min)Indoor °C (max)Freezer °C (min)Freezer °C (max)Fridge °C (min)Fridge °C (max)t_Final ApplianceLightening Factor
11923−16−1446121
21723−18−1228180.5
31523−20−1001080
Without management2023−20−1846based on Table 41.5
Table 4. Appliances.
AppliancePowerT_startT_finalDuration
Washing machine2242
Dish washer223.51.5
Dryer2.5451

