Article

Energy Budgeting, Data Envelopment Analysis and Greenhouse Gas Emission from Rice Production System: A Case Study from Puddled Transplanted Rice and Direct-Seeded Rice System of Karnataka, India

1
Extension Education Unit, Madikeri, University of Agricultural & Horticultural Sciences, Shivamogga 577204, Karnataka, India
2
Agricultural Research Station, Dhadesugur, University of Agricultural Sciences, Raichur 584167, Karnataka, India
3
Natural Resource Management Section, ICAR-Central, Coastal Agricultural Research Institute, Old Goa 403402, Goa, India
4
ICAR-Indian Agricultural Research Institute, New Delhi 110012, India
5
College of Agriculture, Hassan, University of Agricultural Sciences, Bangalore 560065, Karnataka, India
6
ICAR-Krishi Vigyan Kendra, Chamarajanagar, University of Agricultural Sciences, Bangalore 560065, Karnataka, India
7
College of Horticulture, Hiriyur, University of Agricultural & Horticultural Sciences, Shivamogga 577204, Karnataka, India
8
College of Veterinary Science, Hassan, Karnataka Veterinary, Animal & Fisheries Sciences University, Bidar 573202, Karnataka, India
9
Department of Agronomy, Central Agricultural University, Imphal 795004, Manipur, India
10
Precision Agriculture Laboratory, Department of Pomology, Faculty of Agriculture (El-Shatby), Alexandria University, Alexandria 21545, Egypt
11
Plant Production Department, College of Food and Agricultural Sciences, King Saud University, P.O. Box 2455, Riyadh 11451, Saudi Arabia
12
Floriculture, Ornamental Horticulture, and Garden Design Department, Faculty of Agriculture (El-Shatby), Alexandria University, Alexandria 21545, Egypt
13
Department of Geography, Environmental Management, and Energy Studies, University of Johannesburg, APK Campus, Johannesburg 2006, South Africa
*
Authors to whom correspondence should be addressed.
Sustainability 2020, 12(16), 6439; https://0-doi-org.brum.beds.ac.uk/10.3390/su12166439
Submission received: 7 July 2020 / Revised: 30 July 2020 / Accepted: 7 August 2020 / Published: 10 August 2020

Abstract

:
The energy consumption pattern and greenhouse gas (GHG) emission of any rice production system is important to know the sustainability of varied cultivation and establishment technique. This study was conducted to determine the energy use pattern, GHG emission and efficiency of rice farms in puddled transplanted (PTR, rainfed) and direct-seeded rice (DSR, irrigated) production systems in Karnataka, India. The energy indices and GHG emission of different input and output in a rice production system were assessed by using energy and carbon equivalence. The efficiency of PTR and DSR farms were identified using data envelopment analysis (DEA) and energy optimization was ascertained. The key finding was excessive use of non-renewable energy inputs was observed for the PTR (92.4%) compare to DSR (60.3%) methods. The higher energy use efficiency (7.3), energy productivity (0.3 kg MJ−1) and energy profitability (6.3) were mainly attributed to the large decrease in energy inputs under DSR. The DEA showed efficiency for 26 PTR farms in comparison for 87 DSR farms. The mean technical efficiency value highlighted the scope for saving energy by 6% and 2% in PTR and DSR, respectively and showed an economic reduction of $405.5/ha with PTR versus $163.3/ha with the DSR method if these inefficient farms perform efficiently. The GHG emissions revealed that the total emissions for PTR versus DSR production caused by on-farm emissions were 86% and 65%, respectively. The DSR method also had a higher carbon efficiency ratio and carbon sustainability index (10.1 and 9.1, respectively). Thus, adoption of DSR method is imperative for reduction of energy consumption and GHG emissions to achieve the carbon sustainability.

1. Introduction

The demand for food production in developing countries has increased tremendously concurrent with technological advancement using non-renewable energy resources such as fossil fuel, machinery, fertilizers and pesticides [1]. This increased production has put constant pressure on natural resources, which in turn has jeopardized the agricultural sustainability. To achieve sustainability in agricultural production, improving the efficiency of energy (input) use is one of the prerequisites because it reduces production costs and environmental pollution [2]. Rice is the staple crop of Karnataka, India, and the rice farmers have adopted extensive use of non-renewable inputs and generally cultivate nutrient- and irrigation-responsive high-yield varieties. High rainfall in the hilly region of Karnataka only supports the cultivation of rice during Kharif (the monsoon season), and the continuous anaerobic waterlogged condition creates favorable situations for greenhouse gas (GHG) emissions from rice fields [3]. The GHG emission is mainly influenced by the type of inputs used for production, such as fertilizers, pesticides, organic manure, fossil fuels, machinery and irrigation methods [4]. The rice cultivation in hilly region of Karnataka is characterized by either direct-seeded rice (DSR, irrigated) or puddled transplanted rice (PTR, rainfall), whereas the approach to paddy cultivation is typically a PTR-based system with heavier use of agricultural inputs than in the hilly region.
In general, the cultivation of rice is energy-intensive with respect to use of fertilizers, fossil fuel for machinery and pesticides [5] and thus has led to a negative effect on the environment through the emission of GHGs. These gases are released into the atmosphere and then absorb and re-emit infra-red radiation, and they are the main cause for global warming [6]. Agricultural practices are one of the potential sources of GHG emissions, with ~18% of carbon dioxide (CO2) emissions from this sector in India [7] and a rate of ~14% net global emissions [7,8]. India’s contribution to global GHG emissions rose by an alarming 4.7% in 2016, when India became the third largest GHG emitter after the United States and China [9]. Most GHG emissions from Indian agricultural sector are occurring at the input manufacturing stage, followed by usage, farm mechanization and irrigation practices [10,11]. Recently, global awareness is increasing about environmental safety and the need for cleaner agricultural systems [12]. Therefore, together with energy efficiency, agricultural practices affecting the surrounding environment should be carefully considered [13]. Several studies have reported about the energy consumption and GHG emission under different agricultural crop systems [14,15,16]. For example, a potato production system produced 993 kg CO2-equivalent (eq.)/ha of GHGs and consumed 47 GJ/ha of energy from different inputs [17]. Soni et al. [4] reported that transplanted rice produced the highest GHGs (1112 kg CO2 eq./ha) compared with other crops. Firouzi et al. [18] studied the input consumption in sole groundnut and groundnut–bean intercropping systems and found that the total GHG emissions were 636.14 and 657.36 kg CO2 eq./ha, respectively. However, very little is known about energy inputs responsible for GHG emissions from the rice ecosystem in this region to develop mitigation strategies.
The analysis of energy flow in the paddy agroecosystem under different cultivation methods is useful for policymakers, administrators and researchers in understanding the functions of these systems and the imperative for energy efficiency and production planning. The inappropriate energy usage in the rice production system can be reduced by analyzing the farm-level energy consumption pattern. This practice will provide a definite advantage for making energy guidelines and working to reduce environmental burden. An understanding of GHG emission from critical agricultural inputs expressed in kilograms of carbon equivalent (kg CO2 eq./ha) for different field operations, nutrients and chemical use, and irrigation practices and for post-harvesting is essential to identifying carbon-efficient cultivation methods for seedbed preparation, soil fertility management, pest control and other farm operations [19]. Furthermore, the efficiency of different methods and technologies are generally analyzed using data envelopment analysis (DEA). This analysis is a nonparametric statistical tool that helps to compare the production efficiency of different farmers for various set of inputs and outputs [20]. Because of these multiple advantages, DEA has been used in agriculture to determine the technical efficiency (TE) of tea [21], orange [22], areca nut [23] and rice [24] production systems. However, the information on energy consumption and the effect on GHG emission from varied rice production systems is meagre. In this context, these authors hypothesized that variation in the method of cultivation and efficient use of external non-renewable inputs will lead to lower GHG emissions and improve energy efficiency. Therefore, this study was conducted with the following goals: (1) assess the energy consumption pattern and energy use efficiency (EUE) of PTR and DSR crops; (2) identify the efficiency of cultivation methods using the DEA approach; and (3) determine the impact of different cultivation methods on estimated average GHG emissions.

2. Materials and Methods

2.1. Experimental Location and Survey Details

The survey was conducted in Siruguppa Taluka in the Bellary district and Gonikoppal Taluka in the Kodagu District of Karnataka, India. The soil of Siruguppa Taluka (situated at 15.6′ N latitude and 76.8′ E longitude, Figure 1) was black with the following characteristics: pH 8.04, electrical conductivity 0.47 ds/m, medium organic carbon content (0.41%), low nitrogen content (189 kg/ha), medium phosphorus content (58.5 kg/ha) and potassium 287.5 kg/ha. Maximum and minimum temperatures recorded in Siruguppa Taluka were 34.5 °C and 22.3 °C, respectively, with an average rainfall of 285 mm, compared with 25.6 °C and 16.3 °C, respectively, with mean rainfall of 5820.9 mm in Gonikoppal Taluka. The input and output data were collected from the 200 rice farmers of PTR and DSR system through a questionnaire administered in 2019. The basic data were provided as supplementary material (Tables S1 and S2). The questionnaire was designed based on the type of the inputs most of the farmers are using and on method of cultivation (PTR/DSR). These two system represent most of the rice cultivation methodology in South East Asia. The survey was conducted through face-to-face interview during 2018–19. The farmer’s data were validated through agricultural department officers and extension workers, those are actively monitoring all the farming activities of these regions. Moreover, the data were collected throughout the season by making frequent field visits. The farmers those who are having minimum one hectare of land with 10 years of farming experience were selected for the survey. The system boundary of rice production is depicted in Figure 2.

2.2. Energy Analysis

The different input and output data were converted to be energy equivalent by following standard procedures [25] (Table 1). The key inputs used for rice production were as follows: labor, machinery, diesel, farmyard manure (FYM), fertilizers, seeds and pesticides, whereas grain and straw yield were considered as outputs. The following equation was used for computation of different energy indices [26,27,28,29].
Nutrient   energy   ratio = Energy   Output   ( MJ / ha ) Nutrient   Energy   Input   ( MJ / ha )
Energy   use   efficiency =   Energy   Output   ( MJ / ha )   Energy   Input   ( MJ / ha )
Energy   productivity = Economic   output   ( kg / ha ) Energy   Input   ( MJ / ha )
Human   Energy   profitability   = Economic   output   ( kg / ha ) Labor   Energy   ( MJ / ha )
Net   Energy = Energy   input   ( MJ / ha )     Energy   output   ( MJ / ha )
Direct   energy = Labor + Fuel
Indirect   energy = Seed + Fertilizers + Pesticides + Machineries + irrigation
Renewable   energy = Labor + FYM
Non-renewable   energy = Fuel + Seed + Fertilizers + Pesticides + Machineries

2.3. Data Envelopment Analysis Approach

Two DEA models were used to analyze the efficiency of different decision-making units (DMUs): the Charnes, Cooper and Rhodes (CCR) and Banker, Charnes and Cooper (BCC) models. The CCR model is based on constant returns to scale, whereas while BCC model is based on variable returns to scale. The CCR and BCC models were used to calculate TE and pure technical efficiency (PTE), respectively. Scale efficiency computes the variation of efficiency scores between the CCR and BCC models and is calculated as the ratio of TE to PTE. For this study, DMUs are defined as set of farmers using similar inputs in rice production system. The TE and PTE are calculated using standard formulae [30,31,32]. In general, the TE is always lower than PTE [33], and the value of TE and PTE varies between 0 and 1, in which a value of 1 indicates the DMU is the highly efficient. The values <1 implies that the DMU is inefficient.

2.4. Carbon Indicators

In this study, the GHG emissions from different inputs were determined by multiplying their corresponding coefficients and expressing the result in terms of CO2-equivalent per hectare (CO2 eq./ha) as given by Lal [19] and West and Marland [34] (Table 2). The GHG emissions were computed on hectare basis. The indices such as carbon input, carbon output, carbon sustainability index, and carbon efficiency ratio were estimated using following equations as mentioned by Chaudhary et al. [35]:
Carbon   Input = ( Sum   of   total   GHG   emission   in   C O 2   eq . )   ×   12 44
Carbon   output = Total   biomass   ×   0.4
Carbon   sustainability   index = C   o u t p u t × C   i n p u t C   i n p u t
Carbon   efficiency   ratio = C   o u t p u t   C   i n p u t
estimated   average   GHG   emissions   kg   C O 2   eq .   kg 1 grain = C   i n p u t G r a i n   y i e l d

3. Results and Discussion

3.1. Energy Balance

The estimated energy inputs and outputs for PTR and DSR systems are depicted in 
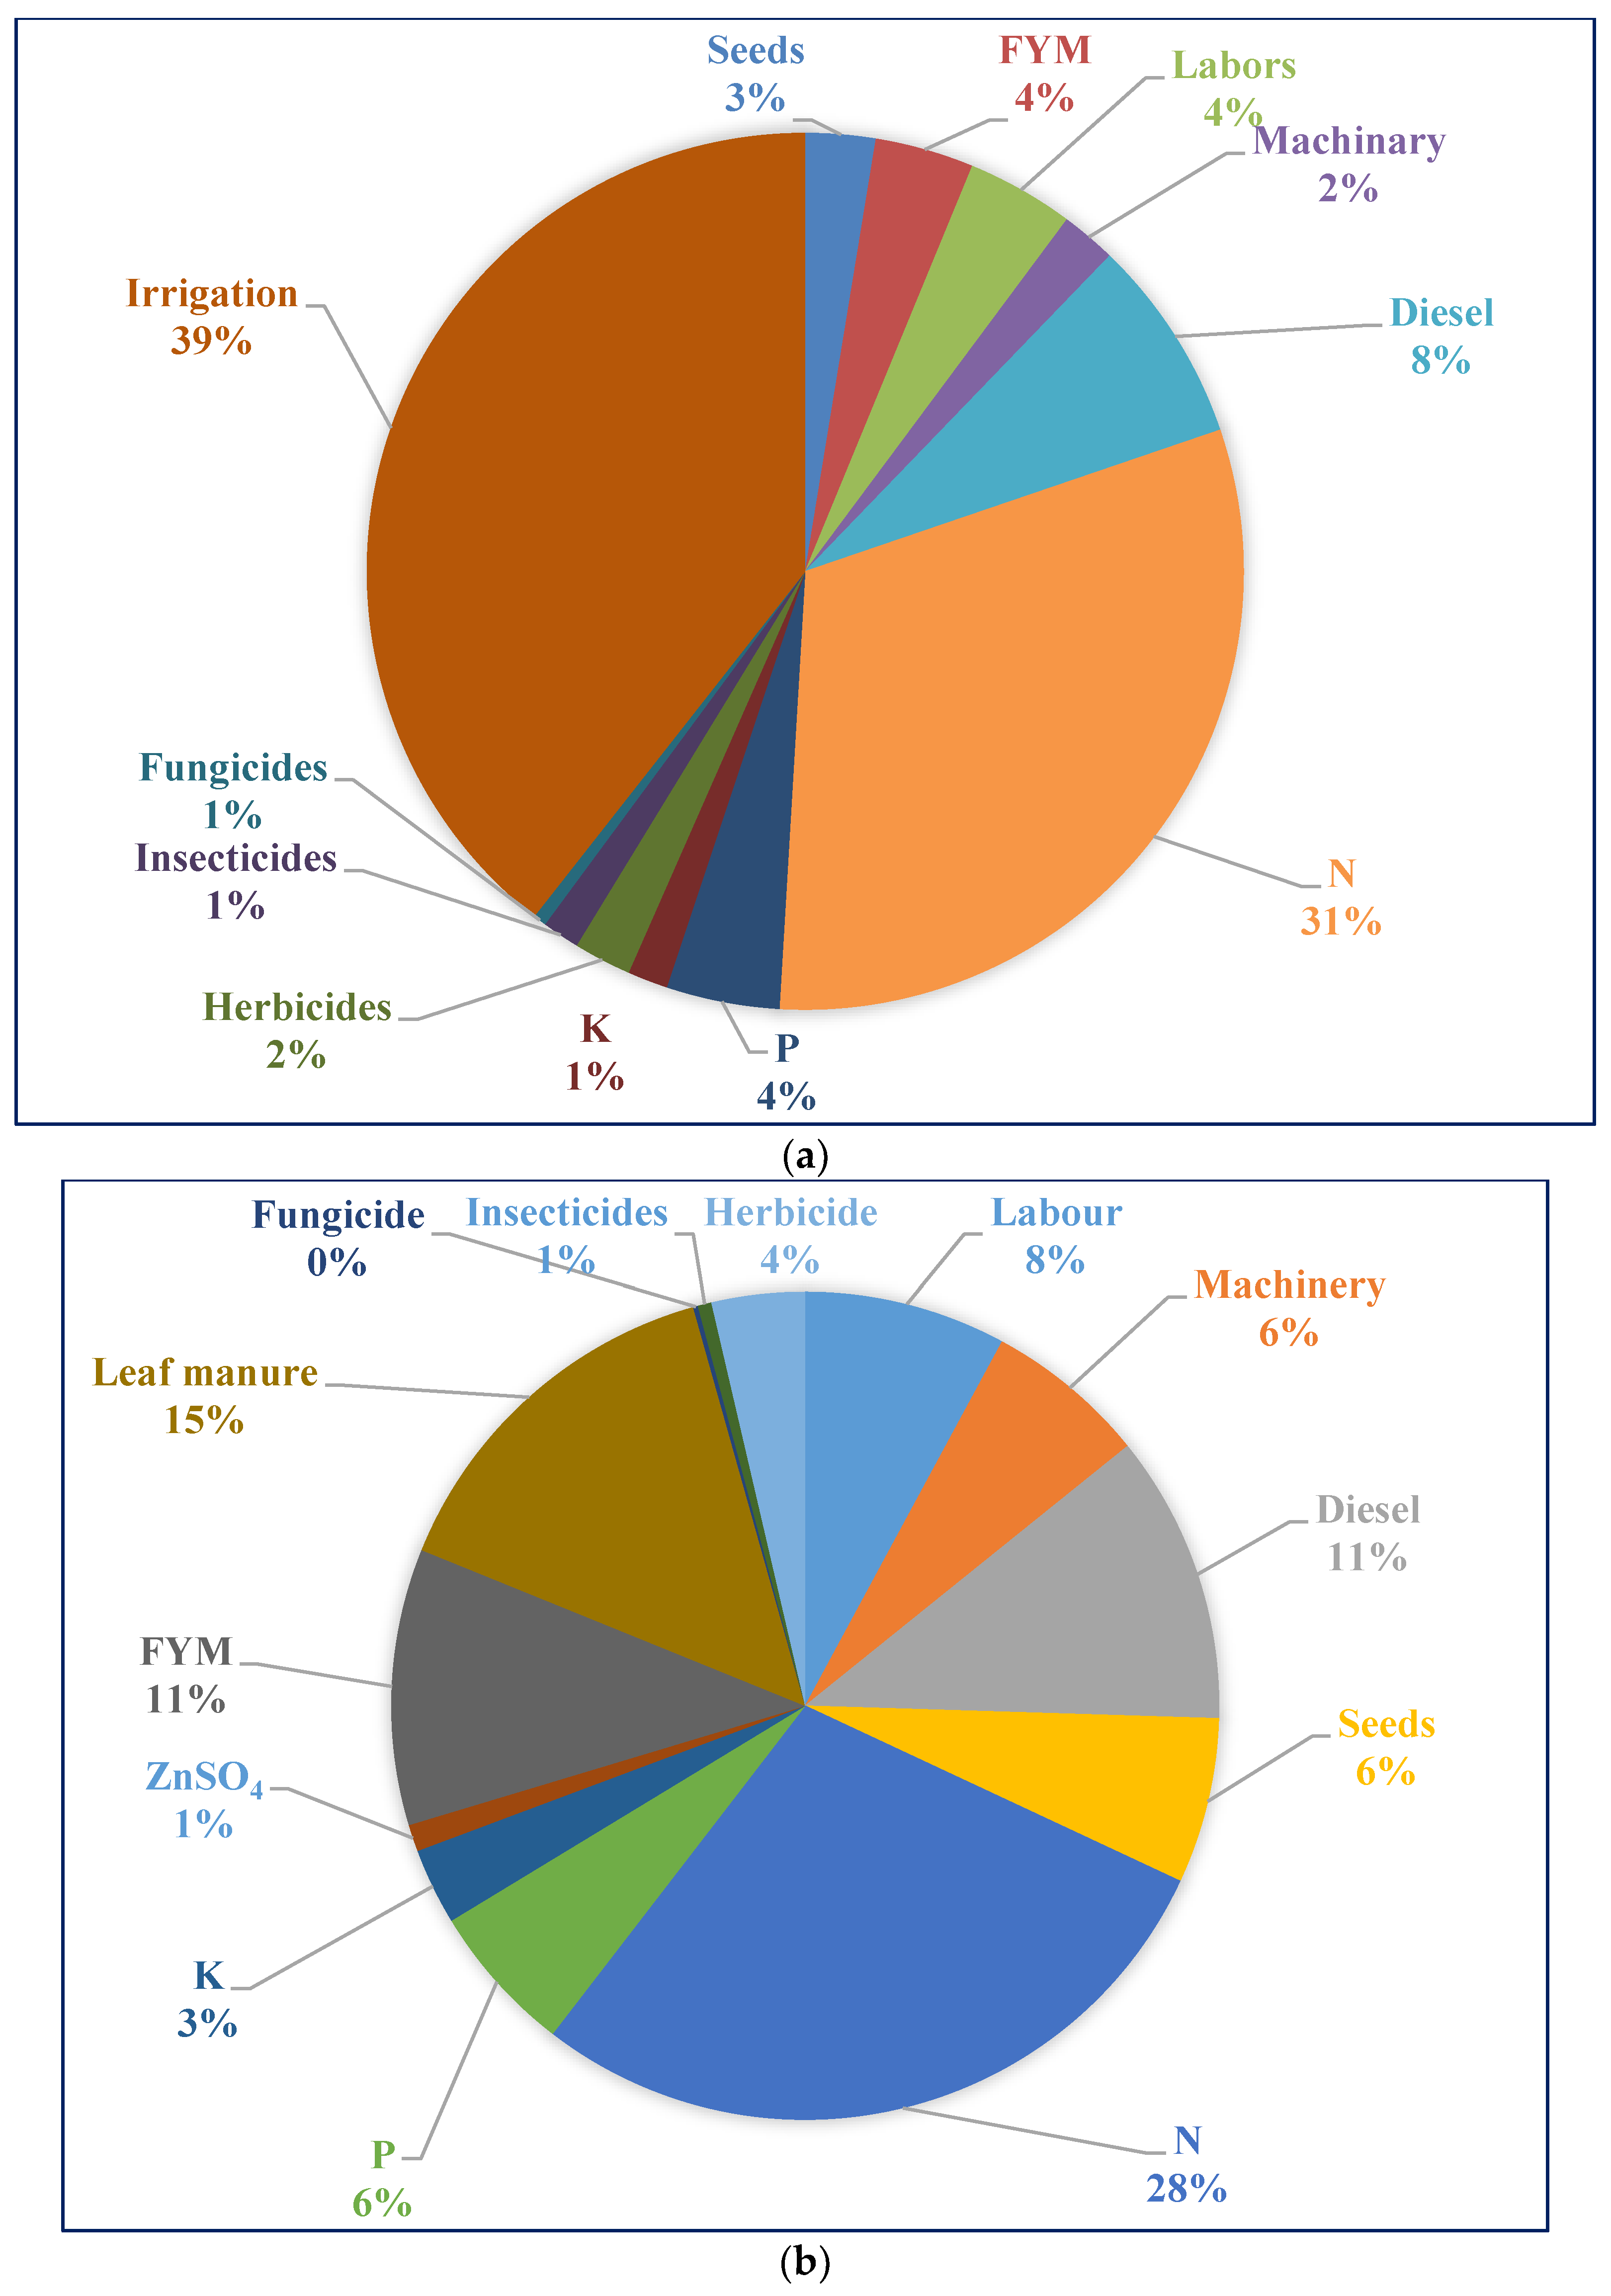
Table 3. In the PTR system, use of human labor was quite high because of the manual approach to transplanting rise compared with the DSR system. The PTR rice cultivation used a higher amount of diesel for the preparation of land and puddling than the DSR method. Mechanization was a significant share of input in PTR, and more tillage operations were needed in this transplanted method of cultivation, which contributed to higher share of input in PTR versus DSR method. For PTR farmers, FYM (on an average 4326.4 kg/ha) application had only a 4% share in the total energy, whereas in the DSR system the FYM (11%) and leaf manure (15%) application together contributed to 26% of total energy (Figure 3). The consumption of chemical fertilizers was found to be higher under the PTR system. The use of nitrogen fertilizers under PTR, which is higher than national average of 144.4 kg/ha, contributed to about 31% of the total input energy. The chemical fertilizers altogether accounted for 36% and 38% of energy input under the PTR and DSR systems, respectively. The consumption of nitrogen, phosphorus and potassium in PTR was 398%, 224% and 126% higher than DSR, respectively, indicating very high use of chemical fertilizers in PTR conditions. The use of herbicides, pesticides, and fungicides were found to be higher with PTR, whereas they were negligible amount under the DSR system. This finding shows that the incidence of pests and diseases were comparatively higher under PTR conditions than the DSR system because farmers were intensively using agrochemicals to manage pest and disease outbreak under the PTR system. The higher amount of irrigation as water energy in PTR was a result of the water used for puddling and for maintaining submerged conditions compared with the DSR method. The share of irrigation water energy to the total energy was about 39% in PTR cultivation. However, the DSR crop was grown under rainfed condition, so no external irrigation was supplemented. For comparison in the literature, Alipour [39] also reported higher irrigation energy in rice production, and another study on the rice production system in India revealed that irrigation and fertilizers have a higher share of energy input [35]. In addition, in another study, the amount of energy inputs consumed in different rice-based cropping systems were reported to be 44–54% for chemical fertilizers and 11–14% of for in India [40].
The energy input and output estimated for PTR were 35,605 and 155,776 MJ/ha and for DSR were 7823 and 53,227 MJ/ha, respectively (Table 3). The contribution of direct energy and indirect energy towards total energy input were 13% and 87%, respectively, in the PTR system compared with 44% and 66%, respectively in the DSR system (Table 4). Likewise, the consumption of non-renewable energy was higher with the PTR (92.4%) versus DSR system (60.3%). Among non-renewable energy sources, the fertilizers were the maximum share, followed by diesel and machinery in both systems; however, the use of irrigation water contributed more to PTR conditions. In the DSR system, the consumption of renewable energy was found to be higher compared with the PTR system. For context in the literature, Bockari-Gevao et al. [41] reported an energy input of 12400 MJ/ha in rice crops with major contributions from chemical fertilizers (7700 MJ/ha). Agha-Alikhani et al. [42], also reported higher percent share of energy from non-renewable resources (43%) in rice crops. A study in India revealed that irrigation and fertilizers have the higher percent share of energy in rice production system [35]. Paramesh et al. [43] highlighted the higher consumption of nitrogen (25–33%), diesel fuel (6.8–18.2%) and irrigation water (8.6–23.7%) under PTR conditions in the Indo–Gangetic Plain.
The different energy indices studied in two rice production system are presented in Table 4. The average EUE recorded was 4.4 and 7.3 in the PTR and DSR systems, respectively. This finding indicates a higher amount of input energy is required to produce a unit of output energy under the PTR system and further highlights the efficient use of inputs under the DSR system. In the literature, Bockari-Gevao et al. [41] reported an EUE of 8.86 in Malaysia for rice cultivation. In Iran, the irrigated maize cultivation recorded an EUE of 1.86 [44]. Pahlavan et al. [45] reported lower EUE of 0.01 in greenhouse tomato production because of the higher energy input under greenhouse conditions. Paramesh et al. [23] wrote that lower EUE in areca nut gardens was attributed to higher energy consumption, especially from labor, machinery and diesel fuel. Similarly, the higher energy input in the PTR system, especially in terms of fertilizers and irrigation water, led to lower EUE compared with the DSR system.
The energy productivity and energy profitability were found to be higher in DSR than PTR systems, which shows that there is room for improving energy productivity of rice crops in both cultivation methods. The lower energy productivity in PTR was largely owing to more use of diesel fuel, machinery and fertilizers [45,46,47]. The lower energy productivity (0.27 and 0.33 kg MJ−1) was also observed under PTR conditions in China. Likewise, the energy profitability was also found higher in DSR (6.3) than PTR (3.4) systems. The higher EUE, EP and EFP were primarily attributed to the large decrease in energy inputs (i.e., energy inputs from fertilizer, irrigation water and human labor) but were also attributed to a reduction in energy output under DSR conditions. However, the higher mean net energy in PTR system (120171 MJ ha−1) is attributed to higher output energy, and it increases with an increase in energy output. These results indicated that energy being saved in both systems; the positive net energy in DSR was mainly due to use of renewable energy sources such as application of FYM. In Gilan Province of Iran, net energy from paddy production recorded was only 36928 MJ/ha [48]. The nutrient energy ratio was found higher in DSR conditions (13.0), indicating more output per unit of nutrient with DSR than PTR. Although the energy output was higher in PTR, it consumed a sizeable amount of nutrients to achieve this production, which implies indiscriminate use of fertilizers in the region. The human energy profitability was lower (98.7) for DSR because of the lower crop yield and more use of labor for weed control because weeds are more of a problem under the DSR system. Paramesh et al. [43] reported human energy profitability of 162.9 and 125.4 for wheat and PTR, respectively.

3.2. Identification of Efficient and Inefficient Rice Farmers

The average technical, pure and scale efficiency of PTR and DSR farms is presented in Table 5. The analyzed data indicated that, of 100 farmers tested in PTR farms, 26 farms were found efficient with a score of 1, and the remaining 74 farms had a score <1, which thus were found relatively inefficient in using different energy inputs. The mean value of TE for PTR was 0.94 with a standard deviation of 0.05 (Table 5). The mean value of scale efficiency for inefficient PTR farms was 0.87. This finding implies that there is further room for improving the farm cultivation practices increasing the crop yield and energy conservation. However, under the DSR system, only 13 farms were inefficient and remaining 87 farms were found efficient in utilizing available resources. The average SE of DSR was found to be 0.99, which indicated efficient management of inputs by DSR farms to achieve the targeted yield. Furthermore, the mean TE value highlighted the possible range for saving energy by 6% and 2% in the PTR and DSR methods, respectively, if these inefficient farms were to perform more efficiently.
The energy values that convert an inefficient farm to being an efficient farm for reducing the present level of energy consumption for DSR and PTR production systems are presented in Table 6 and Table 7. Based on results of TE, the realistic energy values to obtain the same level of output were determined using DEA. The mean operational reduction values indicated an excessive use of irrigation water (1136.7 MJ ha−1) and FYM (358.3 MJ ha−1) in PTR, whereas in DSR excessive use of FYM (599.5 MJ ha−1) was observed. Therefore, adoption of the suitable water management system and soil test-based fertilizer application will help to reduce the energy consumption in both methods of rice cultivation. Similarly, Pahlavan et al. [45] reported that reducing consumption of diesel fuel, electricity and fertilizers is important for energy saving in greenhouse tomato production. Based on DEA results, Mohammadi et al. [2] suggested that reduction in the use of nitrogen-based fertilizers, irrigation water and electricity are necessary to achieve the efficiency on soybean farms.

3.3. Economic Indices

The study results revealed that major savings may be possible by reduction of labor ($126/ha), irrigation ($116/ha) and FYM ($91.4/ha) with a total mean economic saving of $472.9/ha under PTR conditions (Table 8 and Table 9). Similarly, in DSR, the inefficient farmers can save $163/ha by a reduction in use of FYM ($141/ha). The economic estimation was made by considering the average market price of the inputs in 2019. The results clearly indicate the advantages of DSR for saving capital for the farmers compared with PTR farms. The DSR system is more efficient in reducing the consumption of scarce natural resources such as irrigation water. Although the yield advantage under DSR conditions was found low, it was sustainable with limited resource use over PTR conditions. In other economic studies, Vázquez-Rowe et al. [49] reported an average annual savings of 400 € to 5150 € for inefficient vine farms. Paramesh et al. [23] wrote that adoption of an improved strategy of practices can save resources up to 11% with a mean economic saving of $413/ha. These economic savings would be possible if the farmers with inefficient rice systems adopt the improved management practices by considering soil test values, farm mechanization, suitable method of crop establishment and better pest and disease management.

3.4. Greenhouse Gas (GHG) Emission

The GHG emissions data revealed that 86% of the total emissions under PTR conditions were due to on-farm methane emissions followed by nitrogen (6%), diesel fuel (3.9%) and machinery (1.3%). Compared with the DSR method of cultivation, the GHG emission from on-farm methane emissions were 65%, followed by nitrogen (8.3%), diesel fuel (8.9%) and machinery (6.1%). Similar results were reported by earlier studies [50,51,52]. Chaudhary et al. [35] reported that 70–75% of the total emissions under DSR conditions were CO2 emissions only, mainly due to field operations, followed by fertilizer application and the remainder (10%) was methane emissions. In comparison, in the PTR method of cultivation, methane emission-based CO2 equivalent emissions were higher (57%). In the current study, there was a significant reduction in total GHG emission in DSR (574.1 kg CO2 equivalent) versus the PTR system (3954.8 kg CO2 equivalent). Pathak [53] reported that continuous flooding, nitrogen fertilizers and machinery are responsible for the higher GHG emissions from PTR farms. Puddling and continuous flooding of rice fields encourages the activity of methanogenesis, thereby increasing methane emission. In contrast, the aerobic conditions of DSR server to reduce methane emissions effectively. Fertilizer-responsive high-yield varieties and lower soil fertility are leading to an increased application of chemical fertilizers, which in turn leads to higher GHG emission. Conventional tillage practices and improved mechanization are responsible for the higher use of diesel fuel, leading to more GHG emission, which in turn primes the farm to have methane emissions under reduced conditions. Periodic soil testing and the use of organic sources of nutrients such as green manure, Azolla cultivation and FYM application can reduce the indiscriminate use of fertilizers [54]. This result highlights the scope of conservation tillage (in DSR conditions) to conserve energy and reduce GHG emission by lowering the use of machinery and fossil fuel combustion.
The data show a higher carbon input and carbon output in the PTR system (Table 10). This trend in PTR farming is mainly due to higher consumption of chemical fertilizers, machinery and diesel fuel for field operations compared with the DSR system. The PTR method recorded lower carbon efficiency ratio and carbon sustainability index (4.3 and 3.3, respectively) than DSR method (10.1 and 9.1, respectively). The higher carbon efficiency ratio indicated more carbon efficiency in the DSR method. The higher carbon sustainability index DSR was due to reduced carbon input and reduced number of tillage operations. The estimated average GHG emissions was higher in the DSR method; this trend was mainly based on lower carbon emission, especially from fertilizers and fuel. Chaudhary et al. [35] reported that conservation tillage practices such as minimum tillage and zero tillage have profound effect in reducing GHG emission. The present study highlights the importance of the DSR method as a conservation tillage practice in reducing the carbon input and GHG emission, particularly compared with the PTR method.

3.5. Uncertainty in Assessment

The GHG emission in terms of CH4 and N2O emission from agricultural soils are greatly influenced by soil type, cropping system, cover crops and type of management both in puddled transplanted and direct sown rice, respectively. However, estimations of these emissions is major uncertain due to varied emission factors, variability of system, activity data, lack of coverage of measurements, spatial aggregation and type of field operations. Most studies of the past found lack to address these issues. In this study, a novel attempt was done to assess GWP of the major rice cultivation methods of irrigated and rainfed agriculture. In addition, energy balance and C sustainability index of both the rice cultivation methods were appraised. Based on all information it was evident that although transplanting methods of rice cultivation yielded higher productivity, the energy input, energy output, however the GWP was found much higher in puddled condition than direct-seeded rice system.

4. Conclusions

The study evaluated the energy consumption pattern and carbon sustainability of the puddled transplanted and direct-seeded rice method in farmers’ fields. The study highlighted the indiscriminate use of nitrogen fertilizers and irrigation water (39% of energy input) in the PTR method of rice cultivation. The mean energy input and output estimated for PTR were 35605 and 155776 MJ/ha and for DSR were 7823 and 53227 MJ/ha, respectively. The consumption of non-renewable energy was higher in PTR (92.4%) in relation to the DSR system (60.3%). The average EUE recorded was 4.4 and 7.3 for the PTR and DSR systems, respectively. The higher EUE, EP and EFP were primarily attributed to the huge gap in energy inputs (i.e., energy inputs from fertilizer, irrigation water and human labor) under DSR method. The analyzed data indicated that, of the 100 farmers tested in the PTR method of cultivation, only 26 farms were found efficient and the remaining 74 farms were found inefficient in using different energy inputs. Furthermore, the mean technical efficiency highlighted the scope for saving energy by 6% and 2% in PTR and DSR, respectively. The results revealed that major savings could be possible by reduction of labor ($126/ha), irrigation ($116/ha) and FYM ($91.4/ha) under PTR conditions. Similarly, in DSR conditions, reduction in use of FYM ($141/ha) is required to improve the farm efficiency. The GHG emissions revealed that 86% of the total emissions under PTR conditions were due to on-farm methane emissions, whereas it was 65% in the DSR method of cultivation. In the current study, there was a significant reduction in total GHG emission in DSR (574.1 kg CO2 eq.) compare with PTR system (3954.8 kg CO2 eq.). The DSR method recorded higher carbon efficiency ratio and carbon sustainability index (10.1 and 9.1, respectively). The present study highlights the importance of DSR method as a conservation tillage practice in reducing the energy consumption, carbon input and GHG emission in comparison to PTR method.

Supplementary Materials

The following are available online at https://0-www-mdpi-com.brum.beds.ac.uk/2071-1050/12/16/6439/s1, Table S1: Basic data collected from puddled transplanted farms, Table S2: Basic data collected from direct seeded farms.

Author Contributions

Conceptualization, K.B., Y.M.R., V.P., G.A.R., A.K.G., S.R., K.S.S. and H.O.E.; Data curation, S.L.J., S.D.M. and H.C.G.; Formal analysis, V.P., G.A.R., S.L.J., A.K.G. and K.S.S.; Funding acquisition, G.A.R., S.L.J., S.D.M., G.S.Y., T.K.R.and B.K.; Investigation, K.B., G.S.Y. and B.K.; Methodology, K.B., A.K.G., H.C.G. and K.S.S.; Project administration, V.P., G.A.R., S.D.M., H.C.G. and T.K.R.; Resources, Y.M.R., S.R., B.K. and D.O.E.-A.; Software, Y.M.R., A.K.G., K.S.S., B.K. and D.O.E.-A.; Supervision, S.D.M., G.S.Y. and T.K.R.; Visualization, Y.M.R., H.C.G., S.R., D.O.E.-A. and H.O.E.; Writing—original draft, K.B., V.P., S.L.J., G.S.Y., T.K.R.and H.O.E.; Writing—review & editing, S.R., D.O.E.-A. and H.O.E. All authors have read and agreed to the published version of the manuscript.

Funding

Publication was funded by King Saud University: RSP-2020/118.

Acknowledgments

The authors extend their appreciation to King Saud University, Researcher Supporting Project (RSP-2020/118) for their financial support of the present research. The authors are thankful to financial support provided by the Indian Council of Agricultural Research, New Delhi, University of Agricultural Sciences, Raichur, University of agricultural & Horticultural Sciences, Shivamogga, ICAR-Central Coastal Agricultural Research institute, Old Goa to carry out this study.

Conflicts of Interest

The authors declare no conflict of interest.

Nomenclature

DSRDirect-seeded rice
PTRPuddled transplanted rice
EUEEnergy use efficiency
EPEnergy productivity
EFPEnergy profitability
DEAData envelopment analysis
TETechnical efficiency
PTEPure technical efficiency
CRSConstant return to scale
VRSVariable return to scale
DMUDecision making units
FUFunctional unit
haHectare
kgKilogram
hHour
kWhKilowatt hour
MJMega joule
SDStandard deviation
FYMFarmyard manure
GHGGreenhouse gas
GWPGlobal warming potential
NRENon-renewable energy
NEGNet energy gain
RERenewable energy
SESpecific energy
CCarbon
CH4Methane
NNitrogen

References

  1. Chaudhary, V.P.; Gangwar, B.; Pandey, D.K.; Gangwar, K.S. Energy auditing of diversified rice–wheat cropping systems in Indo-gangetic plains. Energy 2009, 34, 1091–1096. [Google Scholar] [CrossRef]
  2. Mohammadi, A.; Rafiee, S.; Jafari, A.; Dalgaard, T.; Knudsen, M.T.; Keyhani, A.; Mousavi-Avval, S.H.; Hermansen, J.E. Potential greenhouse gas emission reductions in soybean farming: A combined use of life cycle assessment and data envelopment analysis. J. Clean. Prod. 2013, 54, 89–100. [Google Scholar] [CrossRef]
  3. Malyan, S.K.; Bhatia, A.; Kumar, A.; Gupta, D.K.; Singh, R.; Kumar, S.S.; Tomer, R.; Kumar, O.; Jain, N. Methane production, oxidation and mitigation: A mechanistic understanding and comprehensive evaluation of influencing factors. Sci. Total Environ. 2016, 572, 874–896. [Google Scholar] [CrossRef] [PubMed]
  4. Soni, P.; Taewichit, C.; Salokhe, V.M. Energy consumption and CO 2 emissions in rainfed agricultural production systems of Northeast Thailand. Agric. Syst. 2013, 116, 25–36. [Google Scholar] [CrossRef]
  5. Mansoori, H.; Moghaddam, P.R.; Moradi, R. Energy budget and economic analysis in conventional and organic rice production systems and organic scenarios in the transition period in Iran. Front. Energy 2012, 6, 341. [Google Scholar] [CrossRef]
  6. Le Treut, H.; Somerville, R.; Cubasch, U.; Ding, Y.; Mauritzen, C.; Mokssit, A.; Peterson, T.; Prather, M. Historical Overview of Climate Change. In Climate Change 2007: The Physical Science Basis. Contribution of Working Group I to the Fourth Assessment Report of the Intergovernmental Panel on Climate Change; Cambridge University Press: Cambridge, UK; New York, NY, USA.
  7. MoEF. India: Greenhouse Gas Emissions 2007; INCCA: Indian Network for Climate Change Assessment: New Delhi, India, 2010. [Google Scholar]
  8. Cooper, J.M.; Butler, G.; Leifert, C. Life cycle analysis of greenhouse gas emissions from organic and conventional food production systems, with and without bio-energy options. NJAS Wagening. J. Life Sci. 2011, 58, 185–192. [Google Scholar] [CrossRef] [Green Version]
  9. Olivier, J.G.J.; Janssens-Maenhout, G.; Peters, J.A.H. Trends in Global CO2 Emissions 2012 Report; PBL Netherlands Environmental Assessment Agency: The Hague, The Netherlands, 2016. [Google Scholar]
  10. Pathak, H.; Jain, N.; Bhatia, A.; Patel, J.; Aggarwal, P.K. Carbon footprints of Indian food items. Agric. Ecosyst. Environ. 2010, 139, 66–73. [Google Scholar] [CrossRef]
  11. Vetter, S.H.; Sapkota, T.B.; Hillier, J.; Stirling, C.M.; Macdiarmid, J.I.; Aleksandrowicz, L.; Green, R.; Joy, E.J.M.; Dangour, A.D.; Smith, P. Greenhouse gas emissions from agricultural food production to supply Indian diets: Implications for climate change mitigation. Agric. Ecosyst. Environ. 2017, 237, 234–241. [Google Scholar] [CrossRef] [Green Version]
  12. Khoshnevisan, B.; Bolandnazar, E.; Shamshirband, S.; Shariati, H.M.; Anuar, N.B.; Mat Kiah, M.L. Decreasing environmental impacts of cropping systems using life cycle assessment (LCA) and multi-objective genetic algorithm. J. Clean. Prod. 2015, 86, 67–77. [Google Scholar] [CrossRef]
  13. Mohammadi-Barsari, A.; Firouzi, S.; Aminpanah, H. Energy-use pattern and carbon footprint of rain-fed watermelon production in Iran. Inf. Process. Agric. 2016, 3, 69–75. [Google Scholar] [CrossRef] [Green Version]
  14. Nakashima, T.; Ishikawa, S. Energy inputs and greenhouse gas emissions associated with small-scale farmer sugarcane cropping systems and subsequent bioethanol production in Japan. NJAS Wagening. J. Life Sci. 2016, 76, 43–53. [Google Scholar] [CrossRef]
  15. Schmer, M.R.; Vogel, K.P.; Varvel, G.E.; Follett, R.F.; Mitchell, R.B.; Jin, V.L. Energy Potential and Greenhouse Gas Emissions from Bioenergy Cropping Systems on Marginally Productive Cropland. PLoS ONE 2014, 9, e89501. [Google Scholar] [CrossRef] [PubMed]
  16. Camargo, G.G.T.; Ryan, M.R.; Richard, T.L. Energy Use and Greenhouse Gas Emissions from Crop Production Using the Farm Energy Analysis Tool. Bioscience 2013, 63, 263–273. [Google Scholar] [CrossRef] [Green Version]
  17. Pishgar-Komleh, S.H.; Ghahderijani, M.; Sefeedpari, P. Energy consumption and CO 2 emissions analysis of potato production based on different farm size levels in Iran. J. Clean. Prod. 2012, 33, 183–191. [Google Scholar] [CrossRef]
  18. Firouzi, S.; Nikkhah, A.; Rosentrater, K.A. An integrated analysis of non-renewable energy use, GHG emissions, carbon efficiency of groundnut sole cropping and groundnut-bean intercropping agro-ecosystems. Environ. Prog. Sustain. Energy 2017, 36, 1832–1839. [Google Scholar] [CrossRef]
  19. Lal, R. Carbon emission from farm operations. Environ. Int. 2004, 30, 981–990. [Google Scholar] [CrossRef]
  20. Zhang, X.; Huang, G.H.; Lin, Q.; Yu, H. Petroleum-contaminated groundwater remediation systems design: A data envelopment analysis based approach. Expert Syst. Appl. 2009, 36, 5666–5672. [Google Scholar] [CrossRef]
  21. Kouchaki-Penchah, H.; Nabavi-Pelesaraei, A.; O’Dwyer, J.; Sharifi, M. Environmental management of tea production using joint of life cycle assessment and data envelopment analysis approaches. Environ. Prog. Sustain. Energy 2017, 36, 1116–1122. [Google Scholar] [CrossRef]
  22. Nabavi-Pelesaraei, A.; Rafiee, S.; Hosseinzadeh-Bandbafha, H.; Shamshirband, S. Modeling energy consumption and greenhouse gas emissions for kiwifruit production using artificial neural networks. J. Clean. Prod. 2016, 133, 924–931. [Google Scholar] [CrossRef]
  23. Paramesh, V.; Arunachalam, V.; Nikkhah, A.; Das, B.; Ghnimi, S. Optimization of energy consumption and environmental impacts of arecanut production through coupled data envelopment analysis and life cycle assessment. J. Clean. Prod. 2018, 203, 674–684. [Google Scholar] [CrossRef]
  24. Chauhan, N.S.; Mohapatra, P.K.J.; Pandey, K.P. Improving energy productivity in paddy production through benchmarking—An application of data envelopment analysis. Energy Convers. Manag. 2006, 47, 1063–1085. [Google Scholar] [CrossRef]
  25. Mousavi-Avval, S.H.; Mohammadi, A.; Rafiee, S.; Tabatabaeefar, A. Assessing the technical efficiency of energy use in different barberry production systems. J. Clean. Prod. 2012, 27, 126–132. [Google Scholar] [CrossRef]
  26. Risoud, B. Energy efficiency of various French farming systems: Questions to sustainability. In Proceedings of the International Conference Sustainable Energy: New Challenges for Agriculture and Implications for Land Use, Wageningen, The Netherlands, 18–20 May 2000; pp. 18–20. [Google Scholar]
  27. Dessane, D. Energy efficiency and life cycle analysis of organic and conventional olive groves in the messara valley, Crete, Greece. Master′s Thesis, Wageningen University, Wageningen, The Netherlands, 2003. [Google Scholar]
  28. Singh, H.; Mishra, D.; Nahar, N.; Ranjan, M. Energy use pattern in production agriculture of a typical village in arid zone India: Part II. Energy Convers. Manag. 2003, 44, 1053–1067. [Google Scholar] [CrossRef]
  29. Rafiee, S.; Mousavi Avval, S.H.; Mohammadi, A. Modeling and sensitivity analysis of energy inputs for apple production in Iran. Energy 2010, 35, 3301–3306. [Google Scholar] [CrossRef]
  30. Mobtaker, H.G.; Akram, A.; Keyhani, A.; Mohammadi, A. Optimization of energy required for alfalfa production using data envelopment analysis approach. Energy Sustain. Dev. 2012, 16, 242–248. [Google Scholar] [CrossRef]
  31. Banker, R.D.; Charnes, A.; Cooper, W.W. Some Models for Estimating Technical and Scale Inefficiencies in Data Envelopment Analysis. Manag. Sci. 1984, 30, 1078–1092. [Google Scholar] [CrossRef] [Green Version]
  32. Mohammadi, A.; Rafiee, S.; Mohtasebi, S.S.; Avval, S.H.M.; Rafiee, H. Energy efficiency improvement and input cost saving in kiwifruit production using Data Envelopment Analysis approach. Renew. Energy 2011, 36, 2573–2579. [Google Scholar] [CrossRef]
  33. Cooper, W.W.; Seiford, L.M.; Tone, K. Data Envelopment Analysis: A Comprehensive Text with Models, Applications, References and DEA-Solver Software, 2nd ed.; Springer: Boston, MA, USA, 2007; ISBN 0387452818. [Google Scholar]
  34. West, T.; Marland, G. Net carbon flux from agricultural ecosystems: Methodology for full carbon cycle analyses. Environ. Pollut. 2002, 116, 439–444. [Google Scholar] [CrossRef]
  35. Chaudhary, V.P.; Singh, K.K.; Pratibha, G.; Bhattacharyya, R.; Shamim, M.; Srinivas, I.; Patel, A. Energy conservation and greenhouse gas mitigation under different production systems in rice cultivation. Energy 2017, 130, 307–317. [Google Scholar] [CrossRef]
  36. Tabatabaie, S.M.H.; Rafiee, S.; Keyhani, A. Energy consumption flow and econometric models of two plum cultivars productions in Tehran province of Iran. Energy 2012, 44, 211–216. [Google Scholar] [CrossRef]
  37. Dyer, J.A.; Desjardins, R.L. Carbon dioxide emissions associated with the manufacturing of tractors and farm machinery in Canada. Biosyst. Eng. 2006, 93, 107–118. [Google Scholar] [CrossRef]
  38. Bhatia, A.; Pathak, H.; Aggarwal, P.K. Inventory of methane and nitrous oxide emissions from agricultural soils of India and their global warming potential. Curr. Sci. 2004, 87, 317–324. [Google Scholar]
  39. Alipour, A.; Veisi, H.; Darijani, F.; Mirbagheri, B.; Behbahani, A.G. Study and determination of energy consumption to produce conventional rice of the Guilan province. Res. Agric. Eng. 2012, 58, 99–106. [Google Scholar] [CrossRef] [Green Version]
  40. Yadav, G.S.; Lal, R.; Meena, R.S.; Datta, M.; Babu, S.; Das, A.; Layek, J.; Saha, P. Energy budgeting for designing sustainable and environmentally clean/safer cropping systems for rainfed rice fallow lands in India. J. Clean. Prod. 2017, 158, 29–37. [Google Scholar] [CrossRef]
  41. Bockari-Gevao, S.M.; bin Wan Ismail, W.I.; Yahya, A.; Wan, C.C. Analysis of energy consumption in lowland rice-based cropping system of Malaysia. Energy 2005, 27, 820. [Google Scholar]
  42. AghaAlikhani, M.; Kazemi-Poshtmasari, H.; Habibzadeh, F. Energy use pattern in rice production: A case study from Mazandaran province, Iran. Energy Convers. Manag. 2013, 69, 157–162. [Google Scholar] [CrossRef]
  43. Paramesh, V.; Ravisankar, N.; Das, B.; Reddy, K.V.; Singh, N.P. Energy Budgeting and Sensitivity Analysis of Rice (Oryza sativa)–Wheat (Triticum aestivum) Cropping System in Indogangentic Plains of India. Int. J. Curr. Microbiol. Appl. Sci 2017, 6, 1534–1544. [Google Scholar]
  44. Lorzadeh, S.H.; Mahdavidamghani, A.; Enayatgholizadeh, M.R.; Yousefi, M. Agrochemical Input Application and Energy Use Efficiency of Maize Production Systems in Dezful, Iran. Middle East J. Sci. Res. 2011, 9, 153–156. [Google Scholar]
  45. Pahlavan, R.; Omid, M.; Akram, A. Energy use efficiency in greenhouse tomato production in Iran. Energy 2011, 36, 6714–6719. [Google Scholar] [CrossRef]
  46. Tuti, M.D.; Prakash, V.; Pandey, B.M.; Bhattacharyya, R.; Mahanta, D.; Bisht, J.K.; Kumar, M.; Mina, B.L.; Kumar, N.; Bhatt, J.C.; et al. Energy budgeting of colocasia-based cropping systems in the Indian sub-Himalayas. Energy 2012, 45, 986–993. [Google Scholar] [CrossRef]
  47. Soni, P.; Soe, M.N. Energy balance and energy economic analyses of rice production systems in Ayeyarwaddy Region of Myanmar. Energy Effic. 2016, 9, 223–237. [Google Scholar] [CrossRef]
  48. Kazemi, H.; Kamkar, B.; Lakzaei, S.; Badsar, M.; Shahbyki, M. Energy flow analysis for rice production in different geographical regions of Iran. Energy 2015, 84, 390–396. [Google Scholar] [CrossRef]
  49. Vázquez-Rowe, I.; Hospido, A.; Moreira, M.T.; Feijoo, G. Best practices in life cycle assessment implementation in fisheries. Improving and broadening environmental assessment for seafood production systems. Trends Food Sci. Technol. 2012, 28, 116–131. [Google Scholar] [CrossRef]
  50. Erenstein, O.; Laxmi, V. Zero tillage impacts in India’s rice–wheat systems: A review. Soil Tillage Res. 2008, 100, 1–14. [Google Scholar] [CrossRef]
  51. Harada, H.; Kobayashi, H.; Shindo, H. Reduction in greenhouse gas emissions by no-tilling rice cultivation in Hachirogata polder, northern Japan: Life-cycle inventory analysis. Soil Sci. Plant Nutr. 2007, 53, 668–677. [Google Scholar] [CrossRef]
  52. Hülsbergen, K.-J.; Feil, B.; Biermann, S.; Rathke, G.-W.; Kalk, W.-D.; Diepenbrock, W. A method of energy balancing in crop production and its application in a long-term fertilizer trial. Agric. Ecosyst. Environ. 2001, 86, 303–321. [Google Scholar] [CrossRef]
  53. Pathak, H. Greenhouse Gas Emission fromIndian Agriculture: Trends, Drivers and Mitigation Strategies. Proc. Indian Natl. Sci. Acad. 2015, 81, 1133–1149. [Google Scholar] [CrossRef]
  54. Paramesh, V.; Parajuli, R.; Chakurkar, E.B.; Sreekanth, G.B.; Kumar, H.B.C.; Gokuldas, P.P.; Mahajan, G.R.; Manohara, K.K.; Viswanatha, R.K.; Ravisankar, N. Sustainability, energy budgeting, and life cycle assessment of crop-dairy-fish-poultry mixed farming system for coastal lowlands under humid tropic condition of India. Energy 2019, 188, 116101. [Google Scholar] [CrossRef]
Figure 1. Map of the study area. Gonikoppal represents direct-seeded rice and Siruguppa represents puddled transplanted rice.
Sustainability 12 06439 g001
Figure 2. System boundary of rice production.
Sustainability 12 06439 g002
Figure 3. Energy share (%) of different agricultural inputs in (a) puddled transplanted and (b) direct-seeded rice.
Sustainability 12 06439 g003
Table 1. Energy equivalents of different energy inputs in puddled transplanted and direct-seeded rice production systems.
Inputs (Unit)Energy Equivalent (MJ U−1)
Labor (h)1.96
Machinery (h)62.7
Diesel (L)56.31
Farmyard Manure (kg)0.3
Leaf Manure (kg)2.02
Nitrogen (kg)66.1
Phosphorus (kg)12.4
Potassium (kg)11.1
Zinc sulfate20.9
Herbicides (kg)102
Fungicides (kg)97
Pesticides (kg)184.63
Irrigation water (m3)1.02
Seeds (kg)3.6
Rice grain14.7
Rice straw12.5
Table 2. Carbon coefficients of different inputs used in a rice production system.
ParticularsGHG Coefficients
(kg CO2 eq. unit−1)
References
Diesel0.94Tabatabaie et al. [36]
Machinery (MJ)0.071Dyer and Desjardins [37]
Nitrogen1.3Lal [19]
Phosphorus0.2
Potassium0.15
FYM0.007
Zinc sulfate4.18
Herbicide6.3
Insecticide5.1
Fungicide3.9
Transplanted (kg CH4 ha−1)162Bhatia et al. [38]
Direct sown (kg CH4 ha−1)18
Table 3. Energy consumption pattern of puddled transplanted rice and direct-seeded rice systems per hectare.
Inputs (Unit)Puddled Transplanted RiceDirect-Seeded Rice
Quantity per Unit Area (ha)Total Energy Equivalent (MJ ha−1)Quantity per Unit Area (ha)Total Energy Equivalent (MJ ha−1)
Input
Labor (man days)718.2 ± 10.21407.6 ± 20.1315 ± 20.8617 ± 40.7
Machinery (hr)11.6 ± 0.2724.3 ± 15.27.89 ± 0.8494.4 ± 48.9
Diesel (L)56.2 ± 1.02690.4 ± 46.618.4 ± 0.6882.2 ± 139.5
FYM (kg)4326.4±330.91297.9 ± 992813.7 ± 327.3844.1 ± 98.3
Leaf manure (kg)561.6 ± 162.91134.3 ± 328.2
Nitrogen (kg)183.1 ± 1.611,097.9 ± 96.936.8 ± 4.12228.8 ± 245.2
Phosphorus (kg)134.2 ± 2.51489.7 ± 28.141.4 ± 4.8459.1 ± 53.3
Potassium (kg)78.8 ± 0527.6 ± 034.9 ± 4.0233.7 ± 27.1
Zinc sulfate (kg)3.9 ± 1.082 ± 21.4
Herbicides (kg/L)3 ± 0.1758.6 ± 24.21.1 ± 0.4284.6 ± 103.5
Fungicides (kg/L)1.8 ± 0.2172.6 ± 190.2 ± 0.014.6 ± 4.3
Pesticides (kg/L)2.7 ± 0.1491.6 ± 9.20.2 ± 0.142 ± 13.5
Irrigation water (m3)13,753±301.214,028.1±307.7
Seeds (kg)62.5 ± 0918.8 ± 034.5 ± 2.0506.5 ± 29.5
Total energy input (MJ/ha)35,605 ±7823 ±
Output
Rice grain (kg)5569 ± 77.281,871 ± 1134.41947.8 ± 95.528,632 ± 1405.9
Rice straw (kg)5912 ± 80.773,905 ± 1008.51967.6 ± 143.224,594.6 ± 1797.3
Total energy output (MJ/ha)1557.76±53,227 ±
Table 4. Energy indices in rice production system.
ItemsUnitsPTRDSR
Energy efficiency4.47.3
Energy productivitykg MJ−10.20.3
Energy profitability3.46.3
Net energyMJ ha−1120,17145,403
Specific energyMJ kg−16.44.1
Human energy profitability 111.098.7
Nutrient energy ratio 10.813.0
Direct energy aMJ ha−14098 (13%)3478 (44%)
Indirect energy bMJ ha−131,507 (87%)3839 (56%)
Renewable energy cMJ ha−12706 (7.6%)3102 (39.7%)
Non-renewable energy dMJ ha−132,899 (92.4%)4721.3 (60.3%)
a Includes electricity, diesel fuel and human labor. b Includes biocide, chemical fertilizer, irrigation water, farmyard manure, organic fertilizers and machinery. c Includes human labor and farmyard manure, irrigation water and organic fertilizers. d Includes electricity, machinery, diesel fuel, chemical fertilizer and biocide.
Table 5. Average technical, pure and scale efficiency of paddy farmers (200 units).
DSRAverageMaximumMinimumSD
Technical efficiency0.981.000.640.08
Pure technical efficiency0.981.000.640.06
Scale efficiency0.991.000.830.03
PTR
Technical efficiency0.941.000.870.05
Pure technical efficiency1.001.001.001.00
Scale efficiency0.941.000.870.05
Table 6. Technical efficiency (TE) and operational reduction of energy inputs (MJ) for the inefficient puddled transplanted rice system.
DMUTEOperation Reduction
LaborsMachineryDieselNPKFYMIrrigation
10.9259.40.94.213.19.46.2242.2937.7
30.9161.71.04.716.113.17.1562.31088.3
40.8883.21.46.623.214.69.5375.01693.5
50.8970.81.25.918.715.38.3490.21581.3
60.972.21.15.219.012.07.8307.31586.0
70.9261.31.04.814.812.16.6258.31000.0
80.9537.80.52.89.86.14.0157.6661.0
90.8795.71.77.423.319.110.4407.71578.3
100.9443.90.63.312.17.65.0195.4882.5
140.9256.00.94.515.69.86.4252.41058.6
150.9162.01.04.615.412.66.9269.81044.3
160.971.61.15.820.012.68.2322.61456.8
170.8797.51.57.123.018.810.2804.21945.6
180.967.91.05.619.212.17.9619.31598.2
190.9256.11.03.913.410.95.9233.7904.6
200.9718.60.31.55.13.22.1165.6347.3
210.9444.50.73.410.78.84.8187.3724.9
220.8885.31.36.823.314.69.5751.51696.8
230.8976.61.35.920.016.38.9524.11690.5
270.8885.41.46.521.117.29.3367.81423.7
290.8975.51.46.119.315.78.5336.41627.9
300.9259.00.84.616.110.16.6520.01341.8
310.8975.51.36.119.315.78.5336.41302.3
320.9632.80.52.38.55.33.5205.3573.9
330.9262.71.04.814.812.16.6258.31000.0
340.9441.30.63.110.86.84.4174.2786.5
350.8794.71.47.423.319.110.4407.71972.9
360.8882.21.36.022.213.99.1358.11848.1
370.9814.00.21.13.62.91.662.9243.5
400.9344.30.73.713.18.35.4212.1957.9
410.8976.91.35.919.816.28.8346.41676.3
420.8975.91.16.121.013.28.6338.11745.2
430.8889.51.46.721.617.69.6377.11459.7
440.972.01.25.619.212.17.9620.01300.0
450.9353.50.83.913.010.75.8455.9882.4
460.9350.90.84.113.98.75.7448.51012.8
470.9444.50.73.611.59.45.1401.3970.8
480.8879.51.26.522.514.19.2724.61869.9
490.9162.91.24.816.413.47.3573.51110.0
530.9811.00.20.92.82.31.249.1237.4
560.9259.30.94.515.69.86.4252.41058.6
570.8975.71.36.119.315.88.6674.41305.3
580.9440.10.63.010.96.94.5176.4796.7
590.9250.81.04.313.411.06.0351.71134.5
600.999.00.10.72.51.61.040.3207.8
610.8791.51.67.423.319.110.4407.71578.3
620.973.71.05.219.212.17.9310.51302.0
660.8788.71.47.024.515.410.0592.52038.8
670.972.01.25.317.914.68.0313.31212.8
680.973.21.15.719.512.38.0315.31322.0
690.8880.71.56.621.317.49.5372.21440.8
710.9165.81.14.816.413.47.3573.11386.6
720.9260.00.94.816.010.16.6516.71333.3
730.9443.50.73.410.78.84.8374.6724.9
740.8790.71.57.224.815.610.1798.71674.7
750.9163.31.04.916.513.57.3577.61117.9
760.9718.20.31.55.33.32.2171.7387.6
790.8879.71.56.420.817.09.2363.31406.5
800.9439.80.52.910.66.74.4171.3718.5
810.8977.31.36.119.315.78.5336.41302.3
820.9537.30.52.78.76.34.1160.7725.6
850.8986.81.47.019.613.78.4329.71786.6
860.9822.50.31.43.83.51.869.7283.5
870.9449.20.84.111.47.94.8190.8839.9
880.9721.60.52.15.44.92.598.3399.7
890.9350.20.84.412.28.55.2409.5970.8
900.9260.41.25.214.012.76.5508.81292.6
910.9443.30.73.910.67.44.5356.7966.6
930.9253.61.15.214.29.96.1477.61051.5
940.9812.60.21.13.12.81.4112.2227.9
980.9448.61.04.110.79.74.9388.2788.9
990.9439.30.73.610.47.34.4315.3771.3
1000.9541.90.73.28.27.43.8351.5605.3
Mean 59.31.04.615.211.26.5358.31136.7
Table 7. Technical efficiency (TE) and operational reduction of energy inputs (MJ) for the inefficient rice fields in using the direct-seeded rice method.
DMUTELaborMachineryDieselSeedsNPKMicronutrientsFYMLeaf ManureHerbicide
230.6894.91.96.311.115.815.815.83.2791.10.00.0
240.7573.71.22.57.46.112.36.12.0614.0122.80.0
340.9221.31.00.62.03.93.92.40.2197.063.00.4
410.6893.14.96.519.432.348.548.50.01617.097.00.0
440.6465.64.712.818.218.218.218.23.61092.9728.60.3
450.967.80.60.61.91.12.22.20.443.243.20.0
500.8355.00.82.55.84.28.34.21.7500.40.00.7
550.9319.90.51.32.02.03.32.70.7132.666.30.3
560.987.10.10.20.60.51.10.50.043.221.60.0
630.8382.61.33.88.86.312.56.32.5750.60.01.0
680.9329.80.82.03.03.05.04.01.0198.999.50.4
950.68122.52.48.214.320.420.420.44.11020.50.00.0
960.7595.01.63.29.57.915.87.92.5792.1158.40.0
Mean 59.11.73.98.09.412.910.71.7599.5107.70.2
Table 8. Total economic saving (TES) linked to the accomplishment of operational targets in puddled transplanted rice.
DMULaborsMachineryDieselNPKFYMIrrigationTES ($/ha)
1126.318.314.94.014.450.261.895.7413.0
3131.120.217.04.920.158.3143.4111.0537.8
4176.928.423.67.122.477.895.7172.8646.9
5150.623.521.15.723.467.8125.1161.4615.2
6153.422.118.55.818.363.778.4161.8559.8
7130.419.617.04.518.553.665.9102.0442.6
880.410.710.23.09.432.740.267.5272.6
9203.534.026.37.129.284.6104.0161.0697.6
1093.312.611.83.711.740.549.990.1336.4
14119.119.115.94.815.152.364.4108.0421.9
15131.719.416.34.719.355.968.8106.6447.5
16152.223.220.86.119.266.982.3148.7554.5
17207.430.425.47.028.883.4205.1198.5829.8
18144.421.120.05.918.564.2158.0163.1628.8
19119.219.514.14.116.748.559.692.3399.4
2039.55.35.41.64.917.242.235.4160.7
2194.514.912.13.313.438.847.874.0319.1
22181.425.624.27.122.477.9191.7173.1744.4
23162.926.521.16.125.072.5133.7172.5661.7
27181.627.823.26.426.376.393.8145.3616.8
29160.628.021.75.924.169.885.8166.1592.8
30125.516.716.44.915.553.9132.6136.9526.4
31160.626.721.75.924.169.885.8132.9558.3
3269.89.38.32.68.228.452.458.6250.1
33133.219.617.04.518.553.665.9102.0438.0
3487.913.211.23.310.436.144.480.3306.4
35201.329.326.37.129.284.6104.0201.3732.3
36174.825.821.66.821.374.391.3188.6646.6
3729.74.84.01.14.513.016.024.8105.0
4094.313.613.44.012.644.054.197.7357.7
41163.527.520.96.124.871.888.4171.1613.0
42161.423.021.86.420.270.186.3178.1605.3
43190.328.523.86.627.078.296.2148.9642.0
44153.123.520.05.918.564.3158.2132.7610.9
45113.816.413.84.016.347.3116.390.0443.5
46108.316.114.84.313.446.5114.4103.3445.4
4794.715.212.93.514.441.6102.499.1405.5
48168.924.723.36.921.675.1184.8190.8735.7
49133.723.917.35.020.559.5146.3113.3550.7
5323.43.73.10.93.510.212.524.285.8
56126.018.215.94.815.152.364.4108.0427.9
57160.925.521.75.924.169.9172.0133.2644.4
5885.212.010.63.310.536.645.081.3300.8
59108.019.515.44.116.848.689.7115.8439.5
6019.22.62.60.82.48.310.321.271.1
61194.632.426.37.129.284.6104.0161.0689.1
62156.721.218.75.918.564.479.2132.9535.5
66188.528.424.97.523.681.9151.2208.0758.5
67153.023.718.95.522.465.079.9123.8527.4
68155.721.520.36.018.865.480.4134.9538.4
69171.531.023.56.526.677.295.0147.0620.2
71139.922.817.35.020.559.4146.2141.5584.9
72127.617.617.04.915.453.6131.8136.1533.0
7392.514.212.13.313.438.895.674.0364.8
74192.830.225.77.623.882.8203.7170.9784.5
75134.720.817.45.120.759.9147.3114.1553.8
7638.66.25.41.65.117.843.839.6168.4
79169.430.322.96.426.075.392.7143.5599.9
8084.611.010.33.310.235.543.773.3287.7
81164.326.721.75.924.169.885.8132.9562.0
8279.310.39.72.79.633.341.074.0274.7
85184.528.524.96.021.068.484.1182.3639.4
8647.86.35.01.25.314.517.828.9135.3
87104.615.614.73.512.139.648.785.7347.5
8845.99.87.41.77.520.425.140.8170.4
89106.715.815.83.713.042.5104.599.1425.8
90128.424.318.44.319.452.8129.8131.9540.0
9192.014.614.13.211.437.091.098.6382.8
93114.021.718.54.315.249.5121.8107.3480.4
9426.84.84.10.94.311.628.623.3111.0
98103.319.414.73.314.840.299.080.5398.6
9983.513.512.73.211.236.380.478.7340.6
10089.114.211.52.511.430.989.761.8328.9
Mean126.019.516.64.717.153.491.4116.0472.9
Table 9. Total economic saving (TES) linked to the accomplishment of operational targets in direct-seeded rice.
DMULaborMachineryPKMicronutrientsFYMLeaf ManureTES ($/ha)
2321.40.20.65.31.1186.20.0214.7
2416.60.10.52.10.7144.54.3168.7
344.80.10.20.80.146.42.254.5
4121.00.41.916.40.0380.53.4423.6
4414.80.40.76.11.2257.225.5306.0
451.70.10.10.70.110.21.514.4
5012.40.10.31.40.6117.80.0132.5
554.50.00.10.90.231.22.339.3
561.60.00.00.20.010.20.812.8
6318.60.10.52.10.8176.60.0198.8
686.70.10.21.30.346.83.559.0
9527.60.20.86.91.4240.20.0277.0
9621.40.10.62.70.9186.45.5217.6
Mean13.30.20.53.60.6141.13.8163.0
Table 10. Estimated average greenhouse gas (GHG) emission (kg ha−1), C output (kg ha−1), carbon sustainability index and carbon efficiency under different paddy establishment techniques.
ParticularsPTRDSR
Machinery51.435.1
Diesel155.150.9
Nitrogen238.147.8
Phosphorus26.88.3
Potassium11.85.2
Farmyard manure30.319.7
Leaf manure3.9
ZnSO416.4
Herbicides18.87.0
Insecticides13.61.2
Fungicides6.90.6
On-farm emission3402.0378.0
GHG emission CO2 equivalents3954.8574.1
Carbon output4592.71566.1
Carbon input1078.6156.6
Carbon efficiency ratio4.310.1
Carbon sustainability index3.39.1
Estimated average GHG emission0.190.31

