The Role of Perceived Smart Tourism Technology Experience for Tourist Satisfaction, Happiness and Revisit Intention


1
Faculty of Hospitality and Tourism Management, Macau University of Science and Technology, Aveida Wai Long, Taipa, Macau, China
2
Department of Tourism Management, College of Social Sciences, Gangneung-Wonju National Univesity, Jukheon-gil 7, Gangneung-si, Gangwon-do 25457, Korea
*
Author to whom correspondence should be addressed.
Sustainability 2020, 12(16), 6592; https://0-doi-org.brum.beds.ac.uk/10.3390/su12166592
Submission received: 18 July 2020
/
Revised: 5 August 2020
/
Accepted: 12 August 2020
/
Published: 14 August 2020
(This article belongs to the Special Issue Tourism, Smart Specialization and Sustainable Development)
Abstract
:The rapid advancement of smart tourism technology brings new opportunities for tourism development. More travel destinations are relying on smart technology to attract more tourists to visit and enrich their travel experience. The main purpose of this study was to explore whether tourists are satisfied with their smart tourism technology experience (i.e., informativeness, accessibility, interactivity, personalization, and security). This study also investigated the impact of smart tourism technology experience on tourists’ happiness and revisit intention. This study used a structural equation method to find the relationship among smart tourism technology attributes, travel satisfaction, happiness, and revisit intention. Surveys of a total of 527 participants who traveled to Macau from Mainland China were used for the analysis. The results showed that accessibility is the most important factor affecting the smart tourism technology experience and personalization the least. Smart tourism technology experience is shown to be significantly associated with travel experience satisfaction, and travel experience satisfaction has a positive effect on both tourists’ happiness and revisit intention. Finally, tourist happiness is also shown to be positively associated with revisit intention. This study provides theoretical and practical significance for the development of smart tourism in the future.
1. Introduction
With the rapid development of information and communication technology (ICT), the traditional tourism industry has entered an era of smart tourism and smart technologies are now widely used in the tourism industry. Smart technologies explore innovative ways to create memorable experiences for tourists by extending destination co-creation space [1]. From the perspective of tourists, the position of smart technology in travel has become more important. In the initial stage, tourists mainly used ICT for travel information searching and decision-making [2]. With this trend, many tourism-related businesses have adopted various smart technologies for promoting and marketing their destinations. To develop a smart tourism destination, government and destination marketing organizations (DMOs) often establish an evaluation system according to the policy for smart cities [3]. However, the ultimate goal of smart tourism is to create a more convenient and enjoyable travel experience for tourists.
Nowadays, as an important element of experience, smart technologies play an irreplaceable role in travel. Most tourists use smart technologies such as location queries, local restaurant reviews, or mobile payments through smart phones during their travel. Smart technologies are used throughout the whole travel process, including DMOs websites, tourism apps, social media, and virtual reality for tourists to arrange and enrich their trips. Researchers have recognized the potential of smart technologies and predicted that the smart technologies used by tourists will become more diversified [4]. Especially with the popularity and development of smart phones, tourists can use travel-related apps to plan their travel anytime and anywhere [5].
Tourism development can improve quality of life and travel as a source of happiness [6,7,8]. The pursuit of novelty and high-quality tourism has become a new kind of life experience, often considered an important way to pursue happiness. Most studies on happiness and tourism focus on investigating the influence of destination value and tourist interaction on tourists’ happiness [9,10,11,12,13]. A few scholars have explored the relationship between smart tourism experience and happiness. Lee, Lee, Chung, and Koo [14] found that tourists in South Korea are likely to place more value on what they perceive from their destination travel experiences than what they perceive from their experiences with smart tourism technology (STT) services when they evaluate their overall happiness. Kim and Hall [15] investigated the hedonic motivation adoption frameworks of virtual reality (VR) tourism and found that perceived enjoyment deeply affects subjective wellbeing.
Despite these findings, little is known about how smart tourism experiences boost happiness. To date, no studies have built a holistic conceptualization about perceived smart tourism experience and happiness in the Chinese population. In order to fill this gap, this paper aims to develop and investigate a conceptually comprehensive model on STT attributes, travel satisfaction, happiness, and revisit intention. Therefore, the main purpose of this paper is to explore tourists’ experiences of smart tourism and then, to study whether the smart tourism experience can boost tourists’ happiness.
Three aspects were identified as the objectives of this study:
- (1)
- To investigate the main attributes affecting the use of STT by Chinese tourists and the relative importance of these factors to the satisfaction of Chinese tourists’ experience;
- (2)
- To examine whether travel satisfaction towards each STT attribute affects Chinese tourists’ happiness;
- (3)
- To demonstrate the influence of Chinese tourists’ perception of STT on their revisit intention through their satisfaction and happiness with the tourism experience.
2. Literature Review
2.1. Smart Tourism
Smart, as a new concept, often involves practical devices in the context of economic and social development, including smartphones, smart TVs, and smart cars. Smart here means intelligent, eco-friendly, sustainable, integrated, and ubiquitous [16]. The term of smart has been applied to tourism based on the way in which integrated technologies, real-time data, and physical infrastructure have been combined into a single complex environment much like a city, thus, making great achievements. The practical applications of smart tourism develop faster than academic work because they are initiated as marketing strategies and government projects. However, there is a lack of agreement in the literature about the definition of smart tourism; the term can variously refer to a type of management, a trend, or an information service.
Zhang, Li, and Liu [17] defined smart tourism as a systematic and intensive management transformation. They believed that smart tourism could lead to resource optimization and value co-creation between tourists and providers. Thus, they constructed a capabilities–attributes–applications framework to describe the principle of smart tourism. The framework concerns the application background of smart tourism, which provides market strategies for DMOs and private companies to achieve public welfare and profit. According to Gretzel, Sigala, Xiang, and Koo [18], smart tourism is a new trend in the tourism industry with three components and layers: smart destination, smart business ecosystem, and smart experience, all of which are based on data collection, exchange, and processing. Li, Hu, Huang, and Duan [19] intended that the essence of smart tourism is the ubiquitous tour with information service. They emphasized that the information service is everywhere and can exist in any part of the travel process, allowing tourists to access it freely. However, smart tourism is not only a simple application of ICT but also an ecosystem that enables tourists, DMOs, and other tourism stakeholder interactions, thus, creating more value, especially the co-creation value generated by tourists. It is a mobile information system that is combined with information and physical infrastructure to create a new experience for tourists [20].
2.2. Benefits of Smart Devices in Tourism
With the development of information technology (IT), all industries have inevitably embraced new technologies or experienced their benefits, and tourism is not an exception [21]. The application of smart devices in the context of the tourism industry is becoming increasingly extensive, which maximizes the value of tourism resources and produces enormous social and economic benefits. Examples of smart devices include wearable and portable devices—smartphones, smart glasses, smart watches. In addition, all venues and departments in the tourism industry tap into smart devices, such as self-service check-in kiosks in hotels, flight check-in service machines in airports, self-service ticket machines, and tour guide systems in travel attractions. Tourists benefit from convenient and efficient services by adopting these smart devices.
Due to the innovation and improvement of ICT and portability with practicability, wearable and portable devices are favored by tourists. It is worth mentioning that smartphones play key roles in the leisure experience [22]. Smartphones combined with mobile networks, the internet of things (IoT), and near field communication (NFC) technologies have generated various tourism-related applications, changing the whole industry. With smart devices, more tourists plan travel on their own instead of through third parties such as travel agencies. Smart technologies enable people to book airline tickets, hotels, and other tourism products on the platform of mobile sites [23] and easily obtain information on destination transportation, accommodation, and attractions on their smartphones when they need it. More specifically, tourists use smart phones to browse websites, social networks, and service platforms, which not only supply the updates and real-time information on the destination but also directly communicate with other tourists and tourism marketers to make better travel decisions [24]. Moreover, tourists can connect to WiFi services and make mobile payments (such as for bus tickets) by scanning a QR code at the destination. Smart devices with new technologies bring new development opportunities for tourism.
2.3. Smart Tourism and Perceived STTs
ICT is the key factor, both the carrier and manifestation, of smart tourism. STTs include not only smart devices but also, for instance, social platforms, cloud computing, big data, IoT, artificial intelligence (AI), virtual reality (VR), augmented reality (AR), mixed reality, NFC, and radio-frequency identification (RFID), which are related to tourism activities. Especially, VR and AR are emerging STTs. These technologies have become popular in recent years in the context of tourism. Park and Stangl [25] investigated the AR experience from the perspective of sensation-seeking and identified experience-seeking and boredom-susceptibility as two key elements in the AR experience. STTs rely more on the value created by tourists than on the technology itself. The research on STTs can be divided into two themes: traditional online information channels and other new technologies. Online information is generated by tourists, and social media is one popular platform for seeking travel information. No and Kim [26] identified four types of online tourism information sources: blogs, public websites, company websites, and social media websites. No and Kim [26] also identified five features of online information: accessibility, security, information-trust, interaction, and personalization. Their results showed that security is the dominant attribute for public websites. Huang, Goo, Nam, and Yoo [27] summarized the attributes of STT as informativeness, accessibility, interactivity, and personalization.
2.4. Perceived STTSs
2.4.1. Informativeness
Informativeness represents a combination of the quality, credibility, and accuracy of information received from STTs at tourism destinations [27]. Informativeness is important to STTs and can directly influence tourists’ attitudes toward them. When STTs provide relevant, sufficient, and accurate information on activities, accommodation, and transportation, the time and effort in searching the information is reduced, and tourists are satisfied with their experience. Informativeness stimulates tourists’ rational judgement about the destination and helps them make efficient decisions.
2.4.2. Accessibility
Accessibility represents the extent to which travelers can easily access and use the information offered at the destination by using different types of STTs [27]. Accessibility determines the usability of STTs at the destination. Individuals tend to explore more information about the destination when STTs are highly accessible.
2.4.3. Interactivity
Interactivity is defined as a facilitator that promotes travelers’ real-time feedback and active communications when using STTs [27]. This affects tourists’ responses to STTs. In social media services, when tourists perceive a high level of interactivity, they tend to adopt the service and communicate more with tourism suppliers through purchasing behavior, commenting, and feedback [28].
2.4.4. Personalization
Personalization refers to the ability of a traveler to obtain specific information to suit his or her personal trip planning needs by using various types of STTs [4,26]. According to their previous purchasing behavior, personality, and preference, tourists can receive suitable recommendations through big data or cloud computing.
2.4.5. Security
2.5. Happiness and Tourists’ Travel Satisfaction
Happiness is usually interpreted as a quality of life or level of hedonic happiness [6,8]. Subjective wellbeing or life satisfaction can be identified as an indicator of happiness. Empirical studies have shown that tourism or travel is a process of seeking hedonic experience, and tourists’ happiness varies according to their personality, destination types, and types of travel activities [13,29,30]. Travel prolongs happiness by reducing hedonic adaptation, especially in terms of expectation and serendipity [31]. A positive experience during a trip can increase people’s overall happiness, and interaction can be identified as one of the most important factors that enhances happiness [32]. Lee et al. [14] investigated the tourists’ value-seeking processes and concluded that tourists’ happiness can be increased through travel experience satisfaction and service experience satisfaction.
Smart tourism involves all aspects of tourism, including transportation, accommodation, and attractions. When tourists have positive emotions and attitudes toward STTs, their experience in the destination will be satisfied. As a result, travel satisfaction produces tourist happiness.
This study focuses on perceived STTs in travel satisfaction; therefore, the following hypotheses are proposed:
Hypothesis 1 (H1).
Perceived STTs are positively associated with tourist travel satisfaction.
Hypothesis 2 (H2).
Tourist travel satisfaction is positively associated with tourist happiness.
2.6. Tourists’ Travel Satisfaction and Revisit Intention
In the field of tourism studies, tourists’ satisfaction plays an essential role in predicating behavioral intention. Behavioral intention, also known as loyalty, refers to recommendation intention and revisit intention toward the destination. Tourists’ revisit intention reflects the degree of the willingness of tourists to revisit the destination. Tourists’ satisfactory experiences produce intention to revisit the destination [33]. Meng and Han [34] found that working-holiday tourism satisfaction with the destination can positively and significantly influence intention to revisit and word-of-mouth intention.
In summary, many scholars have attempted to create constructs that can increase tourists’ satisfaction and revisit intention. Previous studies have found that satisfaction has a positive association with revisit intention [35,36,37]. Therefore, this study proposes the following hypotheses:
Hypothesis 3 (H3).
Tourist travel satisfaction is positively associated with tourist revisit intention.
Hypothesis 4 (H4).
Tourist happiness is positively associated with revisit intention.
3. Research Design
3.1. Research Architecture
The main purpose of this study is to understand Chinese tourists’ perceived STT experience and how perceived STT affects overall travel experience satisfaction. Therefore, this study investigated how tourists’ travel satisfaction affects happiness and revisit intention to the destination, based on five perceived STT attributes. For this purpose, we selected tourists who traveled Macau since Macau local government has announced smart tourism as an official development strategy. In addition, Macau is a popular cultural and leisure destination attracting many tourists from China.
3.2. Research Hypotheses
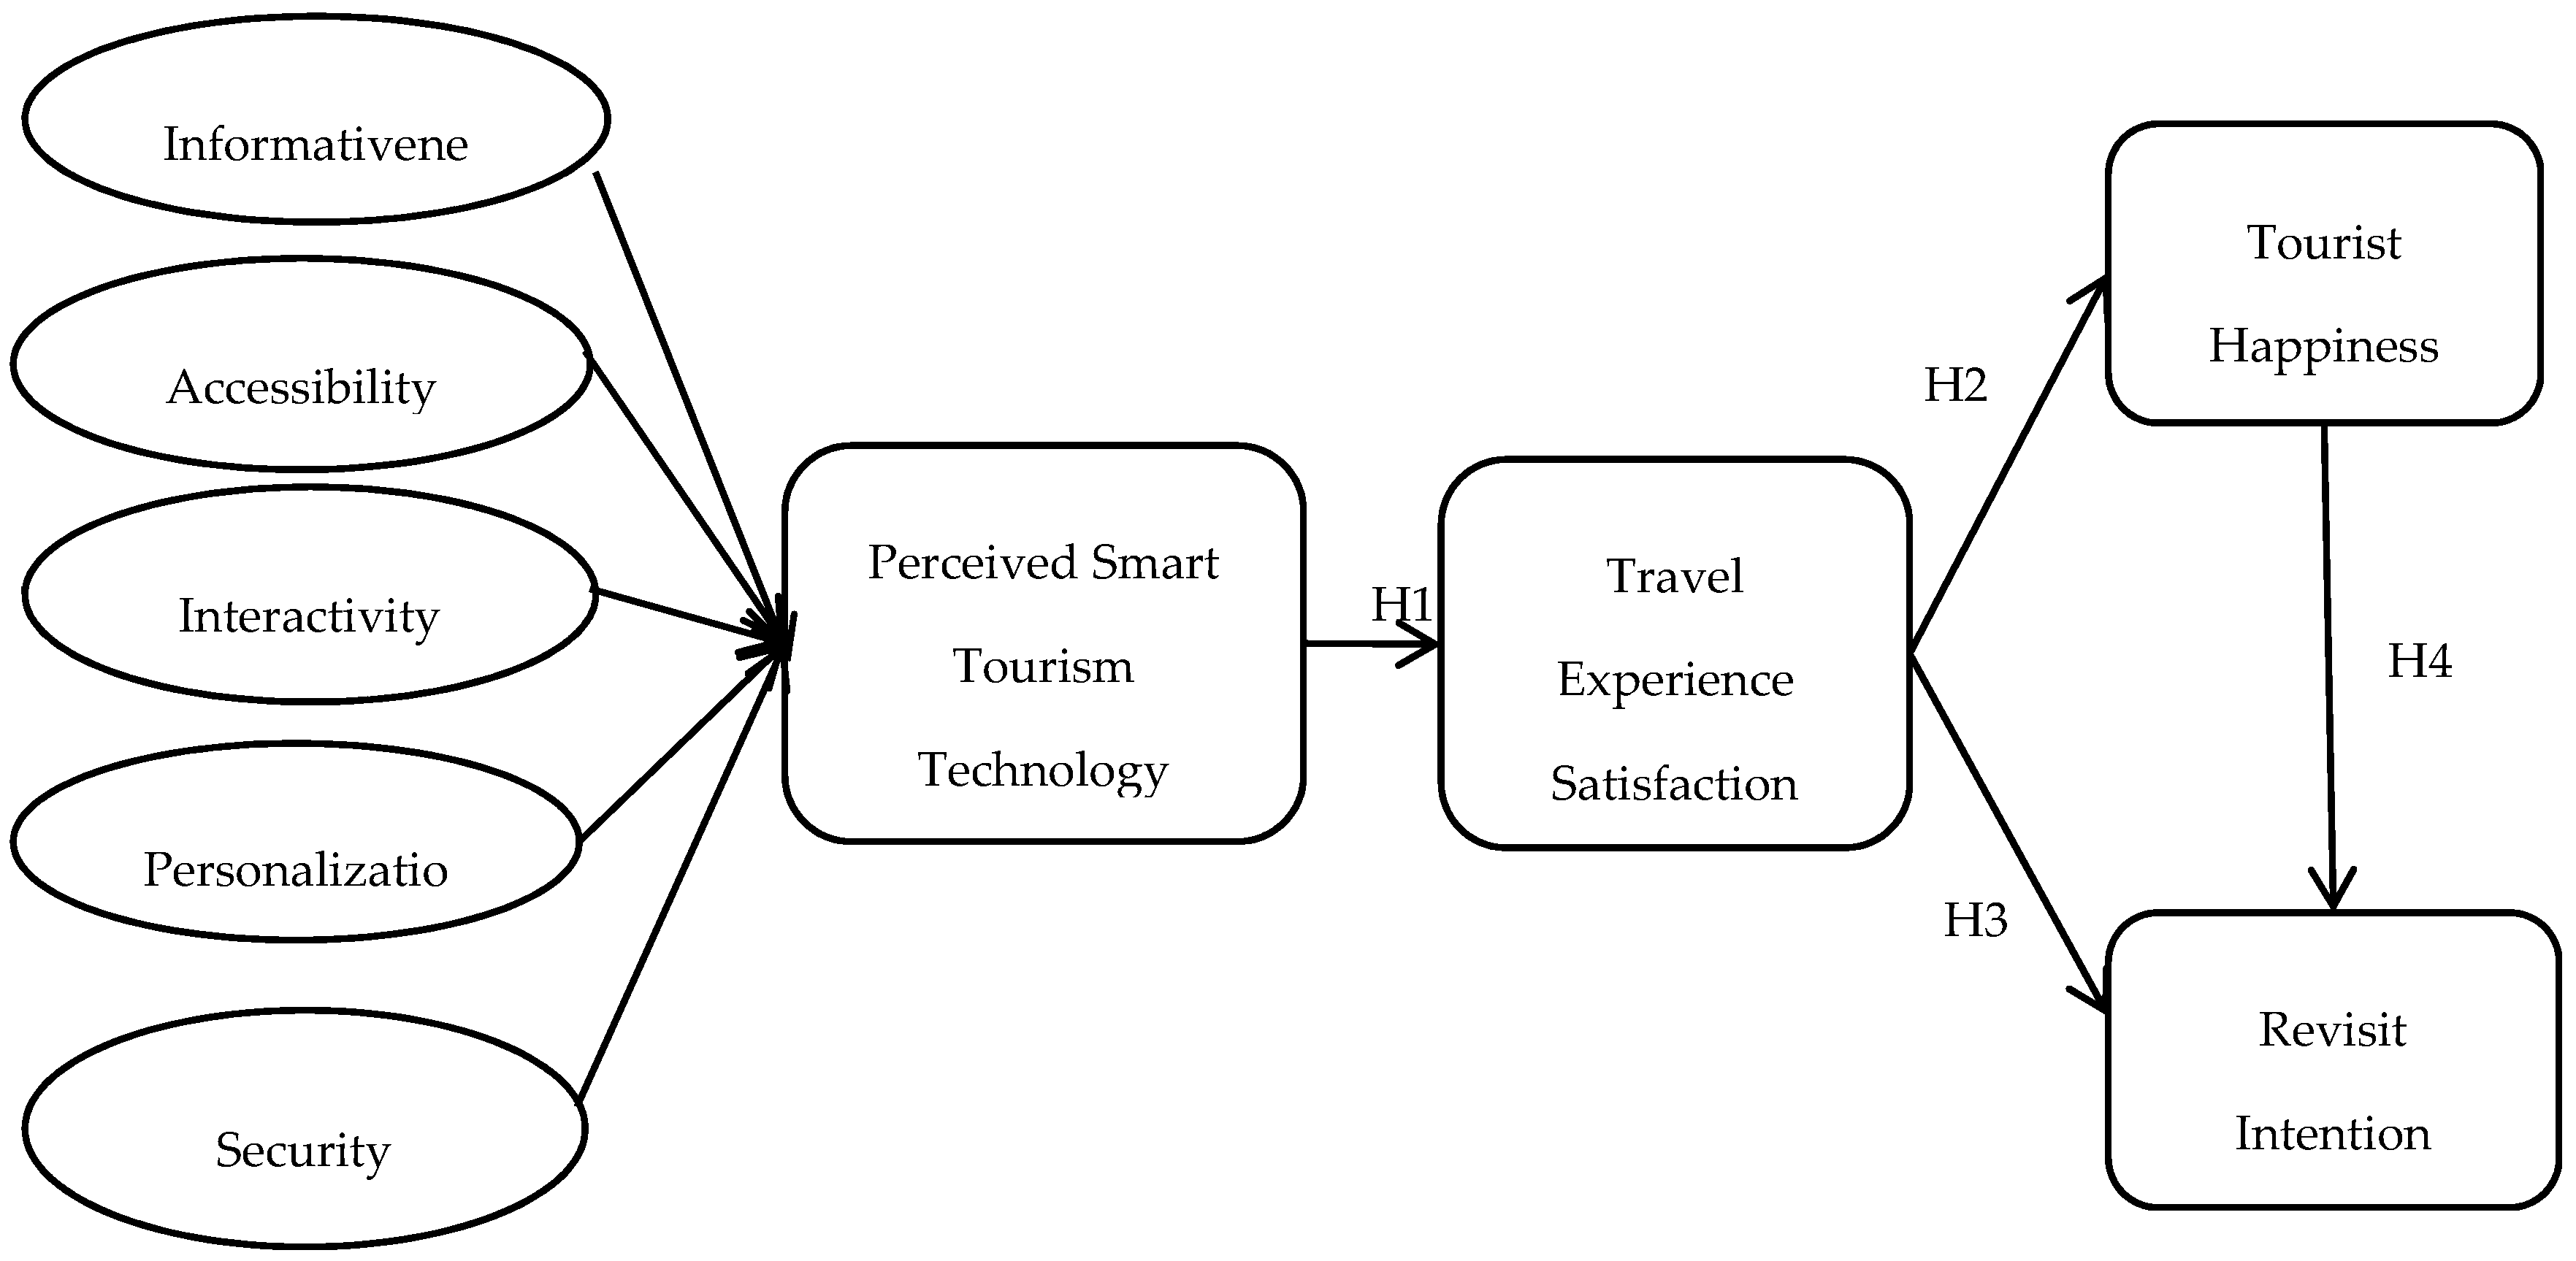
Tourists’ perceived STT was selected and classified according to the literature review, which identified five attributes: informativeness, accessibility, interactivity, personalization, and security. The perceived STT experience of Chinese tourists was assumed to have an impact on tourists’ travel satisfaction and tourist happiness from travel experience satisfaction. Finally, revisit intention was posited to identify the relationships between travel experience satisfaction and tourist happiness.
The research hypothesis model is shown in Figure 1.
3.3. Questionnaire Design
The measurement items were adopted from the previous literature and modified for this study. The measures of the eight constructs consist of perceived STT experience, travel satisfaction, happiness, and revisit intention. We reconstructed perceived STT experience for our study based on informativeness, accessibility, interactivity, personalization, and security. The five items related to informativeness were adapted from Luo [38], No and Kim [26], Lee et al. [14], and Yoo et al. [20]. The five items related to accessibility were adapted from No and Kim [26] and Lee et al. [14]. The four items related to interactivity were adapted from No and Kim [26], Yoo et al. [20], and Lee et al. [14]. The four items related to personalization were adapted from No and Kim [26], Huang et al. [27], and Lee et al. [14]. Finally, the five items related to security were adapted from Mills and Morrison [39], No and Kim [26], and Huang et al. [27]. For the construct of overall travel experience satisfaction, six items were adapted from Neal, Sirgy, and Uysal [40], Lee et al. [14], Kim, Woo, and Uysal [41], and Su, Huang, and Chen [42]. The four items related to happiness were adapted from Neal et al. [40], Su et al. [42], and Lee et al. [14], and the four items related to revisit intention were adapted from Kim et al. [41] and Kim, Lee, Uysal, Kim, and Ahn [43].
The multi-measurement items were used to prevent measurement errors. All items in this study were measured on a seven-point Likert scale, ranging from strongly disagree (1) to strongly agree (7). The survey was written in English and translated into Chinese. A pilot test was conducted to check face validity. When the study questionnaires were distributed, respondents were asked to read an introductory paper on STT before filing out the questionnaires.
The questionnaires were divided into two parts, with a seven-point Likert scale used in the first part. All questions were adopted from tourism and technology studies and modified for the context of STT. The second part collected the demographic information of the respondents, including gender, age, educational background, occupational background, income level, city of residence, frequency of travel, and length of time the respondents had been using STTs.
3.4. Sample Collection
To select an appropriate sample, we asked the screening question: “Have you ever used smart tourism technologies in Macau?” Those who answered that they had not used smart tourism technologies in Macau were excluded.
A total of 150 pretest questionnaires were distributed, and 127 valid copies were collected. The statistics indicated that the α value of each item was between 0.802 and 0.92, which was greater than 0.8. Therefore, the questionnaire was considered highly reliable. In addition, after the distribution and communication process of the pretest, the wording of some questions was adjusted to avoid vague sentences before the final questionnaires were officially released. The official distribution sites of the questionnaires were tourist attractions in Macau, and all respondents were Chinese tourists visiting Macau. A total of 587 copies were distributed by a simple random sampling method, and the valid response rate (N = 527) was high, at 89.77%.
4. Data Analysis and Results
4.1. Descriptive Analysis
According to the descriptive analysis of demographic data, 52.8% of the subjects were women aged between 21 and 30 years (47.1%), and 49.7% of the total subjects had a university education background and a monthly salary between 40,001 and 80,000 RMB (34.9%). Among all the respondents, 129 worked in the service industry, and most came from mainland China. A total of 310 (58.8%) had been involved in leisure and travel activities once or twice per year. Regarding their history of smart tourism technologies usage, 43.1% had been using such technologies for three to four years, and 41.1% for more than four years. The demographic information of the sample is presented in Table 1.
4.2. Reliability Analysis
Reliability is an important factor in testing whether the questionnaire results have internal consistency [44]. According to Koufteros [45], Cronbach’s alpha and composite reliability (CR) are two common methods to test the reliability level. Cronbach [46] proposed the reference criteria: when α is less than 0.6, it reflects low reliability; when the α coefficient is between 0.6 and 0.8, it indicates that the reliability is acceptable; when the α coefficient is greater than 0.8, it indicates that the reliability is excellent. Nunnally [47] also suggested that when α is greater than 0.7, reliability is considered high. In addition, the recommended value of composite reliability (CR) should exceed 0.6, and the higher the value, the better the reliability [48,49].
Therefore, this study used Smart PLS 3.0 to calculate Cronbach’s alpha and CR. The results showed that the α values of the eight variables in this study were between 0.847 and 0.920, while the CR values were between 0.897 and 0.940. In other words, the α and CR values reached the standard value requirements.
4.3. Validity Test
Fornell and Larcker [48] suggested that the validity test should consist of convergent validity (CV) and discriminant validity (DV) to reflect the authenticity and accuracy of the questionnaire. CV measures the correlation of different measurements of the same variable, while DV measures the non-correlation between items with different variables. According to Anderson and Gerbing [50], to determine convergent validity, the first step is to compute the standardized load on each variable. If the load coefficient is greater than 0.7, this indicates that the validity of each construct is excellent. The second step is to calculate the average variance extracted (AVE). This should generally be greater than 0.5. DV can be measured by comparing the degree of correlation between the square root value of AVE and the latent variables [48]. When the measurement results show that the square root value of AVE of each variable is greater than that of the correlation coefficient and the value at least 0.5, the questionnaires have high DV.
The load coefficients of all the questions in the questionnaires were between 0.751 and 0.904, which is greater than the suggested value of 0.7, and the AVE of each variable was between 0.687 and 0.795, which is greater than the suggested value of 0.5. In conclusion, all variables in this research model featured high CV. Table 2 presents the results of the load factor and AVE.
In Table 2, the square root of the AVE value on the diagonal is larger than the correlation coefficient value at the lower left corner of the diagonal. This indicates adequate discriminant validity between the latent variables. In conclusion, the analytical results of CV and DV confirm that this questionnaire was satisfactory. Table 3 shows analysis of discriminant validity and all diagonal values exceed the inter-construct correlations with acceptable level.
4.4. Structural Model and Hypotheses Test
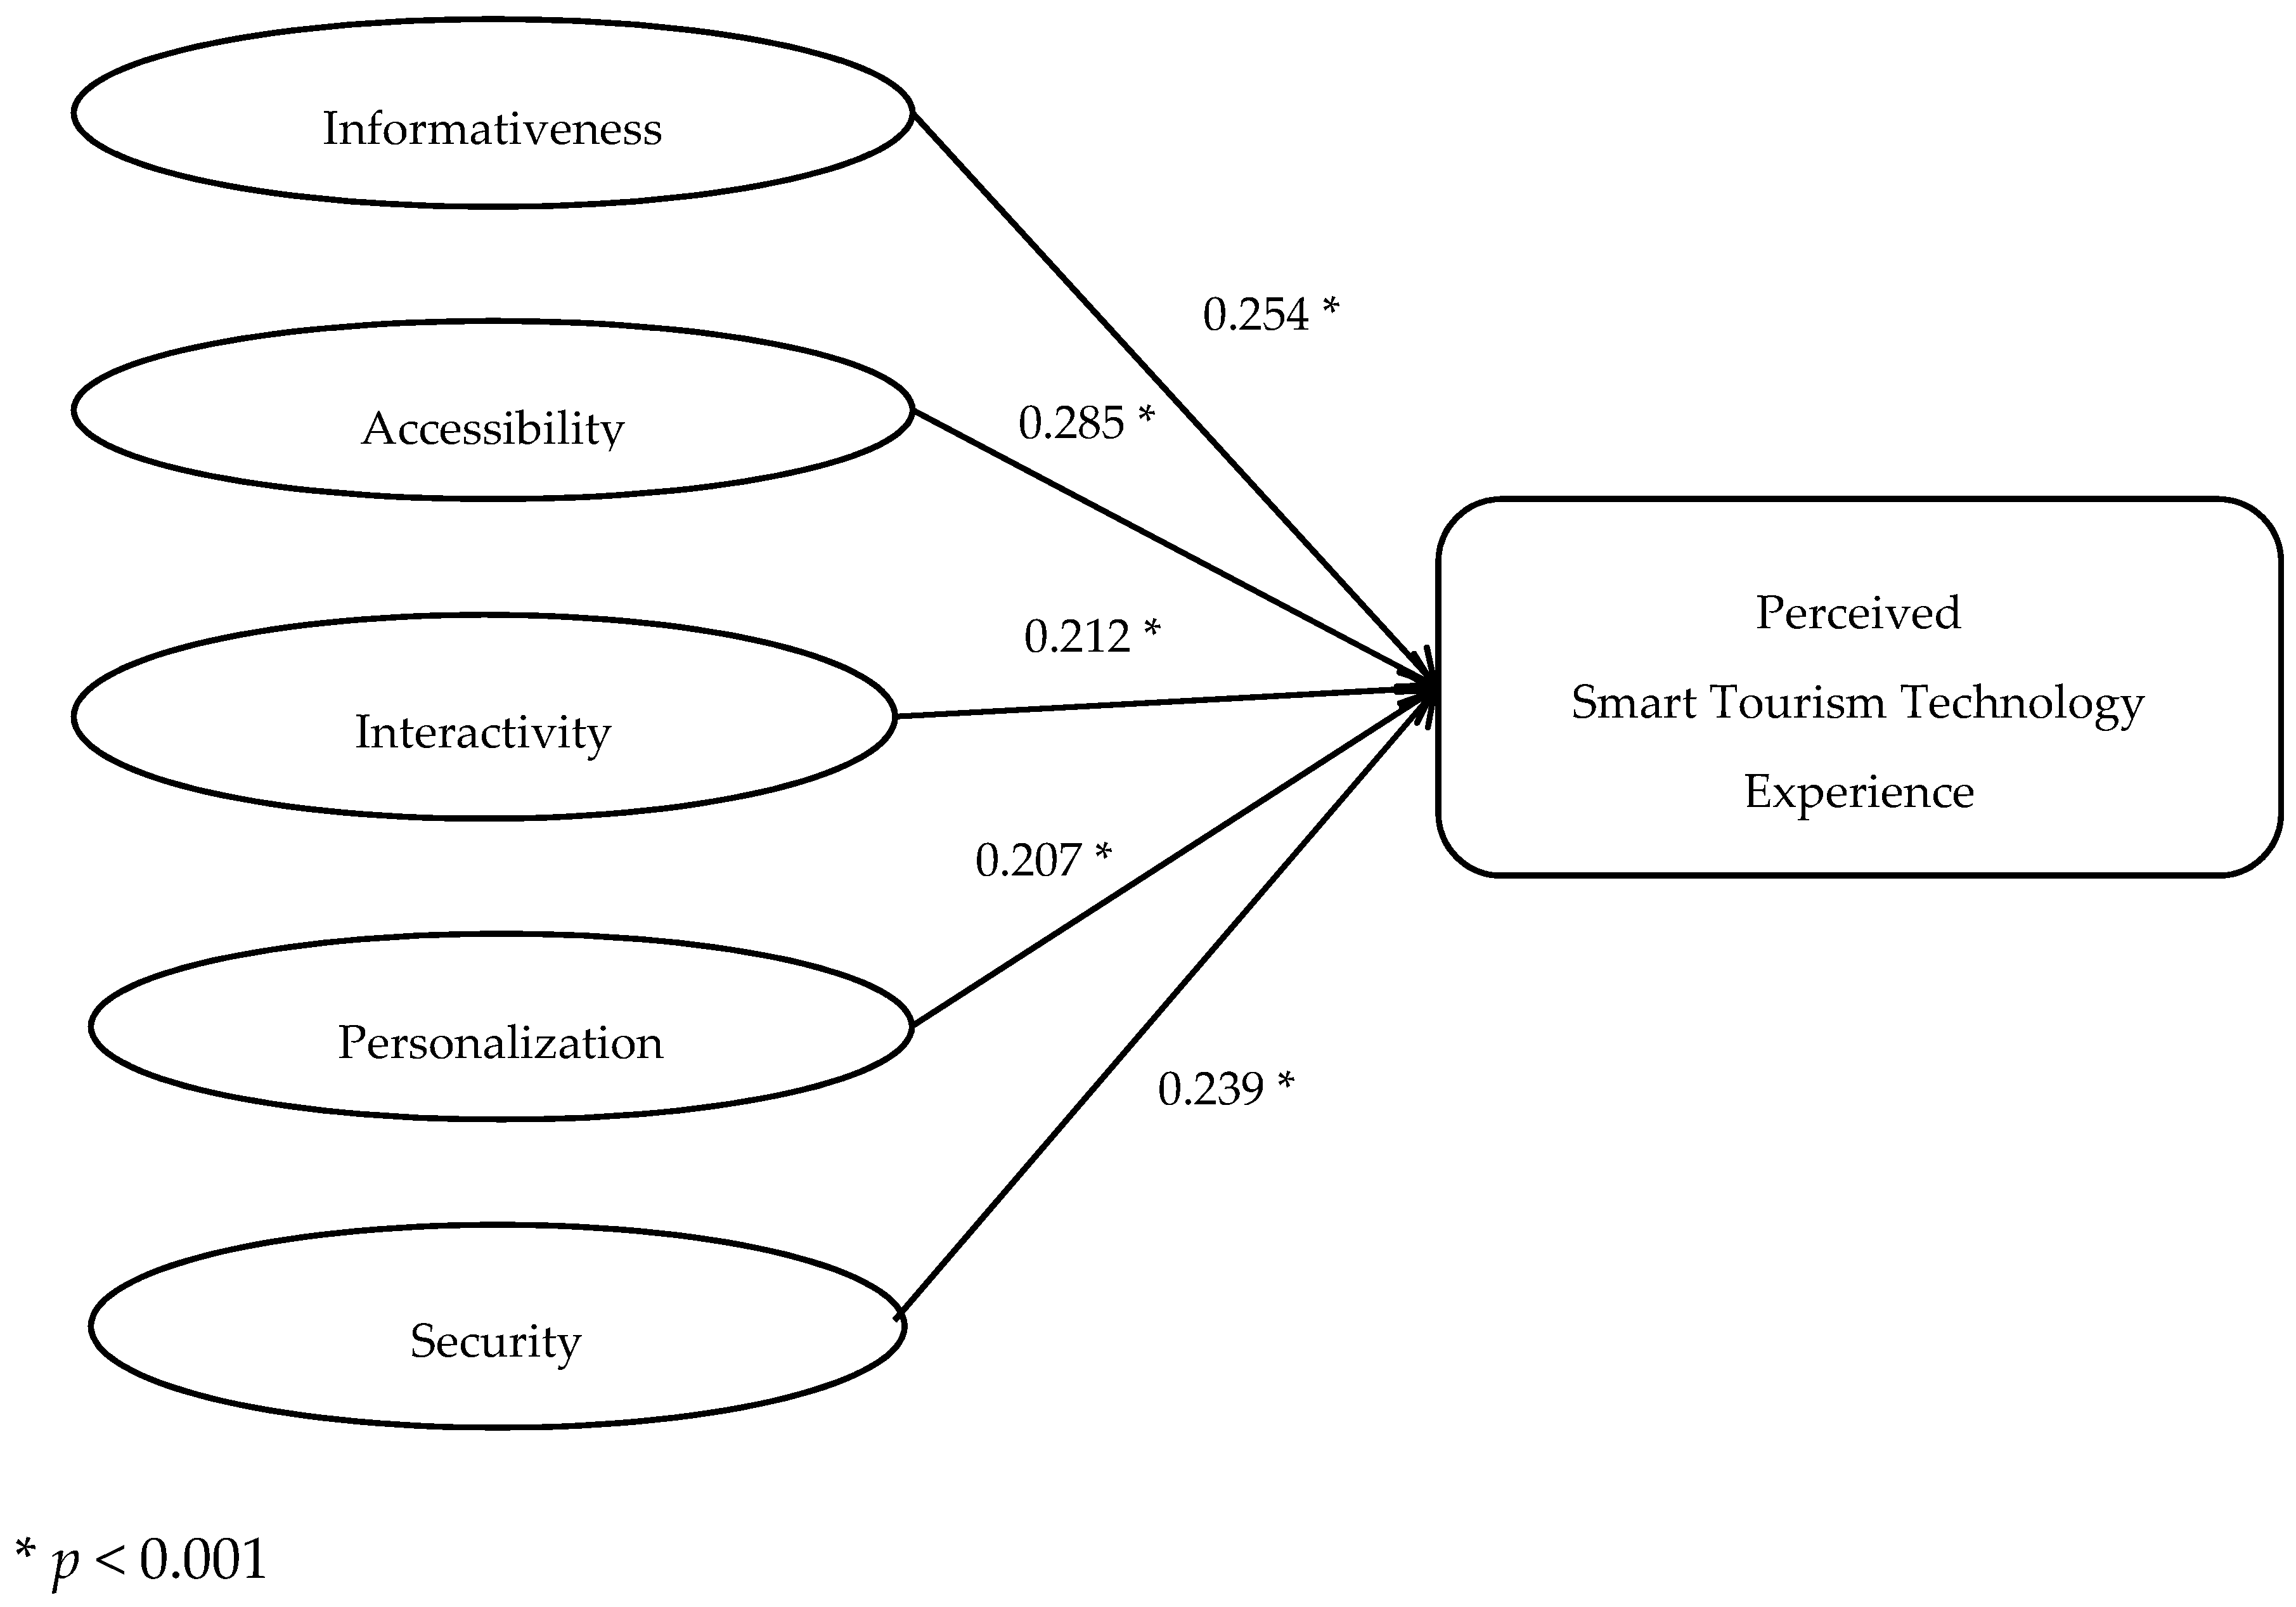
There are eight variables in this study, including five first-order variables used as indicators to create a second-order variable, perceived STT experience. This study first analyzed whether the first-order variables are related to the second-order variable (perceived STT experience) then tested the hypotheses model by using Smart PLS 3.0. First, a bootstrapping technique was used to determine the path estimates and t-statistics for the relative importance of the five first-order variables to perceived STT experience. All five variables were significantly associated with perceived STT experience. Among these five paths, accessibility was the most significant variable (path coefficient is 0.285, T value is 35.093), followed by informativeness (path coefficient is 0.254, T value is 31.044), security (path coefficient is 0.239, T value is 30.062), interactivity (path coefficient is 0.212, T value is 36.293), and personalization (path coefficient is 0.207, T value is 35.359).
Then, the proposed hypotheses were analyzed with SEM, adapting the bootstrapping technique with a sample size of 5000. In addition, in order to examine the explanatory power and predictive relevance of the variables in the research model, the explanatory variance R2 value was calculated using the PLS algorithm to measure the explanatory power, and the predictive relevance was calculated using the blindfolding method. When the Q2 value of the variables is greater than 0, it indicates that the model has predictive relevance [51] (pp. 193–221).
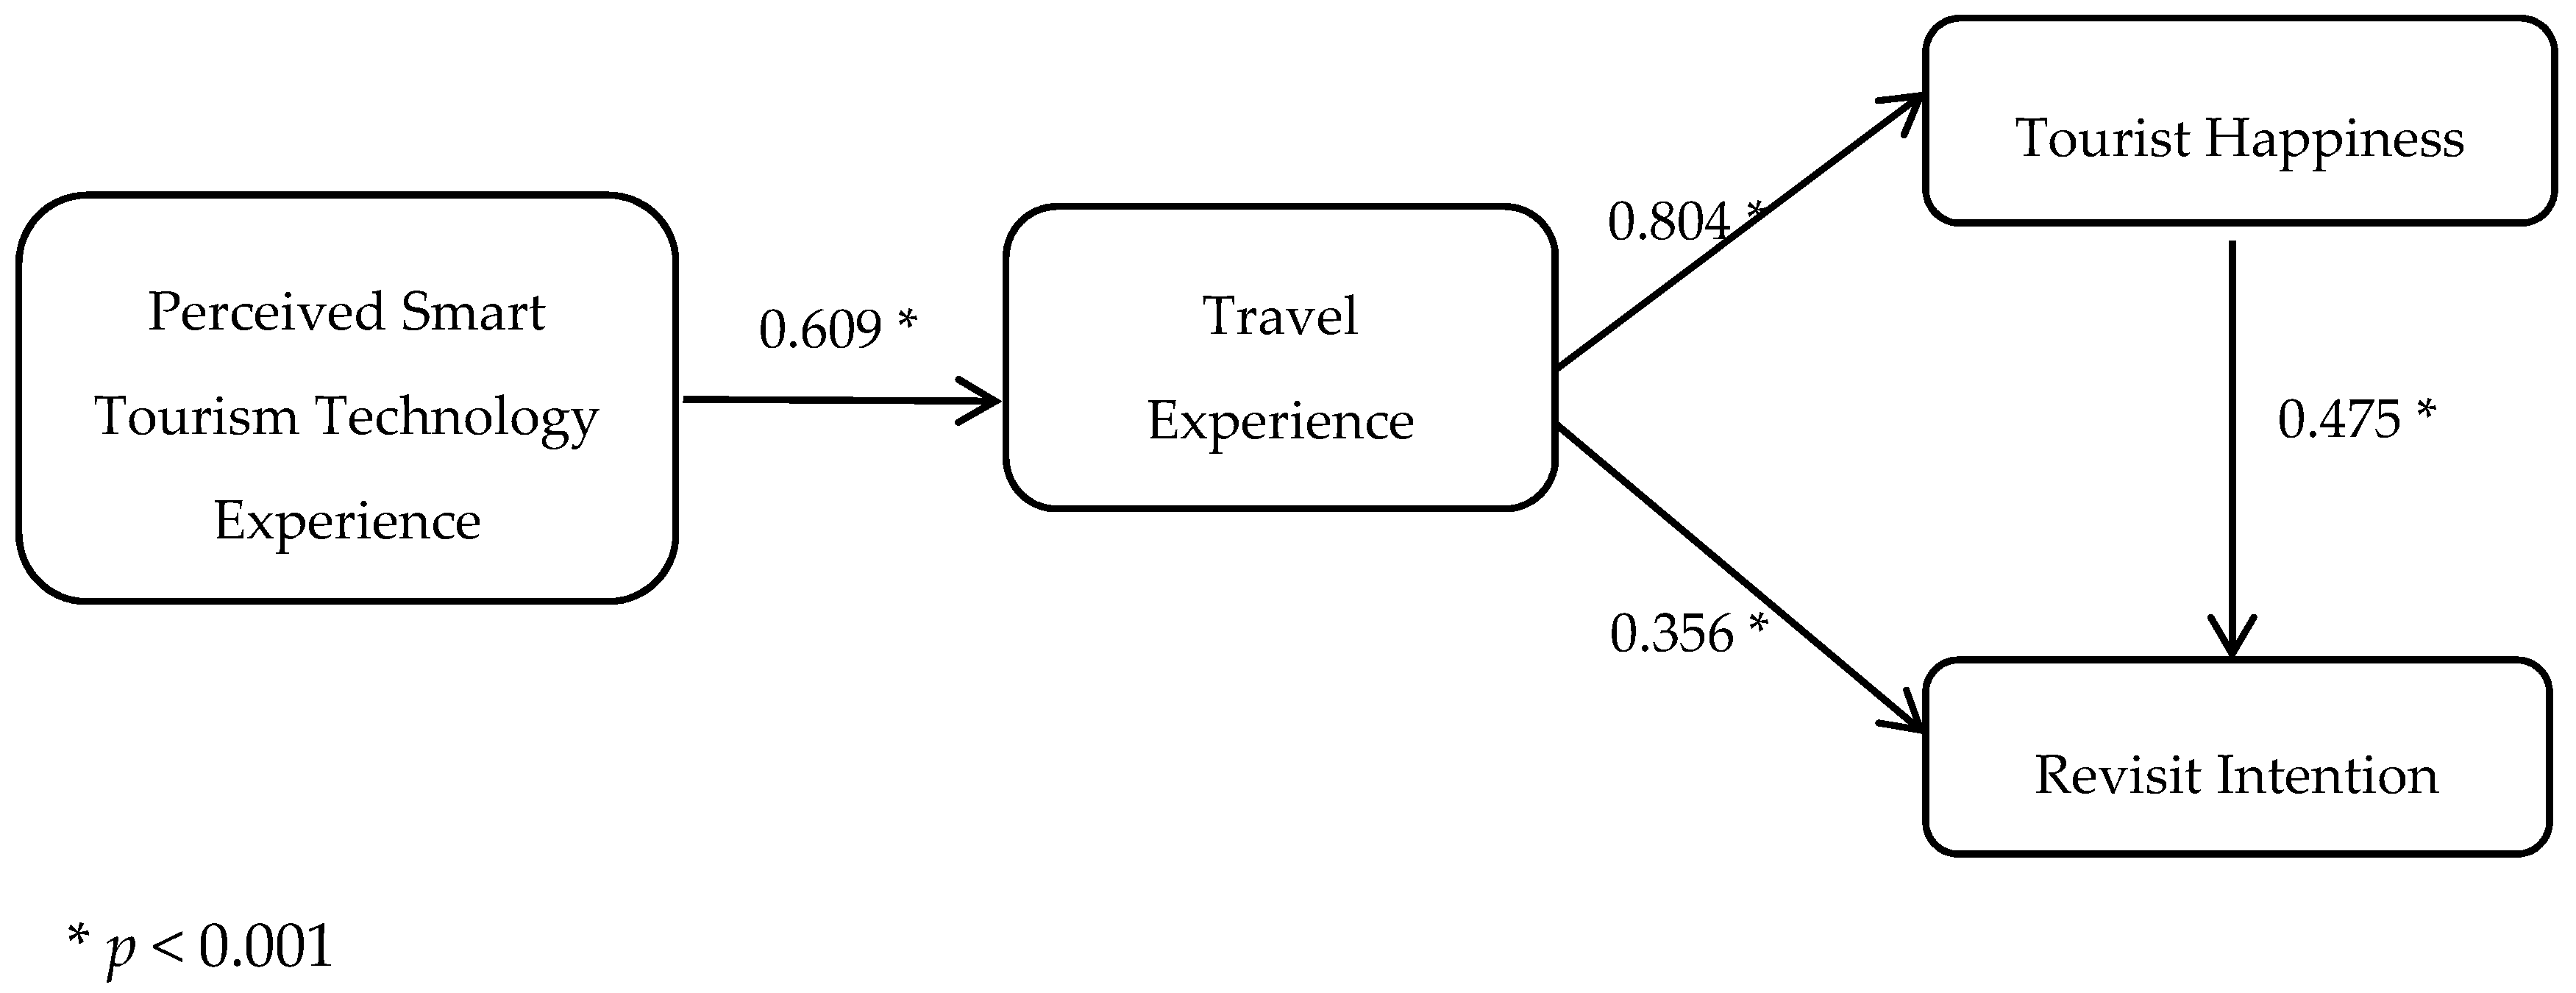
Table 4 and Figure 2 shows that each path coefficient is greater than 0.2, the T value is greater than 3.29, and the P value is less than 0.001, which means these paths are significant. The results indicate that perceived STTs are positively associated with tourists’ travel satisfaction, which supports H1. The study also found that tourists’ travel satisfaction was significantly associated with tourist happiness, supporting H2. Regarding the relationship with tourist revisit intention, there was a positive relationship between tourists’ travel satisfaction and happiness, which supports H3 and H4 (See Table 5 and Figure 3). Moreover, the total effect (0.737) of tourists’ travel satisfaction on revisit intention is greater than the value of path coefficient (0.356), indicating that as an intermediary variable, tourists’ happiness weakened the effect of revisit intention. In conclusion, all hypotheses were supported in this research model.
5. Discussion and Conclusions
5.1. Conclusions
The results of this study enriched the theoretical implications of smart tourism. The study adopted the attributes of STT proposed by Huang et al. [27] and added a new attribute, security. In other words, this study transformed smart tourism into a measurable model and identified the importance of these five attributes (informativeness, accessibility, interactivity, personalization, and security). The results showed that accessibility was the most significant contributor to tourists’ perceived STT experience. The reasons may be that tourists can easily use STTs at the destination at any time when they are highly accessible. With easy access to STT, tourists spend less time and effort investigating how to use these technologies, which enables them to enjoy technology-based travel experiences at the destination. Informativeness was another highly influential contributor to perceived STT experience followed by accessibility. When embracing STTs at destinations, tourists can find information on food and transportation at the destination. STTs enable tourists to have more opportunities to engage in a wide range of activities and events. Moreover, tourists displayed relatively low satisfaction with personalization in the context of STT experience. Most of the Chinese tourist participants were familiar with STTs and had used them for more than three years. Therefore, for Chinese tourists, the ordinary technology used in tourism might not be affected since they pursued unique and novelty technology-based travel experiences. In this regard, STT may ignore their personal requirements.
5.2. Theoretical Implications
Based on these results, several important theoretical contributions of this research were found. First, the findings of this study provided a deeper understanding of the relationship between two concepts (STT experience and tourist happiness) and developed a research model for the relationship among perceived STT experience, travel experience satisfaction, tourist happiness, and revisit intention. Based on the empirical analysis results, this study revealed that tourists intend to revisit the destination when they are satisfied with the smart tourism experience. Second, this study emphasized the relationship between STT experience and tourist happiness. High satisfaction with STT experience can create high travel experience satisfaction, thus, improving happiness.
5.3. Practical Implications, Limitations, and Future Research
This study offers practical implications for DMOs. It revealed that most tourists have a positive intention to use STTs, and DMOs can create specific activities and experiences for tourists by developing STTs, especially in terms of personalization. For instance, when tourists want to find a restaurant, technology can recommend the nearest restaurant according to their preferences and guide them on a suitable route to the restaurant.
Although the study has many useful theoretical and practical implications, there are also some limitations. First, the sample is limited and may not be representative of the whole population. Although this study did not aim at young adults, targeted samples were mostly under 50 years old. In addition, since many older adults have difficulties with smart technologies, these age groups need to be explored with future research. Second, this study was conducted in Macau, which may have a unique tourist type and city environment. The research framework may not be applicable to other destinations, and the results arising from it may be different. Thus, an extended comparative study of multiple cities is needed. Third, this study added security as an attribute to measure perceived STT experience, and five attributes in total were examined. The applicability of these indicators remains to be investigated. Future studies can investigate whether there are any other factors affecting the STT experience for better understanding of current STT. In addition, to generalize the research, more diverse samples from other cities or countries are needed since this study was only conducted on Chinese tourists who visited Macau.
Author Contributions
Conceptualization, C.-K.P.; Formal analysis, C.-K.P. and S.K.; Methodology, C.-K.P., Y.L. and A.D.; Writing—original draft, C.-K.P. and Y.L.; Writing—review & editing, C.-K.P. and S.K.; Super vision, C.-K.P.; Validation, S.K.; Project administration, C.-K.P. All authors have read and agreed to the published version of the manuscript.
Funding
This research received no external funding.
Conflicts of Interest
The authors declare no conflict of interest.
References
- Neuhofer, B.; Buhalis, D.; Ladkin, A. Conceptualising technology enhanced destination experiences. J. Destin. Mark. Manag. 2012, 1, 36–46. [Google Scholar] [CrossRef]
- Gretzel, U. Intelligent systems in tourism: A social science perspective. Ann. Tour. Res. 2011, 38, 757–779. [Google Scholar] [CrossRef]
- Chan, C.S.; Peters, M.; Pikkemaat, B. Investigating visitors’ perception of smart city dimensions for city branding in Hong Kong. Int. J. Tour. Cities 2019, 5, 620–638. [Google Scholar] [CrossRef]
- Jeong, M.; Shin, H.H. Tourists’ experiences with smart tourism technology at smart destinations and their behavior intentions. J. Travel Res. 2019. [Google Scholar] [CrossRef]
- Wang, W. The influence of perceived technological congruence of smartphone application and air travel experience on consumers’ attitudes toward price change and adoption. J. Hosp. Tour. Technol. 2018, 10, 122–135. [Google Scholar] [CrossRef]
- Sharpley, R. Host perceptions of tourism: A review of the research. Tour. Manag. 2014, 42, 37–49. [Google Scholar] [CrossRef]
- Woo, E.; Kim, H.; Uysal, M. Life satisfaction and support for tourism development. Ann. Tour. Res. 2015, 50, 84–97. [Google Scholar] [CrossRef]
- Fu, X.; Ridderstaat, J.; Jia, H. Are all tourism markets equal? Linkages between market-based tourism demand, quality of life, and economic development in Hong Kong. Tour. Manag. 2020, 77, 104015. [Google Scholar] [CrossRef]
- Fredrickson, L.M.; Anderson, D.H. A qualitative exploration of the wilderness experience as a source of spiritual inspiration. J. Environ. Psychol. 1999, 19, 21–39. [Google Scholar] [CrossRef] [Green Version]
- Li, Y. Geographical consciousness and tourism experience. Ann. Tour. Res. 2000, 27, 863–883. [Google Scholar] [CrossRef]
- McCabe, S.; Johnson, S. The happiness factor in tourism: Subjective well-being and social tourism. Ann. Tour. Res. 2013, 41, 42–65. [Google Scholar] [CrossRef]
- Ma, P.; Zhang, W. The Relationship among tourists’ interaction, experiential value and subjective well-being: An empirical study of B&B travelers. Consum. Econ. 2017, 33, 83–90. [Google Scholar]
- Chen, Y.; Li, X. Does a happy destination bring you happiness? Evidence from swiss inbound tourism. Tour. Manag. 2018, 65, 256–266. [Google Scholar] [CrossRef] [Green Version]
- Lee, H.; Lee, J.; Chung, N.; Koo, C. Tourists’ happiness: Are there smart tourism technology effects? Asia Pac. J. Tour. Res. 2018, 23, 486–501. [Google Scholar] [CrossRef]
- Kim, M.J.; Hall, C.M. A hedonic motivation model in virtual reality tourism: Comparing visitors and non-visitors. Int. J. Inf. Manag. 2019, 46, 236–249. [Google Scholar] [CrossRef]
- Um, T.; Chung, N. Does smart tourism technology matter? Lessons from three smart tourism cities in South Korea. Asia Pac. J. Tour. Res. 2019. [Google Scholar] [CrossRef]
- Zhang, L.Y.; Li, N.; Liu, M. On the basic concept of smarter tourism and its theoretical system. Tour. Trib. 2012, 27, 66–73. [Google Scholar]
- Gretzel, U.; Sigala, M.; Xiang, Z.; Koo, C. Smart tourism: Foundations and developments. Electron. Mark. 2015, 25, 179–188. [Google Scholar] [CrossRef] [Green Version]
- Li, Y.; Hu, C.; Huang, C.; Duan, L. The concept of smart tourism in the context of tourism information services. Tour. Manag. 2017, 58, 293–300. [Google Scholar] [CrossRef]
- Yoo, C.; Kwon, S.; Na, H.; Chang, B. Factors affecting the adoption of gamified Smart tourism applications: An Integrative Approach. Sustainability 2017, 9, 2162. [Google Scholar] [CrossRef] [Green Version]
- Weaver, D.B.; Moyle, B.D. ‘Tourist stupidity’ as a basic characteristic of “smart tourism”: Challenges for destination planning and management. Tour. Recreat. Res. 2019, 44, 387–391. [Google Scholar] [CrossRef]
- Kirova, V.; Thanh, T.V. Smartphone use during the leisure theme park visit experience: The role of contextual factors. Inf. Manag. 2019, 56, 742–753. [Google Scholar] [CrossRef]
- Hew, J.J.; Leong, L.Y.; Tan, W.H.; Lee, V.H.; Ooi, K.B. Mobile social tourism shopping: A dual-stage analysis of a multi-mediation model. Tour. Manag. 2018, 66, 121–139. [Google Scholar] [CrossRef]
- Chung, N.; Koo, C. The use of social media in travel information search. Telemat. Inform. 2015, 32, 215–229. [Google Scholar] [CrossRef]
- Park, B.; Stangl, B. Augmented reality experiences and sensation seeking. Tour. Manag. 2020, 77, 104023. [Google Scholar] [CrossRef]
- No, E.; Kim, J.K. Comparing the attributes of online tourism information sources. Comput. Hum. Behav. 2015, 50, 564–575. [Google Scholar] [CrossRef]
- Huang, C.D.; Goo, J.; Nam, K.; Yoo, C.W. Smart tourism technologies in travel planning: The role of exploration and exploitation. Inf. Manag. 2017, 54, 757–770. [Google Scholar] [CrossRef]
- Tan, G.; Lee, V.H.; Hew, J.J.; Ooi, K.B.; Wong, K.B. The interactive mobile social media advertising: An imminent approach to advertise tourism products and services? Telemat. Inform. 2018, 35, 2270–2288. [Google Scholar] [CrossRef]
- Filep, S. Moving beyond subjective well-being. J. Hosp. Tour. Res. 2014, 38, 266–274. [Google Scholar] [CrossRef]
- Bimonte, S.; Faralla, V. Happiness and nature-based vacations. Ann. Tour. Res. 2014, 46, 176–178. [Google Scholar] [CrossRef]
- Kwon, J.; Lee, H. Why travel prolongs happiness: Longitudinal analysis using a latent growth model. Tour. Manag. 2020, 76, 103944. [Google Scholar] [CrossRef]
- Chen, S.; Fan, Y.; Cao, Y.; Khattak, A. Assessing the relative importance of factors influencing travel happiness. Travel Behav. Soc. 2019, 16, 185–191. [Google Scholar] [CrossRef]
- Sharma, P.; Nayak, J.K. Testing the role of tourists’ emotional experiences in predicting destination image, satisfaction, and behavioral intentions: A case of wellness tourism. Tour. Manag. Perspect. 2018, 28, 41–58. [Google Scholar] [CrossRef]
- Meng, B.; Han, H. Working-holiday tourism attributes and satisfaction in forming word-of-mouth and revisit intentions: Impact of quantity and quality of intergroup contact. J. Destin. Mark. Manag. 2018, 9, 347–357. [Google Scholar] [CrossRef]
- Cong, L.C. A formative model of the relationship between destination quality, tourist satisfaction and intentional loyalty: An empirical test in Vietnam. J. Hosp. Tour. Manag. 2016, 26, 50–62. [Google Scholar] [CrossRef]
- Brown, G.; Smith, A.; Assaker, G. Revisiting the host city: An empirical examination of sport involvement, place attachment, event satisfaction and spectator intentions at the London Olympics. Tour. Manag. 2016, 55, 160–172. [Google Scholar] [CrossRef]
- Konuk, F.A. The influence of perceived food quality, price fairness, perceived value and satisfaction on customers’ revisit and word-of-mouth intentions towards organic food restaurants. J. Retail. Consum. Serv. 2019, 50, 103–110. [Google Scholar] [CrossRef]
- Luo, X. Uses and gratifications theory and E-consumer behaviors. J. Interact. Advert. 2002, 2, 34–41. [Google Scholar] [CrossRef]
- Mills, J.E.; Morrison, A.M.; Frew, A.J.; Hitz, M.; O’Connor, P. Measuring customer satisfaction with online travel. In Proceedings of the Information & Communication Technologies in Tourism, Helsinki, Finland, 15 January 2003. [Google Scholar]
- Neal, J.D.; Sirgy, M.J.; Uysal, M. The role of satisfaction with leisure travel/tourism services and experience in satisfaction with leisure life and overall life. J. Bus. Res. 1999, 44, 153–163. [Google Scholar] [CrossRef]
- Kim, H.; Woo, E.; Uysal, M. Tourism experience and quality of life among elderly tourists. Tour. Manag. 2015, 46, 465–476. [Google Scholar] [CrossRef]
- Su, L.; Huang, S.; Chen, X. Effects of service fairness and service quality on tourists’ behavioral intentions and subjective well-being. J. Travel Tour. Mark. 2015, 32, 290–307. [Google Scholar] [CrossRef]
- Kim, H.; Lee, S.; Uysal, M.; Kim, J.; Ahn, K. Nature-based tourism: Motivation and subjective well-being. J. Travel Tour. Mark. 2015, 32, S76–S96. [Google Scholar] [CrossRef]
- Gadermann, A.M.; Guhn, M.; Zumbo, B.D. Estimating ordinal reliability for Likert-type and ordinal item response data: A conceptual, empirical, and practical guide. Practical Assessment. Res. Eval. 2012, 17, 1–13. [Google Scholar]
- Koufteros, X.A. Testing a model of pull production: A paradigm for manufacturing research using structural equation modeling. J. Oper. Manag. 1999, 17, 467–488. [Google Scholar] [CrossRef]
- Cronbach, L.J. Coefficient alpha and the internal structure of tests. Psychometrika 1951, 16, 297–334. [Google Scholar] [CrossRef] [Green Version]
- Nunnally, J.C. Psychmetric Theory; McGraw-Hill: New York, NY, USA, 1978. [Google Scholar]
- Fornell, C.; Larcker, D.F. Evaluating structural equation models with unobservable variables and measurement error. J. Mark. Res. 1981, 18, 39–50. [Google Scholar] [CrossRef]
- Baozzi, R.P.; Yi, Y. The degree of intention formation as a moderator of the attitude-behavior relationship. Soc. Psychol. Q. 1989, 52, 266–279. [Google Scholar] [CrossRef]
- Anderson, J.C.; Gerbing, D.W. Structural equation modeling in practice: A review and recommended two-step approach. Psychol. Bull. 1988, 103, 411–423. [Google Scholar] [CrossRef]
- Roldán, J.L.; Sánchez-Franco, M.J. Variance-Based Structural Equation Modeling: Guidelines for Using Partial Least Squares in Information Systems Research. In Research Methodologies, Innovations and Philosophies in Software Systems Engineering and Information Systems; IGI Global: Hershey, PA, USA, 2012; pp. 193–221. [Google Scholar]
Figure 1.
Research Hypotheses.

Figure 2.
Structure model analysis of first-order variables.

Figure 3.
Hypothesis path analysis.


Table 1.
Demographic information (N = 527).
| Variables | N (%) | Variables | N (%) | ||
|---|---|---|---|---|---|
| Gender | STT usage time | ||||
| Male | 249 (47.2) | Below 1 year | 15 (2.8) | ||
| Female | 278 (52.8) | 1–2 years | 67 (12.7) | ||
| 3–4 years | 227 (43.1) | ||||
| Age | Above 4 years | 218 (41.4) | |||
| Under 20 | 35 (6.6) | Average travel time/year | |||
| 21–30 | 248 (47.1) | 1–2 times | 310 (58.8) | ||
| 31–40 | 179 (34) | 3–4 times | 145 (27.5) | ||
| 41–50 | 61 (11.6) | Above 4 | 72 (13.7) | ||
| Above 51 | 4 (0.8) | Career | |||
| Student | 109 (20.7) | ||||
| Education | Housewife | 11 (2.1) | |||
| Junior high school | 20 (3.8) | Service industry | 129 (24.5) | ||
| High school | 41 (7.8) | Civil servant | 22 (4.2) | ||
| College | 130 (24.7) | Teacher | 56 (10.6) | ||
| Undergraduate | 262 (49.7) | Business | 85 (16.1) | ||
| Postgraduate | 74 (14) | Manufacturing | 51 (9.7) | ||
| Own business | 53 (10.1) | ||||
| Income/Month (RMB) | Other | 11 (2.1) | |||
| Below 4000 | 91 (17.3) | ||||
| 4001–8000 | 184 (34.9) | ||||
| 8001–12,000 | 132 (25) | ||||
| 12,001–16,000 | 83 (15.7) | ||||
| above 16,000 | 37 | 37 (7) |
Table 2.
Load factor and average variance extracted (AVE) results.
| Items | Factor Loading | AVE | SD |
|---|---|---|---|
| Informativeness | |||
| When traveling in Macau, Smart Tourism Technology provides me with useful information about the travel destination and the trip. | 0.793 | 0.707 | 5.23 |
| When traveling in Macau, Smart Tourism Technology provides me with useful information about the travel destination and the trip. | 0.856 | 5.11 | |
| When traveling in Macau, Smart Tourism Technology provides me with useful information about the travel destination and the trip. | 0.874 | 5.13 | |
| When traveling in Macau, Smart Tourism Technology provides me with useful information about the travel destination and the trip. | 0.863 | 5.10 | |
| When traveling in Macau, Smart Tourism Technology provides me with useful information about the travel destination and the trip. | 0.816 | 5.17 | |
| Accessibility | |||
| When traveling in Macau, I can use Smart Tourism Technology anytime and anywhere. | 0.869 | 0.758 | 5.01 |
| When traveling in Macau, I can easily use Smart Tourism Technology. | 0.863 | 4.89 | |
| When traveling in Macau, I can easily find Smart Tourism Technology. | 0.892 | 4.96 | |
| When traveling in Macau, I can search without a complicated sign-up process at tourism website. | 0.841 | 4.87 | |
| When traveling in Macau, I can easily access Smart Tourism Technology form a variety of other related websites. | 0.888 | 4.89 | |
| Interactivity | |||
| When traveling in Macau, I can find many other travelers’ questions and answers on Smart Tourism Technology. | 0.843 | 0.705 | 4.86 |
| When traveling in Macau, Smart Tourism Technology that I use is highly responsive to me. | 0.832 | 4.72 | |
| When traveling in Macau, Smart Tourism Technology that I use is interactive. | 0.861 | 5.00 | |
| When traveling in Macau, it is easy to share tourism information content on Smart Tourism Technology. | 0.823 | 4.91 | |
| Personalization | |||
| When traveling in Macau, Smart Tourism Technology allows me to receive tailored information. | 0.751 | 0.687 | 4.9 |
| When traveling in Macau, Smart Tourism Technology provides me with easy-to-follow paths and links. | 0.863 | 4.88 | |
| When traveling in Macau, the tourism information provided by Smart Tourism Technology meets my needs. | 0.83 | 5 | |
| When traveling in Macau, I can interact with Smart Tourism Technology in order to get information tailored to my specific needs. | 0.867 | 4.93 | |
| Security | |||
| When I use Smart Tourism Technology, I don’t worry about collecting too much personal information. | 0.846 | 0.717 | 4.87 |
| When I use Smart Tourism Technology, I believe my privacy is protected. | 0.83 | 4.7 | |
| When I use Smart Tourism Technology, I don’t worry about the security of sensitive information. | 0.866 | 4.74 | |
| My personal information could be subject to misuse and unauthorized access when transacting through Smart Tourism Technology. | 0.846 | 4.73 | |
| Smart Tourism Technology Provides adequate security to protect my personal information. | 0.845 | 4.94 | |
| Travel Experience Satisfaction | |||
| During Macau tourism experience, I feel that traveling in Macau enriches my life in some ways. | 0.842 | 0.703 | 5.22 |
| During Macau tourism experience, I can accomplish the purpose of this travel. | 0.84 | 5.22 | |
| During Macau tourism experience, it is rewarding to me in many ways. | 0.808 | 5.01 | |
| During Macau tourism experience, my overall evaluation destination experience is positive. | 0.856 | 5.25 | |
| During Macau tourism experience, my overall evaluation destination experience is favorable. | 0.851 | 5.24 | |
| Overall, I was satisfied during my trip to Macau. | 0.832 | 5.33 | |
| Tourist Happiness | |||
| During Macau tourism experience, I can consider myself very happy. | 0.873 | 0.739 | 5.28 |
| During Macau tourism experience, I can think about what a happy life I have compared to the ideal state. | 0.841 | 5.20 | |
| During Macau tourism experience, I can think about how I am generally very satisfied with my life. | 0.873 | 5.17 | |
| During Macau tourism experience, I can feel good about my life, although I have my ups and downs. | 0.851 | 5.13 | |
| Revisit Intention | |||
| I will revisit Macau. | 0.904 | 0.795 | 5.51 |
| Revisiting Macau would be worthwhile. | 0.886 | 5.53 | |
| I would positively recommend this city to other people. | 0.875 | 5.36 | |
| I would like to stay more often in Macau. | 0.901 | 5.43 |
Table 3.
Analysis of discriminant validity.
| 1 | 2 | 3 | 4 | 5 | 6 | 7 | 8 | |
|---|---|---|---|---|---|---|---|---|
| 1. PER | 0.829 | |||||||
| 2. INT | 0.771 | 0.84 | ||||||
| 3. INF | 0.617 | 0.624 | 0.841 | |||||
| 4. ACC | 0.651 | 0.69 | 0.641 | 0.871 | ||||
| 5. SEC | 0.575 | 0.598 | 0.539 | 0.545 | 0.847 | |||
| 6. TES | 0.575 | 0.486 | 0.618 | 0.666 | 0.507 | 0.838 | ||
| 7. TH | 0.571 | 0.508 | 0.554 | 0.598 | 0.515 | 0.804 | 0.86 | |
| 8. RI | 0.401 | 0.401 | 0.53 | 0.539 | 0.333 | 0.737 | 0.761 | 0.892 |
Note. PER—personalization; INT—interactivity; INF—informativeness; AC—accessibility; SEC—security; TES—travel experience satisfaction; TH—tourist happiness; RI—revisit intention.
Table 4.
First-order path analysis.
| Path | Path Coefficient | T | P |
|---|---|---|---|
| INF-Perceived STT experience | 0.254 | 31.044 | 0 |
| ACC-Perceived STT experience | 0.285 | 35.093 | 0 |
| INT-Perceived STT experience | 0.212 | 36.293 | 0 |
| PER-Perceived STT experience | 0.207 | 35.359 | 0 |
| SEC-Perceived STT experience | 0.239 | 30.062 | 0 |
Table 5.
Summary of hypothesis results.
| Hypothesis | Total | Path Coefficient | T | P | Result |
|---|---|---|---|---|---|
| H1: Perceived STT Experience→Satisfaction | 0.69 | 0.69 | 19.682 | 0 | Supported |
| H2: Satisfaction→Happiness | 0.804 | 0.804 | 23.697 | 0 | Supported |
| H3: Satisfaction→Revisit Intention | 0.737 | 0.356 | 5.607 | 0 | Supported |
| H4: Happiness→Revisit Intention | 0.475 | 0.475 | 7.297 | 0 | Supported |
© 2020 by the authors. Licensee MDPI, Basel, Switzerland. This article is an open access article distributed under the terms and conditions of the Creative Commons Attribution (CC BY) license (http://creativecommons.org/licenses/by/4.0/).
Share and Cite
MDPI and ACS Style
Pai, C.-K.; Liu, Y.; Kang, S.; Dai, A. The Role of Perceived Smart Tourism Technology Experience for Tourist Satisfaction, Happiness and Revisit Intention. Sustainability 2020, 12, 6592. https://0-doi-org.brum.beds.ac.uk/10.3390/su12166592
AMA Style
Pai C-K, Liu Y, Kang S, Dai A. The Role of Perceived Smart Tourism Technology Experience for Tourist Satisfaction, Happiness and Revisit Intention. Sustainability. 2020; 12(16):6592. https://0-doi-org.brum.beds.ac.uk/10.3390/su12166592
Chicago/Turabian StylePai, Chen-Kuo, Yumeng Liu, Sangguk Kang, and Anna Dai. 2020. "The Role of Perceived Smart Tourism Technology Experience for Tourist Satisfaction, Happiness and Revisit Intention" Sustainability 12, no. 16: 6592. https://0-doi-org.brum.beds.ac.uk/10.3390/su12166592
Note that from the first issue of 2016, this journal uses article numbers instead of page numbers. See further details here.