On the Effect of Green Bonds on the Profitability and Credit Quality of Project Financing


Department of Business Administration, Rey Juan Carlos University, Paseo de los Artilleros s/n, 28032 Madrid, Spain
*
Author to whom correspondence should be addressed.
Sustainability 2020, 12(16), 6695; https://0-doi-org.brum.beds.ac.uk/10.3390/su12166695
Submission received: 12 July 2020
/
Revised: 11 August 2020
/
Accepted: 15 August 2020
/
Published: 18 August 2020
(This article belongs to the Section Economic and Business Aspects of Sustainability)
Abstract
:The relatively recent green bond market is increasingly attracting interest at the technical, regulatory, and academic research levels. Although a considerable body of research on green bonds focuses on the investor’s perspective, this study takes the perspective of a project finance sponsor to analyze whether there is a direct financial incentive for issuing green bonds in contrast to other types of financing. In order to measure the impact of green bond financing on the profitability and solvency of environmentally friendly investments, we study the sensitivity of the financial performance of a well-established project finance investment—the Sagunto regasification plant—to shifts in its financial structure. In particular, we develop a base case that allows us to study the impact of green financing compared to other financial structures typically used in project finance, under different scenarios. Our results show that in all cases, the internal rate of return (IRR) for shareholders is higher when green bonds instead of bank loans are issued to finance investments. Additionally, in the vast majority of the scenarios, green bond financing results in higher average debt service coverage ratios. Consequently, our results suggest that green bond financing constitutes a strong financial incentive for sponsors, which can help align their objectives with those of public authorities.
1. Introduction
The recent and growing green bond market allows investors the opportunity to be involved in climate-friendly investment projects. Green bonds are any type of bond intended to finance projects with positive benefits for the environment and/or the climate. Green bond issues represent the expected response to the huge costs posed by climate change. As stated in the research by [1], green financing is expected to reduce global coal consumption to 2.5% below business-as-usual in 2030, increasing the share of non-fossil fuel electricity from 42% to 46%, at a global level, although these effects differ depending on the geographical area. As the authors state, in the period up until 2030, green finance will avoid global CO2 emissions equivalent to the total current emissions of the European Union and Japan.
Despite the growing interest in green bonds, there is no extensive literature to study whether these bonds are really suitable compared to other conventional bonds with similar characteristics. In fact, there is a risk of greenwashing. In this regard, according to [2], the term greenwashing includes companies that proclaim a greater engagement to environmental responsibility than they really do. The benefit of greenwashing (temptation function) is the advantage gained in terms of reputation and the willingness to pay of environmentally sensitive consumers. The cost of greenwashing (punishment function) is the sanction arising when the public becomes aware of the gap between declarations and facts.
The authors of [3] analyze the potential of the green bond market to finance the shift towards a sustainable economy. To accomplish this, the authors use the case study method on the leading green bond issuing countries and summarize the best practices that can be applied in the countries of the European Union to take advantage of the potential of the growing green bond market.
In this context, [4] study 121 European green bonds issued between 2013 and 2017, finding that green bonds are more financially convenient than non-green ones. These authors point out that the advantage is greater for corporate issuers and persists in the secondary market. Consequently, the results of their study support the view that these bonds can potentially play an important role in greening the economy without financially penalizing the issuers.
On this basis, one of the main objectives of this study is to better understand what attracts issuers to the green bond market and to assess the role of green bonds in transferring capital to more sustainable activities. For this purpose, we conduct an analysis applied on the framework of a regasification plant. In this regard, it is worth mentioning that the energy sector is a key factor for the environment, since it is responsible for 80% of the CO2 emissions that are causing global warming. In this sector, gas is a key area in the transition. Progress must be made in the use of gas infrastructures to store electricity, as well as in the use of regasification plants to supply highly polluting maritime transport. All the above will surely require substantial investments that must be financed.
Initially, these projects can be financed using project finance/non-recourse debt or traditional financing. Papers such as [5,6,7,8,9] examine a variety of factors that explain the main differences between both structures, entailing aspects such as asymmetric information, agency cost, or moral hazard. Importantly, agency costs resulting from potential conflicts between the ownership and related parties can discourage risky positive-net present value (NPV) investments if they are to be financed on the balance sheet using corporate debt [10] (pp. 11–19). In this regard, when a particular facility or a related set of assets, which has a specific purpose, is capable of operating profitably as an independent economic unit, project finance is feasible. This creates a separate entity to build, own, and operate the project, i.e., the special purpose vehicle (SPV, also known as the project company), which is a project company (the debtor) established on an ad hoc basis that is financially and legally independent of the sponsors. Hence, it is characterized as without recourse to shareholders. As explained in [11], if sufficient profits are expected, the project company may finance the construction of the project on the basis of the project, which involves the issuance of equity securities (usually to the project sponsors) and of debt securities that are designed to be self-liquidating with the proceeds from project operations. This structure ensures that the lenders have only limited recourse (or in some cases no recourse at all) to the sponsors after the project is completed. Ultimately, as defined in [12], project finance is structured financing of a specific economic entity (the SPV), created by the sponsor using either equity or mezzanine debt and for which the lender considers cash flows to be the primary source of loan repayment, while the assets represent only collateral.
Project finance has traditionally been used to finance large-scale natural resource projects, such as electric power generation facilities, hydroelectric projects, refineries, pipelines, dock facilities, toll roads, and many others. One of the main advantages of project finance is its ability to expand the project’s borrowing capacity. In fact, this structure implies that project debt is not a direct obligation for the sponsors and, therefore, does not appear on their balance sheets. Consequently, the deal can support a debt-to-equity ratio that could not otherwise be attained. This strongly impacts on the return of the transaction for the sponsors (the internal rate of return on equity or IRR for shareholders). Conversely, direct financing on the sponsor’s general credit is included in the company’s balance sheet. This means that in the event that a project owned by the company is not successful, it is detrimental to the rest of the projects.
Additionally, project finance also implies other advantages and disadvantages with respect to traditional financing (see [11] (pp. 34–51) for a comprehensive analysis on the topic). For example, studies such as [13] show that project financing is more effectively priced than business loans. Likewise, the research of [8] shows evidence on the effect of asymmetric information on the incentive of firms to issue non-recourse debt. Specifically, the following conclusions are drawn from the empirical study of [8]: (i) Financing via non-recourse debt is more likely when the extent of the asymmetric information regarding the total value of the company is sufficiently small and the performance profiles across the projects is large enough; (ii) the quality of firms that issue at least one claim without recourse is higher than that of firms that only issue corporate claims; and (iii) when the asymmetric information is large and uniformly distributed across projects, companies generally issue corporate claims, meaning that non-recourse debt is generally issued when the asymmetric information is not uniformly distributed. Furthermore, a clear separation between the SPV and the sponsor balance sheet reduces the asymmetric information between the lender and the sponsor and allows a more efficient evaluation of credit quality [6].
On the other hand, risk management in project finance is crucial for a number of reasons. In general, diverse risks can arise both during the construction phase—when the project is not yet generating cash—and during the operations phase. Consequently, fundraising requires careful financial engineering focused on achieving a mutually acceptable allocation of risks and rewards among the various players involved. In project finance, lenders delegate responsibility to shareholders, so covenants are made to reduce moral hazard that can result in opportunistic practices that destroy value for lenders. Hence, each monetary unit generated by the project is perfectly monitored to allocate it to a specific predetermined use. Conflicts of interest between lenders and sponsors often arise when setting dividend policy and restructuring distressed companies. In this regard, lenders and sponsors benefit from project finance structures that limit managerial discretion over cash flow [10]. Agency costs due to conflicts of interest between shareholders and lenders result in negotiated covenant structures in loan agreements, such as the debt service reserve account (hereafter, DSRA), the cash sweep account, and diverse debt-sculpting techniques. As noted above, in project finance, lenders seek to monitor the borrower’s financial performance. According to [10], sponsors use high leverage to enforce the contracts. Specifically, in the presence of high leverage, value appropriation strategies will result in costly defaults and, possibly, a change in control. Consequently, the DSRA and the cash sweep account allow lenders to mitigate this risk and reduce the distribution of dividends in the short run. In return, the sponsor manages to maximize the debt level of the project. Below, we use most of these contractual terms in our case study in order to determine their effect on the performance and credit quality of the project under analysis.
Our paper contributes to previous research analyzing the impact of green bond financing on the IRR for a project finance sponsor. Although this article makes an implementation towards the case of a regasification plant, the uncertainty of the returns emanating from the project portfolio can be extrapolated to other types of activities that can be financed or refinanced through green bonds. Consequently, the analysis and conclusions involved are fairly independent of the activity under study. As shown below, our results suggest that green funding provides economic and financial incentives for sponsors, helping to foster green projects and aligning the objectives of sponsors with those of national and supranational authorities involved in protecting the environment.
The rest of the paper is organized as follows. Section 2 presents in more detail the green bond market and its regulation. Section 3 reviews the previous research that outlines the issue that is the focus of our study. Section 4 describes the variables of our case study as well as the methodology used in the empirical analysis. Section 5 presents the empirical results and the discussion. Finally, Section 6 concludes.
2. The Green Bond Market
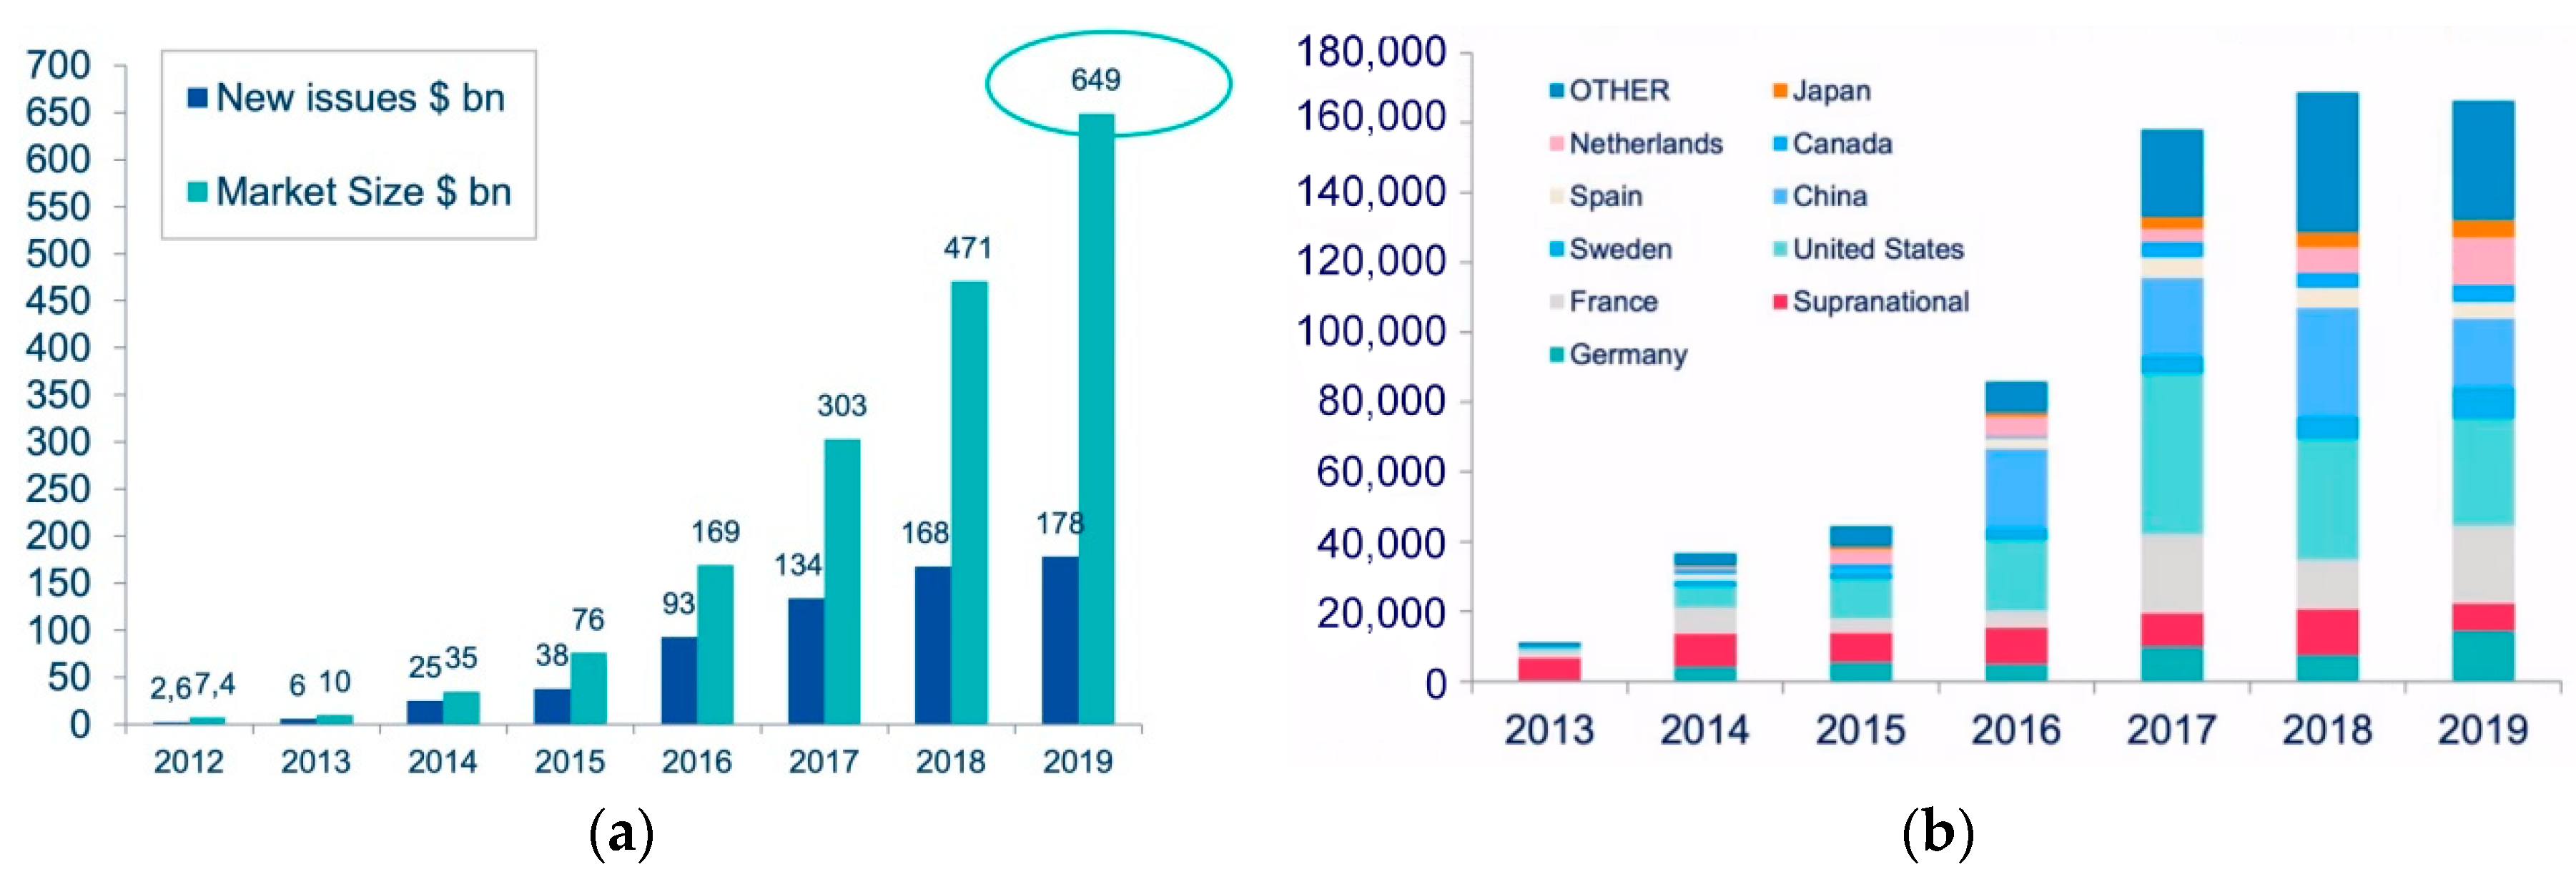
In general, investments in green financial products are increasingly significant as environmental pollution intensifies, as shown in Figure 1.
Figure 1 shows the growing pattern in the primary market for green bonds, with growth of 60% in 2019. Figure 1 also highlights that European issuers lead the primary market (32% of new issues in 2019), followed by US issuers (20% in 2019), and the comparatively reduced presence of China (7.5% in 2019). These percentages suggest that the green bond market is well-established and is indeed a fact in both developed and emerging countries, supported by growing climate-awareness among investors. Conversely, as [15] highlights, in developing countries, the market is still comparatively young. However, as noted in [16], the rise of the green bond market in emerging economies, such as Brazil, India, Mexico, and China, is boosting cross-regional trades and demonstrating international trading opportunities.
The still-nascent green bond market requires growing government regulation. Indeed, some of the primary factors driving the growth of the green bond market are the scale of issuance [17,18], liquidity [19] and supervision [20]. Green bonds are a vector of choice for financing the energy transition and are increasingly becoming the focus of regulatory actions at the European level. Interestingly, faced with the regulatory situation in the market, [21] identifies and analyzes governance gaps and outlines a hybrid public–private regulatory framework to optimize investor and stakeholder interests. The background to the issue dates back to 2018, when the European Commission publishes its Action Plan on Financing Sustainable Growth, outlining a comprehensive strategy to further strengthen the connection between finance and sustainability. This action plan targets: (i) Redirecting capital flows towards sustainable investments to achieve sustainable and inclusive growth; (ii) handling financial risks resulting from climate change, resource depletion, environmental deterioration, and social issues; and (iii) encouraging transparency and a long-term vision of the financial and economic activity.
In the same year, the European Commission establishes a Technical Expert Group on Sustainable Finance (TEG, hereinafter) to develop: (i) A unified classification system for sustainable economic activities; (ii) a European Union (EU) Green Bond Standard (EU GBS, hereinafter); (iii) benchmarks for low-carbon investment strategies; and (iv) guidance to improve companies’ disclosure of climate-related information. The EU GBS is implemented on a voluntary basis by market participants. According to [22], the EU GBS is a voluntary standard proposed to issuers that wish to align with best market practices. It is designed to be implemented by both EU and non-EU based issuers. As stated in [22], an EU Green Bond is any type of listed or unlisted bond or capital market debt instrument issued by any European or international issuer, which funds will be applied exclusively to finance or refinance, totally or partially, new and/or existing eligible green projects that are aligned with the four core components, namely: (i) The alignment of the use-of-proceeds with the EU Taxonomy; (ii) the content of a Green Bond Framework (hereinafter, GBF) to be produced by the issuer; (iii) the required Allocation and Impact Reporting; and (iv) the requirements for external verification by an approved verifier. It should be noted that an issuer can only use the term “EU Green Bond” if the requirements of the EU GBS are fulfilled.
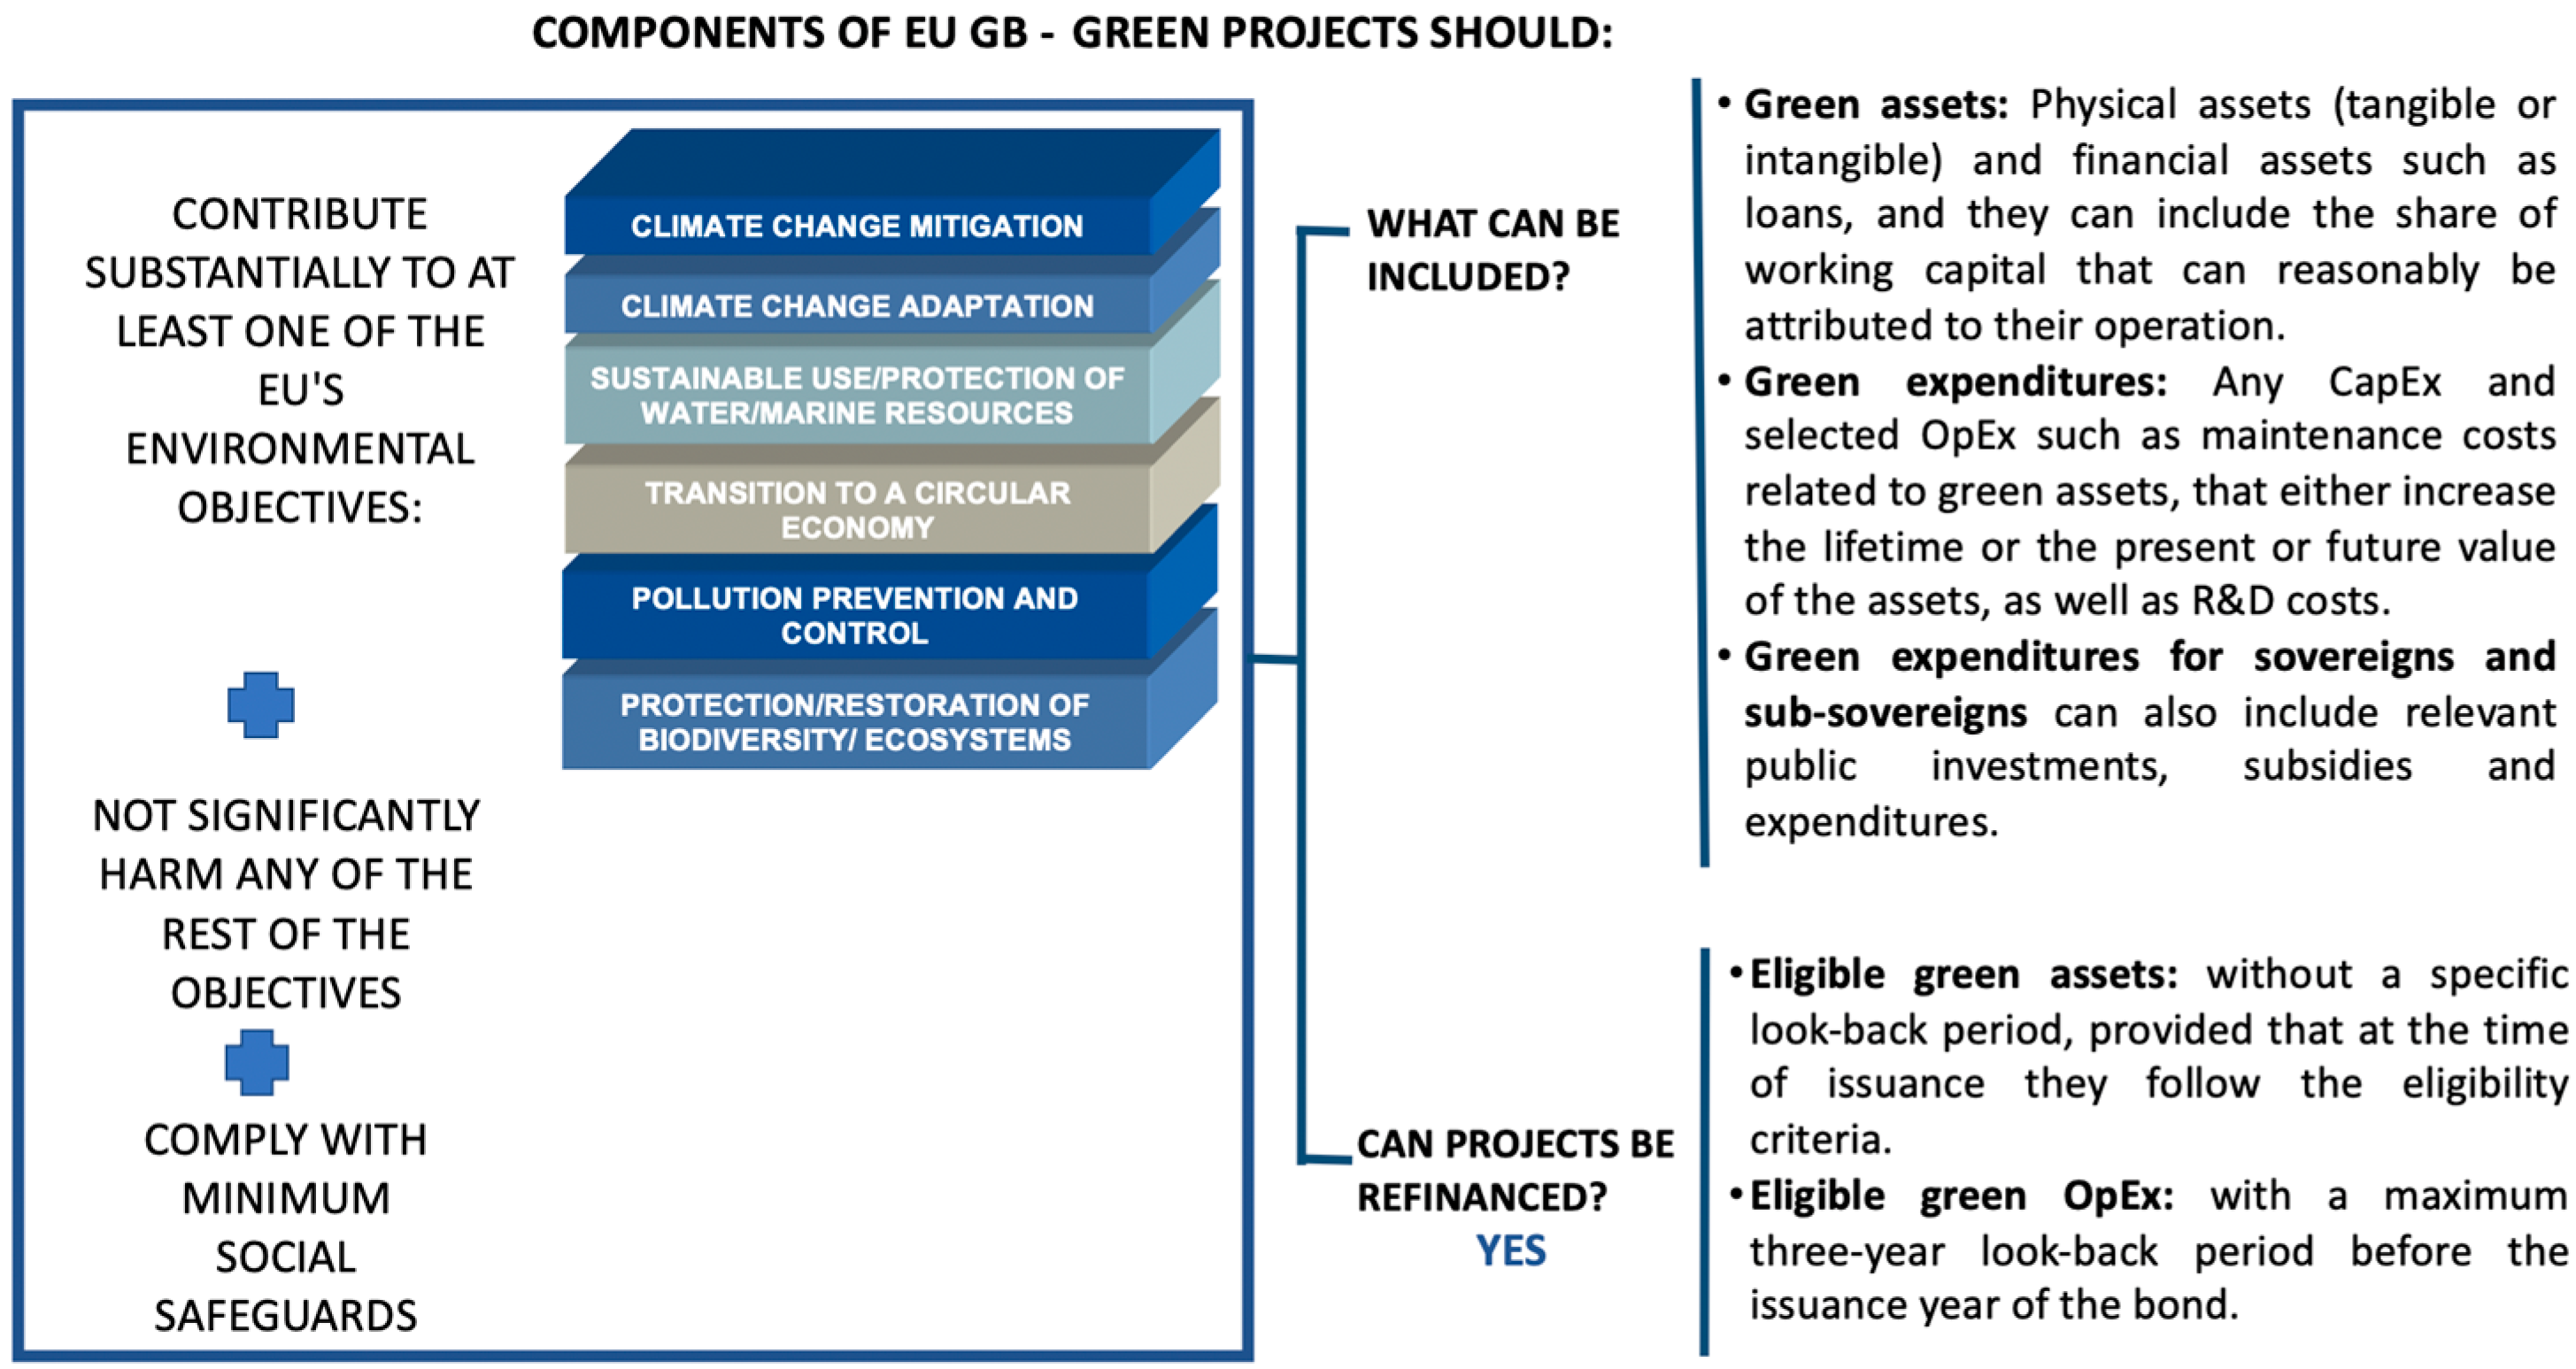
The appearance of green bonds has established a new landscape in the capital markets, requiring quantitative and qualitative measures on what is considered a green investment, the development of business frameworks on how proceeds will be used and their environmental impact, as well as the external validation of the credibility of the green bond frameworks of issuers. In particular, in the EU, the model proposed by the TEG has four main components: (i) The alignment of the use-of-proceeds with the EU Taxonomy; (ii) the content of a GBF drawn up by the issuer; (iii) the allocation and impact reports; and (iv) the requirements for external verification by an authorized verifier. In addition, the EU Taxonomy states that, for a green bond to be labelled as EU GB, the bonds have to meet the requirements shown in Figure 2.
3. Theoretical Background
Although risk transfer and incentives are extensively studied by the public–private partnerships (PPPs) literature, they are traditionally addressed from the perspective of contracts and option provisions typically used in practice [23,24,25]. However, they have rarely been studied from the perspective of green financial products.
On the other hand, the green bond literature largely focuses on studying the link between green bond prices and financial markets. In this regard, the empirical findings of [26] reveal that the green bond market is closely related to fixed income and currency markets, while it is weakly correlated with the stock, energy, and high-yield corporate bond markets. The authors of [2] focus on the analysis of the returns, volatility, and liquidity of green bonds, as well as the key role of third-party verification on private and institutional issues. This aspect is indeed critical for private issuers, since green bonds issued by companies have much less favorable characteristics than conventional bonds in terms of liquidity and volatility, and involves interest rates that are higher than those of their conventional counterparts, except in cases where the private issuer commits to certifying the “greenness” of the bond. In this regard, [27] empirically explore how green information is priced in the green bond market. A comparison of liquidity-adjusted yield premiums for green bonds versus synthetic conventional bonds suggests that, on average, there is no a robust and significant yield premium or discount for green bonds. Additionally, their findings suggest that a universally accepted measure of greenness can enhance the development of the green bond market. Conversely, green bonds issued by institutional issuers exhibit a greater liquidity than conventional bonds and involve lower interest rates, before adjusting for the lower volatility. The authors of [28] match the daily interest spreads of green-labeled and similar non-green-labeled bonds and observe their differentials in prices. The authors conclude that financial and corporate green bonds are traded more closely than their comparable non-green counterparts. Conversely, government-related bonds trade marginally wider. Importantly, some characteristics such as issue size, maturity, and currency do not significantly influence price differentials, but rather the industry and environmental social governance (ESG) rating.
The author of [29] analyzes the volatility dynamics and spillovers in the equity and green bond markets, confirming that green bonds exhibit an asymmetric volatility. However, unlike that of the equity market, green bond volatility is sensitive to positive return shocks. On the other hand, [19] study how the liquidity risk influences bond spreads after controlling for credit risk, bond-specific characteristics and macroeconomic variables. The authors point out that the liquidity measure suggested by [30] and pioneered by Lesmond, Ogden, and Trzcinka (LOT) [31] significantly contributes to explain the yield spreads of green bonds. In any case, the authors show that the explanatory power of that measure has decreased over time and is currently negligible for the green bond market.
The study conducted by [26] has implications in terms of portfolio and risk management decisions for environmentally conscious investors holding positions in green bonds. In this vein, [32] states that green bonds have negligible diversification benefits for investors in corporate and treasury markets, and considerable diversification benefits for investors in stock and energy markets. Additionally, [33] find positive announcement stock returns for green bond new issues. This is consistent with the stakeholder value maximization theory that corporate commitment to sustainable financing increases firm value in the long term and, therefore, is favored by shareholders.
Although the previous literature focuses largely on the investor’s perspective, an interesting approach to consider is whether, from the issuers’ point of view, there is a direct financial incentive to issue green bonds rather than unlabeled bonds. Such a financial incentive arises when green bonds reduce the cost of capital and/or enhance the accessibility to capital, reducing the risks of capital availability. In an empirical research conducted on Chinese listed firms that issue green bonds, [34] analyze some effects of issuing green bonds on their performance. Their results suggest that announcements of green bond issues have a positive impact not only on the company’s stock price, profitability, and operational performance, but also on its capacity for innovation and corporate social responsibility (CSR) policy. Furthermore, green bonds contribute to the protection of the environment, the creation of value and the attraction of investors.
To the best of our knowledge, this is one of the first research papers to explicitly study the impact of the cost of green financing on the profitability of a regasification plant, from a purely financial perspective.
Interestingly, [35] compile 22 interviews between 2017 and 2018 with nine green bond issuers from the public and private sector, who have issued green bonds in Swedish kroner (SEK). Their results suggest that the three most important incentives to issue green bond are: (i) Broadening the investor base; (ii) lowering the cost of capital; and (iii) meeting investor demand for sustainable investment products. The authors conclude that, despite the existence of direct financial incentives for issuers in the Swedish green bond market, such as some reductions in the cost of capital and better access to capital, the predominant incentives are more business-based than financial-based. Specifically, green bond issuers focus on a variety of benefits, such as attracting customers and staff interest or incorporating sustainability into internal operations.
4. Methodology
In this article, we study the regasification plant of Sagunto (Spain), which has 4 tanks, a storage capacity of 600,000 m3 of liquefied natural gas (LNG), and a maximum vessel loading capacity of 3000 m3/h. We follow the same perspective as [36], which analyzes three case studies to illustrate the effects of green bonds on an emerging green finance hub. Regasification plants allow loading, unloading, and storing LNG from methane tankers, being introduced into the pipeline system as natural gas or being transported as LNG in tankers. Among their large customers are combined cycle plants (which burn gas to produce electricity). However, currently, new opportunities arise, such as the supply of fuel to ships. In this regard, many companies involved in the shipping industry have made—and are making—decisions to gradually adapt the fleet to the use of natural gas as a fuel.
The Sagunto regasification plant no only meets all the prerequisites necessary to be financed on a project finance basis, but also to use green bond financing as a main source of indebtedness. In this regard, [37] analyze the benefits of project finance, conceived as a means of resolving market imperfections. In particular, the author clearly differentiates the costs related to market imperfection into the following groups: (i) Transactions costs; (ii) information costs; (iii) incentive conflicts; and (iv) costs of financial distress. Importantly, the author explains that when projects are carried out on a stand-alone basis, they are better analyzed, mitigating information costs. Specifically, project finance contributes significantly to transparency in the construction phase, leading to a reduction in the cost of capital. According to the green bond literature referred above, that effect can benefit from the requirements for public information established for the issuance of green bonds, which largely explain the relatively low interest rate assumed in Table 1 for the green bond financing of the Sagunto regasification plant.
Regarding incentive conflicts, [37] emphasizes that project finance mitigates the cost of four moral hazard problems, namely: (i) Overinvestment in negative NPV projects, (ii) investment in high risk, negative NPV projects, (iii) underinvestment in positive NPV projects; and underinvestment in risky, positive NPV projects. The author explains that in project finance, cash flow waterfalls imply that each monetary unit usually has a specific use, thereby reducing most of these agency costs. This fact results in greater transparency and, therefore, allows the project to reduce the cost of capital. As noted above, this effect can be compounded by green bond financing, allowing the Sagunto regasification plant to reduce the cost of financing.
With respect to the cost of financial distress, [37] claims that project finance contributes to reduce both the probability of default and the costs associated with distress. Specifically, the author explains that in developed countries, the projects have relatively simple capital structures, which tend to facilitate debt restructuring and reduce the costs of distress. As shown below, the Sagunto regasification plant shares these characteristics, which allows the project to reduce the cost of capital by reducing insolvency costs. As noted above, this lower cost of financing can benefit from the use of green bond financing in the capital structure.
The Sagunto regasification plant began its operations in 2011 and, at the date of preparation of this paper, financial information is available until fiscal year 2018. In order to analyze the impact of green bonds on the profitability and financial structure of the project, we assume that, in the course of the investment, the sponsor redeems the old debt and issues green bonds by the same nominal amount. Although there are different categories of green bonds, most of them are non-recourse debt precisely because a SPV is formed to limit liability [12] (p. 269), [38,39]. Building on the fact that a non-recourse debt obligation restricts the lenders’ ability to seek repayment if there is a default, [11] (p. 16) states that when the management’s control benefits differ significantly between one project to another, but the relative capabilities to manage the projects are similar, limited resource financing will be optimal.
Below, we assume that in the year 2016, the company replaces its banking loan with a bond issue with the characteristics shown in Table 1, Panel A. This Panel underlines the main differences assumed in our model between the bank loan and the green bonds, basically given by the interest rate and the maturity date. As noted below, we have set these conditions to guarantee that the assumptions are as realistic as possible. In particular, on the one hand, we use the actual contractual terms of the bank loan issued by the project in February 2010, while on the other hand, we use the contractual terms of a green bond issue from a Spanish issuer (Iberdrola) whose activity is comparable to that of the Sagunto plant.
We use data from the annual financial statements of the regasification plant of Sagunto, from 2011 to 2018, and we make projections for subsequent years, in order to analyze the impact of green bonds as realistically as possible. It is worth mentioning that the bank loan of the SPV holding the project is issued on 15 February 2010, with maturity date 15 February 2030 and a base rate-spread of Euribor + 250 basis points. As shown in Figure 2, green projects can be refinanced using green bonds. Additionally, when refinancing is for eligible green assets, no specific look-back period is required before the issuance, provided that at the time of the issuance the assets follow the eligibility criteria. Importantly, among the green bonds issued in Spain in the period from 2010 to 2018, the bonds issued in April 2016 by Iberdrola—one of the main issuers of green bonds in Spain—with ISIN XS1398476793, are fully comparable to the transaction under analysis. Consequently, we set the terms of the bonds to be issued by the Sagunto regasification plant to coincide with those of Iberdrola bonds.
Based on the fact that most green bonds issued are plain vanilla treasury-style retail bonds, or asset-backed securities tailored for a specific green infrastructure [20], Panel B in Table 1 summarizes all financial combinations considered in our study. It is worth noting that the contractual terms considered in Table 1, Panel B, are consistent with the covenants that are typically used in project finance, as described in the Introduction Section.
4.1. Financial Data
As noted above, to forecast the profit and loss statement and the balance sheet of the project from 2019 to 2041, we make different assumptions consistent with financial data from the Sagunto regasification plant from January 2011 to December 2018, as provided by the Datastream database. Table 2 shows the income and operating expense of the company from 2011 to 2018. From 2019 onwards, a growth rate of 1% is assumed for income and all operating expenditures.
Since the company does not report financial data for fiscal years 2009 and 2010, we assume that the construction of the plant is fully accomplished in January 2011 and the investment duration is 30 years. According to Datastream data, on 15 February 2011, the debt begins to accrue interests and the investment begins to operate. Regarding investments in the operations phase, historical replacement expenditures are small for the period from 2011 to 2018. This fact together with the difficulties that arise to correctly estimate these expenditures without the investment program, makes us assume that replacement expenditures will be zero for the period from 2019 to 2041. Additionally, the percentage of depreciation and amortization for 2018 is assumed to be constant in future periods.
Table 3 shows that the project uses a negligible percentage of equity in its financial structure. In order to better monitor the effects of the green financing on the IRRs, we have reworked the financial statements assuming 30% and 70% of equity and debt, respectively, and have made projections accordingly.
4.2. Balance Sheet and Income Statement Projections
Table 4 and Table 5 show the pro forma balance sheet and profit and loss statement, respectively. It is worth mentioning that all projections comply with the current legislation on financial information and taxes in Spain. Specifically, projections shown in Table 4 and Table 5 consider the current treatment of tax credits that result from tax losses and the constraints for the deduction of interest expenses. Regarding shareholder remuneration, we use the actual payout of the SPV for the period from 2011 to 2018, while we assume a payout ratio of 100% from 2019 to 2041. Although our model completely ignores leveraged recapitalizations such as dividend recaps, below we sensitize our projections to other shareholder compensation schemes, such as loans to equity holders.
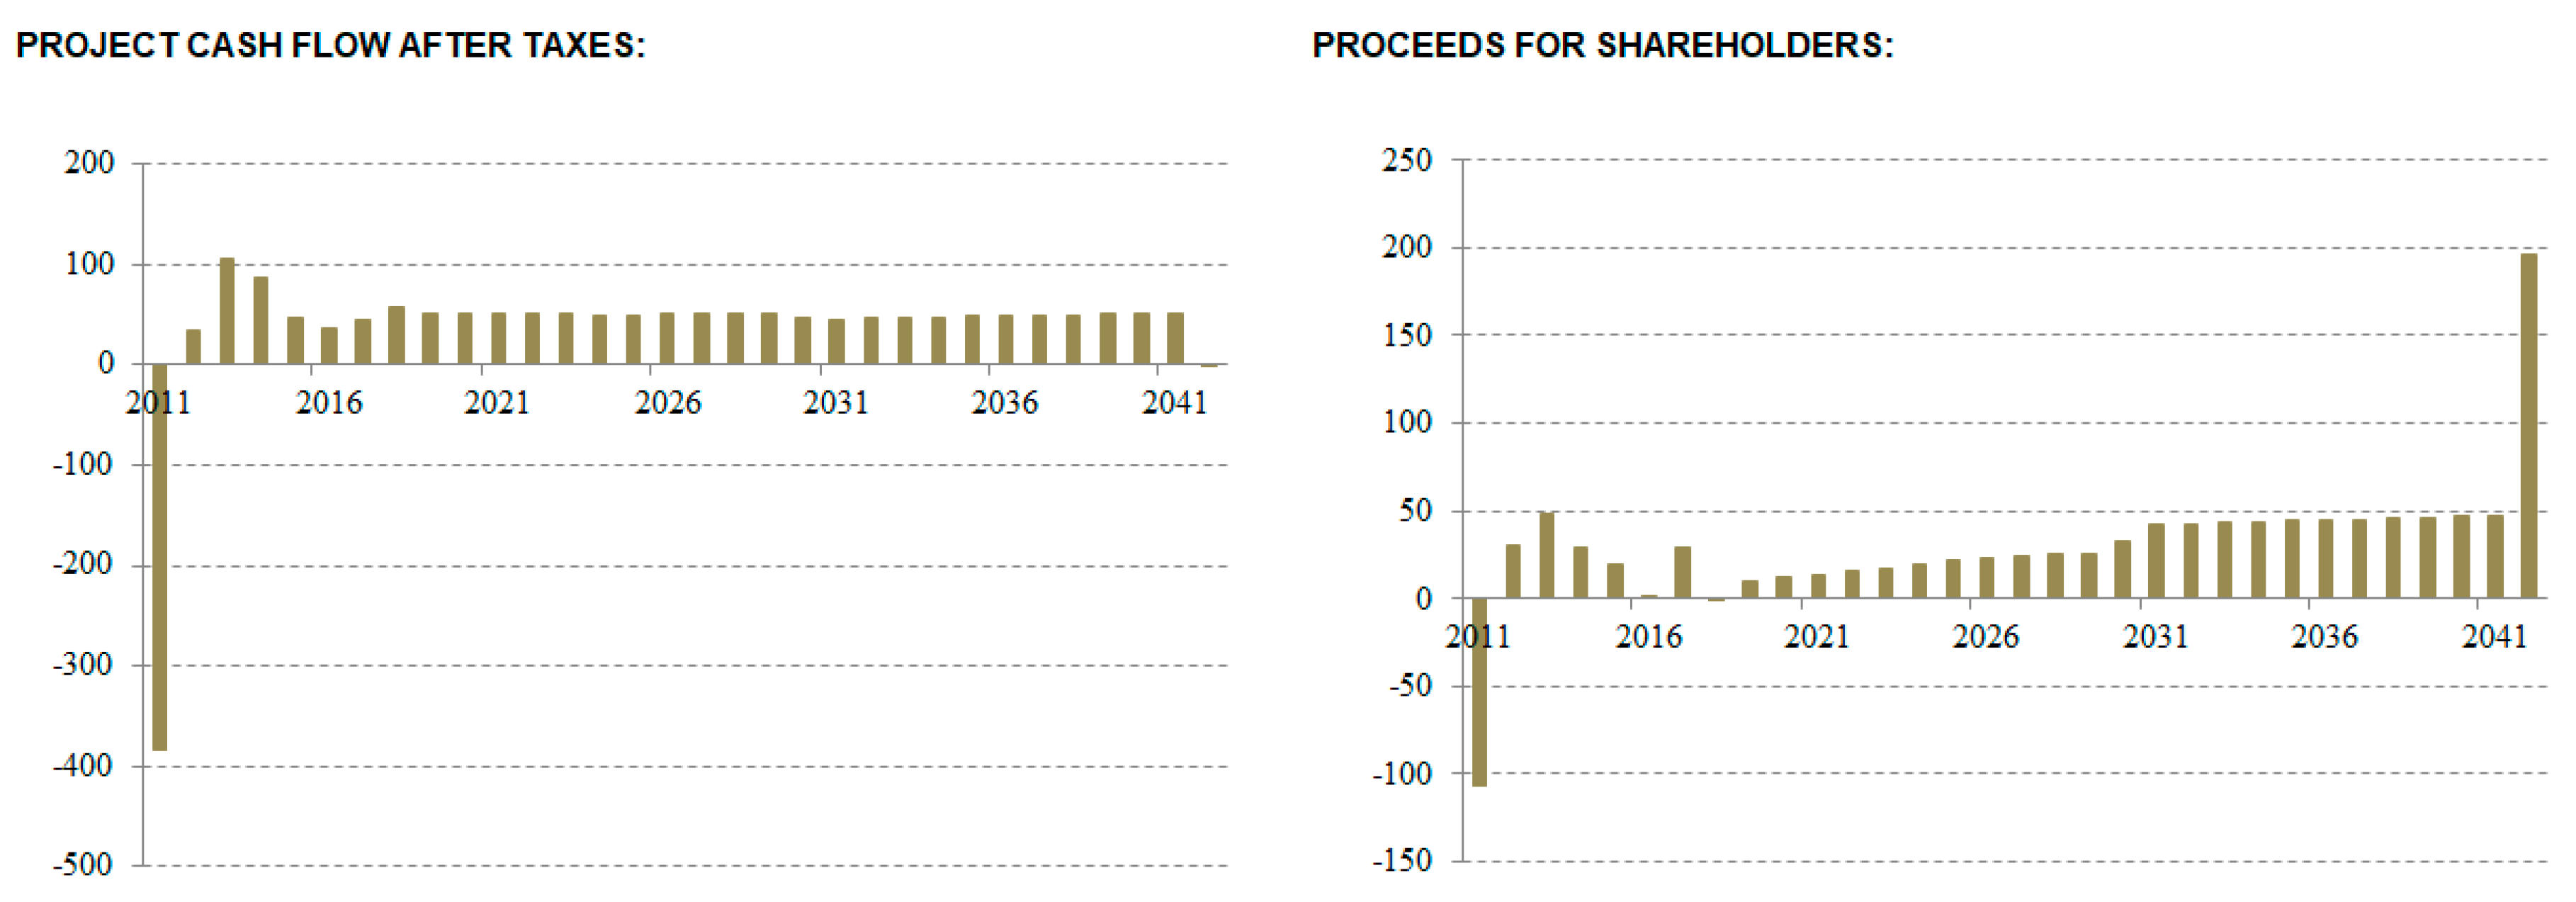
Figure 3 shows both the project cash flow after taxes and the cash flow for shareholders for the whole projection period in the base case. As shown, the project exhibits a strong capacity to repay the debt and a highly stable cash flow throughout the life of the project. Additionally, the cash flow for shareholders exhibits the typical pattern of leveraged structures, as is the case of project finance investments, with low cash flows at the beginning of the operations phase and considerably higher proceeds at the end of the project life. In any case, as noted above, for most of the operating variables, we assume a constant growth rate of 1% per year. Although this involves a conservative scenario, the cash flow shown in Figure 3 may be subject to revision in case of deviations from this assumption.
5. Results and Discussion
In this section, we show the results achieved in the profitability and credit quality analysis developed for the Sagunto regasification plant, in order to analyze whether there are financial incentives for financing via green bonds issuance. For this purpose, a detailed scenario analysis has been carried out. All results are shown in Table 6. Specifically, this table reports results for several scenarios (Panels A to F) for both a bullet repayment and a debt sculpting scheme. Panel A shows the results achieved for base case, while Panels B, C, and D add different contractual terms typically used in project finance to that structure, namely the DSRA, the cash sweep account, and loans to shareholders, respectively. Panels E and F simultaneously integrate these contractual terms into the base case.
In general, Table 6 considers two different scenarios, where the project is refinanced either using a bank loan or green bonds. In order to account for other intermediate possibilities, as is typical in the traditional research on capital structure based on financial projections [40,41,42], Table A1 in the Appendix shows the results achieved using different combinations of these sources of funds. It is worth mentioning that our analysis ignores an explicit reference to the cost of capital of the project, focusing exclusively on its profitability and credit quality. This allows us to avoid an explicit definition of the sensitivity of the cost of equity to changes in the financial structure, which even today is the subject of a lively debate in the financial literature.
Regarding columns in Table 6, columns from I to VI show the profitability of the project, according to the IRR and the NPV. Columns from VII to X shows the credit quality of the project, as measured by the debt service coverage ratio (DSCR), the interest coverage ratio (ICR), the net financial debt to earnings before interest, taxes, depreciation and amortization ratio (NFD/EBITDA), and the equity to equity and net financial debt ratio (E/(E + NFD)). It is important to note that, while the main indicators on the shareholders’ side are the IRR and the NPV for equity (columns IV and VI, respectively), the DSCR is one of the most important indicators for lenders (column VII).
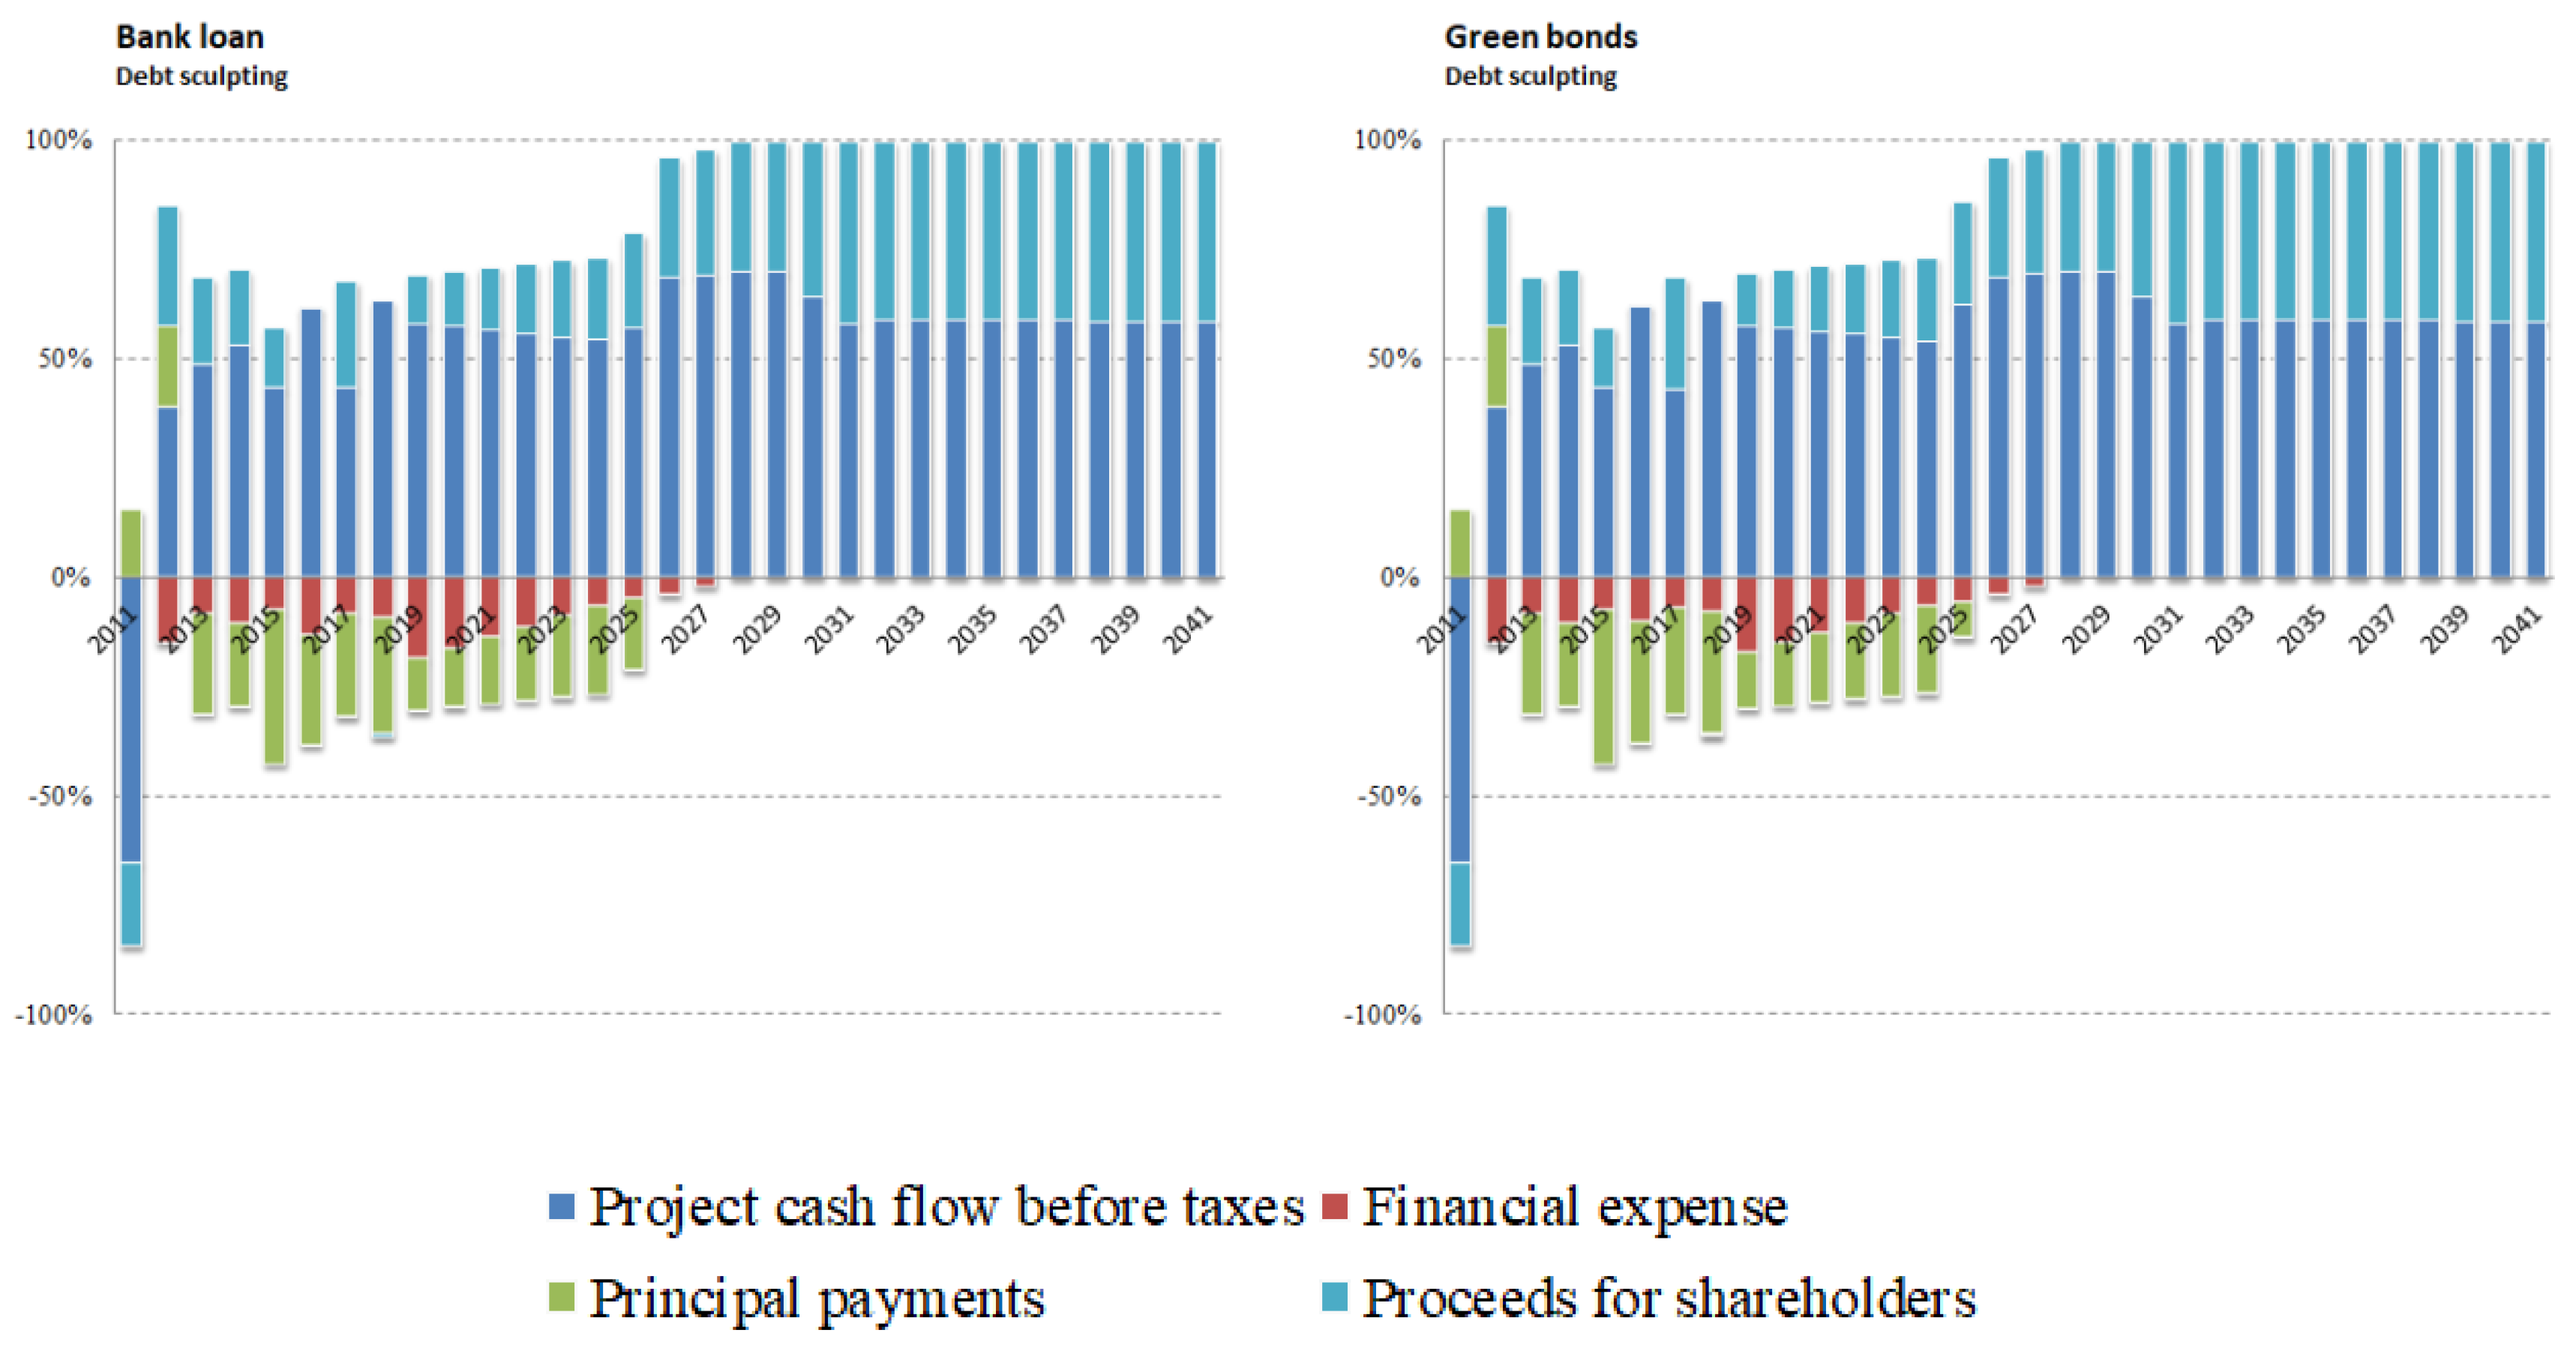
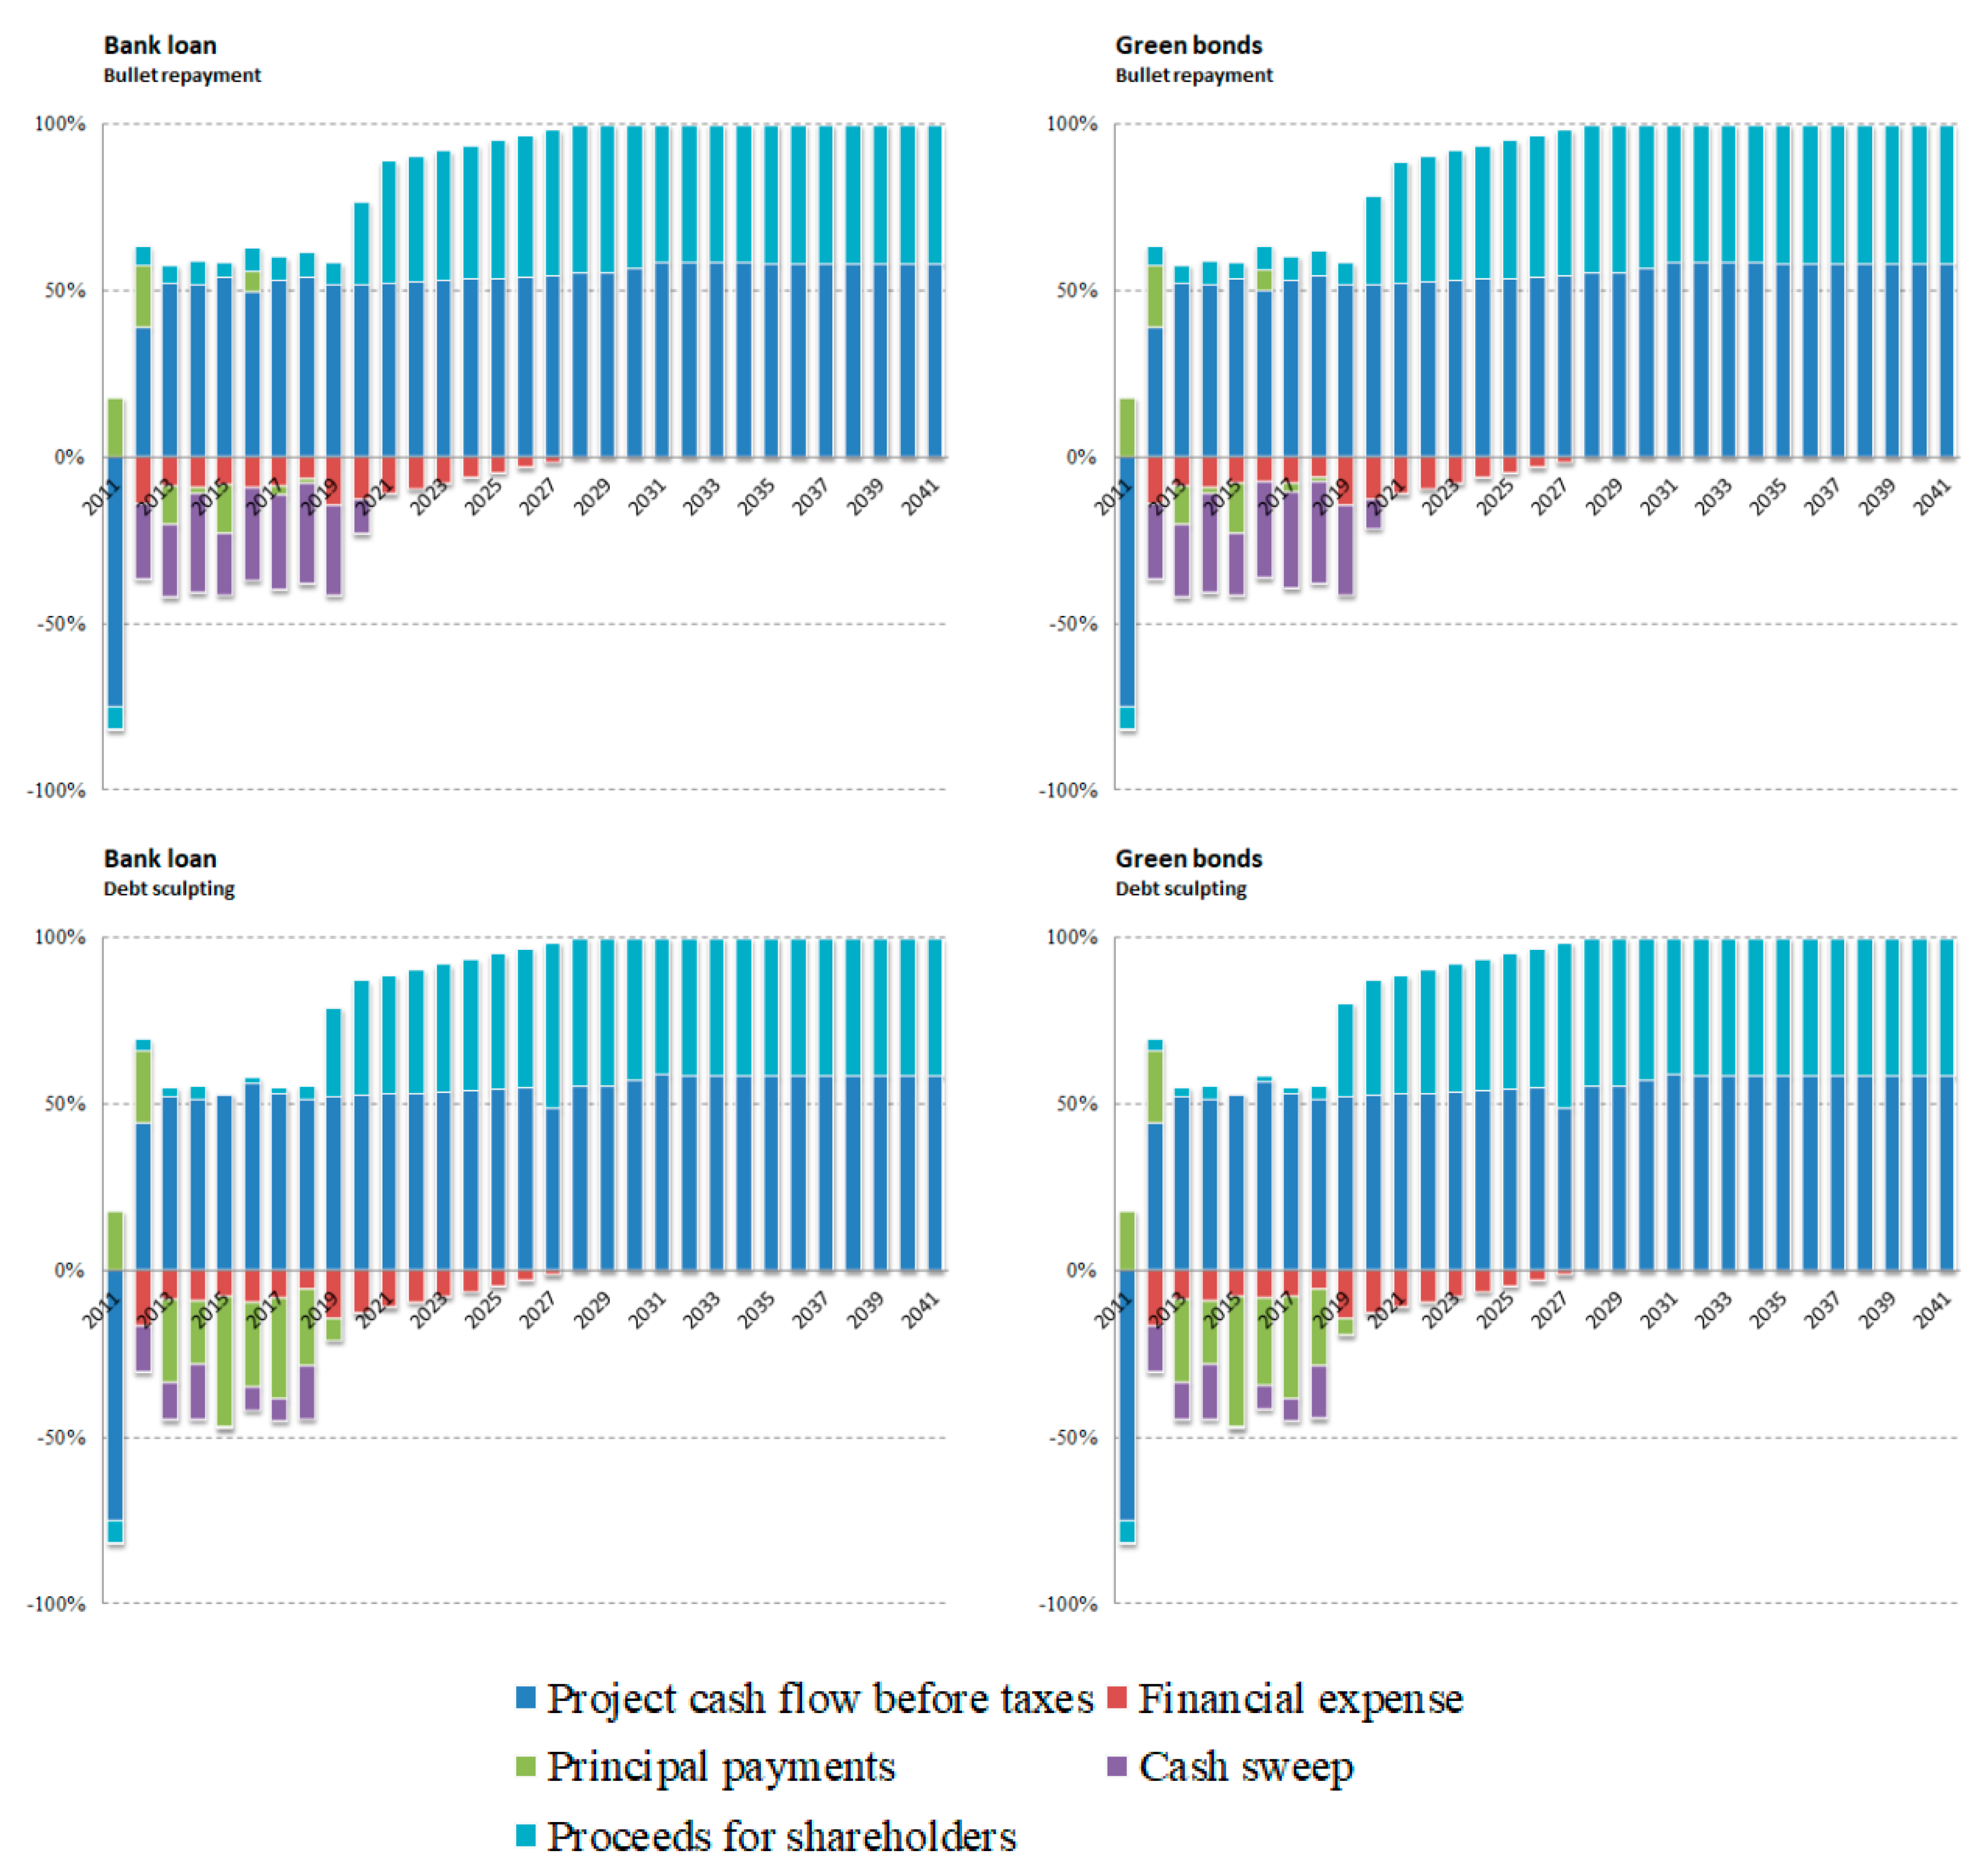
Figure 4 and Figure 5 plot the main financial projections that result in the ratios shown in Table 6. Specifically, Figure 4 shows the pattern over time of the project cash flow before taxes, the financial expenses, the principal expenditures, and the proceeds for shareholders, for the plain vanilla structure shown in Table 6, Panel A. Figure 5 does the same for the case of a financial structure that additionally comprises the DSRA, cash sweep, and loans to shareholders, as shown in Table 6, Panel F.
As shown in Table 6, in almost all cases, the IRR for equity (columns III and IV) achieved in the green bond financing case is higher than that of the bank loan case, regardless of the repayment scheme and the specific contractual terms. However, the case of the bullet repayment is especially remarkable, given that this structure is extensively used in bond issues, in contrast to debt sculpting schemes, which is most frequent for bank loans. With regard to the effect of leverage on returns for shareholders, the differences between the unlevered and levered IRRs (columns II and III, respectively) are very large, which is a consequence of the high leverage involved in the project. In any case, when a debt sculpting scheme is used, the IRR delivered by the dividends distributed by the SPV (column IV) is very similar, if not equal, using both green bond financing or bank loans.
The better performance of the project in the case of green bond financing is entirely explained by the lower interest rate of green bonds with respect to the bank loan, as assumed in Table 1. This is consistent with the results provided by part of the literature on the topic, which emphasizes the lower cost of capital resulting from green financing compared to other types of debt, as noted above. This effect is especially evident in the case of bullet repayments. Indeed, all other things being equal, the shorter maturity assumed for green bonds relative to bank loans (see Figure 4) would result in a lower IRR for shareholders. However, the lower interest rate of green financing compared to bank loans more than offsets that effect, resulting in a net increase of the IRR for equity.
Regarding credit quality ratios, the use of green bonds considerably enhances coverage ratios shown in Table 6 in most cases. The DSCR reflects the project’s debt capacity. As mentioned, it is a ratio that lenders rely strongly on to determine the financial viability of the project. Therefore, the higher this ratio is, the more debt the project is likely to incur. In general, the DSCR should be greater than or equal to 1 and the minimum DSCR required by the lenders depends on factors such as the rating of the host country, the sector, and the lenders involved. The average DSCR shown in Table 6 is estimated as follows:
where CFADS is the cash flow available for debt service, interest expense plus principal is the debt service, and is the length of operations in years. As shown in Table 6, Panel A, the average DSCR (column VII) for the case of bullet repayments (row 1) ranges from 3.97, for the case of bank loans, to 5.38, for the case of green bonds. Moreover, in the vast majority of panels, this ratio is higher for the case of green bond financing. However, it should be noted that while the maturity date of green bond financing is 2026, the maturity date of the bank loan continues to 2031. This fact partly conditions the value of the average DSCR.
On the other hand, the average ICR is estimated as follows:
The results of the average ICR shown in column VIII are in line with those achieved for the DSCR, highlighting that the ICR is usually higher in the case green bonds financing for most scenarios considered.
As shown in Table 6, Panel B, the DSRA does not imply changes in the IRR for shareholders or in the DSCR. In the case of cash sweep scenario (Panel C), as expected, the IRR for shareholders is lower than that shown in the other panels, since a specific percentage of the excess cash flow has to be used to pay down the outstanding debt, instead of distributing it to shareholders. In return, the DSCR is higher than in the non-cash sweep scenarios. Regarding the loan to shareholders scenario (Panel D in Table 6), it naturally results in an important increase in the IRR for shareholders, given that it allows the sponsor to partially overcome the accounting constraints on shareholder compensation.
The comparison between Figure 4 and Figure 5 helps to explain to a great extent the net effect of these contractual terms. Specifically, while the cash sweep provision reduces the cash flow available for shareholders in the short-run, it also results in lower interest expenditures, which implies higher proceeds for shareholders in the long-run. Parallel to this, loans to shareholders significantly increase the cash flow for equity from 2021 to 2031 in Figure 5 compared to Figure 4, which explains its strong effect on the IRR for shareholders, as shown in Table 6. As shown in Panels A and F in Table 6, the benefits that result from the loan to shareholders more than offset the restrictions imposed by the DSRA and the cash sweep account. In fact, while the IRR for shareholders (column IV in Table 6) varies from 22.09% to 23.71% in Panel A, it ranges from 20.39% to 35.33% in Panel F, with the green bond financing providing higher returns than the bank loan in all cases.
All the results above suggest that, in the majority of the cases, green bond financing, far from being a hurdle for sponsors and lenders, becomes an incentive that allows shareholders to increase the profitability of the project due to the lower cost of capital involved, and lenders to increase the credit quality of the project. In general, these conclusions remain unchanged for the case of the hybrid financial structures shown in Table A1 in the Appendix, which suggests a monotonic relationship for most of the ratios under consideration to changes in the financial structure.
In terms of policy implications, our results suggest that green bond financing results in financial incentives for sponsors that contribute to align the objectives of companies that develop energy projects with those established at a national and supranational level that are environmentally friendly. The positive effect of the issuance of green bonds for sponsors adds to the positive influence for shareholders found by previous studies [32,33,43,44]. However, future research should extend the scope of the analysis to other sectors and other geographical areas in order to determine the prevalence of these results.
6. Conclusions
Using data from different statistics and studies, in this research, we have highlighted the significant growth experienced by the green bond market in recent years, and the rising trend in demand for financial products aligned with sustainability. Unlike shareholders, who hold voting rights, bondholders play a passive role in the investment decision-making process. This makes the growing interest in green financial products an element of pressure on issuers to invest according to the use-of-proceeds approach—and its consequent verification—and, consequently, to launch this type of issue. Accordingly, as noted in [22], the Green Bond Framework is expected to include information on the overall sustainability strategy of the issuer and on the consistency between the EU Green Bond and its use-of-proceeds with the overall strategy. This fact results in a greater degree of transparency and enables bond markets to become a powerful tool in green finance and climate change mitigation.
In this study, we have conducted an analysis of the advantages of green bonds with respect to conventional project financing. Our results suggest that green bond financing delivers higher returns for shareholders than conventional financing. Despite this, it is important to note that in this paper, we focus in the supply side, assuming demand as given. This is an important point considering that the consolidation and strengthening of green bond market will likely come from the alignment of incentives between issuers and investors.
As mentioned above, this study shows that green financing provides financial incentives for sponsors. Accordingly, this study is novel in uncovering the important role of issuers in aligning financial objectives with those of national and supranational authorities involved in environmental protection. In this regard, scenario analysis as that shown in previous section can be a useful tool for sponsors to holistically design the debt structure attached to the project.
In any case, it is important to note that, although this research studies the profitability and credit quality for a sustainable project in a wide range of financial scenarios, it does not analyze the variability of the results to operational or financial risks. In this regard, further research on the variability of returns and credit ratios to changes in the operational and financial assumptions established in the base case is mandatory.
Author Contributions
Conceptualization, A.-B.A.-C. and J.R.-S.; methodology, A.-B.A.-C. and J.R.-S.; software, A.-B.A.-C. and J.R.-S.; validation, A.-B.A.-C. and J.R.-S.; formal analysis, A.-B.A.-C. and J.R.-S.; investigation, A.-B.A.-C. and J.R.-S.; resources, A.-B.A.-C. and J.R.-S.; data curation, A.-B.A.-C. and J.R.-S.; writing—original draft preparation, A.-B.A.-C. and J.R.-S.; writing—review and editing, A.-B.A.-C. and J.R.-S.; visualization, A.-B.A.-C. and J.R.-S.; supervision, A.-B.A.-C. and J.R.-S.; project administration, A.-B.A.-C. and J.R.-S. All authors have read and agreed to the published version of the manuscript.
Funding
This research received no external funding.
Acknowledgments
We would like to acknowledge the comments from the anonymous reviewers of the paper, which have contributed to improve this manuscript.
Conflicts of Interest
The authors declare no conflict of interest.
Appendix A

Table A1.
Scenario analysis for hybrid financing (bank loan–green bonds).
| Column | I | II | III | IV | V | VI | VII | VIII | IX | X | |
|---|---|---|---|---|---|---|---|---|---|---|---|
| Row | Project IRR Before Taxes | Project IRR After Taxes | IRR Shareholders Cash Flow | IRR Shareholders Dividends | NPV Shareholders Cash Flow | NPV Shareholders Dividends | Average DSCR | Average ICR | Average NFD/EBITDA | Average E/(E + NFD) | |
| Panel A: Plain vanilla | |||||||||||
| 1 | Bullet repayment | ||||||||||
| Loan 67%-Bonds 33% | 18.19% | 14.29% | 185.88% | 22.50% | 245.95 | 70.50 | 3.95x | 4.17x | 1.41x | 61.58% | |
| Loan 33%-Bonds 67% | 18.19% | 14.29% | 185.93% | 22.85% | 246.09 | 73.84 | 3.98x | 4.21x | 1.41x | 61.81% | |
| 2 | Debt sculpting-DSCR | ||||||||||
| Loan 67%-Bonds 33% | 18.19% | 14.29% | 139.41% | 23.55% | 167.04 | 83.95 | 4.19x | 6.98x | 1.47x | 60.29% | |
| Loan 33%-Bonds 67% | 18.19% | 14.29% | 139.41% | 23.63% | 167.48 | 84.61 | 4.22x | 7.07x | 1.46x | 60.41% | |
| Panel B: Plain vanilla + DSRA | |||||||||||
| 3 | Bullet repayment | ||||||||||
| Loan 67%-Bonds 33% | 18.19% | 14.29% | 167.58% | 22.50% | 241.17 | 70.50 | 3.95x | 4.17x | 1.41x | 61.58% | |
| Loan 33%-Bonds 67% | 18.19% | 14.29% | 167.72% | 22.85% | 241.59 | 73.84 | 3.98x | 4.21x | 1.41x | 61.81% | |
| 4 | Debt sculpting-DSCR | ||||||||||
| Loan 67%-Bonds 33% | 18.19% | 14.29% | 88.95% | 23.55% | 155.38 | 83.95 | 4.19x | 6.98x | 1.47x | 60.29% | |
| Loan 33%-Bonds 67% | 18.19% | 14.29% | 88.97% | 23.63% | 155.84 | 84.61 | 4.22x | 7.07x | 1.46x | 60.41% | |
| Panel C: Plain vanilla + Cash sweep | |||||||||||
| 5 | Bullet repayment | ||||||||||
| Loan 67%-Bonds 33% | 18.19% | 14.29% | 43.20% | 21.85% | 128.98 | 74.99 | 7.31x | 7.31x | 1.52x | 58.35% | |
| Loan 33%-Bonds 67% | 18.19% | 14.29% | 43.25% | 21.86% | 129.21 | 75.03 | 7.35x | 7.35x | 1.52x | 58.42% | |
| 6 | Debt sculpting-DSCR | ||||||||||
| Loan 67%-Bonds 33% | 18.19% | 14.29% | 35.93% | 18.88% | 121.37 | 57.86 | 5.71x | 7.37x | 1.51x | 57.88% | |
| Loan 33%-Bonds 67% | 18.19% | 14.29% | 35.97% | 18.88% | 121.51 | 57.85 | 5.71x | 7.39x | 1.51x | 57.92% | |
| Panel D: Plain vanilla + Loan to shareholders | |||||||||||
| 7 | Bullet repayment | ||||||||||
| Loan 67%-Bonds 33% | 18.31% | 14.09% | 136.70% | 136.70% | 230.09 | 218.61 | 3.91x | 4.13x | 4.38x | 38.85% | |
| Loan 33%-Bonds 67% | 18.31% | 14.09% | 136.79% | 136.79% | 229.73 | 218.19 | 3.90x | 4.14x | 4.36x | 38.84% | |
| 8 | Debt sculpting-DSCR | ||||||||||
| Loan 67%-Bonds 33% | 18.31% | 14.09% | 99.28% | 99.28% | 161.69 | 156.45 | 3.76x | 6.88x | 1.93x | 59.38% | |
| Loan 33%-Bonds 67% | 18.31% | 14.09% | 99.27% | 99.27% | 162.17 | 156.91 | 4.19x | 6.99x | 2.04x | 57.03% | |
| Panel E: Plain vanilla + DSRA + Cash sweep | |||||||||||
| 9 | Bullet repayment | ||||||||||
| Loan 67%-Bonds 33% | 18.19% | 14.29% | 42.06% | 21.76% | 127.88 | 74.52 | 7.30x | 7.30x | 1.51x | 58.59% | |
| Loan 33%-Bonds 67% | 18.19% | 14.29% | 42.12% | 21.77% | 128.11 | 74.58 | 7.33x | 7.33x | 1.51x | 58.65% | |
| 10 | Debt sculpting-DSCR | ||||||||||
| Loan 67%-Bonds 33% | 18.19% | 14.29% | 33.36% | 18.63% | 117.43 | 56.47 | 5.66x | 7.33x | 1.48x | 58.73% | |
| Loan 33%-Bonds 67% | 18.19% | 14.29% | 33.39% | 18.63% | 117.59 | 56.45 | 5.66x | 7.35x | 1.48x | 58.77% | |
| Panel F: Plain vanilla + DSRA + Cash sweep + Loan to shareholders | |||||||||||
| 11 | Bullet repayment | ||||||||||
| Loan 67%-Bonds 33% | 18.31% | 14.09% | 35.25% | 35.23% | 129.11 | 123.30 | 7.37x | 7.37x | 1.58x | 60.00% | |
| Loan 33%-Bonds 67% | 18.31% | 14.09% | 35.30% | 35.28% | 129.38 | 123.55 | 7.41x | 7.41x | 1.58x | 60.08% | |
| 12 | Debt sculpting-DSCR | ||||||||||
| Loan 67%-Bonds 33% | 18.31% | 14.09% | 29.46% | 29.42% | 120.40 | 113.66 | 5.76x | 7.43x | 1.72x | 55.96% | |
| Loan 33%-Bonds 67% | 18.31% | 14.09% | 29.49% | 29.45% | 120.58 | 113.83 | 5.76x | 7.45x | 1.72x | 56.00% | |
The table shows the returns provided by the project, as measured by internal rate of return (IRR) and the net present value (NPV). Additionally, the table shows the main results for the credit quality of the project, specifically, the debt service coverage ratio (DSCR), the interest coverage ratio (ICR), the net financial debt to earnings before interest, taxes, depreciation and amortization ratio (NFD/EBITDA), and the equity to equity and net financial debt ratio (E/(E + NFD)).
References
- Glomsrod, S.; Wei, T. The Implications of fossil divestment and green bonds for financial flows, economic growth and energy market. Energy Sustain. Dev. 2018, 44, 1–10. [Google Scholar] [CrossRef]
- Bachelet, M.J.; Becchetti, L.; Manfredonia, S. The Green Bonds Premium Puzzle: The Role of Issuer Characteristics and Third-Party Verification. Sustainability 2019, 11, 1098. [Google Scholar] [CrossRef] [Green Version]
- Bieliński, T.; Mosionek-Schweda, M. Green Bonds as a Financial Instrument for Environmental Projects Funding. Unia Eur. 2018, 1, 248. [Google Scholar]
- Gianfrate, G.; Peri, M. The green advantage: Exploring the convenience of issuing green bonds. J. Clean. Prod. 2019, 219, 127–135. [Google Scholar] [CrossRef]
- Chemmanur, T.; John, K. Optimal Incorporation, Structure of Debt Contracts and Limited-Recourse Project Financing. J. Financ. Intermed. 1996, 5, 372–408. [Google Scholar] [CrossRef] [Green Version]
- Müllner, J. International project finance: Review and implications for international finance and international business. Manag. Rev. Q. 2017, 67, 97–133. [Google Scholar] [CrossRef] [Green Version]
- Esty, B.C. Modern Project Finance: A Casebook; John Wiley & Sons: New York, NY, USA, 2003. [Google Scholar]
- Miglo, A. Project Financing Versus Corporate Financing under Asymmetric Information. J. Bus. Econ. Res. 2010, 8, 27–42. [Google Scholar] [CrossRef] [Green Version]
- Flyvbjerg, B. What you should Know about Megaprojects and Why: An Overview. Proj. Manag. J. 2014, 45, 6–19. [Google Scholar] [CrossRef] [Green Version]
- Esty, B.C. The Economic Motivations for Using Project Finance; Harvard Business School Mimeo: Boston, MA, USA, 2003. [Google Scholar]
- Finnerty, J.D. Project Financing, 2nd ed.; Wiley: Hoboken, NJ, USA, 2007; pp. 1–12. [Google Scholar]
- Gatti, S. Project Finance in Theory and Practice, 2nd ed.; Elsevier: Atlanta, GA, USA, 2013; pp. 1–21. [Google Scholar]
- Kleimeier, S.; Megginson, W.L. Are project finance loans different from other syndicated credits? J. Appl. Corp. Financ. 2000, 13, 75–87. [Google Scholar] [CrossRef]
- Climate Bonds Initiative. Green Bond Pricing in the Primary Market: H1 2019, January–June 2019. Available online: https://www.climatebonds.net/cbi/partners (accessed on 30 September 2019).
- Banga, J. The green bond market: A potential source of climate finance for developing countries. J. Sustain. Invest. 2019, 9, 17–32. [Google Scholar] [CrossRef]
- Climate Bonds Initiative. The Role of Exchanges in Accelerating the Growth of the Green Bond Market, May 2017. Available online: https://www.climatebonds.net/files/files/RoleStock%20Exchanges.pdf (accessed on 28 July 2020).
- Barua, S.; Chiesa, M. Sustainable financing practices through green bonds: What affects the funding size? Bus. Strategy Environ. 2019, 28, 1131–1147. [Google Scholar] [CrossRef]
- Chiesa, M.; Barua, S. The surge of impact borrowing: The magnitude and determinants of green bond supply and its heterogeneity across markets. J. Sustain. Financ. Investig. 2019, 9, 138–161. [Google Scholar] [CrossRef]
- Wulandari, F.; Schafer, D.; Stephan, A.; Sun, C. The impact of liquidity risk on the yield spread of green bonds. Financ. Res. Lett. 2018, 27, 53–59. [Google Scholar] [CrossRef]
- Lam, P.T.I.; Yang, H.X.; Yu, J.S. An Overview of Green Financing and Business Models for the Development of Renewable Energy in the Pearl River Delta. In Proceedings of the 12th International Conference on Sustainable Energy Technologies (SET-2013), Hong Kong, China, 26–29 August 2013. [Google Scholar]
- Park, S.K. Investors as regulators: Green Bonds and the governance challenges of the sustainable finance revolution. Stanf. J. Int. Law 2018, 54, 1–47. [Google Scholar]
- EU Technical Expert Group on Sustainable Finance. Usability Guide EU Green Bond Standard; Publications Office of the European Union: Luxembourg, 2020. [Google Scholar]
- Jin, H.; Liu, S.; Liu, C.; Udawatta, N. Optimizing the concession period of PPP projects for fair allocation of financial risk. Eng. Constr. Archit. Manag. 2019, 26, 2347–2363. [Google Scholar] [CrossRef]
- Yun, S.; Han, S.; Kim, H.; Jong, H.O. Capital structure optimization for build-operate-transfer (BOT) projects using a stochastic and multi-objective approach. Can. J. Civ. Eng. 2009, 36, 777–790. [Google Scholar] [CrossRef]
- Alonso-Conde, A.B.; Brown, C.; Rojo-Suárez, J. Public private partnerships: Incentives, risk transfer and real options. Rev. Financ. Econ. 2007, 16, 335–349. [Google Scholar] [CrossRef]
- Reboredo, J.C.; Ugolini, A. Price connectedness between green bond and financial markets. Econ. Model. 2020, 88, 25–38. [Google Scholar] [CrossRef]
- Hyun, S.; Park, D.; Tian, S. The price of going green: The role of greenness in green bond markets. Account. Financ. 2020, 60, 73–95. [Google Scholar] [CrossRef]
- Hachenberg, B.; Schiereck, D. Are green bonds priced differently from conventional bonds? J. Asset Manag. 2018, 19, 371–383. [Google Scholar] [CrossRef]
- Park, D.; Park, J.; Ryu, D. Volatility Spillovers between Equity and Green Bond Markets. Sustainability 2020, 12, 3722. [Google Scholar] [CrossRef]
- Chen, L.; Lesmond, D.A.; Wei, J. Corporate yield spreads and bond liquidity. J. Financ. 2007, 62, 119–149. [Google Scholar] [CrossRef]
- Lesmond, D.; Ogden, J.; Trzcinka, C. A new estimate of transaction costs. Rev. Financ. Stud. 1999, 12, 1113–1141. [Google Scholar] [CrossRef]
- Reboredo, J.C. Green bond and financial markets: Co-movement, diversification and price spillover effects. Energy Econ. 2018, 74, 38–50. [Google Scholar] [CrossRef]
- Wang, J.; Chen, X.; Li, X.; Yu, J.; Zhong, R. The market reaction to green bond issuance: Evidence from China. Pac. Basin Financ. J. 2020, 60, 101294. [Google Scholar] [CrossRef]
- Zhou, X.; Cui, Y. Green Bonds, Corporate Performance, and Corporate Social Responsibility. Sustainability 2019, 11, 6881. [Google Scholar] [CrossRef] [Green Version]
- Maltais, A.; Nykvist, B. Understanding the role of green bonds in advancing sustainability. J. Sustain. Financ. Invest. 2020. [CrossRef] [Green Version]
- Ng, A.W. From sustainability accounting to a green financing system: Institutional legitimacy and market heterogeneity in a global financial centre. J. Clean. Prod. 2018, 195, 585–592. [Google Scholar] [CrossRef]
- Esty, B.C. Petrozuata: A case study of effective use of project finance. J. Appl. Corp. Financ. 2005, 12, 26–42. [Google Scholar] [CrossRef]
- ICMA. Green Bond Principles. In Voluntary Process Guidelines for Issuing Green Bonds; International Capital Market Association: Zurich, Switzerland, 2018. [Google Scholar]
- Deschryver, P.; de Mariz, F. What Future for the Green Bond Market? How Can Policymakers, Companies, and Investors Unlock the Potential of the Green Bond Market? J. Risk Financ. Manag. 2020, 13, 61. [Google Scholar] [CrossRef] [Green Version]
- Okoye, C.C.; Osinubi, T.S.; Amaghionyeodiwe, L. Capital structure: An application of trade-off theory to a small E&P oil and gas company. Int. J. Econ. Commer. Manag. 2018, 6, 1–25. [Google Scholar]
- Damodaran, A. Damodaran on Valuation: Security Analysis for Investment and Corporate Finance, 2nd ed.; John Wiley & Sons: Hoboken, NJ, USA, 2016. [Google Scholar]
- Miglo, A.; Lee, Z.; Liang, S. Capital Structure of Internet Companies: Case Study. J. Internet Commer. 2014, 13, 253–281. [Google Scholar] [CrossRef]
- Zerbib, O.D. The effect of pro-environmental preferences on bond prices: Evidence from green bonds. J. Bank. Financ. 2019, 98, 39–60. [Google Scholar] [CrossRef]
- Tang, D.Y.; Zhang, Y. Do shareholders benefit from green bonds? J. Corp. Financ. 2020, 61, 101427. [Google Scholar] [CrossRef]
Figure 1.
Primary market for green bonds and geographical diversification worldwide. The figure shows trends in the primary green bond market up to 2019, as well as geographical diversification worldwide [14]: (a) This plot shows both new issues and market size ($ bn); (b) this plot shows the geographical distribution of green bond issuers worldwide. All data are in million USD, unless otherwise stated.

Figure 2.
Components of European Union Green Bond (EU GB). The figure outlines the requirements for considering a green bond as EU GB, as well as the specification of what type of investments can be financed or refinanced through this type of issuance.
Figure 2.
Components of European Union Green Bond (EU GB). The figure outlines the requirements for considering a green bond as EU GB, as well as the specification of what type of investments can be financed or refinanced through this type of issuance.

Figure 3.
Project cash flow after taxes and proceeds for shareholders (2011–2041).

Figure 4.
Financial projections for the plain vanilla scenario (2011–2041).


Figure 5.
Financial projections for the plain vanilla + Debt Service Reserve Account (DSRA) + Cash sweep + Loan to shareholders scenario (2011–2041).
Figure 5.
Financial projections for the plain vanilla + Debt Service Reserve Account (DSRA) + Cash sweep + Loan to shareholders scenario (2011–2041).

Table 1.
Characteristics of the debt and payment schedule scenarios. (A) Characteristics of the debt. (B) Payment schedule scenarios.
(A)
| Bank Loan | Green Bonds | ||
|---|---|---|---|
| Date of issuance | 15 February 2010 | Date of issuance | 15 February 2016 |
| Expiry date | 15 February 2030 | Expiry date | 15 February 2026 |
| Currency | Euro | Currency | Euro |
| Interest rate | Euribor + 250 b.p. | Interest rate | 1.125% |
(B)
| Multiple Scenarios | ||||
|---|---|---|---|---|
| Plain Vanilla | Bullet repayment | Bank Loan | Debt Service Reserve Account (DSRA) | yes/no |
| Loan to Share Holders | yes/no | |||
| Cash sweep | yes/no | |||
| Green Bonds | Debt Service Reserve Account (DSRA) | yes/no | ||
| Loan to Share Holders | yes/no | |||
| Cash sweep | yes/no | |||
| Debt sculpting-DSCR | Bank loan | Debt Service Reserve Account (DSRA) | yes/no | |
| Loan to Share Holders | yes/no | |||
| Cash sweep | yes/no | |||
| Green Bonds | Debt Service Reserve Account (DSRA) | yes/no | ||
| Loan to Share Holders | yes/no | |||
| Cash sweep | yes/no | |||
Table 2.
Historical income and operating expenditure.
| Start Date | Jan/2011 | Jan/2012 | Jan/2013 | Jan/2014 | Jan/2015 | Jan/2016 | Jan/2017 | Jan/2018 | |
|---|---|---|---|---|---|---|---|---|---|
| End Date | Dec/2011 | Dec/2012 | Dec/2013 | Dec/2014 | Dec/2015 | Dec/2016 | Dec/2017 | Dec/2018 | |
| Revenue from Business | Gwth 1.0% | 120.40 | 100.86 | 105.22 | 102.89 | 97.40 | 101.19 | 77.02 | 69.94 |
| Other Operating Income | Gwth 1.0% | 1.87 | 1.32 | 7.72 | 7.44 | 1.69 | 1.40 | 1.10 | 0.46 |
| Non-Recurring Income | Gwth 1.0% | 0.00 | 0.00 | 0.11 | 0.01 | 0.86 | 0.02 | 0.01 | −0.02 |
| Cost of Operating Revenue | Gwth 1.0% | −0.31 | 1.10 | 7.83 | 7.45 | 0.63 | 0.59 | 0.83 | 0.46 |
| SG&A Expenses | Gwth 1.0% | 10.99 | 9.42 | 8.62 | 7.72 | 8.46 | 9.00 | 8.27 | 7.45 |
| Labor & Related Expenses | Gwth 1.0% | 3.86 | 4.00 | 4.12 | 4.15 | 4.21 | 4.15 | 4.11 | 4.13 |
The table shows historical data for income and operating expenditure (figures in millions of euros).
Table 3.
Sources of funds.
| Source | Share |
|---|---|
| Common equity | 0.37% |
| Financial debt | 85.46% |
The table shows the weight of the sources of funds, according to data for fiscal year 2011.
Table 4.
Pro forma balance sheet.
| Assets | ||||||||
| Start Date | Jan/2019 | Jan/2020 | Jan/2021 | Jan/2022 | Jan/2023 | Jan/2024 | … | Jan/2041 |
| End Date | Dec/2019 | Dec/2020 | Dec/2021 | Dec/2022 | Dec/2023 | Dec/2024 | Dec/2041 | |
| Total Non-Current Assets | 259.74 | 238.25 | 216.76 | 195.27 | 173.78 | 152.29 | 32.83 | |
| Intangible Assets | 0.73 | 0.66 | 0.59 | 0.52 | 0.45 | 0.38 | 0.00 | |
| Other Non-Current Assets | 4.09 | 3.70 | 3.32 | 2.93 | 2.54 | 2.15 | 0.00 | |
| Tangible assets | 222.09 | 201.05 | 180.02 | 158.99 | 137.95 | 116.92 | 0.00 | |
| Land & Buildings | 4.49 | 4.07 | 3.64 | 3.22 | 2.79 | 2.37 | 0.00 | |
| Plant, Machinery & Equipment | 212.52 | 192.40 | 172.27 | 152.14 | 132.01 | 111.89 | 0.00 | |
| Property, Plant & Equipment-Other | 5.07 | 4.59 | 4.11 | 3.63 | 3.15 | 2.67 | 0.00 | |
| Receivables & Loans-Long-Term | 32.72 | 32.72 | 32.72 | 32.72 | 32.72 | 32.72 | 32.72 | |
| Financial investments | 0.11 | 0.11 | 0.11 | 0.11 | 0.11 | 0.11 | 0.11 | |
| Deferred taxes | 0.00 | 0.00 | 0.00 | 0.00 | 0.00 | 0.00 | 0.00 | |
| Total Current Assets | 108.52 | 117.07 | 123.74 | 128.47 | 131.21 | 131.90 | 232.68 | |
| Prepaid Expenses-Short-Term | 0.32 | 0.32 | 0.32 | 0.32 | 0.32 | 0.32 | 0.32 | |
| Inventories-Total | 1.93 | 1.95 | 1.97 | 1.99 | 2.01 | 2.03 | 2.40 | |
| Loans & Receivables-Net-Short-Term | 25.17 | 25.42 | 25.68 | 25.93 | 26.19 | 26.45 | 31.33 | |
| Cash & Short-Term Investments | 81.11 | 89.38 | 95.77 | 100.23 | 102.70 | 103.10 | 198.63 | |
| Total Assets | 368.26 | 355.32 | 340.50 | 323.74 | 304.99 | 284.19 | 265.51 | |
| Equity and Liabilities | ||||||||
| Start date | Jan/2019 | Jan/2020 | Jan/2021 | Jan/2022 | Jan/2023 | Jan/2024 | … | Jan/2041 |
| End date | Dec/2019 | Dec/2020 | Dec/2021 | Dec/2022 | Dec/2023 | Dec/2024 | Dec/2041 | |
| Shareholders’ Equity | 196.46 | 196.46 | 196.46 | 196.46 | 196.46 | 196.46 | 196.46 | |
| Common Equity-Contributed | 119.85 | 119.85 | 119.85 | 119.85 | 119.85 | 119.85 | 119.85 | |
| Reserves & Retained Earnings | 76.61 | 76.61 | 76.61 | 76.61 | 76.61 | 76.61 | 76.61 | |
| Total Non-Current Liabilities | 164.75 | 151.78 | 136.95 | 120.18 | 101.41 | 80.59 | 64.37 | |
| Financial Debt-Total | 100.38 | 87.41 | 72.58 | 55.81 | 37.04 | 16.22 | 0.00 | |
| Other Non-Current Liabilities-Total | 64.37 | 64.37 | 64.37 | 64.37 | 64.37 | 64.37 | 64.37 | |
| Total Current Liabilities | 7.06 | 7.07 | 7.09 | 7.10 | 7.12 | 7.13 | 4.68 | |
| Trade Accounts Payable & Accruals | 4.32 | 4.33 | 4.35 | 4.36 | 4.38 | 4.39 | 1.94 | |
| Other Current Liabilities-Total | 2.74 | 2.74 | 2.74 | 2.74 | 2.74 | 2.74 | 2.74 | |
| Total Equity and Liabilities | 368.26 | 355.32 | 340.50 | 323.74 | 304.99 | 284.19 | 265.51 |
Table 5.
Pro forma profit and loss statement.
| Start date | Jan/2011 | Jan/2012 | Jan/2013 | Jan/2014 | Jan/2015 | Jan/2016 | … | Jan/2041 |
|---|---|---|---|---|---|---|---|---|
| End date | Dec/2011 | Dec/2012 | Dec/2013 | Dec/2014 | Dec/2015 | Dec/2016 | Dec/2041 | |
| Revenue from Business Activities | 120.40 | 100.86 | 105.22 | 102.89 | 97.40 | 101.19 | 87.93 | |
| Cost of Operating Revenue | 0.31 | −1.10 | −7.83 | −7.45 | −0.63 | −0.59 | −0.58 | |
| Gross Profit-Industrials/Property | 120.71 | 99.76 | 97.39 | 95.44 | 96.77 | 100.60 | 87.35 | |
| Selling, General & Adm. Expenses | −41.87 | −43.91 | −43.03 | −42.22 | −43.26 | −36.45 | −14.56 | |
| SG&A Expenses | −10.99 | −9.42 | −8.62 | −7.72 | −8.46 | −9.00 | −9.37 | |
| Labor & Related Expenses | −3.86 | −4.00 | −4.12 | −4.15 | −4.21 | −4.15 | −5.19 | |
| Depreciation | −27.02 | −30.49 | −30.29 | −30.35 | −30.59 | −23.30 | 0.00 | |
| Other Operating Expense/(Income) | −2.01 | −1.89 | 2.76 | −0.61 | −5.14 | −4.11 | −5.36 | |
| Op. Profit before Non-Recurring Income | 76.83 | 53.96 | 57.12 | 52.61 | 48.37 | 60.04 | 67.43 | |
| Interest Expense-Net of (Interest Income) | −8.87 | −13.97 | −19.28 | −18.33 | 3.66 | −10.34 | −4.51 | |
| Normalized Pre-tax Profit | 67.96 | 39.99 | 37.84 | 34.28 | 52.03 | 49.70 | 62.92 | |
| Non-Recurring Income/(Expense) | 0.00 | 0.00 | 0.11 | 0.01 | 0.86 | 0.02 | −0.03 | |
| Income before Taxes | 67.96 | 39.99 | 37.95 | 34.29 | 52.89 | 49.72 | 62.90 | |
| Income Taxes | −19.19 | −10.85 | −11.39 | −6.49 | −13.96 | −11.80 | −15.72 | |
| Net Income after Tax | 48.76 | 29.14 | 26.57 | 27.80 | 38.93 | 37.92 | 47.17 |
Table 6.
Scenario analysis for different financial structures.
| Column | I | II | III | IV | V | VI | VII | VIII | IX | X | |
|---|---|---|---|---|---|---|---|---|---|---|---|
| Row | Project IRR Before Taxes | Project IRR After Taxes | IRR Shareholders Cash Flow | IRR Shareholders Dividends | NPV Shareholders Cash Flow | NPV Shareholders Dividends | Average DSCR | Average ICR | Average NFD/EBITDA | Average E/(E + NFD) | |
| Panel A: Plain vanilla | |||||||||||
| 1 | Bullet repayment | ||||||||||
| Bank loan | 18.19% | 14.29% | 185.83% | 22.09% | 247.53 | 66.17 | 3.97x | 4.17x | 1.42x | 61.36% | |
| Green bonds | 18.19% | 14.29% | 185.99% | 23.27% | 241.86 | 78.18 | 5.38x | 6.26x | 1.40x | 62.03% | |
| 2 | Debt sculpting-DSCR | ||||||||||
| Bank loan | 18.19% | 14.29% | 139.41% | 23.46% | 166.58 | 83.28 | 4.17x | 6.89x | 1.47x | 60.17% | |
| Green bonds | 18.19% | 14.29% | 139.41% | 23.71% | 167.90 | 85.22 | 4.26x | 7.16x | 1.46x | 60.53% | |
| Panel B: Plain vanilla + DSRA | |||||||||||
| 3 | Bullet repayment | ||||||||||
| Bank loan | 18.19% | 14.29% | 167.45% | 22.09% | 242.43 | 66.17 | 3.97x | 4.17x | 1.42x | 61.36% | |
| Green bonds | 18.19% | 14.29% | 167.86% | 23.27% | 237.64 | 78.18 | 5.38x | 6.26x | 1.40x | 62.03% | |
| 4 | Debt sculpting-DSCR | ||||||||||
| Bank loan | 18.19% | 14.29% | 88.94% | 23.46% | 154.92 | 83.28 | 4.17x | 6.89x | 1.47x | 60.17% | |
| Green bonds | 18.19% | 14.29% | 88.98% | 23.71% | 156.27 | 85.22 | 4.26x | 7.16x | 1.46x | 60.53% | |
| Panel C: Plain vanilla + Cash sweep | |||||||||||
| 5 | Bullet repayment | ||||||||||
| Bank loan | 18.19% | 14.29% | 43.15% | 21.84% | 128.76 | 74.94 | 7.28x | 7.28x | 1.52x | 58.28% | |
| Green bonds | 18.19% | 14.29% | 43.30% | 21.86% | 129.42 | 75.08 | 7.39x | 7.39x | 1.51x | 58.48% | |
| 6 | Debt sculpting-DSCR | ||||||||||
| Bank loan | 18.19% | 14.29% | 35.90% | 18.88% | 121.23 | 57.87 | 5.71x | 7.35x | 1.52x | 57.85% | |
| Green bonds | 18.19% | 14.29% | 36.00% | 18.88% | 121.64 | 57.84 | 5.71x | 7.41x | 1.51x | 57.95% | |
| Panel D: Plain vanilla + Loan to shareholders | |||||||||||
| 7 | Bullet repayment | ||||||||||
| Bank loan | 18.31% | 14.09% | 136.61% | 136.61% | 232.69 | 221.08 | 3.98x | 4.19x | 4.40x | 38.96% | |
| Green bonds | 18.31% | 14.09% | 136.88% | 136.88% | 224.28 | 212.62 | 5.20x | 6.05x | 4.30x | 38.61% | |
| 8 | Debt sculpting-DSCR | ||||||||||
| Bank loan | 18.31% | 14.09% | 99.28% | 99.28% | 161.20 | 155.98 | 3.59x | 6.78x | 1.96x | 58.85% | |
| Green bonds | 18.31% | 14.09% | 99.27% | 99.27% | 162.67 | 157.39 | 4.21x | 7.09x | 2.02x | 57.46% | |
| Panel E: Plain vanilla + DSRA + Cash sweep | |||||||||||
| 9 | Bullet repayment | ||||||||||
| Bank loan | 18.19% | 14.29% | 42.01% | 21.75% | 127.65 | 74.46 | 7.26x | 7.26x | 1.51x | 58.53% | |
| Green bonds | 18.19% | 14.29% | 42.18% | 21.78% | 128.33 | 74.64 | 7.37x | 7.37x | 1.50x | 58.71% | |
| 10 | Debt sculpting-DSCR | ||||||||||
| Bank loan | 18.19% | 14.29% | 33.33% | 18.63% | 117.28 | 56.48 | 5.65x | 7.30x | 1.48x | 58.69% | |
| Green bonds | 18.19% | 14.29% | 33.43% | 18.62% | 117.74 | 56.44 | 5.66x | 7.38x | 1.48x | 58.81% | |
| Panel F: Plain vanilla + DSRA + Cash sweep + Loan to shareholders | |||||||||||
| 11 | Bullet repayment | ||||||||||
| Bank loan | 18.31% | 14.09% | 35.20% | 35.18% | 128.85 | 123.05 | 7.34x | 7.34x | 1.59x | 59.92% | |
| Green bonds | 18.31% | 14.09% | 35.35% | 35.33% | 129.63 | 123.79 | 7.45x | 7.45x | 1.58x | 60.15% | |
| 12 | Debt sculpting-DSCR | ||||||||||
| Bank loan | 18.31% | 14.09% | 29.43% | 29.39% | 120.22 | 113.50 | 5.76x | 7.40x | 1.72x | 55.92% | |
| Green bonds | 18.31% | 14.09% | 29.51% | 29.47% | 120.76 | 113.99 | 5.77x | 7.48x | 1.72x | 56.04% | |
The table shows the returns provided by the project, as measured by internal rate of return (IRR) and the net present value (NPV). Additionally, the table shows the main results for the credit quality of the project, specifically, the debt service coverage ratio (DSCR), the interest coverage ratio (ICR), the net financial debt to earnings before interest, taxes, depreciation and amortization ratio (NFD/EBITDA), and the equity to equity and net financial debt ratio (E/(E + NFD)).
© 2020 by the authors. Licensee MDPI, Basel, Switzerland. This article is an open access article distributed under the terms and conditions of the Creative Commons Attribution (CC BY) license (http://creativecommons.org/licenses/by/4.0/).
Share and Cite
MDPI and ACS Style
Alonso-Conde, A.-B.; Rojo-Suárez, J. On the Effect of Green Bonds on the Profitability and Credit Quality of Project Financing. Sustainability 2020, 12, 6695. https://0-doi-org.brum.beds.ac.uk/10.3390/su12166695
AMA Style
Alonso-Conde A-B, Rojo-Suárez J. On the Effect of Green Bonds on the Profitability and Credit Quality of Project Financing. Sustainability. 2020; 12(16):6695. https://0-doi-org.brum.beds.ac.uk/10.3390/su12166695
Chicago/Turabian StyleAlonso-Conde, Ana-Belén, and Javier Rojo-Suárez. 2020. "On the Effect of Green Bonds on the Profitability and Credit Quality of Project Financing" Sustainability 12, no. 16: 6695. https://0-doi-org.brum.beds.ac.uk/10.3390/su12166695
Note that from the first issue of 2016, this journal uses article numbers instead of page numbers. See further details here.