A Hybrid MADM Model for Product Design Evaluation and Improvement


1
Department of Industrial Design, National Taipei University of Technology, 1, Sec. 3, Zhongxiao E. Rd., Taipei 10608, Taiwan
2
College of Design, National Taipei University of Technology, 1, Sec. 3, Zhongxiao E. Rd., Taipei 10608, Taiwan
3
Shanghai Bluecross Medical Science Institute, Shanghai 200127, China
4
Department of Industrial Engineering and Management, National Taipei University of Technology, 1, Sec. 3, Zhongxiao E. Rd., Taipei 10608, Taiwan
*
Author to whom correspondence should be addressed.
Sustainability 2020, 12(17), 6743; https://0-doi-org.brum.beds.ac.uk/10.3390/su12176743
Submission received: 29 July 2020
/
Revised: 16 August 2020
/
Accepted: 18 August 2020
/
Published: 20 August 2020
(This article belongs to the Special Issue Sustainable Technology and Business Innovations: Decision-Making under Uncertainty and Information Asymmetry)
Abstract
:Global warming and climate change are the most pressing issues in the world. This is the inevitable result of human beings pursuing a better quality of life and materials. If the green design concept is used in the design and manufacture of products, the impact of production on the environment will be greatly reduced. Because of this, green product design assessment and improvement activities play an important role in achieving the 2030 sustainable development goals. Product design is the forefront of the entire product development process, and it plays a very critical role. The purpose of this study is to develop a decision-making model for helping decision makers to evaluate and improve the performance of product design systematically. The model combines the design standard of the iF world design guide and multi-attribute decision-making methods. First, the DEMATEL-based analytic network process is used to establish the influential relationship and weights of attributes. Next, the VlseKriterijumska Optimizacija I Kompromisno with aspiration-level method is used to obtain the gap between each evaluation attribute and the aspiration level of each design. Finally, this evaluation result uses the influential network relationship map (INRM) to propose various improvement strategies with causal influence. This study uses products from a Taiwanese furniture design company as an empirical case, which is a leading brand and benchmark in Taiwan’s furniture industry. The research results show that the proposed model can help decision makers to choose the most appropriate design scheme (i.e., the design with the smallest gap from expectations); designers can also improve the gap between product design and expectations.
1. Introduction
Green product design is essential for sustainable development. In September 2015, the United Nations convened a conference titled “Reforming Our World: Agenda 2030 for Sustainable Development”. The goals of action provide a common blueprint for the peace and prosperity of mankind and the planet today and in the future. There are 17 sustainable development goals (SDGs), of which the 12th goal is responsible consumption and production to “Ensure sustainable consumption and production patterns”, and sustainable development has become a new goal for global development. Additionally, the Environmental Defense Fund (EDF) of the US, established in 1967, provides solutions to urgent environmental issues such as climate, energy, human health, ecological protection, and the ocean on the topic of green supply chains. In addition, the World Business Council for Sustainable Development (WBCSD), established in 1995, focuses on sustainable development issues such as energy, climate, and corporate social responsibility, intending to ensure that everyone enjoys a comfortable and quality life and takes consumer responsibility. The importance of sustainable green product design to the human sustainable development of the world can be seen.
Green design plays an important role in the process of product design and development, and it is also a key goal to determine whether a product can successfully become a green design. In response to the fierce competition in the globalized market and the rapid change of product cycles, designers will actively innovate and develop into the consumer market [1]. However, the systematic product development process covers market research, conceptual design, schematic design, manufacturing, and launching onto the market [2]. Generally, enterprise design and development are carried out in the R&D department or are outsourced to take advantage of external resources [3]. The green design of products can increase sales and profits, and enhance the survivability of enterprises in the global market [4]. Therefore, responding to global environmental protection, green design concepts can be used as a development management strategy to create the value of the product itself, which has attracted increasing interest from international scholars [5].
With the rise of environmental awareness and legal regulations, green product design not only plays a vital role in manufacturing, but also becomes the mainstream of the future. Consumers are increasingly aware of environmental protection and a sense of responsibility for themselves and society. This will increase the willingness to purchase green products, as well as the effectiveness of purchasing behavior and environmental protection. Consumers’ requirements for green product design are not limited to style, performance, function, manufacturing quality, cost reduction, production, and assembly process [6,7], but also to consider whether it is consistent with the sustainability of society and environmental protection [8]. Besides, many countries/industries implement environmental laws and promote green product design, and even, the government subsidizes enterprises to enhance the intensity of green innovation. At the national level, green manufacturing value chains, technological innovation, and energy consumption are being promoted. On the industrial side, green concepts such as green design, green material selection, green technology, green packaging, and green recycling are carried out. Therefore, the suggestions for sustainable business activities of enterprises are that the operation strategy and design strategy should comply with environmental principles, for easy product maintenance and disassembly, to meet the new challenges of green product design reuse, recycling, and regeneration.
Green product design is essential for sustainable development. To achieve green design goals during the development process, design criteria must be set. Generally, enterprises are willing to participate in or refer to international design competition criteria and use them as standards for product design, such as Germany’s iF DESIGN AWARD [9], Germany’s Red Dot [10], Japan’s Good Design Award [11], and Industrial Designers Society of America (IDSA) [12], and so on. Among them, this study chose to use the iF DESIGN AWARD competition evaluation criteria, because it contains a wider range of environmental concepts. Therefore, the contestants all struggled to think about how to use green product design as a design strategy to create value and look forward to standing out from the competition with the goal of continuous development.
Product design is a typical problem of multiple attribute decision-making (MADM). It often requires a mixture of qualitative and quantitative evaluation criteria in the evaluation process [13]. Several MADM methods have been applied to this issue. For example, Geng and Zhang [14] combined vague set and the technique for order of preference by similarity to ideal solution (TOPSIS) method to select the best design concepts. Zaim et al. [15] developed an integrated decision model based on the Analytic Network Process (ANP) and Fuzzy Quality Function Deployment (FQFD) to improve the evaluation process of new product development. Zhu [16] used ANP and VlseKriterijumska Optimizacija I Kompro-misno Resenje (VIKOR) methods to evaluate and select appropriate design solutions. Shidpour et al. [17] developed the integration model of fuzzy AHP and TOPSIS and applied it to the selection process of product concepts. Ayağ [18] integrated ANP and TOPSIS methods to optimize a new product development process. Pourhejazy et al. [19] used the Product Deletion (PD) method as the decision-making method for product design. The abovementioned hybrid MADM models all show that the MADM method has played an important role in the field of product design. The MADM methodology can provide a series of systematic decision-making modeling frameworks to assist decision makers in establishing various suitable decision models and solving product design problems.
However, the above research has some shortcomings: (1) The evaluation system rarely adopts international standards, which makes the evaluation direction different from the aspects of international attention. (2) The gap between the actual performance and the aspiration level is not considered in the evaluation process for original TOPSIS and VIKOR methods, because the benchmark setting of normalization comes from the maximum and minimum values among the alternatives (i.e., various designs). This setting way makes it easy to encounter the problem of “choose good apples from rotten apples” [20]. (3) The improvement strategy does not take into account the causal relationship between attributes, which is prone to cause the “treat symptoms but not the disease” problem [21,22]. To make up for the above research gaps, this study proposes a hybrid MADM model, which is based on the iF DESIGN AWARD criteria as the evaluation system. Then, the DEMATEL-based analytical network process (DANP) method is used to establish the network structure and weights of attributes. Finally, VIKOR-AS is used to select and improve new product designs. The results of this decision model can assist managers/decision makers to choose appropriate product design as subsequent new product development, and understand the gap between each product design and the ideal level. For the gap between each product design and the ideal level, the influential network relation map (INRM) can be used to propose various improvements and measures with a causal perspective. This study uses a Taiwanese furniture company as an empirical case to demonstrate the usefulness of the hybrid model, which is applied to the modeling and result analysis of the product design.
2. Literature Review
This section first introduces the MADM methods in product design to understand the characteristics and shortcomings of decision-making models in these studies, and then, summarizes the research deficiencies. Next, the iF DESIGN AWARD and its evaluation criteria are introduced.
2.1. Survey of MADM Methods in Product Design
In the past decade, MADM has been successfully applied to various product design fields. Through a series of scientific decision-making models to enhance the evaluation and improvement process of product design, these studies can be roughly divided into the following categories:
The first category is MADM models with explicit values. This type of model is mainly to develop a decision model with evaluation, selection, and improvement to assist decision makers in solving the problem of solution evaluation. In past studies, Mohanty [23] applied three methods to select appropriate ergonomic products. Aghajani Bazzazi et al. [24] developed a hybrid VIKOR evaluation model with weights to solve the problem of open pit equipment selection, where its weights are based on the entropy method and AHP. Gao et al. [25] used the MADM model to select green product design problems. Ying et al. [26] applied a hybrid model to select new product development alternatives for automatic dishwashers. In Ayağ’s research [18], the ANP method was used to determine the relative weights of a set of quantitative and qualitative evaluation criteria, and the modified TOPSIS method was utilized to select the best suitable design concept. This type of research shows that different industries have decision-making needs for product design evaluation, and different industries and companies will develop different evaluation attributes and decision-making models.
The second category is MADM models with fuzzy values. Because experts cannot accurately describe their decision preferences, some decision models incorporated fuzzy methods to deal with the inaccuracies and ambiguities in expert judgment [27,28,29]. For example, Zavadskas et al. [30] used the Weighted Aggregates Sum Product Assessment (WASPAS) method with a single-valued neutrosophic set to solve the selection problem of lead-zinc flotation circuit design. Geng and Zhang [14] advocated that vague set theory is superior to fuzzy set theory in dealing with uncertain and imprecise judgments of decision makers, and the TOPSIS framework was proposed to rank the order of design concepts according to the synthetic vague decision matrix. Ma et al. [31] applied a fuzzy AHP decision model to product design. Olabanji et al. [32] integrated fuzzy synthetic and fuzzy weighted average to evaluate a design concept of the Royal Air Force. Feng et al. [33] applied DANP and VIKOR to select functional component products for environmental protection. Tiwari et al. [34] applied rough sets and the VIKOR method to evaluate and select product design concepts. This category of decision-making models is mainly based on the MADM models and considers the vagueness of human linguistic expression.
The third category is MADM models with other methods. This type of decision model integrates MADM with other methods. For example, Alizon et al. [4] evaluated decision models to improve product design and development efficiency. Wu et al. [35] applied design matrix and fuzzy and gray correlation analysis to improve the innovation and efficiency of design concepts. Wang et al. [36] used multi-criteria decision-making to determine the low-carbon standards and design solutions of products designed for low-carbon products. Jing et al. [37] applied an interactive qualitative goal decision-making method to solve the trade-offs between the target factors of the solution assessment to meet the actual design expectations. Hsieh et al. [38] evaluated decision models to shorten design development time and reduce costs, and used DANP and TRIZ methods for innovative design of machine tools.
2.2. Survey of iF DESIGN AWARD Evaluation Criteria
There are many international competitions for product design in the world, such as the iF DESIGN AWARD [9] in Germany, Red Dot [10] in Germany, Good Design Award [11] in Japan, and Industrial Designers Society of America (IDSA) [12] in the United States. Each international competition has its own standards and methods of competition. These international competitions regularly collect various design works from enterprises every year, and invite world-class experts as jury members to evaluate and rank all design works/products according to a set of fixed criteria, and finally, give appropriate rewards to the works that passed the review. Generally speaking, enterprises will regard winning awards in international competitions as a development indicator of the new product design process, as consumers will choose the winning product when buying products because it is an indicator of trust in design quality. In addition, it is an honor for designers to receive awards for their works. Overall, for enterprises, winning product design awards can increase the attention and respect of products entering the market.
The iF DESIGN AWARD originated in 1953. In order to overcome domestic and foreign impacts from World War II, Germany established and supported the German “formal design of industrial products” organization. Among them, entrepreneur Philip Rosenthal was committed to blending the cultural and business worlds together. This concept was also adopted as the basis of the new organization. Rosenthal, Messegesellschaft, and the German Federation of Industry jointly created this unique organization, iF, which is the beginning of today’s recognized design excellence logo—the iF logo. It is the oldest independent design logo in the world, and it is also a symbol of outstanding design achievements that focus on the ability of design innovation [9].
The iF DESIGN AWARD is a platform that supports talented young people and creates a public platform for young designers. Each year, companies, designers, agents, and architects test their own designs by participating in the iF DESIGN AWARD. The main feature of the iF design competition is a jury composed of more than 70 well-known experts from 20 countries around the world, and they are involved in the evaluation process of each work according to the evaluation criteria. Entry categories include: product design, packaging design, communication design, interior design, professional concept, and service design. The types of competition are divided into: product design awards (products already produced by companies), design rookie concept awards, holding design competitions (companies or organizations), and social welfare awards. Presently, the evaluation criteria of the iF DESIGN AWARD 2020 can be divided into five dimensions of innovation, Functionality, Aesthetics, Responsibility, and Positioning and the corresponding 19 criteria, as shown in Table 1 [9].
3. Methodology
This section first describes the modeling framework and process of the hybrid model. Next, the method used in each stage and its calculation process are introduced.
3.1. Modeling Framework and Process Content
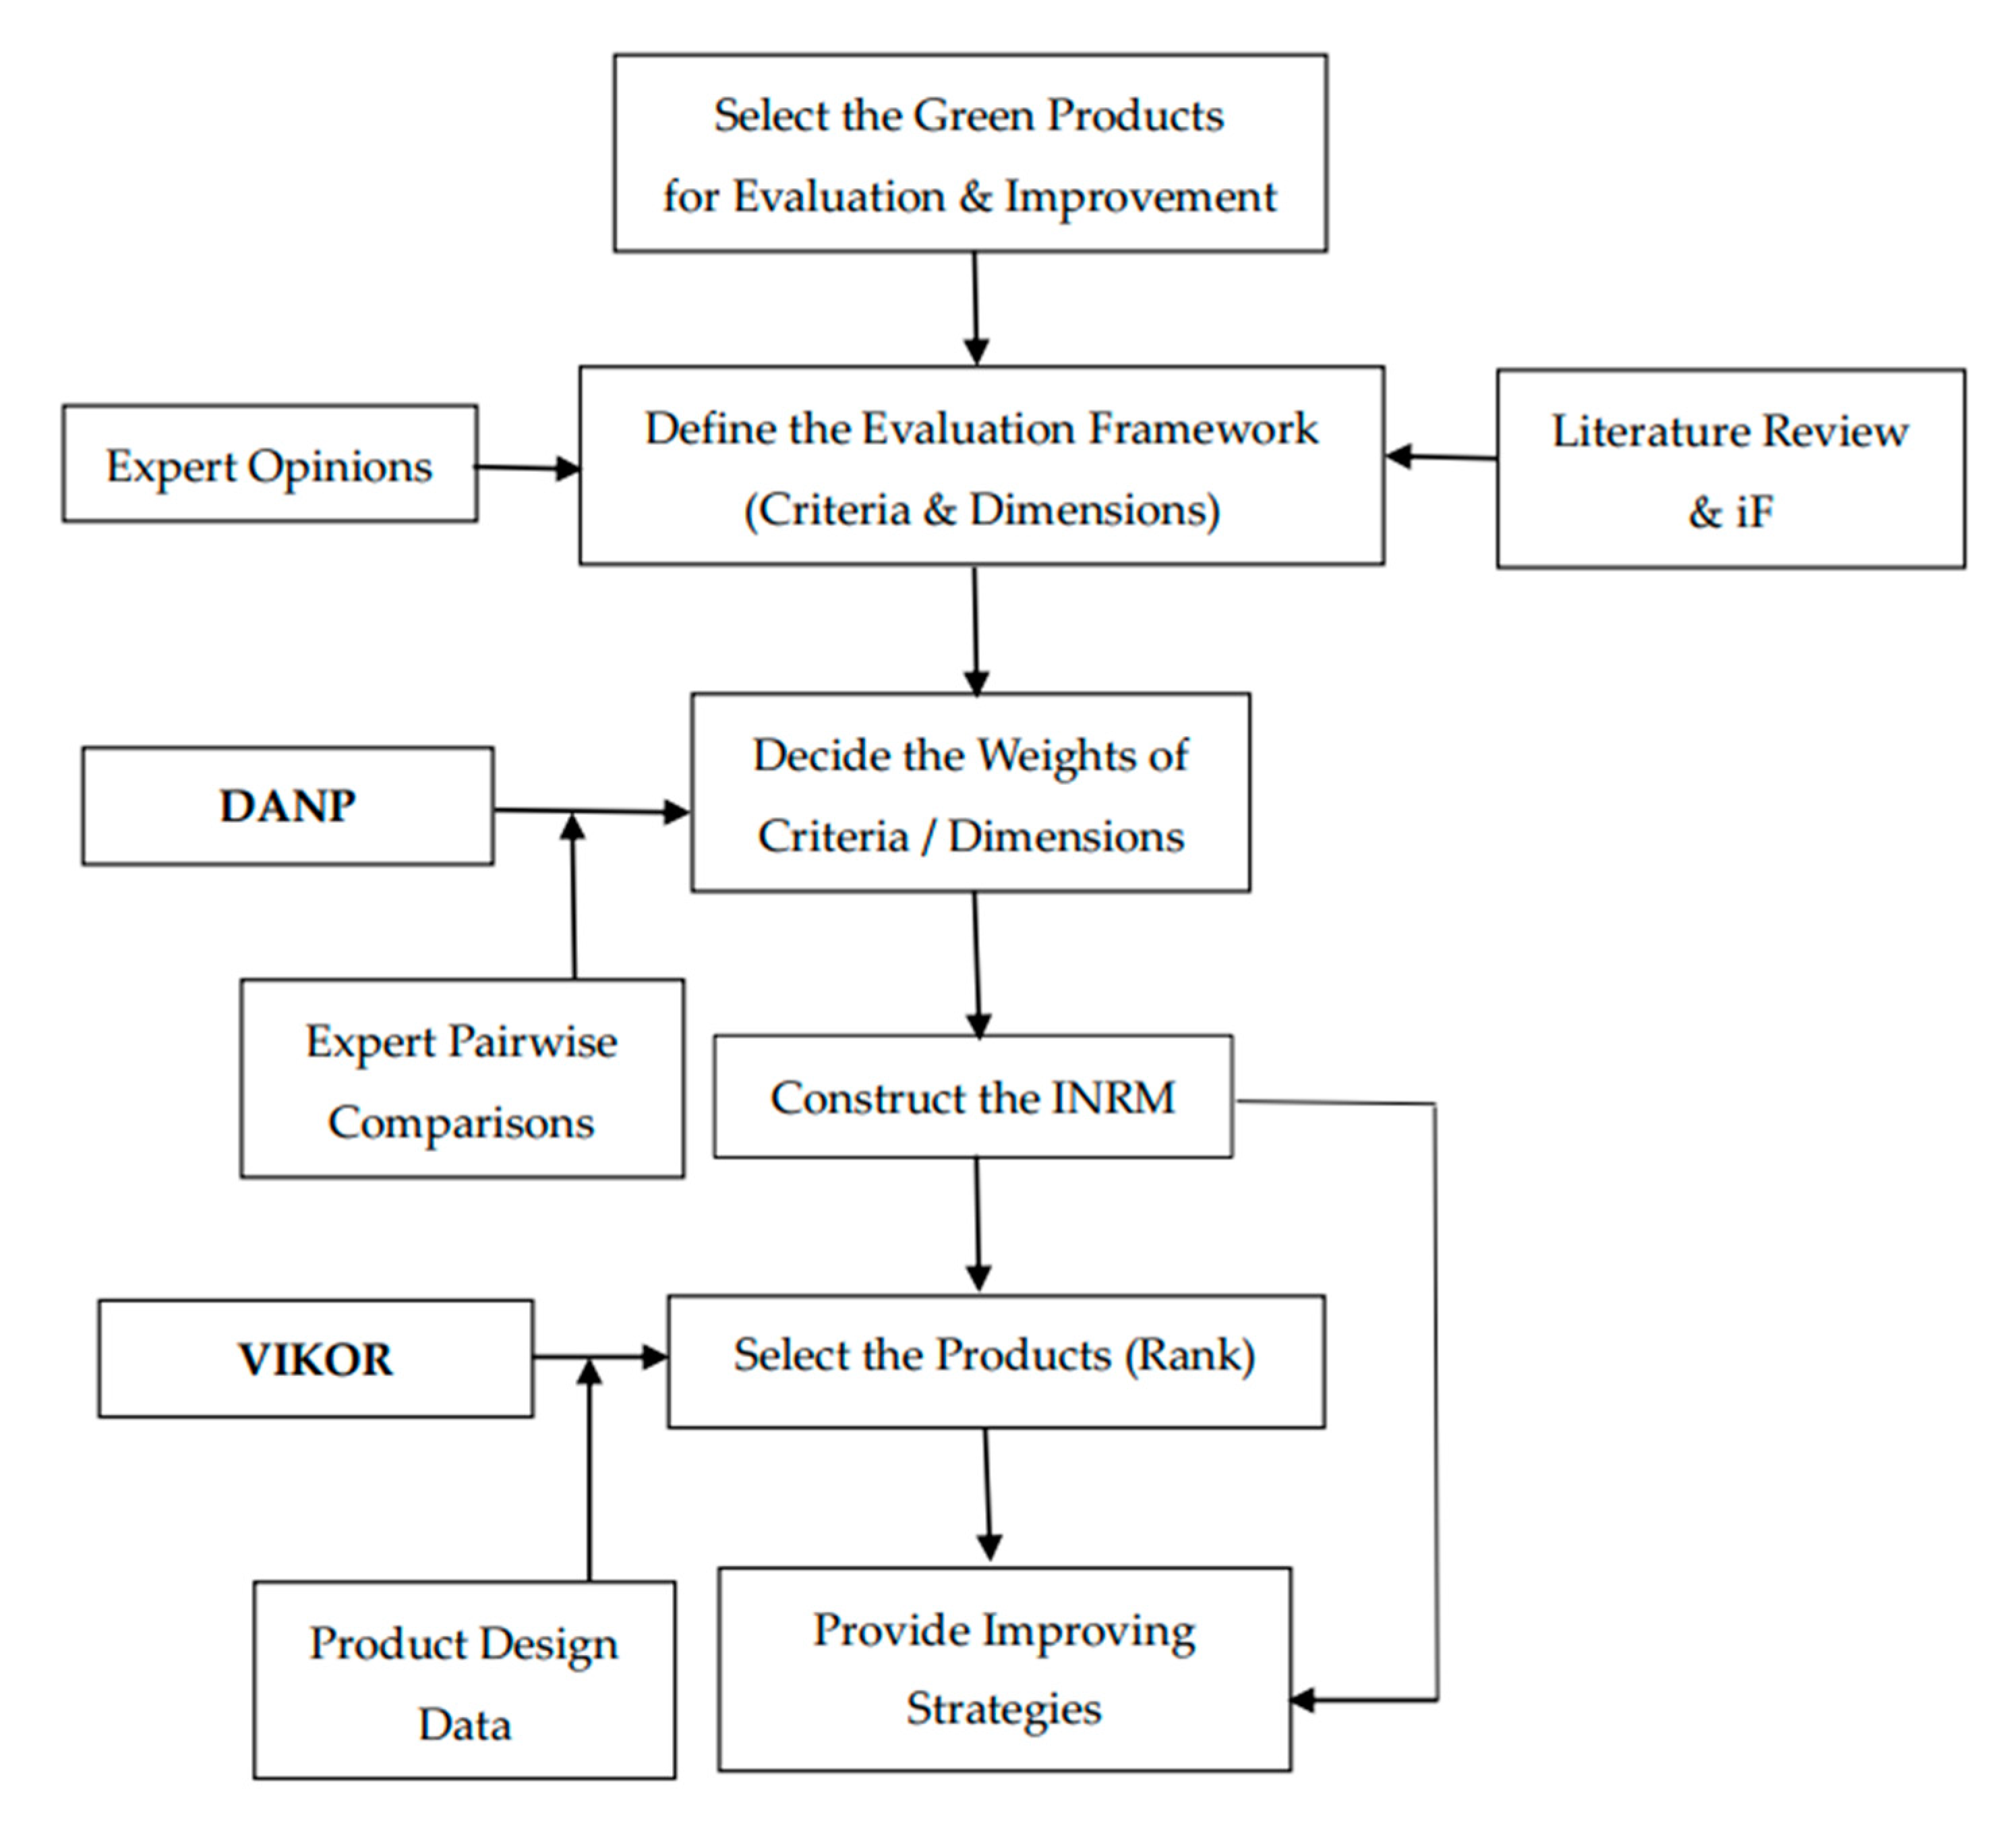
This study combines the iF DESIGN AWARD 2020 evaluation criteria and MADM model to establish a hybrid model with product design to assist managers/decision makers to evaluate product design solutions, then, selects the most suitable solution, and proposes causality relationship improvement strategies. First, we use the iF DESIGN AWARD 2020 evaluation criteria as the index system for this study (see Table 1). Then, the knowledge and experience of experts in the field of product design were collected through questionnaires, including the influence relationship among 19 criteria and the evaluation scores of three product design solutions. Through the DANP method, the causality structure and weights of the criteria are obtained. Finally, the VIKOR-AS method is used to obtain the gap between the actual evaluation score and the ideal level of each product design solution. Then, the solution with the smallest gap score from the ideal level is selected as the optimal solution. Furthermore, in each solution, the gap to the ideal level can be obtained in each criterion. Therefore, we can propose an improvement strategy with a causal influence relationship based on these criteria in the INRM. The research design and analysis process of the hybrid model are shown in Table 2 and Figure 1. First, the iF standards (attributes) are used as the evaluation framework. Then, the weights of the attributes and the INRM are derived from DANP. Finally, the VIKOR-AS is used to select the product designs and identify the gap between current design and aspiration level in each attribute.
3.2. DANP
Yang et al. [39] invented the DANP method in 2008. This method integrates DEMATEL and ANP methods, which avoids the assumption that each group/dimension has the same weight in the ANP method [40]. Therefore, the DANP method retains the interdependence among the criteria and further derives the INRM and influential weights of all the criteria. The INRM established through the DANP method can help to form a variety of systemic causal influential relationship decisions to improve the substitution/objective performance after evaluation. Because of its advantages, this method has been applied in many fields, such as green suppliers [41], information systems [22], teacher improvement [42], quality of life [43], design options [44], and critical infrastructure [45]. The detailed calculation steps of DANP are shown in Appendix A.
3.3. VIKOR-AS
Opricovic and Tzeng (2004) developed the original VIKOR method [13,46]. In the original VIKOR, the positive-ideal solution and negative-ideal solution of each criterion are defined as the highest score and the lowest score within the criteria, respectively. However, this definition cannot truly reflect the gap of each criterion to the aspiration-level. In order to solve this problem, some studies [47] combined the original VIKOR and aspiration-level concepts (called VIKOR-AS), that is, the highest and lowest scores of the scale are replaced by the positive-aspired solution and the negative-aspired solution, respectively. Therefore, this new method can effectively avoid the defects of the original VIKOR method. Because of its advantages, this method has been applied in many fields, such as aviation performance [48], airport performance [49]. The detailed calculation steps of VIKOR-AS are shown in Appendix B.
4. Empirical Case
Taiwan’s industrial development gradually changed from early OEM (Original Equipment Manufacturer) production to product design. This study uses an office furniture company in Taiwan as an empirical case, through the proposed hybrid model for the evaluation, selection, and improvement analysis of three product design solutions. The discussion of these results is presented at the end of this section.
4.1. Background Descriptions
The manufacturing industry in Asia has gone through the industrial evolution of OEM, ODM (Original Design Manufacturer), and OBM (Original Brand Manufacturer). In the past 10 years, with the globalization and specialization of division of labor, each enterprise has actively developed its own brand, which has caused fierce competition among brands. In addition, consumer demand for furniture has extended from the basic functionality of the tangible aspect to the overall atmosphere and feeling of the intangible aspect. Facing this situation, during the process of product design and development, Taiwanese furniture companies choose appropriate product design solutions as the leading role of new products, so as to develop a series of development strategies and decisions, and ultimately, reduce the risk of new product development. In the past, the actual situation was mainly based on the practical experience of some senior managers as the basis for decision-making, and there was no scientific decision-making method for the evaluation process of product design. This study uses a Taiwanese technology furniture company that is a leader in Taiwan’s office furniture industry as empirical example. Its main business is the development of technology furniture products, namely screen systems, work desk systems, and office desks and chairs. The case company wants to integrate iF international design competition indexes (Table 1, [9]) and MADM methodology to evaluate and improve three green product designs.
4.2. Influential Structure and Influential Weights
Based on the iF international design competition guidelines (Table 1, [9]), this study establishes the influential relationships among the criteria and the weights with the collection of expert practical experience through the DANP method. The 12 respondents/experts all have backgrounds in design-related majors, such as industrial design and product design. Currently, 5 are university professors and 7 are engaged in design-related positions. They all have 3 to 10 years of teaching or practical experience. Each expert and scholar used the five-scale Likert scale (0—no influence; 1—very low influence; 2—low influence; 3—high influence; 4—very high influence) to convert product design experience to direct influential matrix, and by means of averaging, the initial direct influential matrix representing the integrated experience of 12 experts is obtained as Table 3. The confidence level of the matrix is 95.22% (average gap is 4.78%).
Then, the direct relation matrix is normalized by Equations (A2) and (A3), and all the values are between 0 and 1. Finally, through Equation (A4), the degree of influential relationship among the criteria in the matrix is calculated to obtain the final degrees of total influential relationship, which is called the total influential relationship matrix (Table 4).
Through Equations (A5) and (A6), the affecting value and the affected value of each criterion in the total influential relationship matrix can be obtained. Further, the total influence degree and the net influence can be obtained. The detailed data are shown in Table 5.
In Table 5, from the perspective of , the values of functionality () and brand positioning () are obviously higher than other dimensions. The reason is that consumers meet their needs through products, so the functionality of products is the most basic element, and will also be affected by other factors. The functionality and brand positioning of a product also affect and relate to each other. Next, from the perspective of , the values of innovation () and corporate responsibility () are all positive. In other words, in the entire evaluation system, they are mainly the sources that affect other criteria. When a company gives priority to launching a product design, it must be an innovative product with originality and novelty, and each product follows the company’s corporate responsibility, including consideration of environmental standards/carbon footprint (C42) and social responsibility (C43). Besides, functionality (), aesthetics (), and brand positioning () all belong to the effected group. They are mainly affected by innovation () and corporate responsibility (). The products launched by enterprises under market competition are given priority in design and development with innovation () and corporate responsibility (). Therefore, the goal of product design in dimensions such as functionality (), aesthetics (), and brand positioning () must follow the dimensions of innovation () and corporate responsibility (), and then, be subject to the influence of practicability, (C23) spatial concept (C33), and target group fit (C52). Enterprise product development is mainly influenced significantly by innovation () and corporate responsibility (), which can be deemed as the causal dimensions. Therefore, paying attention to product design in these causal dimensions can affect the overall planning and improve design performance.
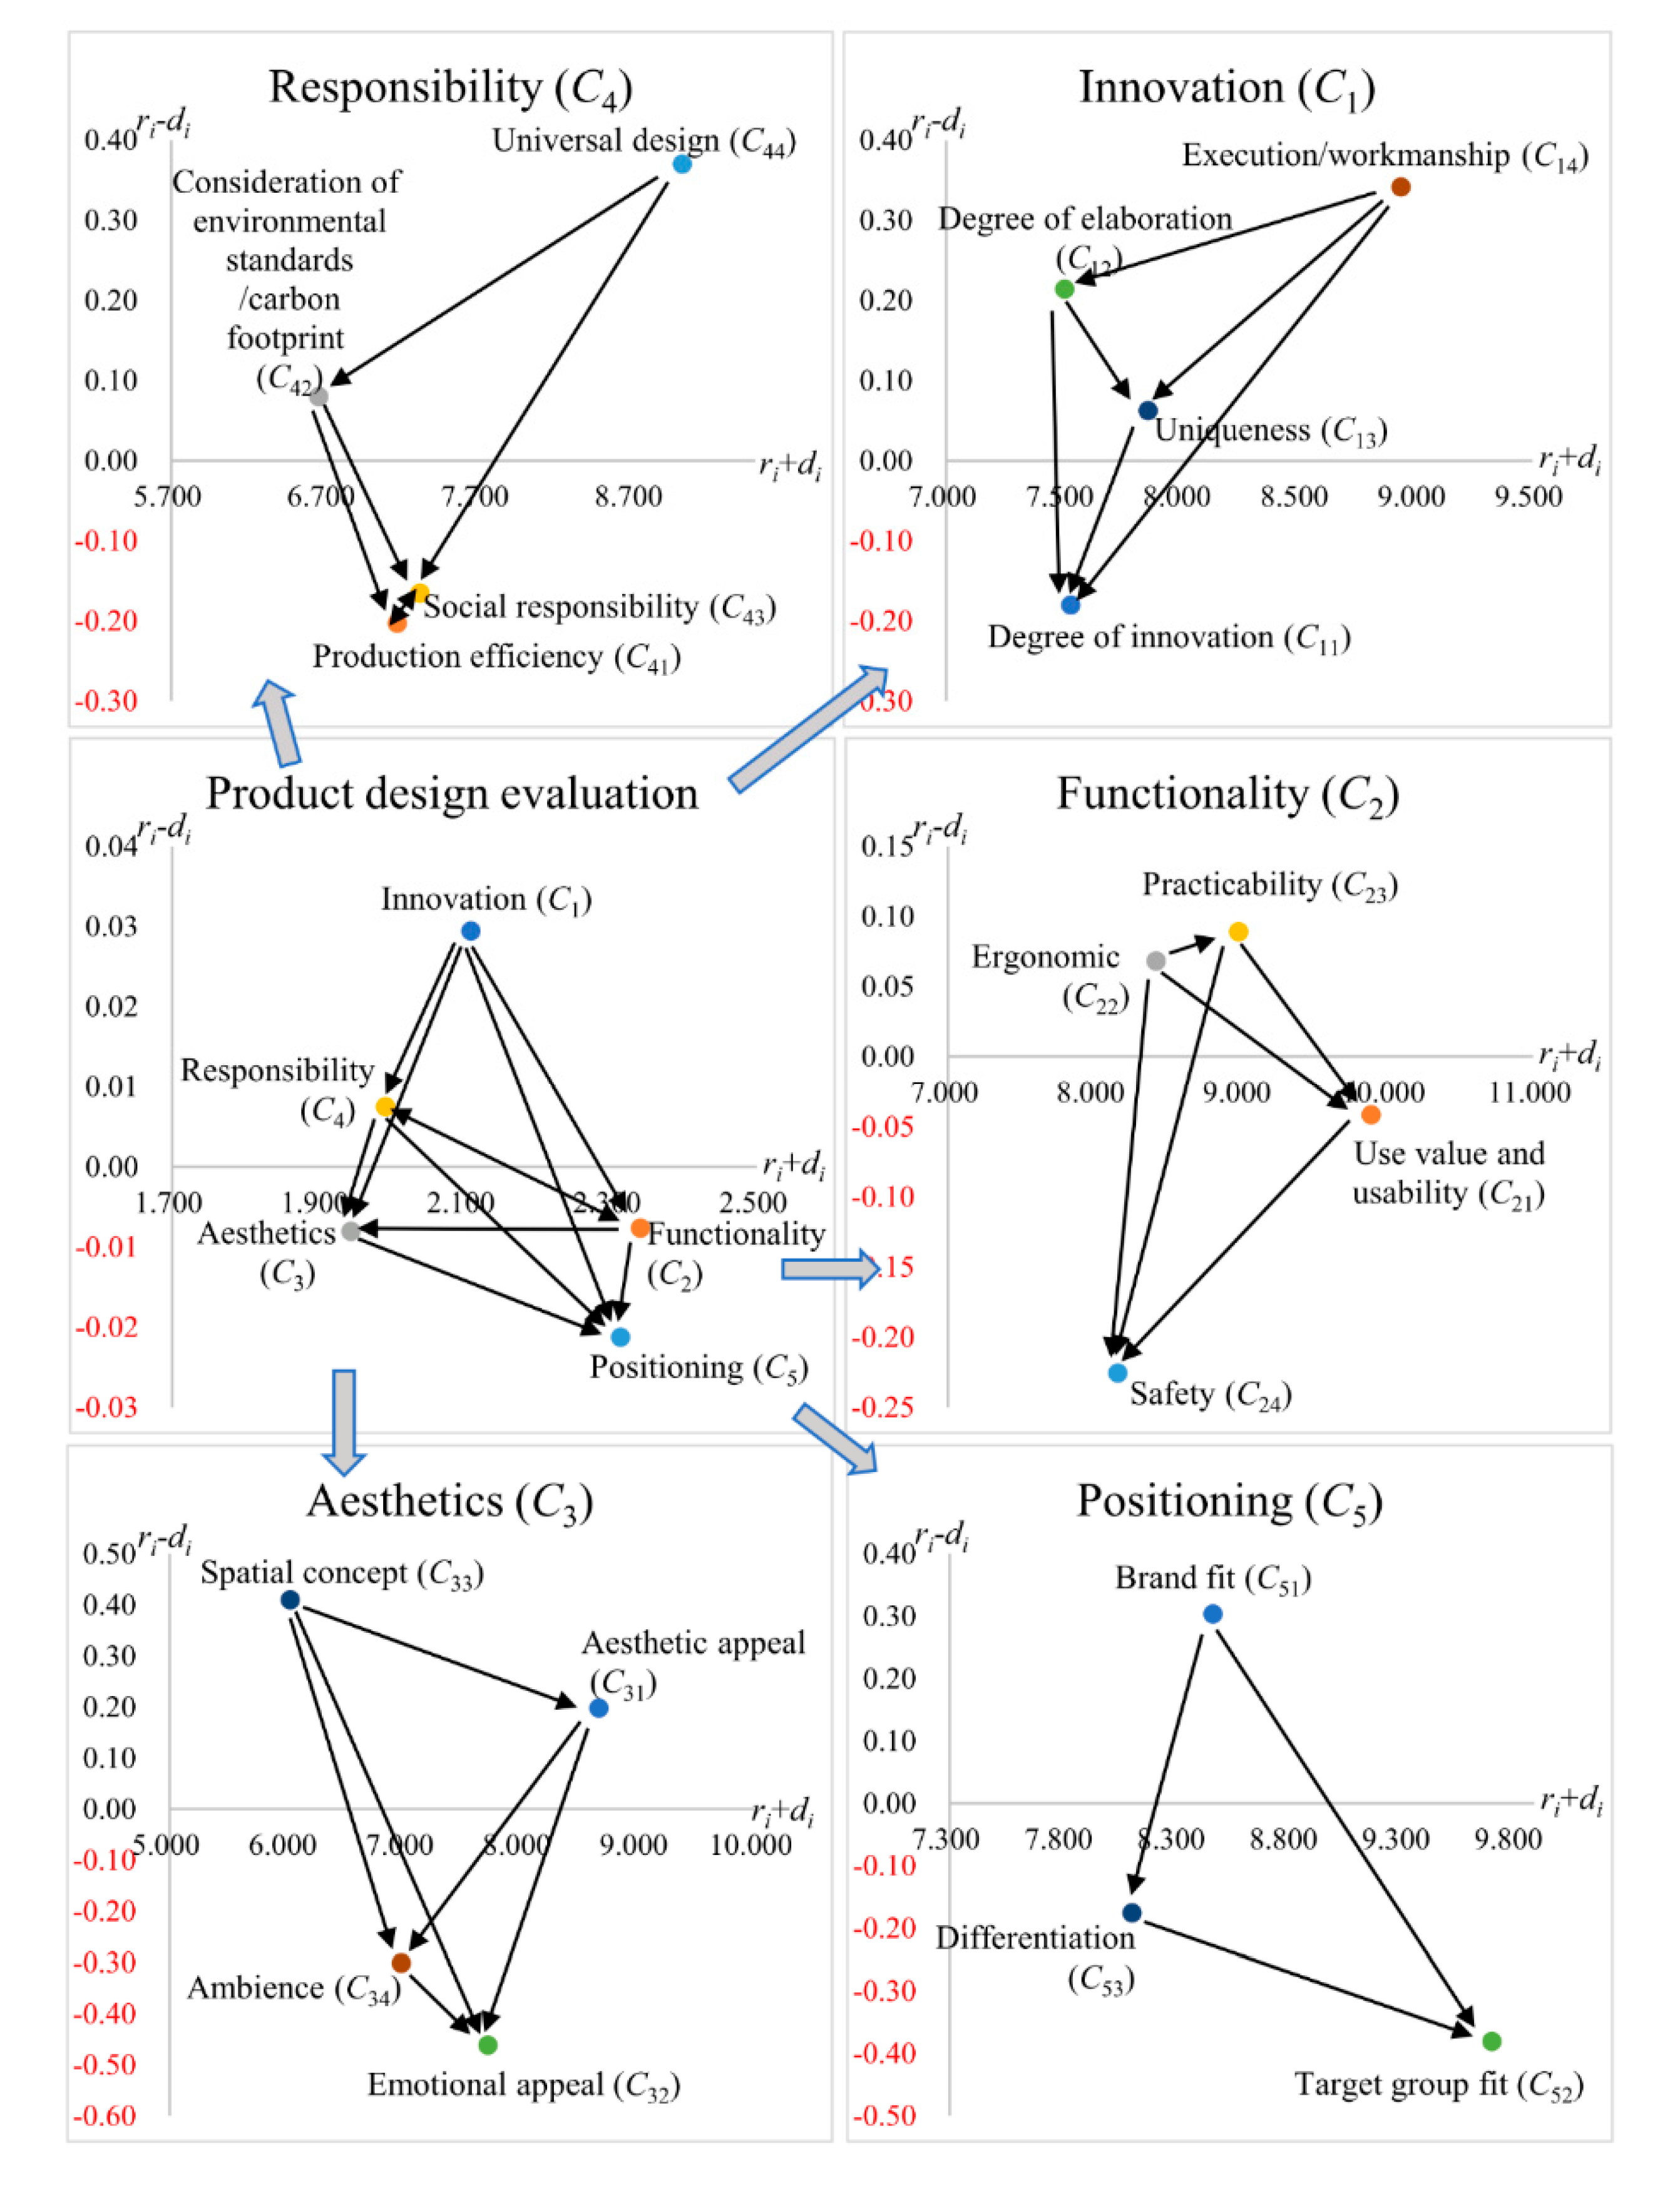
Next, through Table 5, the INRM of the iF DESIGN AWARD evaluation system can be obtained, as shown in Figure 2. From the dimension analysis (center left of Figure 2), the main dimension is innovation (), because it affects the other four dimensions. In practice, when facing product competition in the market for product design, companies usually first evaluate the risk of innovation and development, because this is the basis for the entire design and development of the entire product design. Next, under the innovation () dimension, execution/workmanship (C14) is a criterion that mainly affects other criteria. Enterprises are willing to invest resources related to manpower, material resources, time, and budget at the level of degree of elaboration (C12), uniqueness (C13), and degree of innovation (C11) to ensure that product innovation can be achieved. Under the functionality (C2) dimension, ergonomics (C22) and practicability (C23) are criteria that affect other criteria. Enterprises that provide consumers with practicability (C23) and ergonomics (C22) need to meet the functional value characteristics of use value and usability (C21), and safety (C24), which is the most fundamental. Under the aesthetics (C3) dimension, spatial concept (C33) is a criterion that affects other criteria. A good product design requires aesthetics (C31) and emotional appeal (C32) to shape the aesthetic atmosphere of the product’s spatial concept (C33). Under the responsibility (C4) dimension, universal design (C44) is a criterion that affects other criteria. A good universal design (C44) specification can ensure the maximum benefit and efficiency during production and product delivery. The last dimension positioning (C5), brand fit (C51) is the main influence criterion, the reason is to set the target group fit (C52), and the strategy of differentiation (C53) design, in order to achieve brand positioning consistency of consumer and brand fit (C51).
In addition, the influential weight of each dimension and criterion can be obtained respectively from the total influential relationship matrix through Equations (A7) to (A12). The detailed data are shown in Table 6. From Table 6, the top three with the highest influential weights are functionality (C2), positioning (C5) and innovation (C1). Among them, functionality (C2) is ranked first; the main reason is that if the product design of an enterprise is based on brand positioning (C5), innovation (C1), corporate responsibility (C4), and aesthetics (C3), then, the results will be reflected in the determination of the product’s functionality (C2), which is also the key factor for consumers to choose products and is also the most basic element. Next, the criteria for the highest influential weight under each dimension are: (1) Execution/workmanship (C14). In terms of execution methods and auditing, it is most important to effectively evaluate the performance of development and design. (2) Use value and usability (C21), which can show the features of product functions. (3) Aesthetic appeal (C31), which is a product design necessary for aesthetics. (4) Universal design (C44); the principle and degree of universal design applied in product design can show the company’s responsibility. (5) Target group fit (C52); the scope and setting of the target group (C52) is to confirm the accuracy of the brand positioning of the product design.
4.3. Product Design Alternative Evaluation Using the VIKOR-AS Method
Based on the influential weights of the criteria established above, this section describes the three green product designs through the VIKOR-AS method to obtain the ideal gap score for each solution and the overall gap score. The three designs are working tables with special functions and green concepts, which can be used in the design thinking activities. First, each product design solution defines the positive-aspired solution and negative-aspired solution of each criterion through Equations (A13) and (A14). Then, the overall utility value and the maximum regret value of each product design solution are established through Equations (A15) and (A16), and the final value is established using Equation (A17). From the gap analysis (Table 7), product design solution has the highest ranking (smallest gap = 0.511); product design solution has the lowest ranking (largest gap = 0.547). Therefore, the best green product design is . Comparing the current results with the original VIKOR method, it indicates that product design solution is the best choice with many zero gaps. This result will mislead that product design solution is a perfect design. In fact, there are still some gaps to reach the aspiration levels in several criteria. However, the VIKOR-AS method can avoid this problem and truly reflect the real situations. In addition, this study also uses several common MADM methods to compare the ranking of these alternatives. The results show that the solution ranking of the six methods is consistent (Table 8).
4.4. Discussion
This study proposes a hybrid model, which integrates iF DESIGN AWARD evaluation criteria and MADM methods. The former can effectively measure the actual situation; the latter can effectively establish a decision model of influential relationship. From the perspective of practical application and management decision-making, this model has a good practical value and modeling foundation, and can effectively provide good academic and practical value for product design issues. From the analysis of the results of VIKOR-AS, product design solution is the best choice, because among all other solutions, only this one simultaneously considers the overall utility maximum value and the minimum regret value . In other words, it is the product design solution that is closest to the aspiration level. In addition to assisting decision makers in choosing the most suitable product design solution, the model can also assist decision makers or designers to further improve other design solutions through the INRM. Take product design solution as an example. In this solution, the dimension with the largest gap (i.e., the largest regret value ) is “innovation (C1) (gap = 0.551)”; however, further analysis from the INRM shows that it is the main influence source of the entire evaluation system. Among criteria of innovation (C1), “Execution/workmanship (C14)” is the criterion with the largest gap (gap = 0.608), and it is also the most important influential criterion in the entire subsystem. Based on the above analysis, if the product design dimension is to be improved, decision makers and designers need to invest resources and corresponding improvement strategies from “Execution/workmanship (C14)”. In practice, decision makers and designers should have enforceable “Execution/workmanship” for innovative product design. For example, first, a product design project plan should be established, and the scope of innovation should be clearly defined in the plan, which includes manpower, material resources, schedule, budget, inter-departmental and other related resources. Besides, the plan should also incorporate the precise equipment for the planning and production of furniture, strict control of technical processing, selection of materials that meet the environmental protection standard carbon footprint, and the materials that can be recycled, such as wood, metal, and glass. In practice, the decision maker will choose the best product design solution from all product design solutions. For a poor solution, an improvement proposal is made based on the poorer performance criterion, and the causal relationship between the dimensions or criteria will be neglected. Therefore, the decision maker or designer often encounters the decision-making problem of “choose good apples from rotten apples” [20] and “treat symptoms but not the disease” [21,22]. However, the proposed model can effectively assist decision makers and designers to avoid these two major decision problems through a scientific modeling process.
5. Conclusions and Remarks
With the rapid changes in global markets and consumer preferences, the life cycle of product development is getting shorter [50], and product design is one of the key elements. The company can be used as a benchmark for practicing good design through international design competitions [51], and the impact of effective product design on the company’s market brand value [52]. Whether they are consumers, designers, or companies, it is a three-way winner product evaluation method. This study takes a Taiwanese office furniture company as an empirical case to demonstrate the MADM model based on iF DESIGN AWARD evaluation criteria, which includes the modeling process, result analysis, and improvement strategies. The results and analysis of each stage are as follows:
From the results and analysis of INRM, innovation (), execution/workmanship (C14), practicability (C23), spatial concept (C33), universal design (C4) and brand fit (C51) are causal which affect other dimensions or criteria. In practice, these attributes also illustrate that when designers in a company conduct product design, each design and development link is relevant. The product development plan is a blueprint for the entire development process. innovation () and execution/workmanship () will affect the strategy and methods of product manager leadership and management design. In addition, the ranking of the influential weights are execution/workmanship (), use value and availability (), aesthetic appeal (), universal design (), and target group fit (). Some contributions are summarized as follows:
- Functionality (C2) and target group fit (C52) are the attributes with the highest influential weights, respectively. Functionality (C2) is one of the most important factors in the entire product design process. When an enterprise designs a product, it must determine the target group for product sales and think about the functions and characteristics of the product based on the group.
- Through the analysis of the VIKOR-AS method, product design solution is the best choice, because among all other solutions, only this one simultaneously presents the best utility value and the minimum regret. In other words, it is the product design solution that is closest to the aspiration level.
- The results of the integration of the INRM (Figure 2) and the solution gap (Table 6) can assist in suggesting improvements that have a causal impact on product design solutions. Therefore, decision makers can invest resources and corresponding improvement strategies in the causal attributes that would further improve the performance of the entire product design.
The results of this study are limited to the empirical case company, because different types of product designs may have different weights and corresponding solution performance scores. In addition, this study does not take into account the uncertainty phenomenon in the process of experts’ survey; therefore, future research models can combine fuzzy theory, gray system, and rough set theory to establish various decision-making models, and provide more academic and practical values on the issue of green product design.
Author Contributions
C.-C.C. collected data and wrote the first draft of the thesis. Y.-C.C. designed the research and assisted in decision-making modeling and calculation. T.-L.C. and J.J.H.L. co-authored and revised the paper. All authors have read and agreed to the published version of the manuscript.
Funding
The study did not receive any external funding.
Acknowledgments
The authors are very grateful to the reviewers for their valuable comments on improving the quality of this article.
Conflicts of Interest
All authors declare that they have no conflicts of interest.
Appendix A. The DEMATEL and DANP Method
Step 1: Obtaining the direct influential relationship matrix among criteria.
The experts used pairwise comparison and a set of Likert 5-scale scales (from no influence (0) to very high influence (4)) to propose the direct influential relationship of attribute i to attribute j. Then, the direct influential relationship matrix of each expert is integrated into a direct influential relationship matrix representing the experience of all experts in an average manner.
where the values in the matrix are between 0 and 4, the values on the diagonal are 0, and is the number of criteria.
Step 2: Establishing the boundary range of the direct influential matrix.
Then, the adjustment coefficient is found through the maximum value of the row or column in the matrix . With this adjustment coefficient, the influence range/boundary of the entire direct influential relationship matrix is established. Finally, a normalized direct influential relationship matrix is obtained, as shown in Equations (A2) and (A3).
where the values in the matrix are between 0–1, the values on the diagonal are 0, and the maximum value of the sum of the rows or columns is 1.
Step 3: Calculating the total influential matrix.
Within the range of the direct influential relationship matrix after normalization, through the concept and calculation process of the Markov chain, the degree of mutual influence among the elements is calculated, including the degree of direct and indirect influence, as shown in Equation (A4).
where the matrix is the identity matrix.
Step 4: Establishing an influential network relationship map (INRM).
The rows and columns of the total influential relationship matrix are summed separately, that is, the total affecting value () and total affected value () of each criterion can be obtained, as shown in Equations (A5) and (A6).
where is the transposition action. represents the total influence value that the criterion affects other criteria (including itself). represents the total influence value that the criterion is affected by other criteria (including itself).
Then, the total affecting value and total affected value of each criterion can be obtained through Equations (A7) and (A8), and then, the total influence degree and net influence property of the criterion can be obtained. The influence degree represents the degree of influence of the criterion in the entire evaluation system. The larger the value, the higher the degree of correlation between the criterion and all other criteria. On the other hand, the value of net influence property can be divided into three cases. First, when the value > 0, it means that this criterion mainly affects other criteria, i.e., it belongs to the group of causal. Second, when the value < 0, it means that this criterion is mainly affected by other criteria, i.e., it belongs to the effected group. The other case is special. The value close to 0 means that the net influence property of this criterion is less significant. Finally, the total influence degree is taken as the x-axis; the net influence property is taken as the y-axis, which can visualize the overall influence relationship structure of all the criteria in the evaluation system, called the INRM.
Step 5: Converting the total influential relationship matrix to an unweighted super matrix.
In this step, the value of the total influence relationship matrix is combined with the set of weights, called influential weights, through the calculation process of ANP. First, the evaluation system-based framework is a hierarchical structure, and the total influential relationship matrix can be divided into matrices at the dimension level and matrices at the criterion level. Then, the matrices at the criterion level can be transferred to an unweighted super matrix through Equations (A7) to (A9).
where can be obtained through Equation (A8); then, by repeating the same calculation method, other submatrices (i.e., ) can be obtained.
where .
Finally, after completing the normalization of the total influential relationship matrix of the entire criterion level, and then, performing the transposed, it becomes an unweighted super matrix, as shown in Equation (A9).
Step 6: Establishing a weighted super matrix.
The matrix at the dimension level can be normalized to obtain a normalized matrix , as shown in Equation (A10).
where and .
A normalized matrix then performs the transposition action , which becomes a weighted super matrix, as shown in Equation (A11).
Step 7: Obtaining the ultimate super matrix.
The limit super matrix is based on the concept of Markov chains. By multiplying itself multiple times, it will eventually converge to a stable state, which is called a limit super matrix, where the values in each row represent the influential weights of the criteria, as shown in Equation (A12).
Appendix B. The VIKOR-AS Method
Step 8: Defining the positive-aspired and negative-aspired solutions of the criteria.
In this study, the performance measurement scale of each criterion ranges from 0 to 10 from the lowest to the highest. The positive-aspired solution score is set to 10 points; the negative-aspired solution score is set to 0 points, as shown in Equations (A13) and (A14).
Positive-aspired solution (aspiration level):
Negative-aspired solution (worst level):
Step 9: Obtaining the utility values and maximum regret values of the solutions.
For each solution, the utility value and maximum regret value can be obtained through Equations (A15) and (A16). It uses the definition and concept of and , respectively.
Utility value:
Maximum regret value:
where is the general utility value of the solution, is the maximum regret value of the solution, k is the number of solutions, is the weight, and DANP’s influence weight is used here.
where is the decision coefficient, and generally speaking, it is set to 0.5, which is to have the maximum utility and the minimum individual regret.
References
- Yeh, T.M.; Pai, F.Y.; Liao, C.W. Using a hybrid MCDM methodology to identify critical factors in new product development. Neural Comput. Appl. 2014, 24, 957–971. [Google Scholar] [CrossRef]
- Baxter, M. Product Design: A Practical Guide to Systematic Methods of New Product Development; Chapman & Hall: London, UK, 1995. [Google Scholar]
- Saranga, H.; George, R.; Beine, J.; Arnold, U. Resource configurations, product development capability, and competitive advantage: An empirical analysis of their evolution. J. Bus. Res. 2018, 85, 32–50. [Google Scholar] [CrossRef]
- Alizon, F.; Shooter, S.B.; Simpson, T.W. Improving an existing product family based on commonality/diversity, modularity, and cost. Des. Stud. 2007, 28, 387–409. [Google Scholar] [CrossRef]
- Kedia, B.L.; Mukherjee, D. Understanding offshoring: A research framework based on disintegration, location and externalization advantages. J. World Bus. 2009, 44, 250–261. [Google Scholar] [CrossRef]
- Roy, R.; Riedel, J.C.K.H. Design and innovation in successful product competition. Technovation 1997, 17, 537–594. [Google Scholar] [CrossRef] [Green Version]
- Boothroyd, G. Product design for manufacture and assembly. Comput. Aided Des. 1994, 26, 505–520. [Google Scholar] [CrossRef]
- Ceschin, F.; Gaziulusoy, I. Evolution of design for sustainability: From product design to design for system innovations and transitions. Des. Stud. 2016, 47, 118–163. [Google Scholar] [CrossRef]
- iF. iF World Design Guide. Available online: https://ifworlddesignguide.com/ (accessed on 8 May 2020).
- Reddot. Red Dot Award: Design Concept ABOUT. Available online: https://www.red-dot.org/design-concept/about/?gclid=cj0kcqjwhtt1brciarisagly51jlxtcjygygjafjpxmdssnfuukchd-_olwqxe8h06-jzc97beh608gaatjtealw_wcb (accessed on 8 May 2020).
- Design, G. About Good Design Award. Available online: https://www.g-mark.org/about/?locale=zh_TW (accessed on 8 May 2020).
- IDSA. About IDSA. Available online: https://www.idsa.org/about-idsa (accessed on 8 May 2020).
- Opricovic, S.; Tzeng, G.H. Compromise solution by MCDM methods: A comparative analysis of VIKOR and TOPSIS. Eur. J. Oper. Res. 2004, 156, 445–455. [Google Scholar] [CrossRef]
- Geng, X.; Chu, X.; Zhang, Z. A new integrated design concept evaluation approach based on vague sets. Expert Syst. Appl. 2010, 37, 6629–6638. [Google Scholar] [CrossRef]
- Zaim, S.; Sevkli, M.; Camgöz-Akdağ, H.; Demirel, O.F.; Yayla, Y.A.; Delen, D. Use of ANP weighted crisp and fuzzy QFD for product development. Expert Syst. Appl. 2014, 41, 4464–4474. [Google Scholar] [CrossRef]
- Zhu, G.N.; Hu, J.; Qi, J.; Gu, C.C.; Peng, Y.H. An integrated AHP and VIKOR for design concept evaluation based on rough number. Adv. Eng. Inform. 2015, 29, 408–418. [Google Scholar] [CrossRef]
- Shidpour, H.; Cunha, C.D.; Bernard, A. Group multi-criteria design concept evaluation using combined rough set theory and fuzzy set theory. Expert Syst. Appl. 2016, 64, 633–644. [Google Scholar] [CrossRef]
- Ayag, Z. An integrated approach to concept evaluation in a new product development. J. Intell. Manuf. 2016, 27, 991–1005. [Google Scholar] [CrossRef]
- Pourhejazy, P.; Sarkis, J.; Zhu, Q. A fuzzy-based decision aid method for product deletion of fast moving consumer goods. Expert Syst. Appl. 2019, 119, 272–288. [Google Scholar] [CrossRef]
- Tang, T.L.P.; Chen, Y.J.; Sutarso, T. Bad apples in bad (business) barrels: The love of money, machiavellianism, risk tolerance, and unethical behavior. Manag. Decis. 2008, 46, 243–263. [Google Scholar] [CrossRef]
- Zhu, B.W.; Huang, Z.; Xiong, L. Application of the Kano Model and DEMATEL Technique to Explore Sustainable Promotion Strategies for Thai-Chinese Temples as Tourist Attractions. Religions 2020, 11, 199. [Google Scholar] [CrossRef] [Green Version]
- Shao, Q.G.; Weng, S.S.; Liou, J.J.H.; Chuang, Y.C. A rough hybrid multicriteria decision-making model for improving the quality of a research information system. Symmetry 2019, 11, 1248. [Google Scholar] [CrossRef] [Green Version]
- Mohanty, P.P.; Mahapatra, S.S.; Mohanty, A.; Sthitapragyan. A novel multi-attribute decision making approach for selection of appropriate product conforming ergonomic considerations. Oper. Res. Perspect. 2018, 5, 82–93. [Google Scholar] [CrossRef]
- Aghajani Bazzazi, A.; Osanloo, M.; Karimi, B. Deriving preference order of open pit mines equipment through MADM methods: Application of modified VIKOR method. Expert Syst. Appl. 2011, 38, 2550–2556. [Google Scholar] [CrossRef]
- Gao, Y.; Liu, Z.; Hu, D.; Zhang, L.; Gu, G. Selection of green product design scheme based on multi-attribute decision-making method. Int. J. Sustain. Eng. 2010, 3, 277–291. [Google Scholar] [CrossRef]
- Ying, C.S.; Li, Y.L.; Chin, K.S.; Yang, H.T.; Xu, J. A new product development concept selection approach based on cumulative prospect theory and hybrid-information MADM. Comput. Ind. Eng. 2018, 122, 251–261. [Google Scholar] [CrossRef]
- Chen, C.T. Extensions of the TOPSIS for group decision-making under fuzzy environment. Fuzzy Sets Syst. 2000, 114, 1–9. [Google Scholar] [CrossRef]
- Chen, C.T.; Lin, C.T.; Huang, S.F. A fuzzy approach for supplier evaluation and selection in supply chain Management. Int. J. Prod. Econ. 2006, 102, 289–301. [Google Scholar] [CrossRef]
- Girubha, R.J.; Vinodh, S. Application of fuzzy VIKOR and environmental impact analysis for material selection of an automotive component. Mater. Des. 2012, 37, 478–486. [Google Scholar] [CrossRef]
- Zavadskas, E.K.; Bausys, R.; Stanujkic, D.; Magdalinovic-Kalinovic, M. Selection of lead-zinc flotation circuit design by applying WASPAS method with single-valued neutrosophic set. Acta Montan. Slovaca 2016, 21, 85–92. [Google Scholar]
- Ma, M.Y.; Chen, C.Y.; Wu, F.G. A design decision-making support model for customized product color combination. Comput. Ind. 2007, 58, 504–518. [Google Scholar] [CrossRef]
- Olabanji, O.M.; Mpofu, K. Hybridized fuzzy analytic hierarchy process and fuzzy weighted average for identifying optimal design concept. Heliyon 2020, 6, e03182. [Google Scholar] [CrossRef] [Green Version]
- Feng, Y.; Hong, Z.; Tian, G.; Li, Z.; Tan, J.; Hu, H. Environmentally friendly MCDM of reliability-based product optimisation combining DEMATEL-based ANP, interval uncertainty and Vlse Kriterijumska Optimizacija Kompromisno Resenje (VIKOR). Inf. Sci. 2018, 442–443, 128–144. [Google Scholar] [CrossRef]
- Tiwari, V.; Jain, P.K.; Tandon, P. Product design concept evaluation using rough sets and VIKOR method. Adv. Eng. Inform. 2016, 30, 16–25. [Google Scholar] [CrossRef]
- Wu, Y.; Zhou, F.; Kong, J. Innovative design approach for product design based on TRIZ, AD, fuzzy and Grey relational analysis. Comput. Ind. Eng. 2020, 140, 106276. [Google Scholar] [CrossRef]
- Wang, Z.; Zhang, S.; Qiu, L.; Gu, Y.; Zhou, H. A low-carbon-orient product design schemes MCDM method hybridizing interval hesitant fuzzy set entropy theory and coupling network analysis. Soft Comput. A Fusion Found. Methodol. Appl. 2020, 24, 5389–5408. [Google Scholar] [CrossRef]
- Jing, L.; Peng, X.; Li, J.; Wang, J.; Jiang, S. A decision approach with multiple interactive qualitative objectives for product conceptual schemes based on noncooperative-cooperative game theory. Adv. Eng. Inform. 2018, 38, 581–592. [Google Scholar] [CrossRef]
- Hsieh, H.N.; Chen, J.F.; Do, Q.H. A creative research based on DANP and TRIZ for an innovative cover shape design of machine tools. J. Eng. Des. 2017, 28, 77–99. [Google Scholar] [CrossRef]
- Yang, Y.P.O.; Shieh, H.M.; Leu, J.D.; Tzeng, G.H. A novel hybrid MCDM model combined with DEMATEL and ANP with applications. Int. J. Oper. Res. 2008, 5, 160–168. [Google Scholar]
- Chuang, Y.C.; Hu, S.K.; Liou, J.J.H.; Lo, H.W. Building a Decision Dashboard for Improving Green Supply Chain Management. Int. J. Inf. Technol. Decis. Mak. 2018, 17, 1363–1398. [Google Scholar] [CrossRef]
- Liou, J.J.H.; Chuang, Y.C.; Zavadskas, E.K.; Tzeng, G.H. Data-driven hybrid multiple attribute decision-making model for green supplier evaluation and performance improvement. J. Clean. Prod. 2019, 241, 118321. [Google Scholar] [CrossRef]
- Weng, S.S.; Liu, Y.; Chuang, Y.C. Reform of Chinese Universities in the Context of Sustainable Development: Teacher Evaluation and Improvement Based on Hybrid Multiple Criteria Decision-Making Model. Sustainability 2019, 11, 5471. [Google Scholar] [CrossRef] [Green Version]
- Feng, I.M.; Chen, J.H.; Zhu, B.W.; Xiong, L. Assessment of and Improvement Strategies for the Housing of Healthy Elderly: Improving Quality of Life. Sustainability 2018, 10, 722. [Google Scholar] [CrossRef] [Green Version]
- Xiong, L.; Li, Y.Q.; Teng, C.L.; Lee, Y.Z.; Liu, K.; Zhu, B.W. A qualitative-quantitative evaluation model for systematical improving the creativity of students’ design scheme. Sustainability 2019, 11, 2792. [Google Scholar] [CrossRef] [Green Version]
- Lo, H.W.; Liou, J.J.H.; Huang, C.N.; Chuang, Y.C.; Tzeng, G.H. A new soft computing approach for analyzing the influential relationships of critical infrastructures. Int. J. Crit. Infrastruct. Prot. 2020, 28, 100336. [Google Scholar] [CrossRef]
- Opricovic, S. Multicriteria optimization of civil engineering systems. Fac. Civ. Eng. Belgrade 1998, 2, 5–21. [Google Scholar]
- Hsu, C.C.; Liou, J.J.H.; Lo, H.W.; Wang, Y.C. Using a hybrid method for evaluating and improving the service quality of public bike-sharing systems. J. Clean. Prod. 2018, 202, 1131–1144. [Google Scholar] [CrossRef]
- Gudiel Pineda, P.J.; Liou, J.J.H.; Hsu, C.C.; Chuang, Y.C. An integrated MCDM model for improving airline operational and financial performance. J. Air Transp. Manag. 2018, 68, 103–117. [Google Scholar] [CrossRef]
- Lu, M.T.; Hsu, C.C.; Liou, J.J.H.; Lo, H.W. A hybrid MCDM and sustainability-balanced scorecard model to establish sustainable performance evaluation for international airports. J. Air Transp. Manag. 2018, 71, 9–19. [Google Scholar] [CrossRef]
- Bakker, C.; Wang, F.; Huisman, J.; den Hollander, M. Products that go round: Exploring product life extension through design. J. Clean. Prod. 2014, 69, 10–16. [Google Scholar] [CrossRef]
- Temple, P.; Swann, P. Competitions and Competitiveness: The Case of British Design Awards. Bus. Strategy Rev. 1995, 6, 41–52. [Google Scholar] [CrossRef]
- Xia, Y.; Singhal, V.R.; Peter Zhang, G. Product Design Awards and The Market Value of The Firm. Prod. Oper. Manag. 2016, 25, 1038–1055. [Google Scholar] [CrossRef]
Figure 1.
Modeling framework and processes of the hybrid multi-attribute decision model.

Figure 2.
Influential network-relation map (INRM).


Table 1.
iF DESIGN AWARD evaluation criteria.
| Dimension | Criteria | Description |
|---|---|---|
| Innovation (C1) | Degree of innovation (C11) | Including the novelty of product features in design, such as new technologies, new shapes, new materials, new functions, etc. |
| Degree of elaboration (C12) | The texture of the overall design of the product and the exquisiteness and standardization of the surface treatment of the material, such as product design specifications/regulations. | |
| Uniqueness (C13) | The uniqueness or particularity of innovation in product design, such as function of use, experience interaction, and innovative learning. | |
| Execution/workmanship (C14) | The customers’ perception on overall implementation completion of product design and development, such as well-placed process. | |
| Functionality (C2) | Use value and usability (C21) | Customers’ perception on the value of product usage and usability, such as multi-function and learning atmosphere. |
| Ergonomics (C22) | Avoid the state of feeling danger, risk, and damage in product designing, and conform to human factors and comfort functions. | |
| Practicability (C23) | Customer’s practical operation function of the product, such as discussion and interaction, presentation activities. | |
| Safety (C24) | Protection and defense of personal safety and avoiding dangers, risks, and injuries are essential, with the satisfaction degree of security function. | |
| Aesthetics (C3) | Aesthetic appeal (C31) | Customers’ preference for the aesthetic design of the company’s products, such as providing the perfect delight to the eye. |
| Emotional appeal (C32) | Customers’ enjoyment of emotional resonance with company product design. | |
| Spatial concept (C33) | In the sense of space, improve customers’ perception of the product in the environment. | |
| Ambience (C34) | Customers are attracted by product aesthetics and atmosphere. | |
| Responsibility (C4) | Production efficiency (C41) | In the use of resources, improve production efficiency, such as time, material, or labor. |
| Consideration of environmental standards/carbon footprint (C42) | In terms of product design, follow environmental protection standards and regulations to reduce carbon emissions. | |
| Social responsibility (C43) | The company’s product design is responsible for maintaining environmental and social interests. | |
| Universal design (C44) | The product design can be understood and used as much as possible by all people regardless of their age, size, ability, or disability. | |
| Positioning (C5) | Brand fit (C51) | Provide customers with appropriate product brand. |
| Target group fit (C52) | Provide appropriate products to the target group. | |
| Differentiation (C53) | Customer’s different feelings about product design differentiation, such as price, function, and material. |
Table 2.
Aims of methods in our developed model.
| Stage | Method | Function |
|---|---|---|
| 1 | iF DESIGN AWARD 2020 evaluation criteria | The standards are used as evaluation criteria and a framework in this study. |
| 2 | DANP | The method is used to establish the influential network relation map (INRM) and weights of attributes. |
| 3 | VIKOR-AS | The method is used to obtain the gap between each evaluation criteria and the aspiration level of each design. |
Table 3.
Initial influence–relation matrix.
| C11 | C12 | C13 | C14 | C21 | C22 | C23 | C24 | C31 | C32 | C33 | C34 | C41 | C42 | C43 | C44 | C51 | C52 | C53 | |
|---|---|---|---|---|---|---|---|---|---|---|---|---|---|---|---|---|---|---|---|
| C11 | 0.00 | 0.67 | 3.75 | 1.08 | 1.08 | 1.17 | 1.33 | 1.25 | 2.58 | 2.00 | 1.42 | 1.50 | 1.17 | 0.92 | 1.00 | 1.50 | 1.83 | 1.58 | 3.33 |
| C12 | 0.83 | 0.00 | 0.50 | 3.17 | 2.33 | 1.67 | 1.58 | 1.33 | 3.25 | 2.08 | 0.83 | 1.08 | 2.08 | 1.33 | 1.00 | 0.67 | 1.92 | 2.17 | 2.25 |
| C13 | 3.58 | 1.08 | 0.00 | 1.67 | 1.92 | 1.17 | 1.17 | 0.58 | 2.58 | 2.58 | 1.17 | 1.58 | 1.25 | 0.67 | 0.92 | 1.33 | 2.25 | 2.42 | 3.42 |
| C14 | 1.25 | 3.42 | 2.00 | 0.00 | 2.92 | 2.25 | 2.08 | 2.50 | 3.58 | 1.83 | 1.17 | 1.50 | 3.17 | 1.58 | 1.42 | 1.42 | 1.67 | 1.75 | 1.42 |
| C21 | 1.42 | 2.17 | 1.50 | 2.50 | 0.00 | 2.92 | 3.67 | 3.08 | 1.67 | 1.50 | 1.50 | 1.67 | 2.25 | 2.42 | 2.33 | 2.75 | 1.83 | 2.75 | 1.25 |
| C22 | 1.50 | 1.50 | 0.92 | 1.92 | 3.42 | 0.00 | 3.42 | 3.58 | 1.17 | 0.92 | 1.42 | 0.83 | 1.67 | 1.33 | 1.83 | 2.92 | 1.25 | 2.42 | 1.00 |
| C23 | 1.58 | 1.75 | 1.33 | 2.08 | 3.42 | 2.83 | 0.00 | 2.92 | 1.42 | 1.25 | 1.17 | 1.58 | 2.08 | 1.75 | 1.67 | 3.50 | 1.50 | 2.67 | 1.08 |
| C24 | 1.00 | 1.00 | 0.75 | 2.17 | 2.83 | 2.92 | 2.75 | 0.00 | 1.25 | 1.33 | 1.00 | 1.25 | 1.33 | 1.17 | 2.50 | 2.50 | 1.42 | 2.50 | 1.08 |
| C31 | 2.08 | 2.83 | 2.25 | 2.67 | 1.83 | 1.75 | 1.50 | 1.08 | 0.00 | 3.25 | 1.67 | 2.25 | 1.17 | 0.92 | 1.33 | 1.67 | 2.17 | 2.75 | 2.17 |
| C32 | 1.92 | 1.75 | 2.17 | 1.25 | 1.25 | 0.83 | 1.00 | 0.67 | 2.83 | 0.00 | 1.58 | 2.50 | 0.58 | 0.75 | 1.50 | 1.42 | 2.17 | 2.42 | 2.17 |
| C33 | 1.75 | 1.25 | 1.67 | 1.00 | 0.75 | 1.50 | 1.42 | 0.75 | 1.83 | 2.08 | 0.00 | 3.42 | 0.58 | 0.67 | 0.92 | 1.67 | 1.42 | 1.58 | 1.42 |
| C34 | 2.08 | 0.75 | 1.92 | 1.17 | 1.58 | 1.42 | 1.92 | 1.08 | 1.50 | 2.67 | 2.42 | 0.00 | 0.92 | 0.58 | 0.75 | 1.33 | 1.17 | 1.50 | 1.75 |
| C41 | 0.67 | 2.00 | 1.33 | 3.08 | 1.92 | 1.67 | 1.25 | 1.83 | 0.92 | 0.67 | 0.50 | 0.83 | 0.00 | 2.00 | 2.25 | 1.92 | 1.92 | 1.25 | 1.17 |
| C42 | 1.33 | 1.00 | 0.67 | 1.50 | 2.42 | 0.92 | 1.75 | 1.58 | 0.92 | 1.00 | 0.75 | 0.92 | 2.58 | 0.00 | 3.33 | 1.42 | 1.33 | 1.75 | 1.42 |
| C43 | 0.92 | 0.92 | 0.83 | 1.25 | 1.67 | 1.50 | 1.33 | 2.33 | 0.92 | 1.25 | 0.92 | 1.25 | 2.00 | 3.33 | 0.00 | 2.42 | 2.00 | 2.17 | 1.33 |
| C44 | 1.42 | 0.92 | 1.33 | 1.75 | 3.08 | 3.17 | 2.67 | 2.75 | 1.50 | 1.67 | 1.50 | 2.25 | 1.92 | 2.08 | 3.08 | 0.00 | 1.75 | 2.67 | 1.92 |
| C51 | 2.08 | 1.92 | 2.17 | 2.00 | 2.33 | 1.33 | 2.25 | 1.92 | 1.83 | 1.83 | 0.83 | 1.33 | 1.75 | 1.67 | 1.67 | 2.08 | 0.00 | 3.17 | 2.42 |
| C52 | 2.08 | 1.92 | 2.50 | 2.17 | 2.50 | 2.33 | 2.67 | 2.50 | 2.08 | 2.50 | 1.25 | 1.83 | 1.08 | 1.58 | 1.42 | 2.00 | 2.08 | 0.00 | 2.50 |
| C53 | 3.08 | 1.58 | 3.17 | 1.58 | 2.08 | 1.25 | 1.08 | 0.83 | 1.92 | 2.17 | 0.92 | 1.50 | 1.50 | 0.92 | 0.67 | 1.58 | 2.75 | 2.67 | 0.00 |
Note: The significant confidence equation is , i.e., significant confidence is 95.22%. The value is obtained by Equation (A1).
Table 4.
Total influence–relation matrix.
| C11 | C12 | C13 | C14 | C21 | C22 | C23 | C24 | C31 | C32 | C33 | C34 | C41 | C42 | C43 | C44 | C51 | C52 | C53 | |
|---|---|---|---|---|---|---|---|---|---|---|---|---|---|---|---|---|---|---|---|
| C11 | 0.16 | 0.16 | 0.24 | 0.19 | 0.22 | 0.19 | 0.20 | 0.19 | 0.23 | 0.21 | 0.14 | 0.18 | 0.17 | 0.15 | 0.17 | 0.20 | 0.20 | 0.24 | 0.24 |
| C12 | 0.18 | 0.15 | 0.17 | 0.25 | 0.26 | 0.21 | 0.22 | 0.20 | 0.25 | 0.22 | 0.14 | 0.17 | 0.20 | 0.17 | 0.18 | 0.19 | 0.21 | 0.26 | 0.22 |
| C13 | 0.25 | 0.18 | 0.17 | 0.22 | 0.25 | 0.20 | 0.21 | 0.19 | 0.24 | 0.24 | 0.15 | 0.19 | 0.18 | 0.15 | 0.18 | 0.21 | 0.23 | 0.27 | 0.26 |
| C14 | 0.22 | 0.26 | 0.24 | 0.22 | 0.31 | 0.26 | 0.27 | 0.27 | 0.29 | 0.24 | 0.17 | 0.21 | 0.26 | 0.20 | 0.22 | 0.25 | 0.24 | 0.29 | 0.24 |
| C21 | 0.23 | 0.24 | 0.24 | 0.28 | 0.26 | 0.29 | 0.32 | 0.30 | 0.26 | 0.25 | 0.18 | 0.23 | 0.25 | 0.23 | 0.25 | 0.29 | 0.25 | 0.33 | 0.24 |
| C22 | 0.21 | 0.20 | 0.19 | 0.24 | 0.31 | 0.19 | 0.28 | 0.28 | 0.22 | 0.20 | 0.16 | 0.18 | 0.21 | 0.18 | 0.22 | 0.27 | 0.21 | 0.28 | 0.21 |
| C23 | 0.22 | 0.22 | 0.22 | 0.26 | 0.32 | 0.27 | 0.22 | 0.28 | 0.24 | 0.22 | 0.16 | 0.21 | 0.23 | 0.20 | 0.22 | 0.29 | 0.23 | 0.31 | 0.22 |
| C24 | 0.18 | 0.18 | 0.18 | 0.23 | 0.28 | 0.25 | 0.26 | 0.18 | 0.21 | 0.20 | 0.14 | 0.18 | 0.19 | 0.17 | 0.22 | 0.24 | 0.20 | 0.27 | 0.20 |
| C31 | 0.23 | 0.24 | 0.24 | 0.26 | 0.28 | 0.24 | 0.24 | 0.22 | 0.20 | 0.27 | 0.17 | 0.23 | 0.20 | 0.17 | 0.20 | 0.24 | 0.24 | 0.30 | 0.25 |
| C32 | 0.20 | 0.18 | 0.21 | 0.19 | 0.22 | 0.18 | 0.19 | 0.17 | 0.23 | 0.16 | 0.15 | 0.20 | 0.15 | 0.14 | 0.18 | 0.20 | 0.21 | 0.25 | 0.21 |
| C33 | 0.18 | 0.15 | 0.18 | 0.17 | 0.19 | 0.18 | 0.18 | 0.16 | 0.19 | 0.19 | 0.10 | 0.21 | 0.14 | 0.13 | 0.15 | 0.19 | 0.17 | 0.21 | 0.18 |
| C34 | 0.19 | 0.15 | 0.19 | 0.18 | 0.21 | 0.18 | 0.20 | 0.17 | 0.19 | 0.21 | 0.16 | 0.13 | 0.15 | 0.13 | 0.15 | 0.18 | 0.17 | 0.21 | 0.19 |
| C41 | 0.16 | 0.18 | 0.17 | 0.23 | 0.23 | 0.20 | 0.20 | 0.20 | 0.18 | 0.17 | 0.11 | 0.15 | 0.14 | 0.17 | 0.19 | 0.21 | 0.20 | 0.22 | 0.18 |
| C42 | 0.17 | 0.15 | 0.15 | 0.19 | 0.23 | 0.17 | 0.20 | 0.19 | 0.17 | 0.17 | 0.12 | 0.15 | 0.19 | 0.12 | 0.21 | 0.19 | 0.18 | 0.22 | 0.18 |
| C43 | 0.17 | 0.16 | 0.17 | 0.19 | 0.23 | 0.20 | 0.20 | 0.22 | 0.18 | 0.18 | 0.13 | 0.17 | 0.19 | 0.21 | 0.15 | 0.22 | 0.20 | 0.24 | 0.19 |
| C44 | 0.22 | 0.20 | 0.22 | 0.26 | 0.32 | 0.28 | 0.29 | 0.28 | 0.24 | 0.24 | 0.18 | 0.23 | 0.23 | 0.22 | 0.26 | 0.22 | 0.24 | 0.31 | 0.25 |
| C51 | 0.23 | 0.22 | 0.23 | 0.25 | 0.29 | 0.23 | 0.26 | 0.24 | 0.24 | 0.23 | 0.15 | 0.20 | 0.21 | 0.19 | 0.21 | 0.25 | 0.19 | 0.31 | 0.25 |
| C52 | 0.24 | 0.23 | 0.25 | 0.26 | 0.30 | 0.26 | 0.28 | 0.27 | 0.26 | 0.26 | 0.17 | 0.22 | 0.21 | 0.20 | 0.22 | 0.26 | 0.25 | 0.25 | 0.26 |
| C53 | 0.24 | 0.19 | 0.24 | 0.22 | 0.26 | 0.20 | 0.21 | 0.19 | 0.23 | 0.23 | 0.14 | 0.19 | 0.19 | 0.16 | 0.17 | 0.22 | 0.24 | 0.27 | 0.18 |
Note: The value is obtained by Equations (A2)–(A4).
Table 5.
Sum of given influence (ri) and received influence (di) for all criteria.
| Dimension | ri | di | ri + di | ri − di | Criterion | ri | di | ri + di | ri − di |
|---|---|---|---|---|---|---|---|---|---|
| C1 | 1.069 | 1.040 | 2.109 | 0.029 | C11 | 3.676 | 3.856 | 7.532 | −0.180 |
| C12 | 3.860 | 3.646 | 7.506 | 0.214 | |||||
| C13 | 3.962 | 3.899 | 7.861 | 0.063 | |||||
| C14 | 4.641 | 4.299 | 8.940 | 0.342 | |||||
| C2 | 1.166 | 1.174 | 2.340 | −0.008 | C21 | 4.925 | 4.967 | 9.892 | −0.041 |
| C22 | 4.245 | 4.177 | 8.422 | 0.068 | |||||
| C23 | 4.538 | 4.449 | 8.987 | 0.089 | |||||
| C24 | 3.967 | 4.193 | 8.160 | −0.226 | |||||
| C3 | 0.968 | 0.976 | 1.945 | −0.008 | C31 | 4.435 | 4.237 | 8.672 | 0.198 |
| C32 | 3.629 | 4.091 | 7.720 | −0.462 | |||||
| C33 | 3.220 | 2.811 | 6.031 | 0.409 | |||||
| C34 | 3.340 | 3.641 | 6.981 | −0.302 | |||||
| C4 | 1.000 | 0.992 | 1.992 | 0.007 | C41 | 3.484 | 3.686 | 7.170 | −0.203 |
| C42 | 3.370 | 3.289 | 6.659 | 0.080 | |||||
| C43 | 3.577 | 3.742 | 7.319 | −0.165 | |||||
| C44 | 4.698 | 4.327 | 9.025 | 0.371 | |||||
| C5 | 1.146 | 1.167 | 2.314 | −0.021 | C51 | 4.387 | 4.084 | 8.471 | 0.303 |
| C52 | 4.664 | 5.046 | 9.710 | −0.381 | |||||
| C53 | 3.967 | 4.143 | 8.110 | −0.176 |
Note: The value is obtained by Equations (A5) and (A6).
Table 6.
Influence weights.
| Dimension | Local Weight | Ranking | Criterion | Local Weight | Ranking | Global Weight | Ranking |
|---|---|---|---|---|---|---|---|
| C1 | 0.194 | 3 | C11 | 0.246 | 3 | 0.048 | 13 |
| C12 | 0.232 | 4 | 0.045 | 16 | |||
| C13 | 0.249 | 2 | 0.048 | 12 | |||
| C14 | 0.273 | 1 | 0.053 | 7 | |||
| C2 | 0.219 | 1 | C21 | 0.279 | 1 | 0.061 | 4 |
| C22 | 0.235 | 4 | 0.052 | 10 | |||
| C23 | 0.250 | 2 | 0.055 | 5 | |||
| C24 | 0.235 | 3 | 0.052 | 9 | |||
| C3 | 0.182 | 5 | C31 | 0.287 | 1 | 0.052 | 8 |
| C32 | 0.277 | 2 | 0.051 | 11 | |||
| C33 | 0.190 | 4 | 0.035 | 19 | |||
| C34 | 0.246 | 3 | 0.045 | 17 | |||
| C4 | 0.185 | 4 | C41 | 0.244 | 3 | 0.045 | 15 |
| C42 | 0.219 | 4 | 0.041 | 18 | |||
| C43 | 0.248 | 2 | 0.046 | 14 | |||
| C44 | 0.288 | 1 | 0.053 | 6 | |||
| C5 | 0.218 | 2 | C51 | 0.308 | 3 | 0.067 | 3 |
| C52 | 0.379 | 1 | 0.083 | 1 | |||
| C53 | 0.312 | 2 | 0.068 | 2 |
Note: The value is obtained by Equations (A7)–(A12).
Table 7.
Results of original VIKOR and the proposed VIKOR-AS method.
| Local Weight | Original VIKOR | VIKOR-AS | |||||
|---|---|---|---|---|---|---|---|
| A1 | A2 | A3 | A1 | A2 | A3 | ||
| Innovation (C1) | 0.194 | 0.685 | 0.861 | 0.232 | 0.541 | 0.551 | 0.503 |
| Degree of innovation (C11) | 0.246 | 1.000 | 0.714 | 0.000 | 0.475 | 0.458 | 0.417 |
| Degree of elaboration (C12) | 0.232 | 0.000 | 1.000 | 1.000 | 0.567 | 0.592 | 0.592 |
| Uniqueness (C13) | 0.249 | 0.667 | 1.000 | 0.000 | 0.500 | 0.542 | 0.417 |
| Execution/workmanship (C14) | 0.273 | 1.000 | 0.750 | 0.000 | 0.617 | 0.60 | 0.583 |
| Functionality (C2) | 0.219 | 0.000 | 0.312 | 1.000 | 0.412 | 0.448 | 0.530 |
| Use value and usability (C21) | 0.279 | 0.000 | 0.538 | 1.000 | 0.400 | 0.458 | 0.508 |
| Ergonomics (C22) | 0.235 | 0.000 | 0.286 | 1.000 | 0.433 | 0.467 | 0.550 |
| Practicability (C23) | 0.250 | 0.000 | 0.000 | 1.000 | 0.392 | 0.392 | 0.517 |
| Safety (C24) | 0.235 | 0.000 | 0.400 | 1.000 | 0.425 | 0.475 | 0.550 |
| Aesthetics (C3) | 0.182 | 0.687 | 0.117 | 0.809 | 0.508 | 0.465 | 0.531 |
| Aesthetic appeal (C31) | 0.287 | 1.000 | 0.000 | 0.333 | 0.592 | 0.517 | 0.542 |
| Emotional appeal (C32) | 0.277 | 1.000 | 0.000 | 1.000 | 0.575 | 0.508 | 0.575 |
| Spatial concept (C33) | 0.190 | 0.000 | 0.615 | 1.000 | 0.383 | 0.450 | 0.492 |
| Ambience (C34) | 0.246 | 0.500 | 0.000 | 1.000 | 0.433 | 0.367 | 0.500 |
| Responsibility (C4) | 0.185 | 0.000 | 0.650 | 1.000 | 0.472 | 0.527 | 0.567 |
| Production efficiency (C41) | 0.244 | 0.000 | 0.556 | 1.000 | 0.417 | 0.500 | 0.567 |
| Consideration of environmental standards/carbon footprint (C42) | 0.219 | 0.000 | 0.857 | 1.000 | 0.475 | 0.575 | 0.592 |
| Social responsibility (C43) | 0.248 | 0.000 | 1.000 | 1.000 | 0.558 | 0.583 | 0.583 |
| Universal design (C44) | 0.288 | 0.000 | 0.273 | 1.000 | 0.442 | 0.467 | 0.533 |
| Positioning (C5) | 0.218 | 0.310 | 0.708 | 0.379 | 0.483 | 0.506 | 0.511 |
| Brand fit (C51) | 0.308 | 0.600 | 1.000 | 0.000 | 0.542 | 0.558 | 0.517 |
| Target group fit (C52) | 0.379 | 0.000 | 0.231 | 1.000 | 0.408 | 0.433 | 0.517 |
| Differentiation (C53) | 0.312 | 0.400 | 1.000 | 0.000 | 0.517 | 0.542 | 0.500 |
| 0.326 | 0.532 | 0.680 | 0.481 | 0.498 | 0.528 | ||
| 0.687 | 0.861 | 1.000 | 0.541 | 0.551 | 0.567 | ||
| 0.506 (1) | 0.697 (2) | 0.840 (3) | 0.511 (1) | 0.525 (2) | 0.547 (3) | ||
Note: The value is obtained by Equations (A13)–(A16).
Table 8.
Comparison ranking results of various methods.
| Alternative | SAW-AS | VIKOR-AS | MOORA | Multi-MOORA | GRA | TOPSIS |
|---|---|---|---|---|---|---|
| A1 | 1 | 1 | 1 | 1 | 1 | 1 |
| A2 | 2 | 2 | 2 | 2 | 2 | 2 |
| A3 | 3 | 3 | 3 | 3 | 3 | 3 |
© 2020 by the authors. Licensee MDPI, Basel, Switzerland. This article is an open access article distributed under the terms and conditions of the Creative Commons Attribution (CC BY) license (http://creativecommons.org/licenses/by/4.0/).
Share and Cite
MDPI and ACS Style
Chen, T.-L.; Chen, C.-C.; Chuang, Y.-C.; Liou, J.J.H. A Hybrid MADM Model for Product Design Evaluation and Improvement. Sustainability 2020, 12, 6743. https://0-doi-org.brum.beds.ac.uk/10.3390/su12176743
AMA Style
Chen T-L, Chen C-C, Chuang Y-C, Liou JJH. A Hybrid MADM Model for Product Design Evaluation and Improvement. Sustainability. 2020; 12(17):6743. https://0-doi-org.brum.beds.ac.uk/10.3390/su12176743
Chicago/Turabian StyleChen, Tien-Li, Chin-Chuan Chen, Yen-Ching Chuang, and James J. H. Liou. 2020. "A Hybrid MADM Model for Product Design Evaluation and Improvement" Sustainability 12, no. 17: 6743. https://0-doi-org.brum.beds.ac.uk/10.3390/su12176743
Note that from the first issue of 2016, this journal uses article numbers instead of page numbers. See further details here.