A Soil Environmental Quality Assessment Model Based on Data Fusion and Its Application in Hebei Province

1
School of Information Technology, Hebei University of Economics and Business, Shijiazhuang 050061, China
2
GIS Big Data Platform for Socio-Economy in Hebei, Shijiazhuang 050061, China
3
School of Management Science and Engineering School, Hebei University of Economics and Business, Shijiazhuang 050061, China
*
Author to whom correspondence should be addressed.
Sustainability 2020, 12(17), 6804; https://0-doi-org.brum.beds.ac.uk/10.3390/su12176804
Submission received: 28 July 2020
/
Revised: 17 August 2020
/
Accepted: 18 August 2020
/
Published: 21 August 2020
(This article belongs to the Special Issue Soil Use Management and Soil Health)
Abstract
:Soil pollution has become one of the most important environmental issues in China. It is very important to evaluate soil environmental quality comprehensively and objectively. This paper proposes a soil environment quality assessment model based on the Driving Force-Pressure-State-Impact-Response (DPSIR) model and data fusion. At first, 18 evaluation indicators are selected, including complex indexes, such as the industrialization index, heavy metal pollution index, organic pollution index, potential ecological risk index, and human health risk index, and single indexes such as population density, fertilizer/pesticide application intensity, annual average air quality index, etc. Then, hierarchical analysis model is constructed, and the weight of each indicator is calculated based on Analytic Hierarchy Process (AHP) method. According to the quartile of indicator values of 32 provincial administrative divisions on the Chinese mainland, the values of each indicator are standardized and graded. Finally, the soil environmental quality index (SEQI) is calculated by the weighted average of the standard values of the 18 indicators. The assessment model is then applied in evaluating soil quality of Hebei Province, China. The results show that the soil environmental quality of Hebei’s agricultural land is in a medium state, and the industrial land is approaching the alert state. The pressure of soil pollution mainly comes from the discharge of industrial pollutants and the application of pesticides and fertilizers. Soil pollutants, such as lead, copper, zinc, benzo[a]pyrene, and benzo[a] should be especially controlled.
1. Introduction
Soil quality has become one of the most important environmental issues in China’s modernization process. Soil pollution is related to agricultural safety production, cultivated land quality, and people’s health. The National Soil Pollution Status Survey Bulletin, jointly issued by the former Ministry of Environmental Protection and the Ministry of Land and Resources in 2014, showed that the total over-standard rate of soil pollutants in China is as high as 16.1%, indicating that the soil conditions in China are not optimistic [1]. With the awareness of environmental protection and sustainable development, people began to realize the negative effects of soil pollution on production systems and their lives. Soil pollution refers to the accumulation of heavy metals and organic and other pollutants, which lead to an unbalanced nutrient availability for plants, changes in soil microbial community abundance and structure, soil ecosystem degradation and the pollution of groundwater, further affecting the quality and safety of crops and human health [2,3,4,5]. Due to the diversity of soil resource utilization and management methods, there are many indicators to evaluate soil quality [6,7,8,9]. It is necessary to construct a comprehensive assessment model to evaluate soil environmental quality, according to different evaluation purposes. Besides, the soil pollution data sources are widely distributed in the departments of environmental protection, land resources, agriculture, forestry, industry, etc. It is necessary to integrate multi-source soil environmental data into the soil environmental quality assessment system as well as to ensure the reliability of soil quality assessment results.
At present, the development of soil quality assessment is still at the beginning exploration stage. The commonly used soil quality evaluation methods are summarized as follows: (1) Multiple variable indicator kringing method (MVIK) [10] converts multiple single soil quality indicators into a comprehensive soil quality index. The standard of each indicator represents the optimal range or threshold of soil quality, which is established and evaluated based on soil properties in the region. (2) The soil quality model method [11] subdivides the soil quality assessment into 6 specific quality elements: SQ = f (SQE1, SQE2, SQE3, SQE4, SQE5, SQE6); SQ is the soil quality comprehensive score, SQE1~SQE6 represent the crop yield, erosion resistance, groundwater quality, surface water quality, air quality, and food quality, respectively. The soil quality score SQ is calculated by a simple multiplication of SQE1~SQE6. The application scope of this method is wide, but sometimes the information is insufficient, which cannot fully reflect the optimal functional relationship among different soil quality elements. (3) The soil quality index method [12] consists of three steps: selecting the appropriate indicators, transforming the indicators into component values and generating the comprehensive evaluation score. Karlen et al. used a standardized score curve to calculate the score of each indicator and get the soil quality index. Then they selected several important soil functions related to soil quality to evaluate the impact of different management systems on soil quality. This method is suitable for the sustainable management of soil and can provide early prediction to judge whether the management measures have positive or negative effects on the sustainable development of soil [13]. (4) The soil relative quality method [14] first assumes an ideal soil condition; other soil quality indicators are obtained by comparing with the ideal soil. This method is convenient and reasonable. The evaluation results are more practical and therefore suitable for the long-term management of soil. But the selection of ideal soil is very important; it is necessary to select different ideal soil according to different soil conditions in the study area. (5) The fuzzy mathematics comprehensive method [15] describes the gradualness and ambiguity of the change of soil quality status through membership degree, which reflects the comprehensive influence of each factor on the whole evaluation result and makes the evaluation result more accurate and reliable. In this method, the membership degree of each indicator mdi, 0 ≤ mdi ≤ 1, is determined by the membership function and the weighted average model. It is used to represent the soil quality. This method not only makes use of the boundary fuzziness characteristic of each indicator but also considers the comprehensive influence of the value, weight and the interaction among indicators to minimize the influence of the detecting error on the evaluation results. Thus, the main restrictive factors affecting soil quality in the study area can be found based on the evaluation results.
In summary, the evaluation of soil environmental quality has no internationally or locally unified standards or methods. People usually use the above methods or a combination of several methods, based on the evaluation object and purpose. Soil environmental quality assessment is a complex procedure. Firstly, current soil environmental quality indicators are too easy to trace the state of the contaminated soil. Soil pollution is closely related to regional economic and social agricultural development, climate and geographical environment, environmental protection measures, and technical means. However, the evaluation indicators only focus on the physical and chemical characteristics of the soil and do not pay attention to the relationship between soil pollution and economic and social factors, agricultural development, climate, and meteorological changes. These relatively easy soil environmental assessment methods have a limited effect on the prevention and reduction of soil pollution [16,17,18,19]. Secondly, considering the complexity of soil data environment, existing evaluation methods cannot describe the overall characteristics of the soil environment well and cannot trace the main causes of soil pollution.
To solve the above problems, this study proposes a comprehensive soil environmental quality assessment method based on the Driving Force-Pressure-State-Impact-Response (DPSIR) model [20]. Developed from the pressure-state-response (PSR) model [21], it can analyze the interaction between human activities and resource environment from a system perspective, reflecting their causality and constraint relationship. It also can decompose and simplify the complex process of interactions among factors, making the indicator system clear and simple. Once the indicator value changes, the DPSIR model can provide timely and continuous feedback, which makes the indicator system more flexible and relevant. Besides, the DPSIR model can decompose complex problems first and then effectively synthesize them, which has strong advantages in the complex soil environmental quality assessment. The European Environmental Agency (EEA) first proposes the DPSIR model. It has been widely used in ecological environment assessment [22,23,24]. Our contributions in this study are summarized as follows. We propose a soil environmental quality assessment method based on the DPSIR model, and 18 evaluation indicators are selected according to the principles of the DPSIR model. The weights of each indicator are calculated by the Analytic Hierarchy Process (AHP) method. According to the quartile of indicator values of 32 provinces and municipalities of Mainland China, 18 indicator values are graded and standardized. At last, the weighted average value of these indicators is calculated as the soil environmental quality index. This method is used to evaluate the soil environmental quality of Hebei Province, China. The evaluation results show that the soil environmental quality of Hebei’s agricultural land is in a medium state, and the industrial land is approaching the alert state. Some indicators, such as pesticide application intensity and environment protection investment have an extremely bad status and should be paid attention to.
The rest of this paper is organized as follows. Section 2 introduces the soil quality evaluation model based on DPSIR and data fusion. Section 2.1 introduces the selection and description of indicators, especially the complex indicators. Section 2.2 constructs the soil environmental quality assessment model, consisting of three procedures: the establishment of a hierarchical analysis model and calculation of each indicator’s weight, the standardization of each indicator’s value and the integration of each indicator’s value, for a comprehensive evaluation. Section 3 is an application of this model in Hebei province, China. Finally, some significant discussion points and conclusions are listed in Section 5 and Section 6.
2. Soil Environmental Quality Assessment Method Based on the DPSIR Model
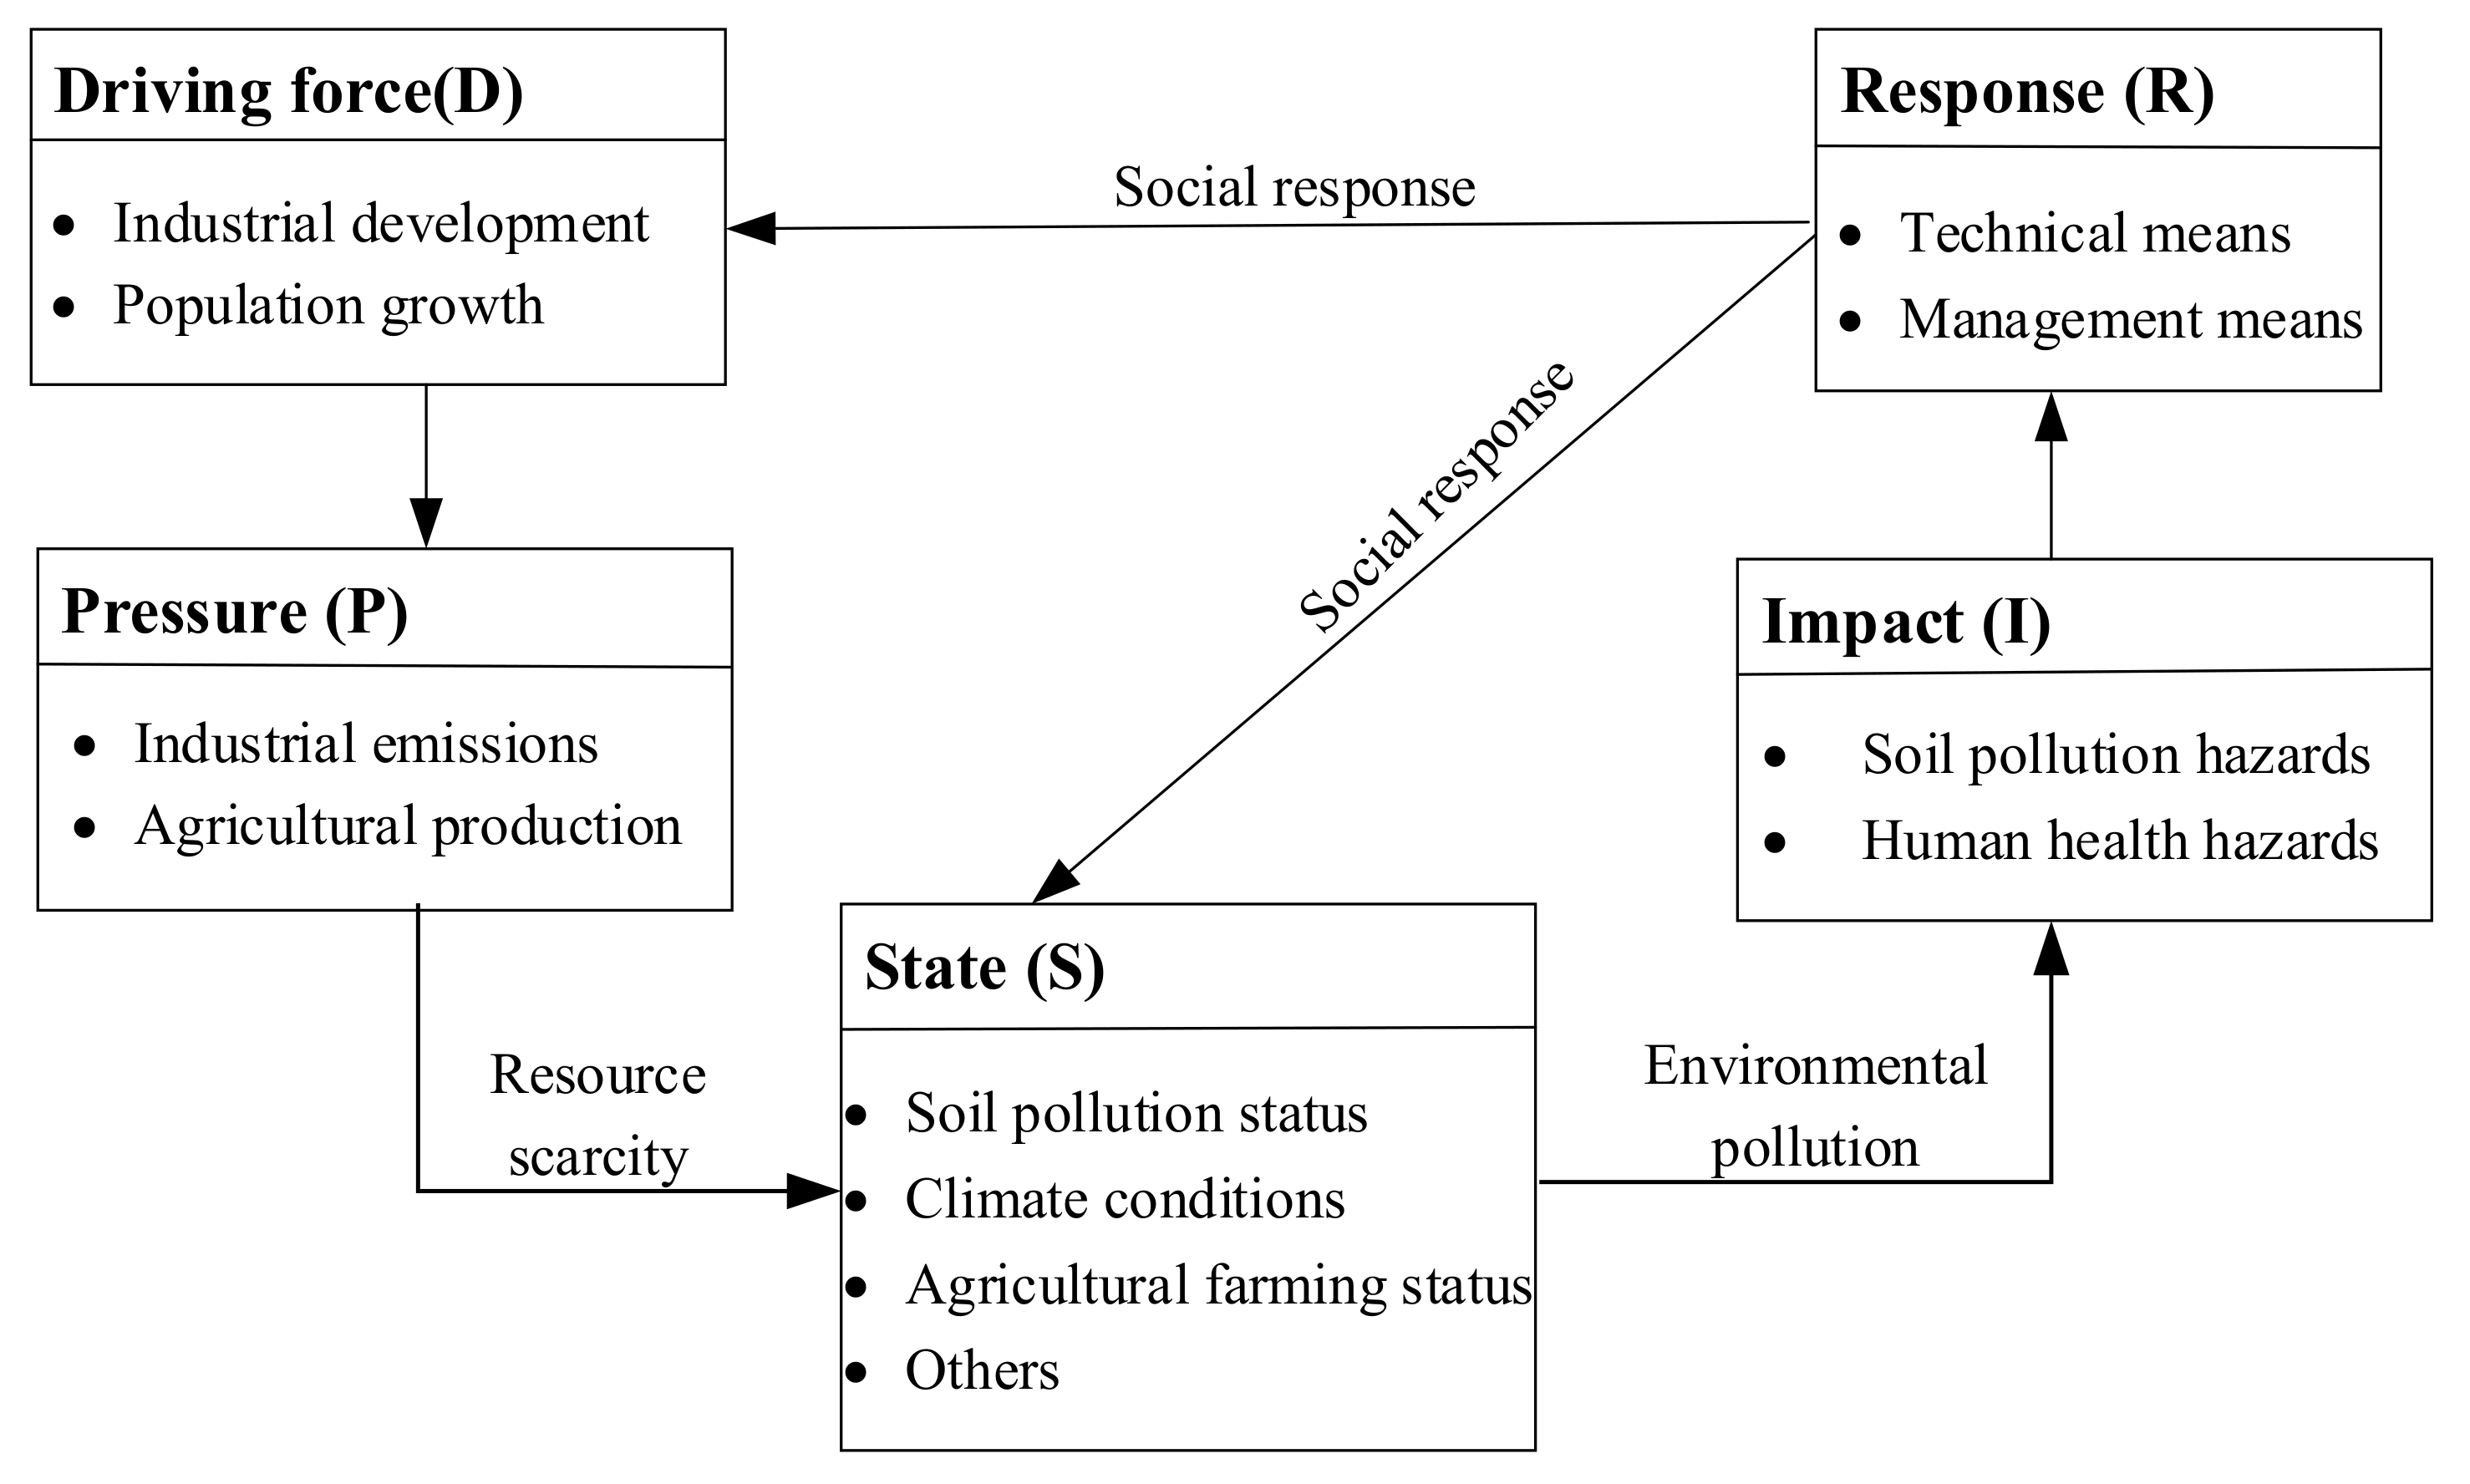
The DPSIR model is an indicator system commonly used in the evaluation of ecological environment systems [25,26]. It divides the evaluation indicators into five modules: driving force, pressure, state, impact, and response. When evaluating the soil environmental quality, the five modules can be explained as follows, also can be seen in Figure 1.
- (1)
- Driving force: Refers to the socio-economic development factors, such as industrial development and population growth, that lead to changes in soil environmental quality, which are the most primitive key factors directly forcing the change of soil environment.
- (2)
- Pressure: Refers to the pressure directly applied to the soil environmental quality after driving force action. Similar to the driving force, pressure refers to external factors, such as corporate sewage, pesticide, and fertilizer application, etc, that cause soil environmental change. While the driving force affects the soil environmental quality implicitly, the pressure acts explicitly.
- (3)
- State: Refers to the pollution status of the soil environment under the above pressures, such as organic pollution and heavy metal pollution in soil.
- (4)
- Impact: Refers to the impact of current soil environmental conditions on human health and social economy, such as potential ecological risks, human health risks, etc.
- (5)
- Response: Refers to countermeasures, policies, and environmental technologies that are used to prevent soil pollution, such as soil environmental restoration, government environmental protection investment, and policies.
The Evaluation indicator system involved in the DPSIR model reflects the desire to comprehensively evaluate the essence of the object. However, in the specific application of soil environmental assessment, the selection of indicators reflects the different evaluation objects, evaluation objectives, knowledge background, and the theoretical basis of evaluations. Therefore, it is necessary to select suitable indicators for the soil environmental assessment system, based on the principles of sensitivity and independence.
2.1. Indicator Selection and Description
According to the rules of sensitivity and independence, indicators of soil environmental quality assessment are selected, as shown in Table 1.
Different from other simple indicators, which can be directly gained from statistical yearbook or other data sources, the following indicators (X1, X11, X12, X13 and X14) are obtained from complex calculations of several parameters. Calculation processes of these indicators are explained in the following part.
- (1)
- X1 Industrialization index. X1 refers to the industrial development level of the studied area. Generally, the higher the industrialization level is, the worse the soil environmental quality is. Four parameters are taken into account: proportion of heavy/light industry, non-agricultural industry, per capita GDP, and non-agricultural labor ratio. Using the calculation method of literature [27], the initial value is obtained by principal component analysis by SPSS software. The industrialization index of a province is between 0 and 10.
- (2)
- X11 Heavy metal pollution index. According to the Soil Environmental Quality Standard [28,29], the main pollutants of heavy metals are cadmium (Cd), arsenic (As), mercury (Hg), copper (Cu), lead (Pb), chromium (Cr), zinc (Zn), and nickel (Ni). In order to measure the synthesized pollution of heavy metals, the commonly used Nemerow index is introduced:where Pimax and Piavg represent the maximum single pollution index and average pollution index of the i-th sampling point, respectively, and Pz is the synthesized heavy metal pollution value.
- (3)
- X12 Organic pollution index. Organic pollution mainly comes from 666, DDTs, aldrin, benzo [a]anthracene, benzo [b] fluoranthene, benzo [k] fluoranthene, benzo [a] pyrene, fluorene, anthracene, fluoranthene, pyrene, etc. We also use the Nemerow index to calculate the synthesized pollution of organics.
- (4)
- X13 Potential ecological risk index. This index is calculated by a method proposed by Hakanson [28]. The calculation not only takes heavy metal pollution into account but also considers the multi-element synergy and other factors. The calculation formula is shown as Equation (2):where, represents the pollution index of the i-th pollutant; and represent the detected value and the reference value of the i-th pollutant, respectively; and is the toxicity response coefficient of the i-th pollutant. The calculation of the above indexes results in , the potential ecological risk index of the i-th pollutant. The potential ecological risk can be obtained by accumulating . The toxicity response coefficient is set according to references [28,29], as shown in Table 2.
- (5)
- X14 Human health risk index. According to China’s Technical Guidelines for Contaminated Site Assessment and the carcinogenicity of related substances provided by the comprehensive risk consulting system of the United States Environmental Protection Agency (US EPA), the carcinogens in soil pollutants are arsenic, lead, hexachlorocyclohexane, and aldrin. The human health risk index consists of total cancer risk and total non-carcinogenic risk. By calculating the health risks of individual pollutants separately, the total health risks can be obtained by adding them together.
Three types of lands (agricultural land, residential land, and industrial land) and three types of pollutant intake (mouth, respiration, and skin contact) are taken into account. We use EDI1~EDI3 to indicate oral intake, respiration intake, and skin contact intake, respectively. The Risk-based Corrective Action (RBCA) model is used to calculate the index, as shown in Equation (3).
In the formula, CS is the mass ratio of chemical substances in the soil, unit: mg/kg. ABS is the skin absorption coefficient. The exposure assessment parameters refer to the US Environmental Protection Agency’s Exposure Factor Handbook, Technical Guidelines for Contaminated Site Risk Assessment [30,31], the specific values are shown in Table 3.
The total cancer risk and non-carcinogenic risk can be expressed as:
In Equation (4), SF is the slope factor of the carcinogen; RfD is the chronic reference dose. The calculation is based on the Chinese Technical Guidelines for Risk Assessment of Contaminated Sites [30]. After calculation of the carcinogenic risk, we set 10−6 as the lower limit of acceptable risk.
2.2. Evaluation Based on the DPSIR Model
In this section, we will introduce (1) the establishment of a hierarchical analysis model and calculation of each indicator’s weight, (2) the standardization of each indicator’s value, and (3) the integration of each indicator’s value, for a comprehensive evaluation.
2.2.1. Establishment of Hierarchical Analysis Model
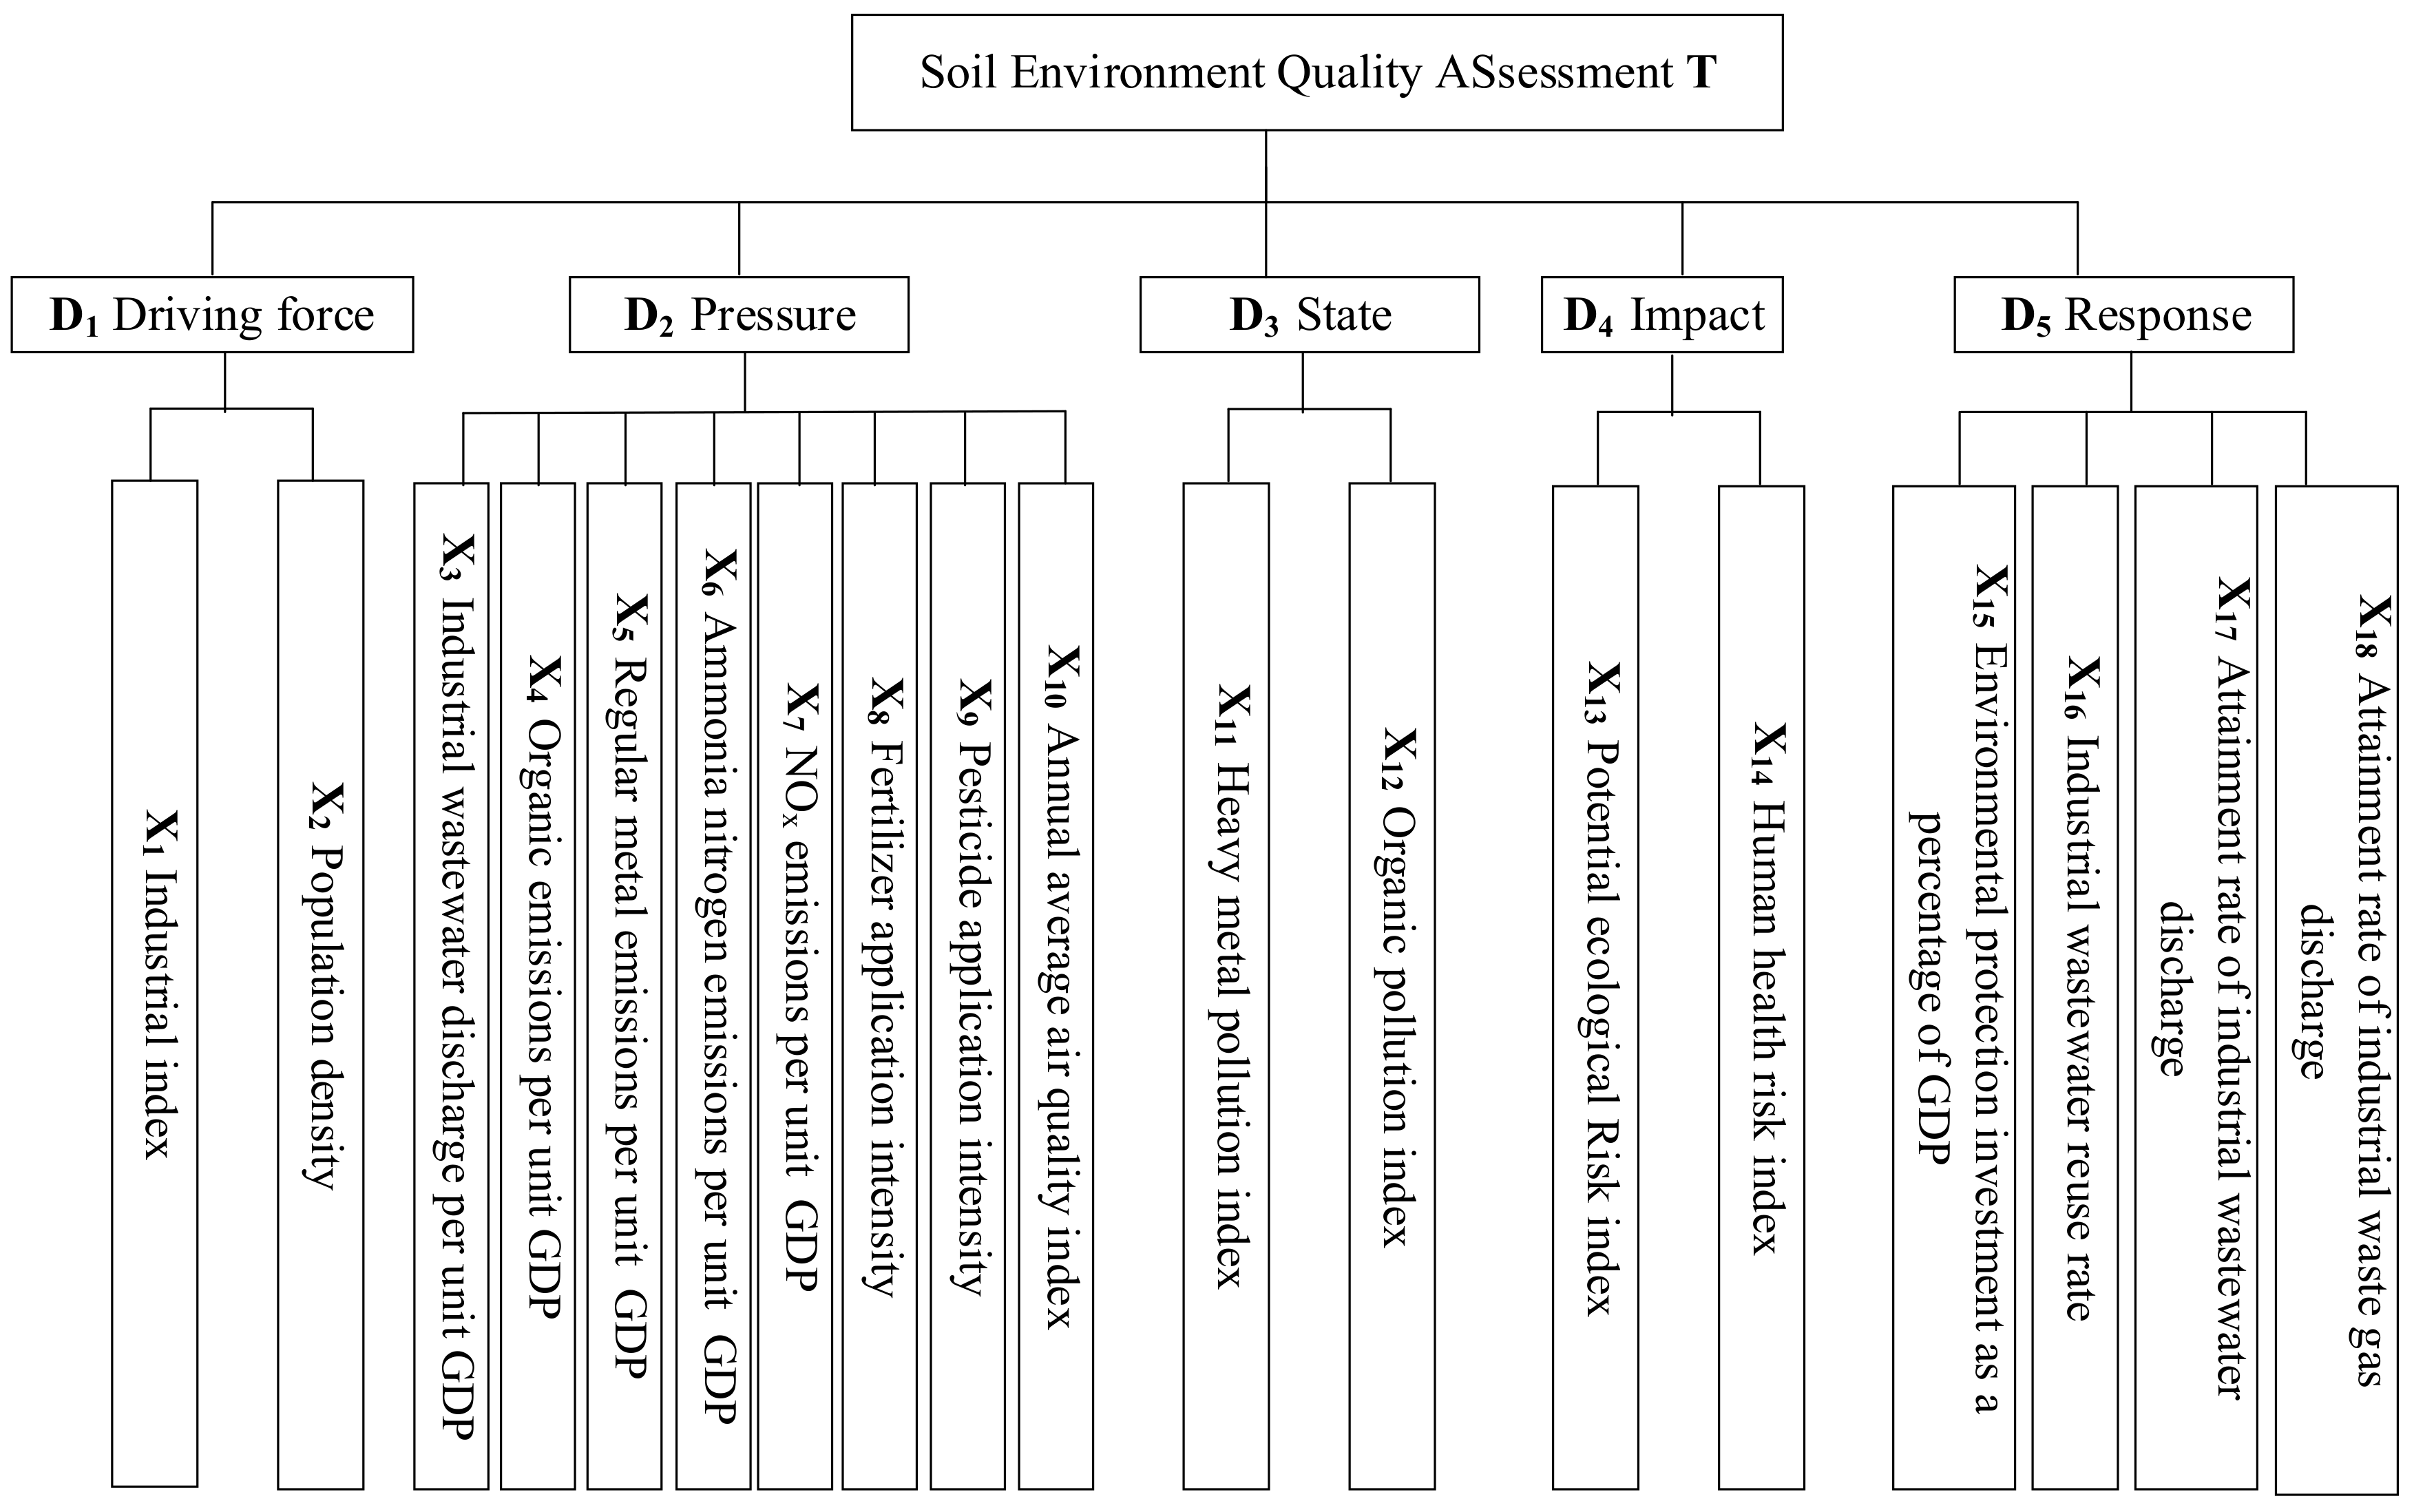
Based on the principle of hierarchical analysis, a hierarchical structure of the soil environmental quality assessment model is constructed, including the target layer (T), criterion layer (D), and indicator layer (X). The criterion layer contains five criteria: D1 (driving force), D2 (pressure), D3 (state), D4 (impact), and D5 (response), and the indicator layer contains 18 indicators. The hierarchical analysis model is shown in Figure 2.
There are several methods that can be used for calculating weights in the DPSIR model, such as the AHP method [32,33], the Delphi method [34], the coefficient of variation method [35], the entropy weight method [36], and the principal component analysis method [37]. When using the entropy weight method or the principal component analysis method, we need to know the values of each indicator before calculating the weights; however, this is not realistic in our application. Therefore, we choose the AHP method to calculate the indicator weights.
The relative weights of criteria/indicators are calculated by pairwise comparisons. The relative importance values of indices are shown in Table 4.
Firstly, the maximum eigenvalue, λmax, of each matrix and its corresponding eigenvector, w, are calculated. Then, a consistency check on each matrix is performed. If it passes the consistency check, the eigenvector corresponding to the largest eigenvalue is the weight. The consistency index is calculated by the formula CI = (λmax − n)/(n − 1), where n is the order of the judgment matrix. To measure the size of CI, the random consistency index RI set as [0, 0.58, 0.90, 1.12, 1.24, 1.32, 1.41, 1.45, 1.49, 1.51]. The consistency ratio CR = CI/RI. When CR < 0.1, the matrix passes the consistency check. We use Matlab to calculate the weights; the results are shown in Table 5.
The weight of the D3 (status) is 0.4057, the weight of the D2 (pressure) is 0.2312, and the weight of D4 (impact) is 0.1649, indicating that the pollution status, pollution source pressures, and pollution impacts are the main factors that affect soil environmental quality. In D2 (pressure) layer, the indicators X5 and X4 have the highest weights: 0.2465 and 0.2329, respectively, indicating that the heavy metal and organic emissions are the main pressures affecting soil quality; in the D5 (response) layer, the indicators X17 and X16 have the highest weights: 0.4914 and 0.1046, respectively, meaning that the wastewater reuse is a very important technical means to control soil pollution.
2.2.2. Standardization of Indicator Values
In Section 2.1, 18 indicators are selected to evaluate soil environmental quality. The original values of the indicators cannot directly be used in the model, since the units, values, and calculations of each indicator are quite different, making them hard to compare. Data standardization is needed. 18 indicators are standardized into the range of [0,1] with the method of grading. The grading standards mainly refer to national, local, and industry standards, such as Soil environmental quality Risk control standard for soil contamination of agricultural land [38], Soil environmental quality Risk control standard for soil contamination of development land [39], China Statistical Yearbook, and the National Bureau of Statistics website. At first, we get the indicator values of 32 provinces, municipalities, and autonomous regions in Mainland China, and these indicator values of each province are sorted in an ascending order (for X15~X18, in an descending order), and the quartile Q1, Q2, and Q3 are the values at the 8th, 16th, and 24th positions, respectively. Each indicator value is finally divided into four levels of standardized scores: means that the indicator of the studied area is excellent; indicates a medium state; an alert state; and a bad state. The higher the value is, the more positive the indicator is. Standard and graded values are shown in Table 6.
Suppose the original value of indicator Xi is vi, which can be standardized to , based on the above-standardized table, and the calculation process is as follows.
where RS and Re are the starting and ending points of the standardized closed interval , respectively, The original value of indicator Xi is in the range of , as shown in Table 6. Equation (5a) is for indicators X14~X18, and Equation (5b) is for X1~X13.
2.2.3. Synthetic Evaluations
The quality of the soil environment is described by the synthetic evaluation of the above indicators. After calculating the weights and standard value of each indicator, the soil environmental quality index (SEQI) is calculated by the weighted average of the standard values of the 18 indicators. The calculation equation is as follows:
The result of Equation (5) is standardized between [0,1]. The larger the value is, the better the soil environmental quality is. We grade the evaluation results into 4 levels using upper and lower quartiles: means that the soil environmental quality is excellent; means that it is in a medium state; , an alert state; and , a bad state.
3. Soil Environment Quality Assessment of Hebei Province
3.1. Research Area Overview
Hebei Province is located in North China, bounded by 36°05′–42°40′ N and 113°27′–119°50′ E, with a total area of 188,800 square kilometers. Hebei Province has 11 prefecture level cities, including 49 municipal districts, 21 county-level cities, 91 counties, and 6 autonomous counties. By the end of 2019, Hebei Province had a permanent population of 75.9197 million and a GDP of 3510.45 billion yuan. Industrial production is based on coal, iron and steel, textile, and raw material medicine. It is also an important grain and cotton production area in China.
3.2. Data Acquisition
The original data mainly comes from the 2015 Hebei Economic Statistics Yearbook, the 2015 Hebei Statistical Yearbook, the 2015 China Environmental Statistics Yearbook, and the Status of Soil Environmental Quality Survey 2015 Environmental Status Bulletin of Hebei Province. Part of the soil pollution data comes from the Hebei Province Economic Geographic Information Big Data Platform.
3.3. Soil Quality Assessment of Hebei Province
According to the aforementioned evaluation method in Section 2, the scores of each indicator of Hebei Province are calculated, as shown in Table 7.
In order to get the comprehensive soil environmental quality index, we add up the weighted values (in Table 7) of agricultural land and industrial land, respectively, and get the results, which is 0.5815 in agricultural land, and 0.5127 in industrial land. This indicates that the soil environmental quality of agricultural land is in a medium state and the soil environmental quality of industrial land is approaching the alert state.
4. Results
The soil quality index of Hebei gained from our assessment model is 0.5815 in agricultural land and 0.5127 in industrial land, indicating that the soil environmental quality of agricultural land is in a medium state and the soil environmental quality of industrial land is approaching the alert state. From the perspective of the DPSIR model, as shown by criterion layer value in Table 7, we can see that the pressure (D2) is in the range of , which means the pressure of soil environmental quality is in an alert state. The standard value of X8 (Fertilizer application intensity) and X9 (pesticide application intensity) of agricultural land is in the range of (0.25, 0.5], indicating that the pressure caused by the pesticide application is large. The current pollution status of industrial land (D3) is 0.4150, more serious than that of agricultural land. While the impact (D4) is in a medium state, the response (D5) is excellent. However, the standard value of X15 is 0.01, indicating that the environmental protection investment is extremely low and in a very poor state. Therefore, Hebei province should increase investment in soil pollution prevention. Following is a discussion of some complex indicators.
4.1. X11 Heavy Metal Pollution Index
The heavy metal pollution indexes of agricultural and industrial land are 1.41 and 2.35, respectively. Soil samples were collected at a depth of 0–10 cm. We sampled 3224 points in Hebei to describe the soil pollution status, including 1537 samples in industrial land and 1687 in agricultural land; samples are scattered in 11 prefecture level cities, about 1 point/15 km2. The Nemerow index of the heavy metal pollution of each sample point is calculated, respectively. The results are shown in Table 8.
The above results indicate that the surface soil of Hebei province is in a state of heavy metal pollution, and the pollution in the industrial land is relatively serious. This must be highly valued by relevant departments to prevent further pollution of the soil.
4.2. X12 Organic Pollution Index
The Nemerow indexes of organic pollution of agricultural and industrial land are 1.06 and 1.71, respectively. The sample points of organic pollution are the same as that of heavy metal pollution. The statistic data of organic pollution is shown in Table 9.
Farmland organic pollution mainly comes from chemical fertilizer application, pesticide application, and sewage irrigation. The pesticide application intensity and fertilizer application intensity score of Hebei province are both in the range of , indicating that the pesticide and fertilizer application intensity is in an alert state, which must be paid attention to. At the same time, the organic pollution of industrial land is in a medium state. The main pollutants are Benzo [a] anthracene and benzo[a]pyrene. The pollution mainly comes from the discharge of industrial pollutants.
4.3. X13 Potential Ecological Risk Index
The original value of the potential ecological risk index is 203, which is calculated by the data of 3224 sampling points. Among the 3224 sampling points, the maximum potential ecological risk index is 263.12, the minimum value is 74.56, and the average value is 203, which reached the medium ecological hazard level (150, 500). Of the sampling points with an ecological hazard index value less than 150, 70% appear in the agricultural land. Besides, the average ecological risk index of the industrial land is also larger than that of the agricultural land.
4.4. Human Health Risk Index
The original value of the human health risk index is 1.5 × 10⁻⁵, among which the organic cancer risk is less than 10−6, which is small. In agricultural lands, the average cancer risk of lead is 3.4 × 10⁻⁵, which is greater than the acceptable cancer risk of human health (10−6). Overall, due to the exposure time of industrial and agricultural lands being much lower than that of residential areas, the total cancer risk of our study is within an acceptable range. However, the cancer risk of lead has reached the alert value.
5. Discussion
A case study of Hebei has proven that the evaluation models proposed in this paper are appropriate and that they can be applied to other provinces or cities. The following actions can be taken by the Hebei government to improve the soil environmental quality:
- (1)
- Improve farming patterns and promote organic fertilizers. The pollution of agricultural land in Hebei is mainly caused by the unreasonable agricultural production mode. Rational selection of cultivated crops, selection of anti-fouling crops, development of economic crops, and reduction of the use of chemical fertilizers and pesticides can prevent the continued pollution of agricultural land.
- (2)
- Develop green industry and improve resource utilization. The government should take measures to limit the entry of enterprises with high-energy consumption, high water consumption, and heavy pollution. Continue to close down enterprises that do not rectify low-efficiency and heavy pollution, promote the optimization of industrial structure, and fundamentally achieve pollution reduction aims.
- (3)
- Increase investment in environmental protection. The government can cooperate with the Environmental Protection Bureau, the National Development and Reform Commission and other departments to actively report environmental management projects to the higher levels and strive for the state’s investment in Hebei’s environmental protection cause.
6. Conclusions
This study proposes a soil environment quality assessment method based on the DPSIR model. Eighteen evaluation indicators are selected, a hierarchical analysis model is constructed and the weight of each indicator is calculated based on the AHP method, and the values of each indicator are standardized and graded. The soil environment quality is calculated by the weighted average of these indicators. This method is applied in evaluating the soil quality of agricultural and industrial lands of Hebei province, China. The results show that the soil environmental quality of Hebei’s agricultural land is in a medium state and that the industrial land is approaching the alert state. The pressure of soil pollution mainly comes from the discharge of industrial pollutants and the application of pesticides and fertilizers. Specifically, the pesticide application intensity of Hebei province has reached a limit value and Hebei’s environmental protection investment level is extremely low, which must be paid attention to.
Regarding the research method of this paper, the index selection of the DPSIR model adopted in this paper can be further optimized. For example, the ecological environment index can be added to the impact. Moreover, this paper only evaluates the soil environmental quality of agricultural and industrial areas in Hebei, because the pressure and driving force in the DPSIR model are only in line with industrial and agricultural production and have little impact on residential areas, roads, and other areas. In future research, a more comprehensive evaluation model can be designed to evaluate the diverse soil application types in the urban soil environment, and a more comprehensive evaluation model can be designed to evaluate the diverse soil application types in soil environment, specifically, an in-depth analysis of the factors which could affect soil quality of Hebei province can be performed in the future.
Author Contributions
Conceptualization, Y.W. and Z.H.; methodology, Z.H. and J.T.; validation, F.M. and J.T.; formal analysis, J.T.; writing—original draft preparation, Z.H.; writing—review and editing, F.M.; supervision, Y.W. All authors have read and agreed to the published version of the manuscript.
Funding
This research is funded by the National Social Science Fund of China (No. 18BGL272).
Conflicts of Interest
The authors declare no conflict of interest.
References
- Teng, Y.; Wu, J.; Lu, S.; Wang, Y.; Jiao, X.; Song, L. Soil and soil environmental quality monitoring in China: A review. Environ. Int. 2014, 69, 177–199. [Google Scholar] [CrossRef]
- Bünemann, K.E.; Bongiorno, G.; Bai, Z.; Creamer, R.E.; de Deyn, G.; de Goede, R.; Fleskens, L.; Geissen, V.; Kuyper, T.W.; Mäder, P.; et al. Soil quality—A critical review. Soil Biol. Biochem. 2018, 120, 105–125. [Google Scholar] [CrossRef]
- Bao, H.; Hou, S.; Niu, H.; Tian, K.; Liu, X.; Wu, F. Status, sources, and risk assessment of polycyclic aromatic hydrocarbons in urban soils of Xi′an, China. Environ. Sci. Pollut. Res. 2018, 25, 18947–18959. [Google Scholar] [CrossRef] [PubMed]
- Zheng, X.; Li, C.; Li, D. Assessment of potential ecological hazard of heavy metals in farmland based on GIS. Adv. Mater. Res. 2011, 414, 83–87. [Google Scholar] [CrossRef]
- Sun, Y.; Duan, L. Heavy metals contamination and health risk assessment of crops in the piedmont of Qinling Mountains. In Proceedings of the 2010 International Conference on Mechanic Automation and Control Engineering, Wuhan, China, 26–28 June 2010. [Google Scholar]
- Deng, H.; Gu, T.; Li, M. Comprehensive assessment model on heavy metal pollution in soil. Int. J. Electrochem. 2012, 7, 5286–5296. [Google Scholar]
- Nakajima, T.; Shrestha, R.; Lal, R. On-farm assessments of soil quality in Ohio and Michigan. Soil Sci. Soc. Am. J. 2016, 80, 1020–1026. [Google Scholar] [CrossRef]
- Doran, J.W.; Zeiss, M.R. Soil health and sustainability: Managing the biotic component of soil quality. Appl. Soil Ecol. 2000, 15, 3–11. [Google Scholar] [CrossRef] [Green Version]
- Ditzler, C.A.; Tugel, A.J. Soil quality field tools: Experiences of USDA-NRCS soil quality institute. Agron. J. 2002, 94, 33–38. [Google Scholar] [CrossRef]
- Chu, H.-J.; Lin, Y.-P.; Jang, C.-S.; Chang, T.-K. Delineating the hazard zone of multiple soil pollutants by multivariate indicator kriging and conditioned Latin hypercube sampling. Geoderma 2010, 158, 242–251. [Google Scholar] [CrossRef]
- Doran, J.W.; Coleman, D.C.; Bezdicek, D.F.; Stewart, B.A. Defining Soil Quality for a Sustainable Environment; Soil Science Society of America: Madison, WL, USA, 1994; Volume 35, pp. 3–21. [Google Scholar]
- Karlen, D.L.; Stott, D.E. A framework for Evaluating Physical and Chemical Indicators of Soil Quality; Soil Science Society of America: Madison, WL, USA, 1994; Volume 35, pp. 53–72. [Google Scholar]
- Gaurav, M.; Rossana, M.; Krishna, G.; Pandey, S. Soil quality assessment across different stands in tropical moist deciduous forests of Nagaland, India. J. For. Res. 2019, 30, 1479–1485. [Google Scholar]
- Odunze, C.A.; Wu, J.; Liu, S.; Hanhua, Z.; Tida, G.; Yi, W.; Qiao, L. Soil quality changes and quality status: A case study of the subtropical china region ultisol. Br. J. Environ. Clim. Chang. 2012, 2, 37–57. [Google Scholar] [CrossRef] [PubMed]
- Yan, X.; Luo, X. Assessment of the soil quality by fuzzy mathematics in farmland around a uranium mill-tailing repository in China. Radioprotection 2016, 51, 37–41. [Google Scholar] [CrossRef]
- Webb, J.; Rubio, J.L.; Fullen, M.A. Soil quality and policy: Science and management. Urban Pollut. 2018. [Google Scholar] [CrossRef]
- Zeng, S.; Ma, J.; Yang, Y.; Zhang, S.; Liu, G.; Chen, F. Spatial assessment of farmland soil pollution and its potential human health risks in China. Sci. Total Environ. 2019, 687, 642–653. [Google Scholar] [CrossRef] [PubMed]
- Zhang, P.; Qin, C.; Hong, X.; Kang, G.; Qin, M.; Yang, D.; Pang, B.; Li, Y.; He, J.; Dick, R.P. Risk assessment and source analysis of soil heavy metal pollution from lower reaches of yellow river irrigation in China. Sci. Total Environ. 2018, 633, 1136–1147. [Google Scholar] [CrossRef]
- Yang, Q.; Li, Z.; Lu, X.; Duan, Q.; Huang, L.; Bi, J. A review of soil heavy metal pollution from industrial and agricultural regions in China: Pollution and risk assessment. Sci. Total Environ. 2018, 642, 690–700. [Google Scholar] [CrossRef]
- European Environmental Agency. Europe’s Environment: The Second Assessment; Elsevier Science Ltd.: Oxford, UK, 1998. [Google Scholar]
- Rapport, D.; Friend, A. Towards a comprehensive framework for environmental statistics: A stress-response approach. Minist. Supply Serv. Can. 1979. [Google Scholar]
- Shadiya, F.; Shareef, A. Application of DPSIR framework to explore effectiveness of solid waste management in the Maldives. J. Biomed. Eng. Med. Imaging 2020, 7, 10–17. [Google Scholar] [CrossRef]
- Wenqi, W.; Yuhong, S.; Jing, W. Environmental warning system based on the DPSIR model: A practical and concise method for environmental assessment. Sustainability 2018, 10, 1728. [Google Scholar]
- Tscherning, K.; Helming, K.; Krippner, B.; Sieber, S.; Paloma, S.G. Does research applying the DPSIR framework support decision making? Land Use Policy 2012, 29, 102–110. [Google Scholar] [CrossRef]
- Wang, Z.; Zhou, J.; Loaiciga, H.; Guo, H.; Hong, S. A DPSIR model for ecological security assessment through indicator screening: A case study at dianchi lake in China. PLoS ONE 2015, 10, e0131732. [Google Scholar] [CrossRef]
- Zhang, F.; Zhang, J.; Wu, R.; Ma, Q.; Yang, J. Ecosystem health assessment based on DPSIRM framework and health distance model in nansi lake, China. Stoch. Environ. Res. Risk Assess. 2016, 30, 1235–1247. [Google Scholar] [CrossRef]
- Cui, X. Calculation and analysis of China’s industrial index. Econ. Rev. 2003, 6, 44–47. [Google Scholar]
- Hakanson, L. An ecological risk index for aquatic pollution control: A sediment logical approach. Water Res. 1980, 14, 975–1001. [Google Scholar] [CrossRef]
- Xu, Q.; Ni, S.; Tuo, X.; Cheng-Jiang, Z. Calculation of heavy metals’ toxicity coefficient in the evaluation of potential ecological risk index. Environ. Sci. Technol. 2008, 31, 112–115. [Google Scholar]
- Technical Guidelines for Risk Assessement of Containmented Sites. Available online: http://www.mee.gov.cn/ywgz/fgbz/bz/bzwb/jcffbz/201402/t20140226_268358.shtml (accessed on 15 April 2020).
- United Stated Environmental Protection Agency. Explore Factors Handbook 2011 Edition (Final). Available online: https://cfpub.epa.gov/ncea/risk/recordisplay.cfm?deid=236252 (accessed on 15 April 2020).
- Saaty, T.L. The Analytic Hierarchy; McGraw-Hill Process: New York, NY, USA, 1980. [Google Scholar]
- Tian, J.; Huo, Z.; Ma, F.; Gao, X.; Wu, Y. Application and selection of remediation technology for OCPs-contaminated sites by decision-making methods. Int. J. Environ. Res. Public Health 2019, 16, 1888. [Google Scholar] [CrossRef] [PubMed] [Green Version]
- Vaclav, S. Energy and the environment—A delphi forecast. Long Range Plan. 1972, 5, 27–32. [Google Scholar]
- Sun, Y.; Liang, X.; Xiao, C. Assessing the influence of land use on groundwater pollution based on coefficient of variation weight method: A case study of Shuangliao city. Environ. Sci. Pollut. Res. Int. 2019, 26, 34964–34976. [Google Scholar] [CrossRef]
- Wang, Z.; Wang, C.; Wang, Z. The hazard analysis of water inrush of mining of thick coal seam under reservoir based on entropy weight evaluation method. Geotech. Geol. Eng. 2018, 36, 3019–3028. [Google Scholar] [CrossRef]
- Awolusi, O.; Nasr, M.; Kumari, S.; Bux, F. Principal component analysis for interaction of nitrifiers and wastewater environments at a full-scale activated sludge plant. Int. J. Environ. Sci. Technol. 2018, 15, 1477–1490. [Google Scholar] [CrossRef]
- Soil Environmental Quality Risk control Standard for Soil Contamination of Agricultural Land. Ministry of Ecology and Environment of Peoples’ Republic of China, 1 August 2018. Available online: http://www.mee.gov.cn/ywgz/fgbz/bz/bzwb/trhj/201807/t20180703_446029.shtml (accessed on 12 January 2020).
- Soil Environmental Quality Risk Control Standard for Soil Contamination of Development Land. Ministry of Ecology and Environment of Peoples’ Republic of China, 1 August 2018. Available online: http://www.mee.gov.cn/ywgz/fgbz/bz/bzwb/trhj/201807/t20180703_446027.shtml (accessed on 12 January 2020).
Figure 1.
Soil environmental quality assessment system based on the Driving Force-Pressure-State-Impact-Response (DPSIR) model.
Figure 1.
Soil environmental quality assessment system based on the Driving Force-Pressure-State-Impact-Response (DPSIR) model.

Figure 2.
A hierarchical model of soil environmental quality assessment.


Table 1.
Explanation of evaluation indicators.
| Module | Indicator | Indicator Explanation |
|---|---|---|
| D1 Driving force | X1 Industrialization index | Industrialization development level, indicating the driving force of industrial development |
| X2 Population density/person·km−2 | The ratio of the total population to the land area, indicating population pressure | |
| D2 Pressure | X3 Industrial wastewater discharge per unit GDP/ton·10,000 yuan−1 | The ratio of industrial wastewater discharge to GDP, indicating pollution pressure |
| X4 Organic emissions per unit GDP/g·10,000 yuan−1 | The ratio of organic emissions to GDP, indicating industrial pollution pressure | |
| X5 Regular metal emissions per unit GDP/g·10,000 yuan−1 | The ratio of heavy metal emissions to GDP, indicating industrial pollution pressure | |
| X6 Ammonia nitrogen emissions per unit of GDP/kg·10,000 yuan−1 | The ratio of ammonia nitrogen emissions to GDP, indicating industrial pollution pressure | |
| X7 NOx emissions per unit GDP/kg·10,000 yuan−1 | The ratio of nitrogen oxide emissions to GDP, indicating industrial pollution pressure | |
| X8 Fertilizer application intensity/kg·hm2 | The ratio of the total amount of chemical fertilizer applied to the total area of cultivated land, indicating the pressure of agricultural pollution | |
| X9 Pesticide application intensity/kg·hm2 | The ratio of the total amount of pesticide application to the total area of cultivated land, indicating the pressure of agricultural pollution | |
| X10 Annual average air quality index/ug·m−3 | The annual average concentration of PM2.5 | |
| D3 Status | X11 Heavy metal pollution index | Calculated by the Nemerow index, indicating the state of heavy metal pollution in soil |
| X12 Organic pollution index | Calculated by the Nemerow index, indicating the state of organic pollution | |
| D4 Impact | X13 Potential ecological risk index | Calculated by Equation (2), indicating the ecological risk effect caused by heavy metals |
| X14 Human health risk index | Calculated by Equation (4), indicating the human health impact caused by soil pollution | |
| D5 Response | X15 Environmental protection investment as a percentage of GDP/% | The ratio of environmental protection investment to GDP |
| X16 Industrial wastewater reuse rate/% | The industrial wastewater reuse rate | |
| X17 Attainment rate of industrial wastewater discharge/% | The ratio of industrial wastewater discharge to industrial wastewater discharge | |
| X18 Attainment rate of industrial gas discharge/% | The ratio of industrial waste gas discharge to industrial waste gas emissions |
Table 2.
Heavy metal toxicity response coefficient.
| Heavy Metal | Cd | As | Hg | Cu | Pb | Cr | Zn |
|---|---|---|---|---|---|---|---|
| Toxicity response coefficient | 30 | 10 | 40 | 5 | 5 | 2 | 1 |
Table 3.
Human health risk assessment parameter reference value.
| Exposure Parameter | Name/Unit | Industrial/Agricultural Land | Residential Land | ||
|---|---|---|---|---|---|
| Children | Adults | ||||
| IR | Soil intake/(mg·d−1) | 100 | 200 | 100 | |
| Air intake/(m3·d−1) | 14.5 | 7.5 | 14.5 | ||
| CF | Conversion facto/(kg·mg−1) | 10−6 | 10−6 | 10−6 | |
| EF | Exposure frequency/(d·a−1) | 250 | 350 | 350 | |
| ED | Exposure period/a | 25 | 6 | 24 | |
| BW | Human body weight/kg | 56.8 | 15.9 | 56.8 | |
| AT | Average action time/d | Carcinogenic | 26,280 | 26,280 | |
| Non-carcinogenic | 9125 | 2190 | |||
| SA | Skin area that may contact the soil/(cm2·d−1) | 2855 | 2450 | 5075 | |
| AF | Soil adsorption coefficient to skin/(mg·cm−2) | 0.2 | 0.2 | 0.07 | |
| PEF | Soil dust diffusion factor/(m3·kg−1) | 1.316 × 10⁹ | 1.316 × 10⁹ | 1.316 × 10⁹ | |
Table 4.
Relative importance values of the indices.
| Scaling | 1 | 3 | 5 | 7 | 9 |
|---|---|---|---|---|---|
| Importance of the two factors | Equal | Slightly important | Important | Very important | Extremely important |
| 2, 4, 6 and 8 are the intermediate values | |||||
The criterion layer contains D1 to D5, and the indicator layer corresponds to X1 to X18, a total of 18 indicators. We construct 4 matrices in the indicator layer. Since the importance of X11~X14 is equally the same in our evaluation, we set them to 0.5000.
Table 5.
Weights of evaluation indicators.
| Target Layer | Criteria Layer | Weights | Indicator Layer | Weight |
|---|---|---|---|---|
| T | D1 | 0.0673 | X1 | 0.8173 |
| X2 | 0.1827 | |||
| D2 | 0.2312 | X3 | 0.1394 | |
| X4 | 0.2329 | |||
| X5 | 0.2465 | |||
| X6 | 0.0781 | |||
| X7 | 0.0709 | |||
| X8 | 0.1322 | |||
| X9 | 0.0635 | |||
| X10 | 0.0367 | |||
| D3 | 0.4057 | X11 | 0.5000 | |
| X12 | 0.5000 | |||
| D4 | 0.1649 | X13 | 0.5000 | |
| X14 | 0.5000 | |||
| D5 | 0.1309 | X15 | 0.1893 | |
| X16 | 0.2148 | |||
| X17 | 0.4914 | |||
| X18 | 0.1046 |
Table 6.
Standardized scores of evaluation indicators.
| Evaluation Indicator | Standardized Score Range | |||
|---|---|---|---|---|
| (0.75, 1] | (0.5, 0.75] | (0.25, 0.5] | (0, 0.25] | |
| X1 Industrialization index | ≤2.5 | (2.5, 5] | (5, 7.5] | (7.5, 10] |
| X2 The population density/person·km−2 | ≤150 | (150, 240] | (240, 480] | (480, 900] |
| X3 Industrial wastewater discharge per unit GDP/ton·10,000 yuan−1 | ≤2 | (2, 2.5] | (2.5, 3.5] | (3.5, 10] |
| X4 Organic emissions per unit GDP/g·10,000 yuan−1 | ≤10 | (10, 45) | (45, 70] | (70, 150] |
| X5 Regular metal emissions per unit GDP/g·10,000 yuan−1 | ≤0.1 | (0.1, 0.5) | (0.5, 1] | (1, 3] |
| X6 Ammonia nitrogen emissions per unit GDP/kg·10,000 yuan−1 | ≤0.1 | (0.1, 0.35] | (0.35, 0.7] | (0.7, 1] |
| X7 NOx emissions per unit GDP/kg·10,000 yuan−1 | ≤1 | (1, 5] | (5, 10] | (10, 20] |
| X8 Fertilizer application intensity/kg hm2 | ≤250 | (250, 400] | (400, 550] | (550, 900] |
| X9 Pesticide application intensity/kg hm2 | ≤5 | (5, 10] | (10, 15] | (15, 30] |
| X10 Annual average air quality index/ug·m−3 | ≤35 | (35, 45] | (45, 60] | (60, 100] |
| X11 Heavy metal pollution index | ≤0.7 | (0.7, 1.5] | (1.5, 3] | (3, 7] |
| X12 Organic pollution index | ≤0.7 | (0.7, 1.5) | (1.5, 3] | (3, 7] |
| X13 Potential ecological risk index | ≤150 | (150, 500) | (500, 1000] | (1000, 2000] |
| X14 Human Health Risk Index (total cancer risk) | ≤10−6 | (10−6, 10−5] | (10−5, 10−4] | (10−4, 10−3] |
| X15 Environmental protection investment as a percentage of GDP/% | (3, 7] | (2, 3] | (1, 2] | ≤1 |
| X16 Industrial wastewater reuse rate/% | (95, 100] | (80, 95] | (65, 80] | <65 |
| X17 Attainment rate of industrial wastewater discharge/% | (95, 100] | (90, 95] | (80, 90] | <80 |
| X18 Attainment rate of industrial gas emission rate/% | (95, 100] | (90, 95] | (80, 90] | <80 |
Table 7.
Scores of 18 indicators of Hebei Province.
| Target Layer | Criterion Layer | Indicator | Original Value vi | Standard Value | Weighted Value | Criterion Layer Value | Weighted |
|---|---|---|---|---|---|---|---|
| T Agricultural land: 0.5815 Industrial land: 0.5127 | D1 | X1 | 3.04 | 0.70 | 0.5721 | 0.6324 | 0.0426 |
| X2 | 402 | 0.33 | 0.0603 | ||||
| D2 | X3 | 3.16 | 0.34 | 0.0474 | 0.3697 | 0.0855 | |
| X4 | 65 | 0.30 | 0.0699 | ||||
| X5 | 0.51 | 0.49 | 0.1208 | ||||
| X6 | 0.45 | 0.43 | 0.0336 | ||||
| X7 | 7.13 | 0.39 | 0.0277 | ||||
| X8 | 494 | 0.34 | 0.0449 | ||||
| X9 | 13.66 | 0.32 | 0.0203 | ||||
| X10 | 77 | 0.14 | 0.0051 | ||||
| D3 | X11 Agricultural | 1.41 | 0.53 | 0.2650 | 0.5850 | 0.2373 | |
| X12 Agricultural | 1.06 | 0.64 | 0.3200 | ||||
| X11 Industrial | 2.35 | 0.36 | 0.1800 | 0.4150 | 0.1684 | ||
| X12 Industrial | 1.71 | 0.47 | 0.2350 | ||||
| D4 | X13 | 203 | 0.71 | 0.3550 | 0.7200 | 0.1187 | |
| X14 | 1.5 × 10⁻⁵ | 0.73 | 0.3650 | ||||
| D5 | X15 | 0.02 | 0.01 | 0.0019 | 0.7440 | 0.0974 | |
| X16 | 91 | 0.68 | 0.1461 | ||||
| X17 | 100 | 1 | 0.4914 | ||||
| X18 | 100 | 1 | 0.1046 |
Table 8.
Heavy metal pollution status.
| Land Type | Nemerow Index of Heavy Metal Pollution | Pollutants | ||
|---|---|---|---|---|
| Max. Value | Min. Value | Avg. Value | ||
| Agricultural | 2.13 | 0.43 | 1.41 | lead, zinc, copper |
| Industrial | 3.01 | 0.72 | 2.35 | |
Table 9.
Organic pollution status.
| Land Type | Nemerow Index of Organic Pollution | Pollutants | ||
|---|---|---|---|---|
| Max. Value | Min. Value | Avg. Value | ||
| Agricultural | 1.83 | 0.06 | 1.06 | Benzo [a] anthracene, benzo[b]fluoranthene[BbF] |
| Industrial | 2.38 | 0.15 | 1.71 | Benzo [a] anthracene, benzo[a]pyrene |
© 2020 by the authors. Licensee MDPI, Basel, Switzerland. This article is an open access article distributed under the terms and conditions of the Creative Commons Attribution (CC BY) license (http://creativecommons.org/licenses/by/4.0/).
Share and Cite
MDPI and ACS Style
Huo, Z.; Tian, J.; Wu, Y.; Ma, F. A Soil Environmental Quality Assessment Model Based on Data Fusion and Its Application in Hebei Province. Sustainability 2020, 12, 6804. https://0-doi-org.brum.beds.ac.uk/10.3390/su12176804
AMA Style
Huo Z, Tian J, Wu Y, Ma F. A Soil Environmental Quality Assessment Model Based on Data Fusion and Its Application in Hebei Province. Sustainability. 2020; 12(17):6804. https://0-doi-org.brum.beds.ac.uk/10.3390/su12176804
Chicago/Turabian StyleHuo, Zheng, Junping Tian, Yanbin Wu, and Fengjiao Ma. 2020. "A Soil Environmental Quality Assessment Model Based on Data Fusion and Its Application in Hebei Province" Sustainability 12, no. 17: 6804. https://0-doi-org.brum.beds.ac.uk/10.3390/su12176804
Note that from the first issue of 2016, this journal uses article numbers instead of page numbers. See further details here.