Residents’ Spatial Perceptions of Urban Gardens Based on Soundscape and Landscape Differences

1
College of Tourism, Shanghai Normal University, Shanghai 200234, China
2
Economic Development Research Center, National Forestry and Grassland Administration, Beijing 100714, China
3
School of Economics and Management, Beijing Forestry University, Beijing 100083, China
*
Author to whom correspondence should be addressed.
Sustainability 2020, 12(17), 6809; https://0-doi-org.brum.beds.ac.uk/10.3390/su12176809
Submission received: 13 July 2020
/
Revised: 12 August 2020
/
Accepted: 19 August 2020
/
Published: 21 August 2020
Abstract
:In this study, four types of urban gardens, namely modern commercial, cultural heritage, historical preservation, and natural and ecological areas, were comprehensively described and analyzed based on soundscape and landscape differences, and a multinomial logit model was used to explore potential influencing factors shaping residents’ preferences regarding urban gardens. The results suggest that variations in soundscape are closely related to the characteristics of the garden areas and the timing of residents’ activities; the noise level measurements at different observation points varied considerably according to the time of day and displayed different trends. Residents strongly preferred natural sounds, and traffic noise was the most disliked category of sound. Further, a negative correlation was found between residents’ subjective perception of loudness and the favorability of the area, while a clear positive correlation existed between the degree of favorability and the degree of landscape-soundscape coordination. Regarding landscape differences, residents generally preferred urban gardens without artificial transformation and prioritized the maintenance of natural landscaping and the historical and cultural heritage of urban gardens. In particular, residents’ preferences reflected the trade-offs between natural and artificial forms of urban gardens. These results offer useful information for planners, developers, and governmental organizations related to urban gardens by providing data to design urban gardens with increased practical value and natural benefits.
1. Introduction
Urban gardens, via their internal landscape, environment, and spatial structure, satisfy important needs of city residents. They are important components of urban environmental construction, which serves to improve the quality of urban ecological environments and residents’ quality of life [1,2]. Urban gardens are deeply involved in the residents’ daily lives, thus embodying the relationship between human and nature. Existing research mainly focuses on the functions and services provided by urban gardens, including improving the quality of the ecological environment, meeting residents’ daily needs, and improving residents’ health [3,4,5]. Since people express different preferences regarding the landscape and structure of urban gardens, data-driven approaches to urban garden design should be employed to promote residents’ mental and physical health [6,7]. However, residents’ preferences are also impacted by the different spatial characteristics and usage patterns of urban gardens, which have also been addressed by many researchers [8,9]. On the other hand, as residents’ preferences change, the planning and decision-making processes related to urban gardens are also changing [10]. Therefore, it is of great academic and practical significance to understand residents’ preferences regarding urban gardens and relevant influencing factors.
Previous studies have identified challenges in scientifically investigating individual preferences. For example, many attributes cannot exist and operate independently of each other, and their function can exercise cross influence on other attributes [11,12]. Similarly, individual preferences are heterogeneous due to individual and family characteristics and degree of specialization. Regarding individual preferences for urban gardens, planners and architects often face trade-offs between various elements and styles. First, urban gardens have natural attributes that form the basis for their various functions. Contact with nature has been confirmed to positively impact human emotions, cognition, behavior, and physical health [13,14]. Accordingly, urban gardens not only function to improve urban ecological environments but also as a form of social service. When people interact with nature in urban gardens, they are often engaged in some type of recreational activity, which promotes their physical and mental health. Thus, the human-engineered forms of urban gardens can also fill important roles [15,16,17,18,19]. In a few words, urban garden designs should seek a balance between the natural and artificial environments to achieve optimal results so as to better adapt to the various individual preferences.
Beyond the consideration of landscape differences in urban gardens, soundscape differences have already received attention in current research. Granö, a Finnish geographer, first proposed the word soundscape in 1929 as an analogy of the word landscape to describe the sound environment that people experience in a physical space [20]. In 1976, Schafer, a Canadian composer and ecologist, proposed the concept of a soundscape; that is, a sound environment considered with an emphasis on individual or social perceptions and understanding [21]. It is obvious that sound is a constant presence in natural and social environments. The existence of some sounds helps to create a comfortable environment and positive individual experiences [22,23]. However, adverse factors, such as noise pollution, also impact human experiences [24,25]. In summary, existing research frames the soundscape in two ways. One is the soundscape produced by human society (the social soundscape), the other is the sum of numerous sounds heard by human beings in the natural environment (the natural soundscape). As is known to all, human beings cannot exist independently without the natural environment and, similarly, individual development is inseparable from society. Therefore, a discussion of the soundscape should consider both the natural and social soundscapes and prioritize the essential needs and preferences of individuals. Besides, more attention should be paid to fostering harmonious relationships between the soundscape and landscape and between the soundscape and people through comprehensive and in-depth investigations. In addition, as a reflection of differences between Eastern and Western cultures, soundscapes in Chinese classical gardens are designed to express emotion and to embody an artistic conception. Therefore, research on the design and optimization of urban garden soundscapes, changes in these soundscapes, and the relationship between individuals’ perception of a space and the soundscape reflect topical concerns in China.
Existing research topics on soundscape and landscape factors in urban gardens are relatively extensive, covering many aspects, such as structure, design and layout [26]. At present, however, most existing research has compared and discussed the impact of natural versus artificial environments; such studies are typically descriptive discussions, lacking objective quantitative measurements. Therefore, this study arises from the assumption that simply dividing the natural and artificial environment into two parts is unlikely to provide in-depth insights into why a given environment is beneficial to human well-being [27]. Meanwhile, in recent years, many studies have investigated individual soundscape and landscape preferences, particularly the influencing factors affecting such individual preferences, including age or education level [28,29,30]. Individual preferences have also been tied to social status and to economic, cultural, and social capital [31,32]. Therefore, a study of residents’ preferences regarding urban gardens must be combined with a detailed assessment of the interactions between their individual characteristics and the qualities and variations of soundscapes and landscapes.
No previous research has comprehensively addressed the relationship between individual attributes and the advantages and disadvantages of different urban garden forms or the relationship between landscape variations, soundscape variations, and residents’ preferences and choices. This study addresses the following questions. How can soundscape and landscape differences be comprehensively considered to determine urban garden classifications? Do residents prefer natural or artificial urban landscapes or both? Given different individual characteristics, what are the types and degrees of public preferences for urban gardens? In this study, natural and artificial urban garden forms are integrated into four schemes according to soundscape and landscape characteristics to measure residents’ preferences. The Yu Garden area in Shanghai was selected as the research area for this micro-level study of public cognition and selection. Based on data obtained via a field soundscape test, questionnaire surveys, and interviews, residents’ spatial perceptions of urban gardens were comprehensively analyzed based on soundscape and landscape differences, and a multivariate logit selection model was used to analyze residents’ preferences regarding urban garden types and relevant influencing factors. This study explores the relationship between different urban garden types and factors, including residents’ individual, family, and professional characteristics; further, the probability that given residents will prefer different urban garden forms was estimated. This study aimed to highlight the important social, economic, and ecological roles of urban gardens and to explore practical urban garden designs, thus providing useful information for planners, developers, and governmental staff. Furthermore, this study could serve as the basis for the construction of urban gardens with greater practical value and natural ecological benefits.
2. Materials and Survey Design
2.1. Study Areas and Observation Points
As this study aimed to heighten understanding of public preferences for different urban garden types, the selected research site was a typical urban garden located in the downtown area of Shanghai: Yu Garden. Yu Garden is located in the northeast of Shanghai’s old city area and is a famous classical garden in China’s Yangtze river valley area. It was built during the Ming Dynasty and covers more than 30 acres. Yu Garden was opened to the public in 1961 and was listed as a national key cultural relic protection unit by China’s State Council in 1982. As the city developed, especially through continuous expansion and growth in its downtown area, the Yu Garden and nearby blocks have become the most prosperous tourist and shopping area in Shanghai. Today, the Yu Garden area mainly includes two parts: the natural landscape area and the historical architectural area. The garden has natural functions, such as climate regulation, water resource conservation, and soil and water maintenance. The garden also has social functions, including recreation, historical structure preservation, and commercial endeavors. These broad functions reflect the unity of nature and society in the contemporary Yu Garden.
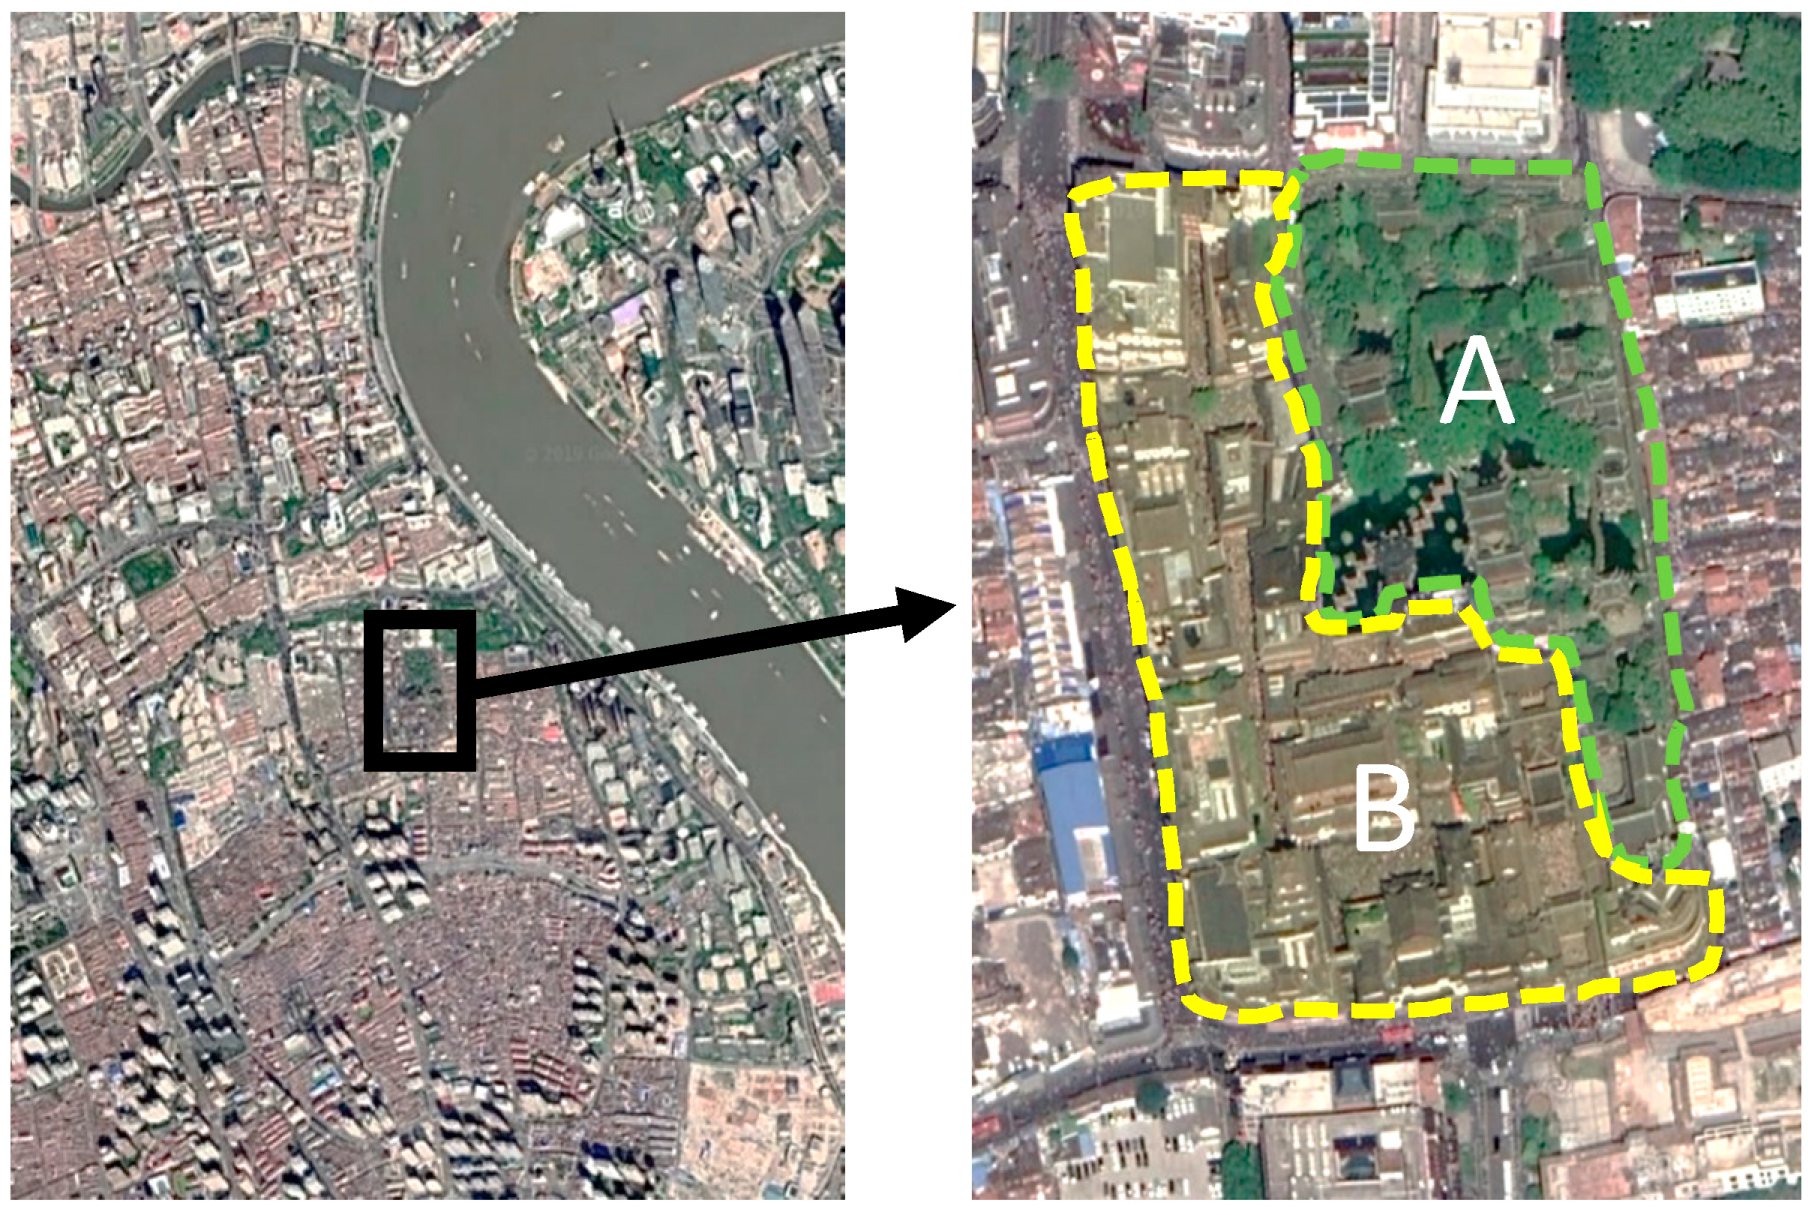
In terms of landscape variations, two general types of landscapes exist in Yu Garden and nearby blocks: the area labeled “A” in Figure 1 depicts a primitive classical garden area. The area has higher vegetation coverage, more natural elements, better preservation of historical sites, and lighter traces of artificial transformation compared to the other area. Its main functions include rest and relatively passive appreciation; the area labeled “B” is a transformed commercial area. To some extent, this area maintains the sense of history of the urban garden, but its natural character is weaker and its main functions include commerce, shopping, and urban sightseeing. From the perspective of soundscape, we believe that, as the most typical urban garden in Shanghai, Yu Garden retains a good natural landscape and has various social attractions that integrate ecology and entertainment. Its sound-scenery resources are abundant. Secondly, climate conditions in Shanghai mean that Yu Garden experiences relatively little seasonal variation outside of some special seasonal activities. Thus, use of and activity in Yu Garden does not significantly vary due to seasonal changes, and the soundscape of Yu Garden is relatively unaffected by outside factors. Therefore, this site was determined to be ideal for a field investigation and a subjective and objective evaluation of the effects of soundscape and landscape differences.
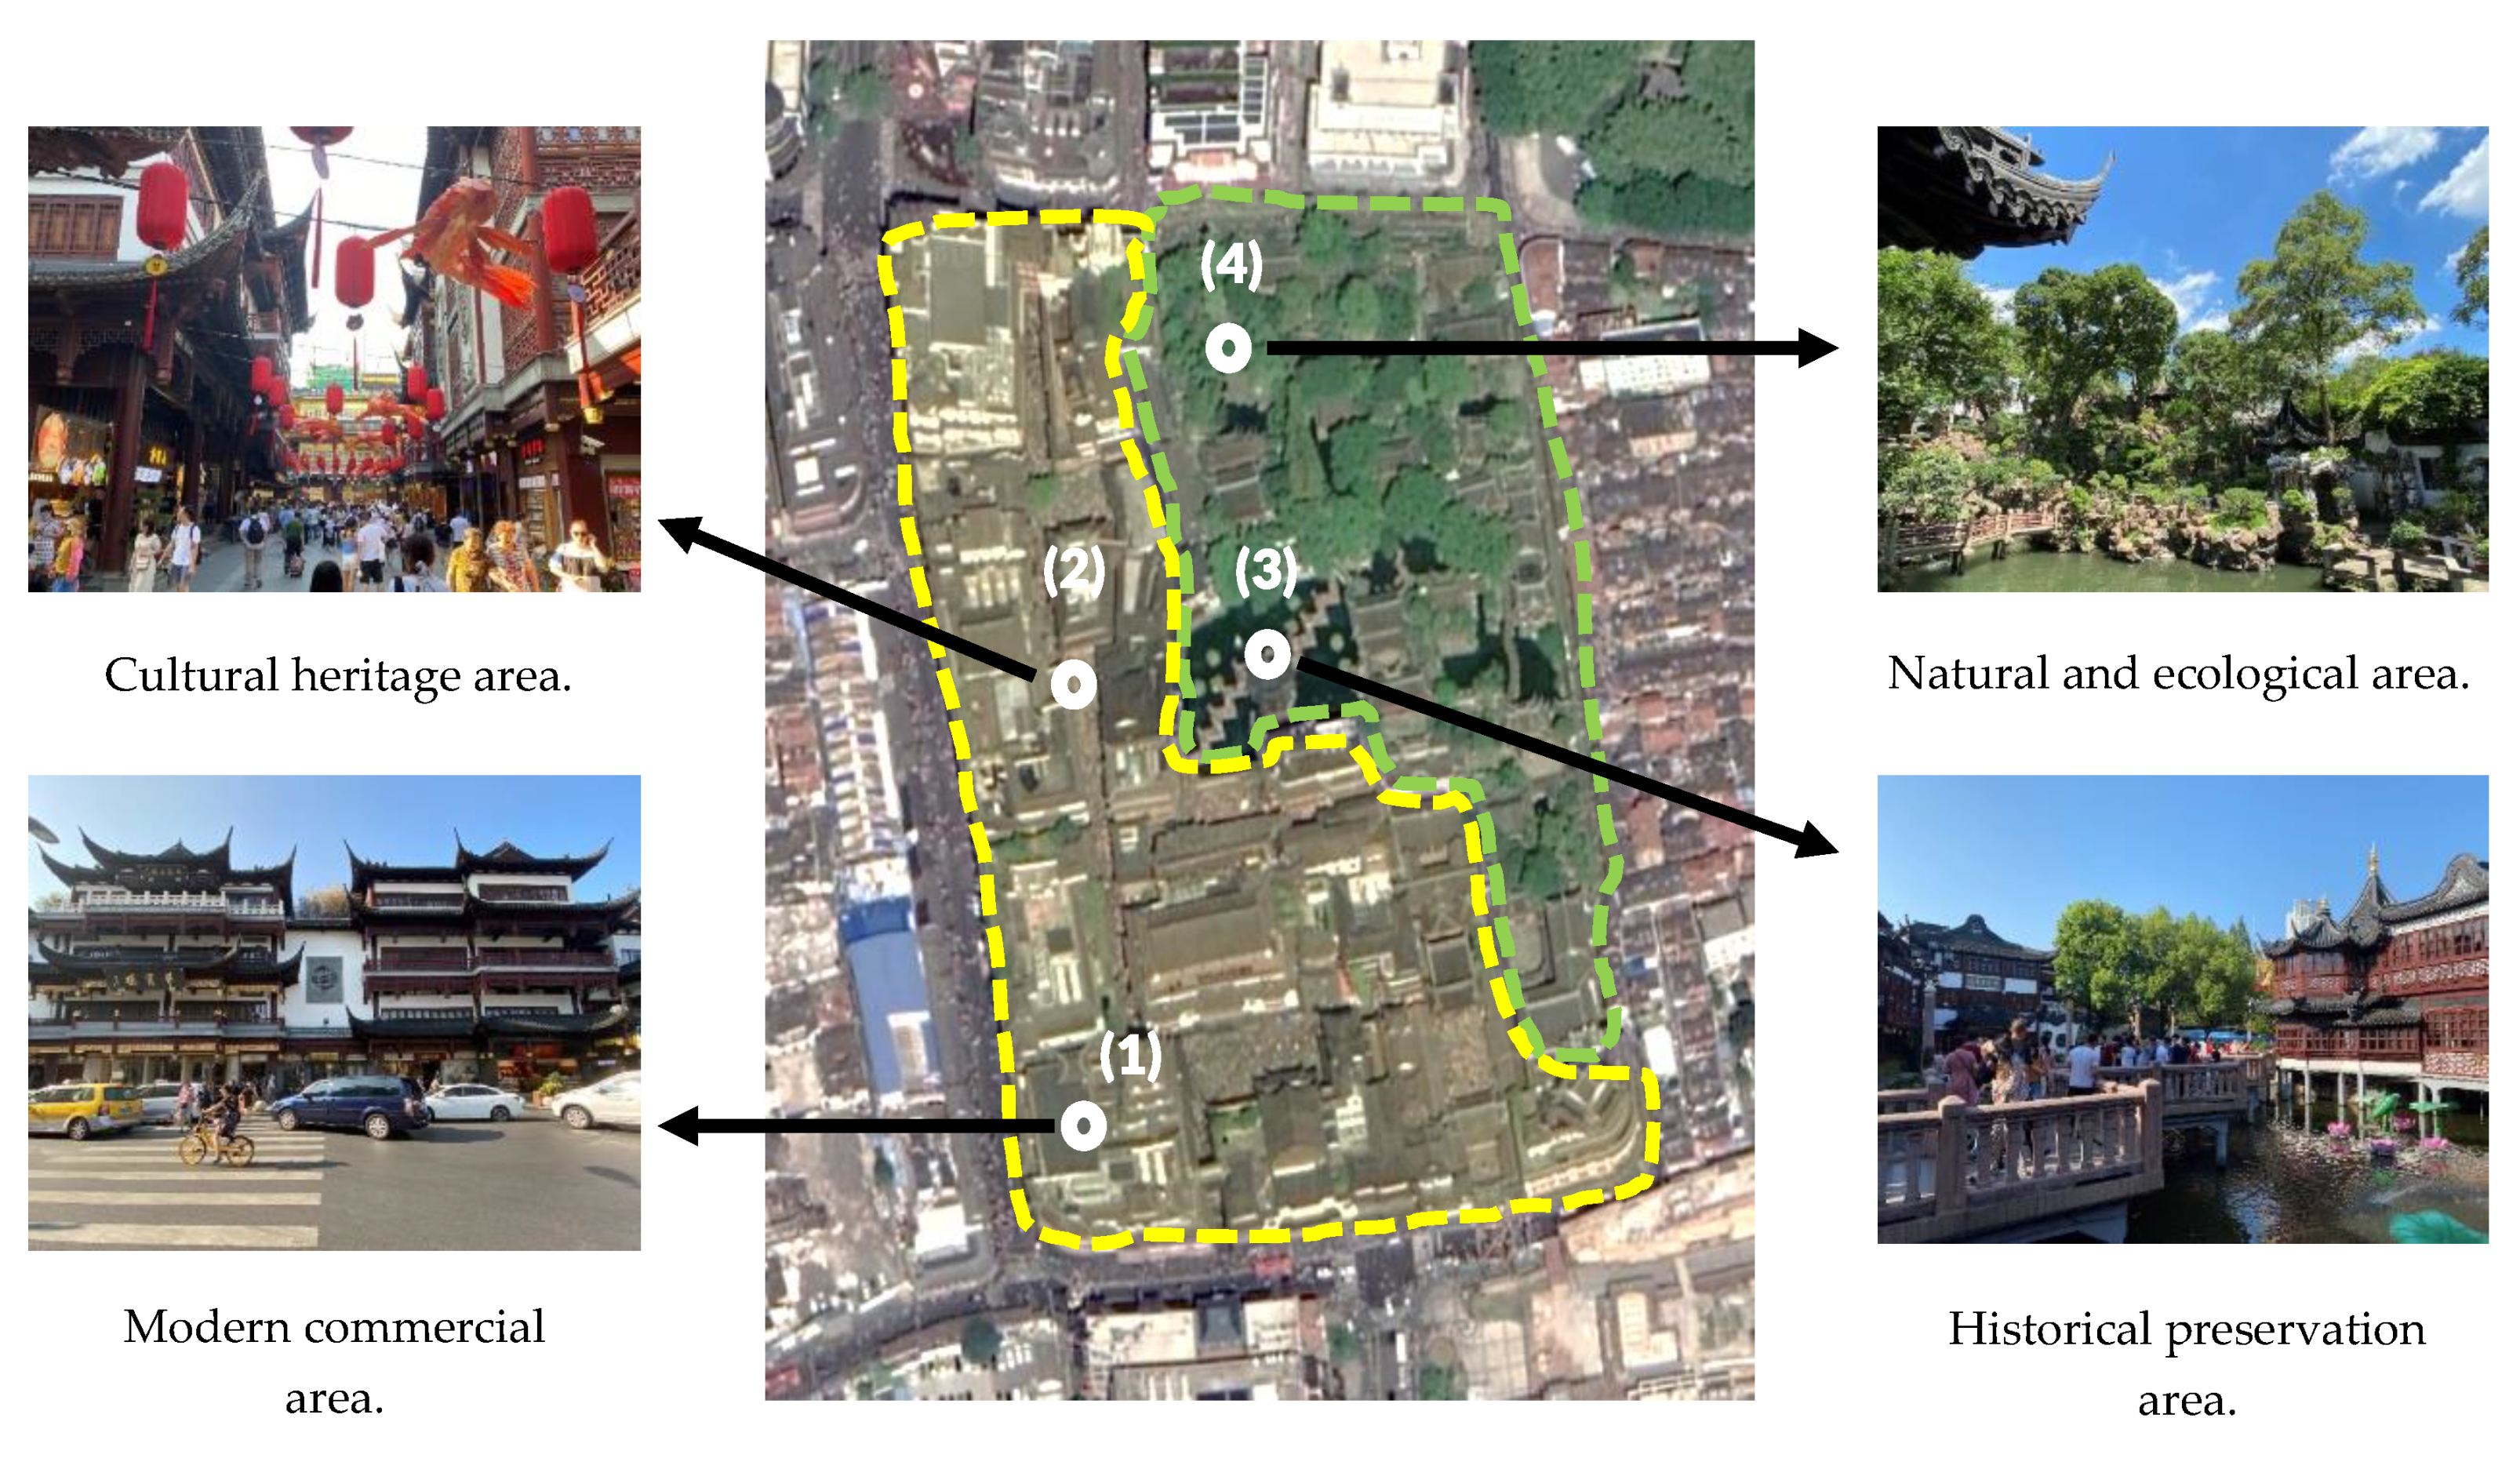
The study selected four representative scenic spots in Yu Garden as observation points, and their distribution is shown in Figure 2. To reveal the trade-offs between residents’ perceptions of artificial and natural environments and to explore their needs concerning the two types of areas, this study further divided the two types of areas into four specific urban garden forms as shown in Figure 2 [15].
(1) Modern commercial area. This garden form is generally located on both sides of main roads and includes a large construction area. This garden form functions to fully serve the daily business-related needs of modern society (including commerce and shopping). The relationship between such areas and the urban garden itself is not obvious, but by virtue of its advantageous location in the core area of the city, close to the urban garden and a dense area of resources and people, such areas represent high-grade, modern business districts. Traffic and peddling noise can be substantial in such areas; such sounds are among the most noticeable characteristics of the soundscape in these environments. The above characteristics of such areas are more prominent in large and mega cities, and these garden forms are important space carriers involved in the social and economic functions of cities. These areas can be considered to reflect the characteristics of modern urban commercial development and their integration within traditional urban landscapes.
(2) Cultural heritage area. Overall, this garden form combines modern and traditional elements. These unique areas rely on their scenic setting to conduct business activities and obtain economic benefits. Accordingly, this garden has heavy artificial elements and, in addition to its general commercial and shopping functions, it also highlights cultural heritage in the areas surrounding an urban garden. Due to heavy business activity and people flow, the sound environment of such areas can be noisy. One important trend in contemporary commercial development is based around historical blocks; such development relies on famous scenic areas and sites in historical blocks, leveraging local nostalgia and attachment to these sites. Thus, the customs and characteristics of such areas are often consistent with the cultural elements encapsulated in the scenic areas (such as the Yu Garden area), allowing cultural heritage areas to produce unique economic benefits and attract large numbers of people.
(3) Historical preservation area. This garden form highlights the historical relics and buildings within urban gardens and emphasizes history and the humanities. Yu Garden, for example, represents a traditional Chinese garden with a history spanning more than 400 years and is located in the old city area. Within Shanghai, this area has the densest population, the most developed social economy, and the most abundant tourism resources. Therefore, Yu Garden is not only an outstanding example of China’s traditional gardens but has also become a well-known tourist attraction in Shanghai due to its unique cultural and natural landscape resources. It has been a long-standing focus of tourists and local residents. Thus, historical preservation areas are undoubtedly one of the most important parts of contemporary urban gardens. Since such areas are mainly the site of sightseeing activities, noise levels are relatively low. However, considering the large number of people passing through Yu Garden, the sound environment in such areas may vary throughout the day.
(4) Natural and ecological area. This garden form also represents the natural landscape area contained within urban gardens, though more emphasis is placed on the original ecological and natural environment without artificial decoration and transformation. Given the ongoing progression of urbanization and the rapid increase in the urban population, various kinds of urban environmental problems continually emerge, and the residents’ demand for natural ecological environments within urban areas is also increasing. Therefore, the more central the garden’s location within a city, the more attention the original ecological and natural environment of the garden receives, and the role played by such areas should not be underestimated. Among the four garden types, the sound environment of natural and ecological areas is the quietest. However, increasing urbanization and growing urban populations have caused some changes in the soundscapes of this garden type, which are one of the main concerns of this study.
In summary, to explore the potential influencing factors on residents’ preferences for urban garden types, this study first conducted a survey and descriptive statistical analysis of residents’ preferences. Then, it considered the four urban garden forms above as dependent variables within an econometric model and used multiple logit models to measure and analyze the preferences of residents regarding different urban garden forms.
2.2. Questionnaire and Experimental Design
This study designed a questionnaire in three steps: (1) the first draft of the questionnaire was developed based on a literature analysis, expert interview, and research group discussion, and the content of the questionnaire was determined to reflect the core issues of the study, and (2) the questionnaire was tested and revised. In this study, questions and responses with low reliability and validity were identified and eliminated via presurvey activities to improve the overall quality of the questionnaire, and (3) the questionnaire was revised, finalized, and applied for resident data collection.
Regarding individual preferences, early studies by Abello and Bernaldez (1986) found a significant correlation between some aspects of personality and preferences [33]. In the present study, residents’ preferences may be affected by their individual functional variables and individual structural variables (gender, age, occupation, etc.), their social and cultural political variables (income, social status, etc.), and some spatial variables (residential location, distance, etc.). Further, residents’ preferences will also be affected by their degree of specialization (frequency of going to urban gardens and expenditure in urban gardens). Therefore, this study designed a questionnaire based on existing research with the aim of collecting relevant data comprehensively, practically, and objectively [34,35]. The questionnaire included surveys on three main topics, including interviewees’ individual characteristics, family characteristics, and professional characteristics (Table 1). Specifically, during the professional characteristics survey, based on the static and spatial varying characteristics of soundscapes among different urban garden forms, the general perception of the Yu Garden soundscape was further discussed based on the favorability degree, subjective loudness, and landscape-soundscape coordination. Among them, the favorability degree refers to the extent to which something is viewed as desirable, subjective loudness concerns the perceived loudness of different sound elements (reflecting the different sensitivities of human ears to sound intensity), and the landscape-soundscape coordination degree explores the extent to which a single soundscape element can be attributed to specific landscape elements in the environment. These three indicators were measured on a Likert five-point scale.
The core principles of the questionnaire design in this study were efficiency and comprehensiveness. The questionnaire was designed to be as concise and clear as possible to obtain the data needed for the research and to ensure the accuracy of the data, thereby improving the response rate and effectiveness of the questionnaire. The investigators are all graduate students with professional backgrounds and field investigation experience. They had received systematic training on research methods and data collection before they started their work. At the same time, this study adopted a face-to-face approach in the specific investigation process, and investigators gave appropriate explanations to the questions that arose in the questionnaire at any time. After the survey, the research group cross-checked the questionnaire three times to ensure the quality of the survey data. When implemented, the average completion time of a comprehensive and qualified questionnaire was about 35–45 min. In summary, the questionnaire content was designed to reflect the logical framework of the paper, thus improving the systematization and validity of the questionnaire and the efficiency of the overall survey.
In October 2019, formal and supplementary investigations were conducted and questionnaires were issued. As the questionnaire involved quantitative research aiming to infer broad trends through the analysis of sample data, the representativeness of samples and the quality of data both needed to be strong. In light of the complexity of the resident group, this study employed a combination of stratified and random sampling to select participants to improve sample representativeness and reduce sampling errors. Specifically, this study used random sampling to select the interviewees in different survey locations to ensure the randomness and representativeness; at the same time, a face-to-face investigation method was adopted, allowing investigators to properly explain questions that arose during the questionnaire. After the investigation, the research group confirmed the quality of the collected data by cross-checking the questionnaire three times.
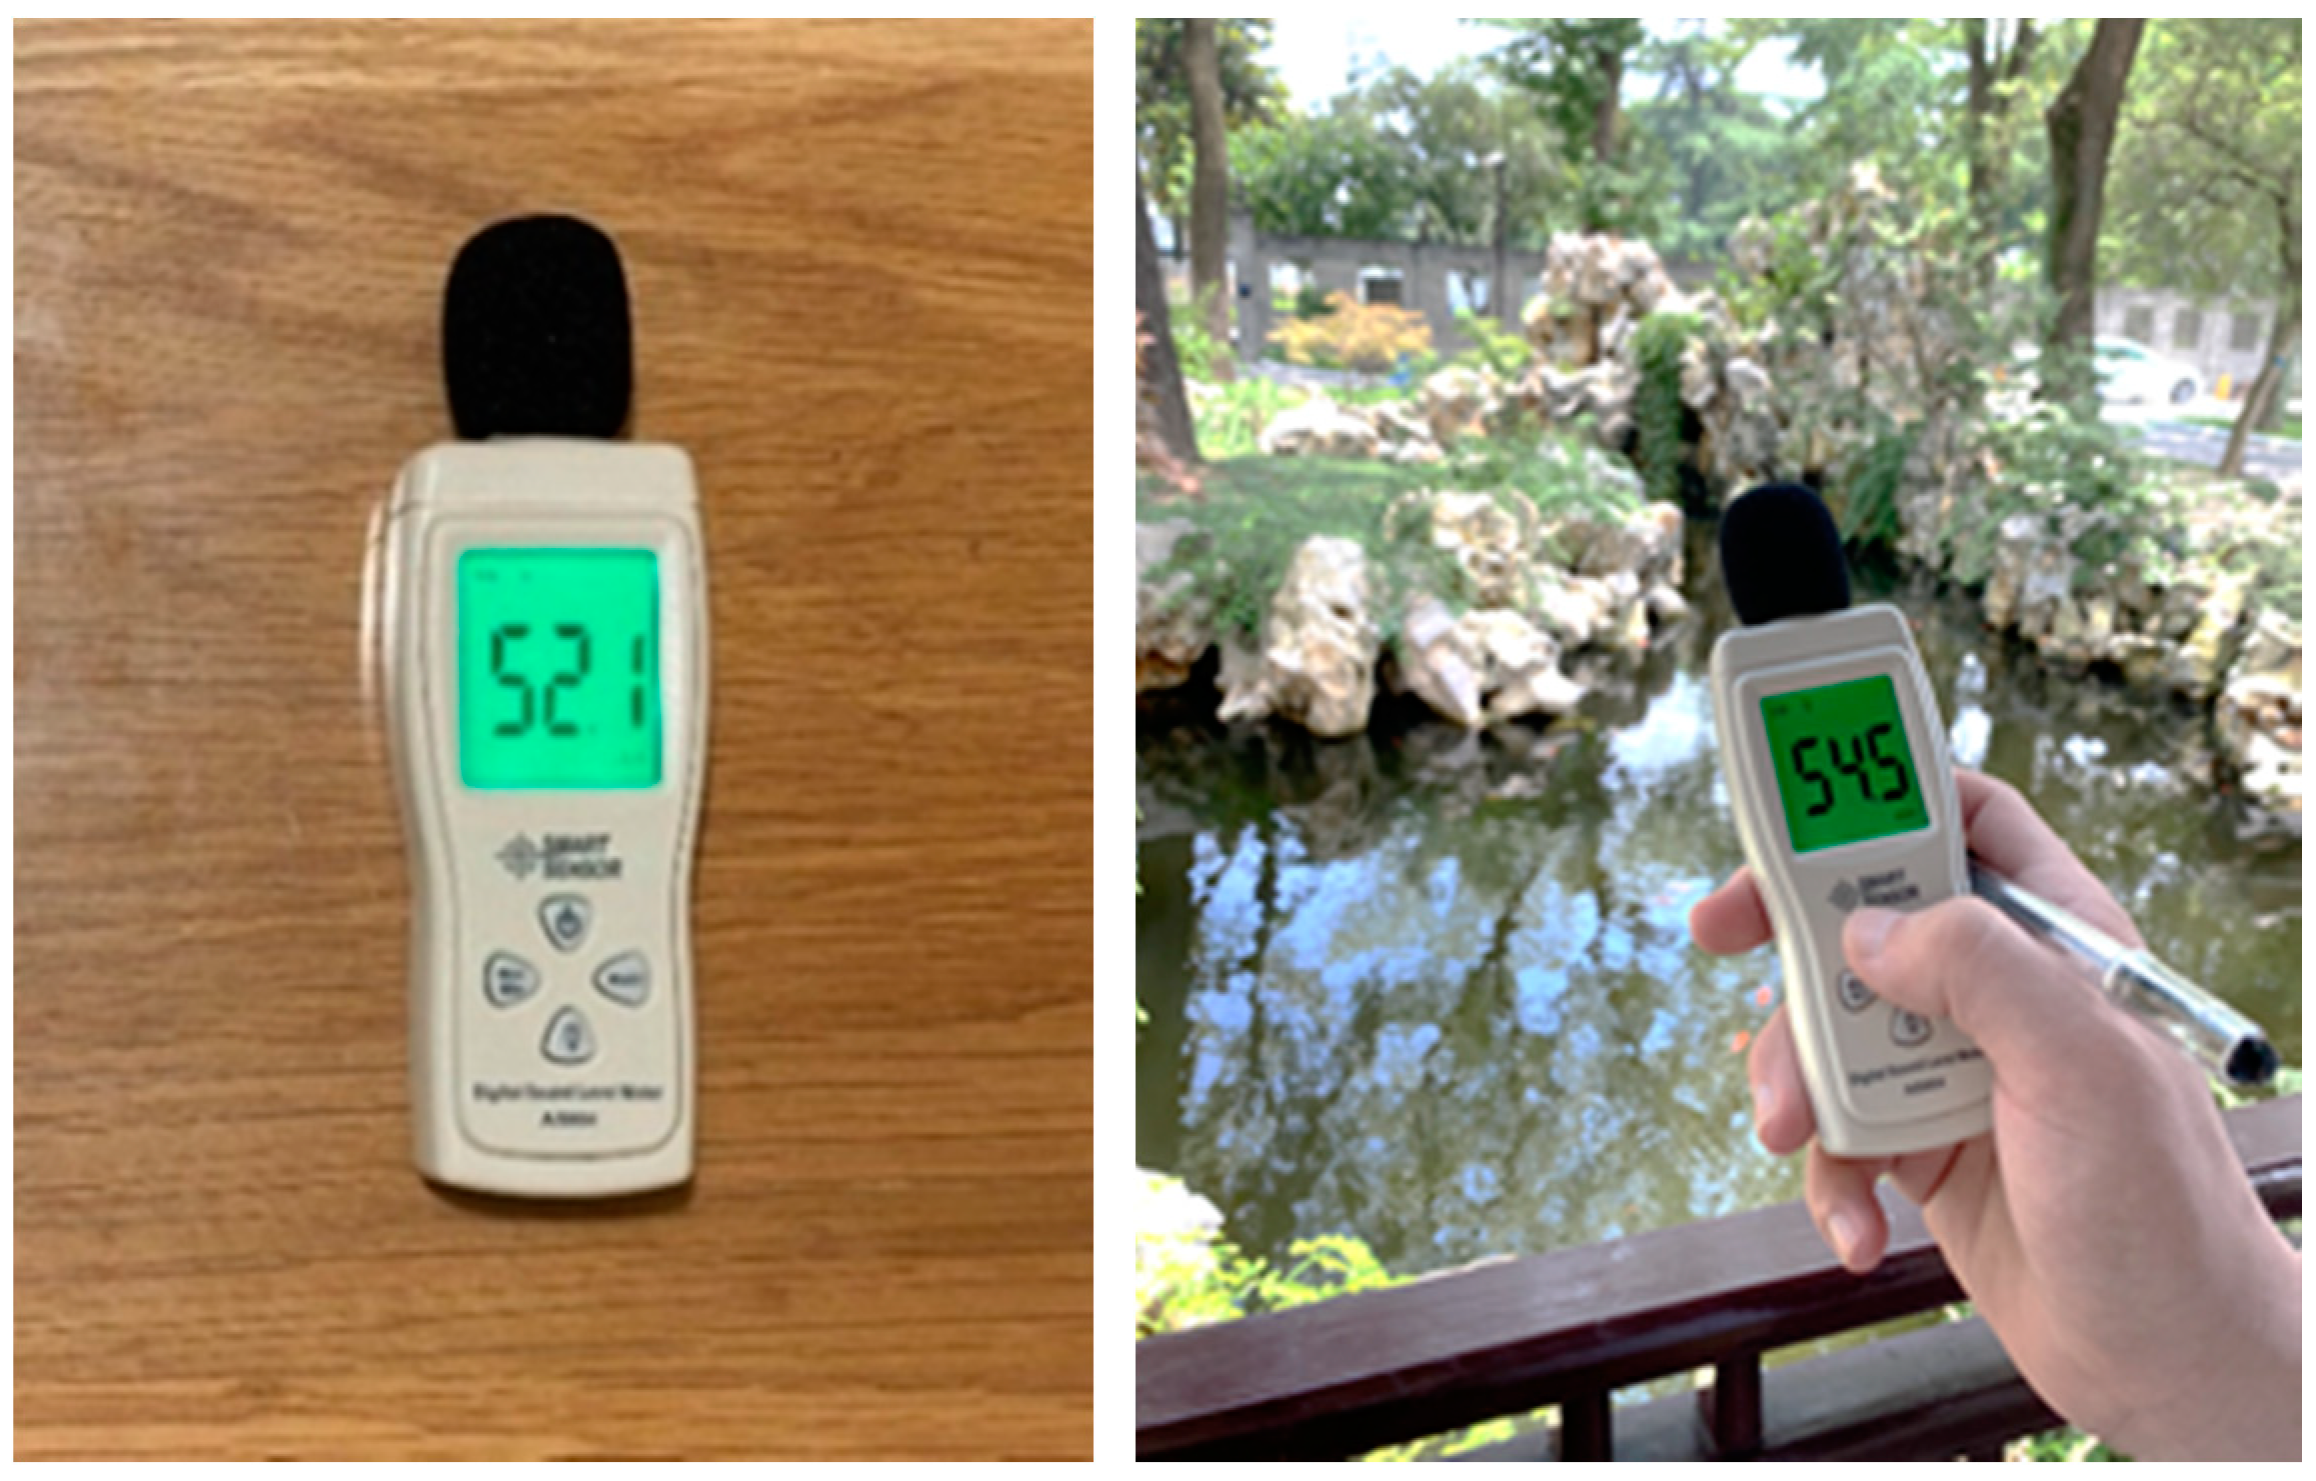
In the field investigation of sound characteristics, a Smart Sensor Digital Sound Level Meter AS804 was employed (Figure 3). The sound-level measurement range was 30–130 dBA, and an A-weighted sound-level meter was used to reflect the degree of subjective loudness due to the objective intensity and frequency of noise. The higher the index value of A sound levels, the greater the harm caused by the noise. Therefore, in the survey of the Yu Garden sound environment, the A sound level was used as the main indicator in the objective soundscape assessment.
As the Yu Garden is open from 9:00 to 15:00, the measurement time is divided into five two-hour segments: 7:00–9:00, 9:00–11:00, 11:00–13:00, 13:00–15:00, and 15:00–17:00. Because the sound levels were extremely sensitive to environmental factors, the sound-level meter was used to measure sound levels repeatedly at each measurement point. Thus, sound-level data was measured at least three times and sampled for at least 10 s at each observation point. Finally, the average values of all measured sound-level data at each observation point were taken as the final sound-level measurement results. In addition, field measurements should be performed under good weather conditions without rain, snow, or lightning, and the influence of wind speed on the measured values should be considered. This study was conducted under wind speeds of less than 5 m/s. In this study, the use of sound level meter to obtain data is very efficient and fast, which is also the convenience of modern equipment for empirical research.
2.3. Statistical Analyses
This study constructed a disordered multiple logit selection model for data analysis and compared the disordered selections of residents regarding various urban garden forms. The disordered multiple logit model was employed for two reasons: first, the four urban garden forms that were treated as dependent variables were disorderly arranged, and the urban garden form selected by Shanghai residents was also disordered; second, the function of the choice model used to solve such problems was similar. Therefore, this study used a multivariate logit model for analysis. Specifically, a multiple logit regression involves more than two kinds of nominal response variables and is composed of multiple formulas in which (j + 1) response variables produce j formulas, each of which compares a binary logit regression with the control group. In addition, in a multiple logit regression, the above-mentioned j binary logit regression is estimated at the same time. In this study, option 4 (a purely natural garden area) was set as the control group, and options 1, 2, and 3 were set as the experimental groups. By comparing the probability between the selection of the experimental group and the control group, the research conclusion was revealed.
Based on the above framework, P(yi = j) was set as the probability of the experimental group, P(yi = 0) as the probability of the control group, and β as the logarithm probability of the experimental group for the control group. Then, the multiple logit model form of the study was set as:
In the estimation of the above formula, the coefficient of the control group was nominally set to zero because the probability of various options needed to be unified. Based on the established multivariate logit model, the following probability relative reference groups were obtained:
After the transformation of form, the above formula can also be expressed as:
In addition, corresponding calculation methods were used for parameter estimation in the disordered multivariate logit selection model. For resident I, if option j is selected, then dij is set as 1; if option j is not selected, then dij is set as 0. At the same time, for the resident I, only one of all (j + 1) alternative options can be selected; that is, only one dij = 1 can exist. Based on this, the joint probability function of yij (I = 1, 2, …, n; j = 0, 1, 2, …, j) was obtained, as well as the final log likelihood function:
It should be pointed out that the fitting test and independent test should be carried out on the original data before the logit estimation. Among them, the significance level of variables can reflect whether they have significant contribution to the model and whether it is meaningful to study them; the significance level of the likelihood ratio can be used to explain whether the model can better explain the research problem. The Cox and Snell coefficient and Nagelkerke coefficient can show how well the model explains the variation of original variables and whether the options of four urban garden forms conform to the independent hypothesis that their utility is independent of each other. Only when the above conditions are satisfied, the logit model can be used to estimate the parameters.
3. Results
3.1. Participant Background
In October 2019, the project team conducted the formal investigation and supplementary investigations and issued 1350 questionnaires. The final number of qualified questionnaires was 1274, with an effective recovery rate of 94.37% (Table 2). Among all the respondents, the proportion of males and females was relatively balanced. More than 60% of the respondents were about 21–40 years old, and the proportion of the elderly was relatively low. More than 70% of the respondents had a high school education or above. The vast majority of respondents had family size of three or more, and the proportion of respondents with a household income below 15,000 yuan every month was close to 65%, indicating that the proportion of the middle-income group was the largest. At the same time, Shanghai is an inclusive and open city. In recent years, the population from other places has gradually increased. More than 70% of the respondents had lived in Shanghai for only 10 years or less. In addition, although the distance between residents’ families and urban gardens is acceptable, the frequency of their visits to urban gardens and the corresponding consumption was less, which initially reflects the lack of residents’ perception and utilization of urban gardens. Therefore, the causes of relevant problems should be analyzed and studied.
3.2. Soundscape-Related Preferences
The Yu Garden is the most remarkable urban garden in Shanghai city. Its soundscape has many distinctive features which can be generally classified into three categories: natural sounds, human sounds, and artificial sounds. First, natural sounds mainly include birdsong, leaf movements, and wind and water sounds. Among them, birdsong is the most widely distributed. At the same time, water sounds are relatively minor because the lake inside Yu Garden has still water, and few man-made waterfalls and other waterscapes are in the garden. Therefore, the sound of running water is mostly obscured by the sound of traffic and noise. Second, human sounds in Yu Garden include those associated with conversation, play, peddling, and entertainment activities. Such sounds are mainly attributable to the various recreational activities of residents, and these human sounds are the most salient feature of the Yu Garden soundscape. Third, artificial sounds in Yu Garden include traffic, construction, and music and entertainment equipment sounds, which are quite common in urban gardens. Given Yu Garden’s prominence and location in downtown Shanghai, roads surrounding Yu Garden has high traffic volumes. Therefore, the traffic noise around the Yu Garden is substantial, and it mixes with municipal construction noise, the noise of surrounding merchants conducting business, and sounds produced by the entertainment equipment in the garden. Thus, artificial sound levels are high around Yu Garden and considerably influence the soundscape.
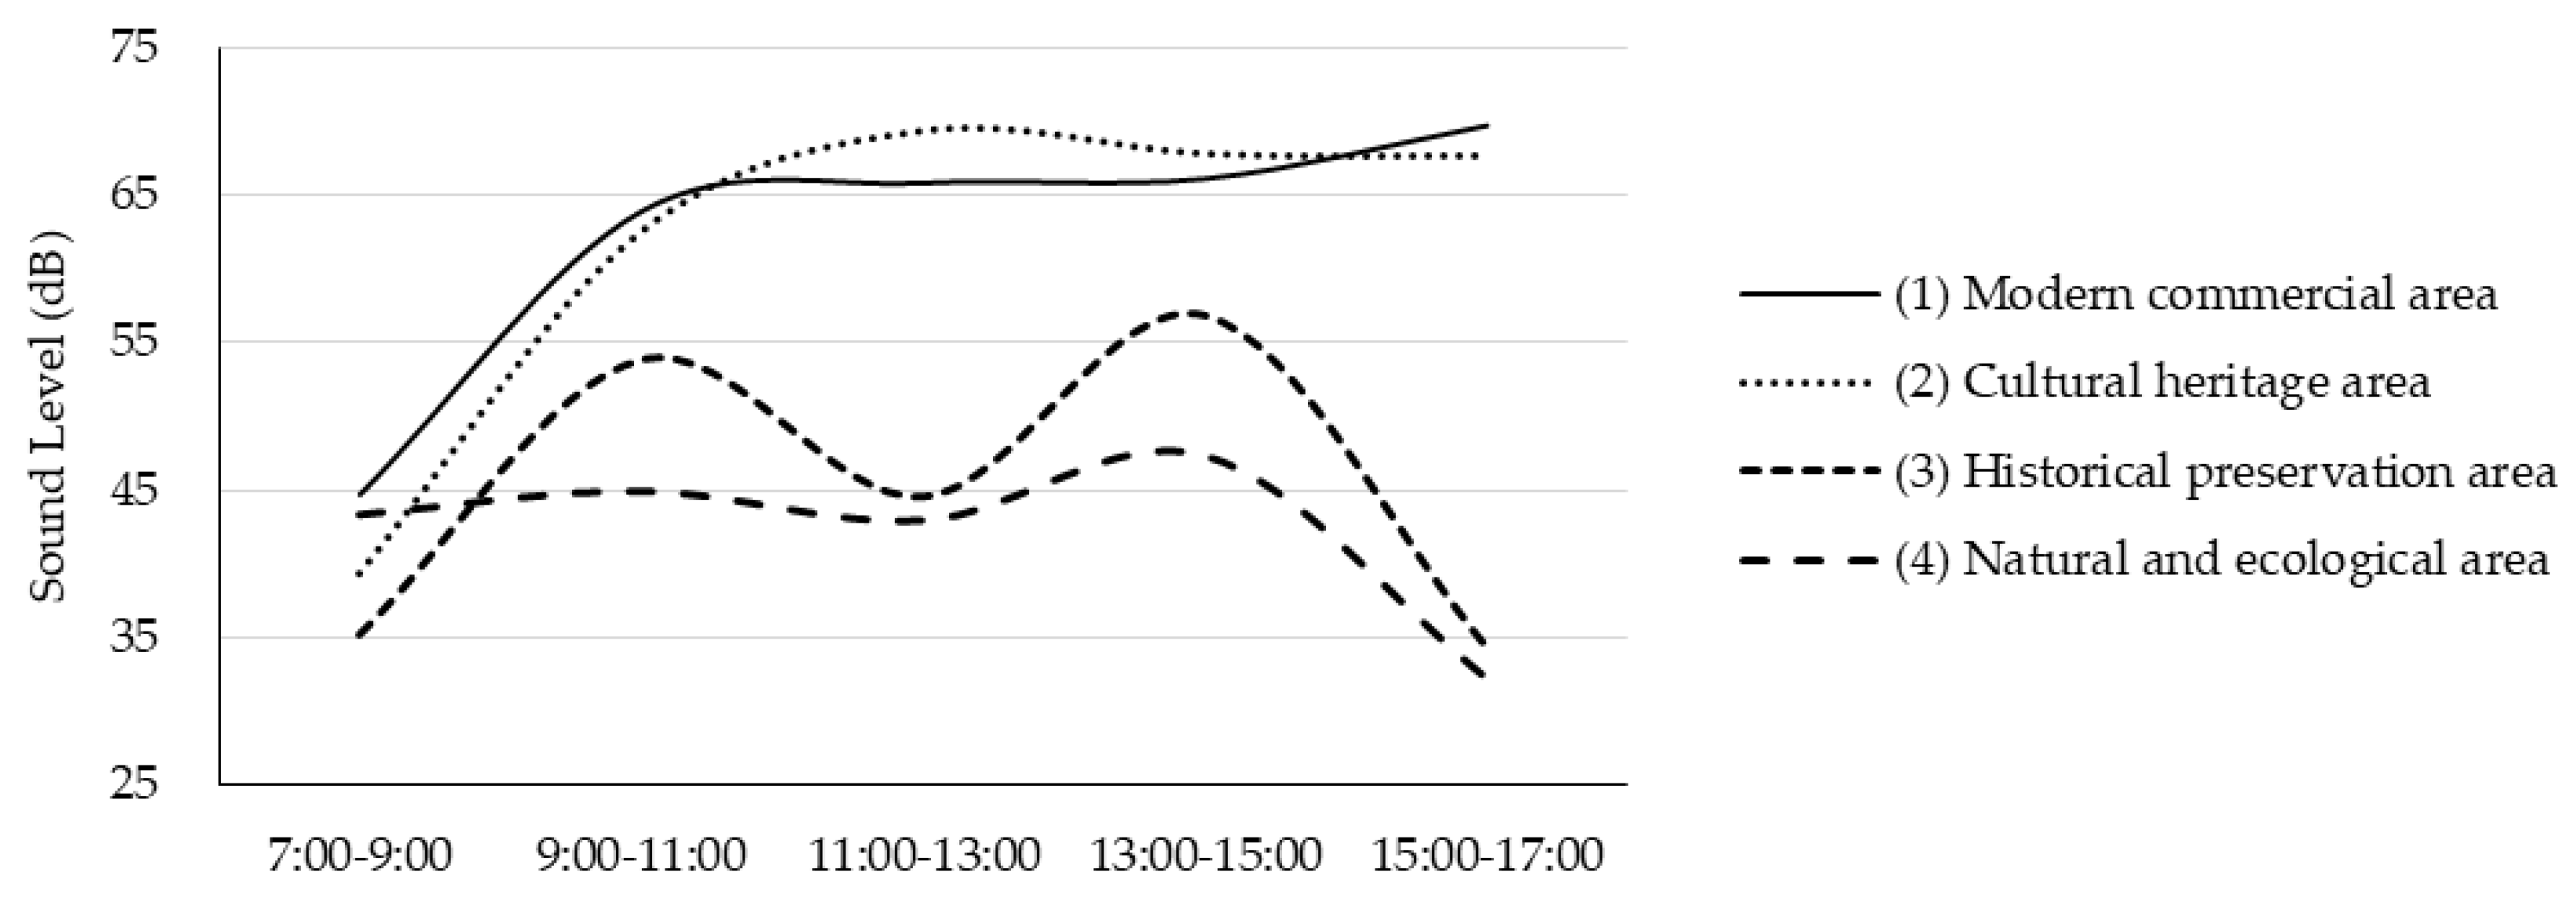
The field survey results show that temporal variation in the Yu Garden soundscape is closely related to the garden’s functional attributes and the public’s usage patterns. This formal research was mainly conducted in October 2019, which included the China National Day holiday. Thus, the characteristics of the Yu Garden soundscape were more obvious and the results yielded were more consistent. To fully capture the soundscape characteristics in the four garden forms, the sound levels at four observation points were measured. The sound level refers to both the physical quantity of sound, measured in decibels (dB), and visitors’ subjective perception of sound intensity. Because changes in soundscape reflect the Yu Garden’s characteristics and residents’ activity patterns, the sound-level results at different observation points varied considerably with the time of day. Overall, the sound levels in the historical preservation area and natural and ecological area were consistently below 60 dB and thus conformed to city noise-level regulations, but the sound levels in the modern commercial area and cultural heritage area exceeded this threshold. From a temporal perspective, the overall sound level of the modern commercial area and cultural heritage area displayed a gradual upward trend, and that of the historical preservation area and natural and ecological area presented an M-shaped trend. In both cases, these changes in sound level were related to an increase or decrease in the number of people in Yu Garden at different times throughout the day (Figure 4).
Specifically, (1) from 7:00–9:00 a.m., because the shops around Yu Garden were not yet open, increased numbers of people used the park for morning exercises, and fewer used it for shopping and commerce; at this time, human sounds mainly consisted of sounds associated with middle-aged and older people’s morning exercise, and sound related to conversations was relatively low. Therefore, the overall sound level was relatively low at this time. Natural sounds were most prominent during this period, and these sounds mainly stemmed from the natural and ecological area. Although the sound level in the modern commercial area was relatively high, it was due to the noise from the city’s rush hour; further, this area was adjacent to the main road, so the traffic noise was considerable, though its overall impact was not significant. (2) From 9:00–11:00 a.m., participation in recreational activities increased and shops began to open. Yu Garden’s activities became more diverse and the flow of people increased. Therefore, sounds related to entertainment equipment, playing, and peddling appeared and became dominant elements of Yu Garden’s soundscape. The sound levels of the modern commercial area and cultural heritage area ranged from 62.5–63.9 dB, while that of the historical preservation area and natural and ecological area were generally lower than 50 dB. (3) From 11:00–13:00, residents who arrived in Yu Garden in the morning began to leave. However, a large proportion of the residents concentrated in the modern commercial area and cultural heritage area for lunch and during their lunch breaks, so the sound levels in the historical preservation area and natural and ecological area generally declined. In general, the human sound in Yu Garden dropped below 45 dB. (4) From 13:00–15:00, the number of residents in Yu Garden began to increase again and participation in entertainment activities also increased. Conversation and playing sounds permeated the garden, and the sound level generally increased. The soundscape characteristics in this period were similar to those from 9:00–11:00. (5) From 15:00–17:00, the Yu Garden scenic area approaches closing time, leading the number of residents in the historical preservation area and natural and ecological area to gradually decrease and the sound level to obviously reduce. Accordingly, residents accumulated in the modern commercial area and cultural heritage area to participate in nightlife, and the sound level significantly increased. The modern commercial area and cultural heritage area maintained their noisy and lively soundscapes primarily consisting of human and artificial sounds.
Using a five-point Likert scale, the degree of favorability, subjective loudness, and landscape-soundscape coordination of the Yu Garden soundscape were calculated, as shown in Table 3.
In terms of the degree of favorability, residents preferred natural sounds to human and artificial sounds. Residents’ perception of artificial and human sounds was generally low, and traffic noise (1.23) was regarded as the least popular sound among residents. As Yu Garden is located in the downtown area of Shanghai, its sound environment is greatly influenced by traffic noise. These noises cause residents’ assessment of the soundscape to decline. At the same time, residents’ preference for the historical preservation area and natural and ecological area was slightly lower than for the modern commercial area and cultural heritage area; this suggests that residents generally expect the historical preservation area and natural and ecological area to reduce artificial and human sounds and to highlight natural sounds. Further, in the historical preservation area and natural and ecological area, natural sound was associated with a much higher degree of favorability than in the modern commercial area and cultural heritage area. This indicates that natural sounds in Yu Garden are presently relatively deficient, though the demand for natural sounds is relatively high, reflecting the general desire of residents to be close to nature.
Regarding subjective loudness, the subjective loudness of the modern commercial area and cultural heritage area was lower than that of the historical preservation area and natural and ecological area, though the public tends to prefer natural sounds. Further, the subjective loudness of artificial and human sounds in the modern commercial area and cultural heritage area was higher than that in the historical preservation and natural and ecological areas, though the degree of favorability associated with these sounds was low. These findings can be explained as follows: in the modern commercial area and cultural heritage area, natural sounds were mostly covered by artificial and human sounds. As the characteristics of natural sound are not pronounced enough to meet the needs of residents’ auditory senses, residents’ preference for these soundscapes is relatively low. In particular, the trend curves of subjective loudness and degree of favorability, calculated via the CORREL function in Excel, were very close (r = 0.91) in the natural and ecological area; in the cultural heritage area, the trend curves were quite different (r = 0.38). Table 3 shows that the higher the subjective loudness of artificial sound, the lower the degree of favorability; conversely, the higher the subjective loudness of natural sound, the higher the degree of favorability. This indicates that the subjective loudness will differently impact different kinds of environmental soundscapes. In addition, since residents may not necessarily prefer the sounds that they perceive to be loud, the subjective loudness has no direct impact on their degree of favorability, as the favorability evaluation results may also be affected by other factors, such as the degree of landscape-soundscape coordination.
The four urban garden types had similar degrees of landscape-soundscape in terms of artificial and human sounds, but the coordination degree was lower in the modern commercial area and cultural heritage area than in the historical preservation area and natural and ecological area. In particular, a relatively clear positive correlation was identified between the degree of favorability and the degree of landscape-soundscape coordination, indicating that the soundscape and landscape of an urban garden is experienced as unified whole.
3.3. Landscape-Related Preferences
Based on the survey data, this study analyzed residents’ preferences for urban garden forms. First, residents were invited to select the garden form they most preferred and to rank the garden forms. Second, residents were invited to rate each urban garden form on a five-point scale (1 = negative impression; 5 = positive impression). Residents’ responses are shown in Table 4. The proportion of residents who preferred option 3 (the historical preservation area) was higher than the proportion of residents who preferred the other three options; meanwhile, the overall average score for urban gardens without artificial transformation (options 3 and 4) was higher than that for urban gardens with signs of artificial transformation (options 1 and 2). This indicates that residents generally prefer urban gardens without artificial transformation; that is, they prioritize the natural landscape and the conservation of historical and cultural heritage in urban gardens. In addition, there is a gap between residents’ preferences for cultural heritage area and historical conservation area. One possible reason is that they cannot completely distinguish the differences between the two types of areas, for cultural heritage area and historical conservation area are just the transitional areas with multiple characteristics between modern commercial area and natural and ecological area.
The results suggest that residents generally prefer urban gardens without artificial transformation and prioritize the maintenance of the natural landscape and the historical and cultural heritage of urban gardens. In particular, residents’ preferences reflect the trade-off relationship between natural and commercial urban garden forms. In view of this, it is important to balance the natural and commercial attributes of urban gardens. The research area in this study is a typical urban garden in downtown Shanghai. The interior and surrounding areas of the urban garden reflect various characteristics, including those related to the urban garden itself and those associated with the social and economic life of the city as a whole. Therefore, it is understandable that Shanghai residents’ urban garden preferences reflected a trade-off between natural and commercial environments. Thus, this relationship should be understood as multilevel.
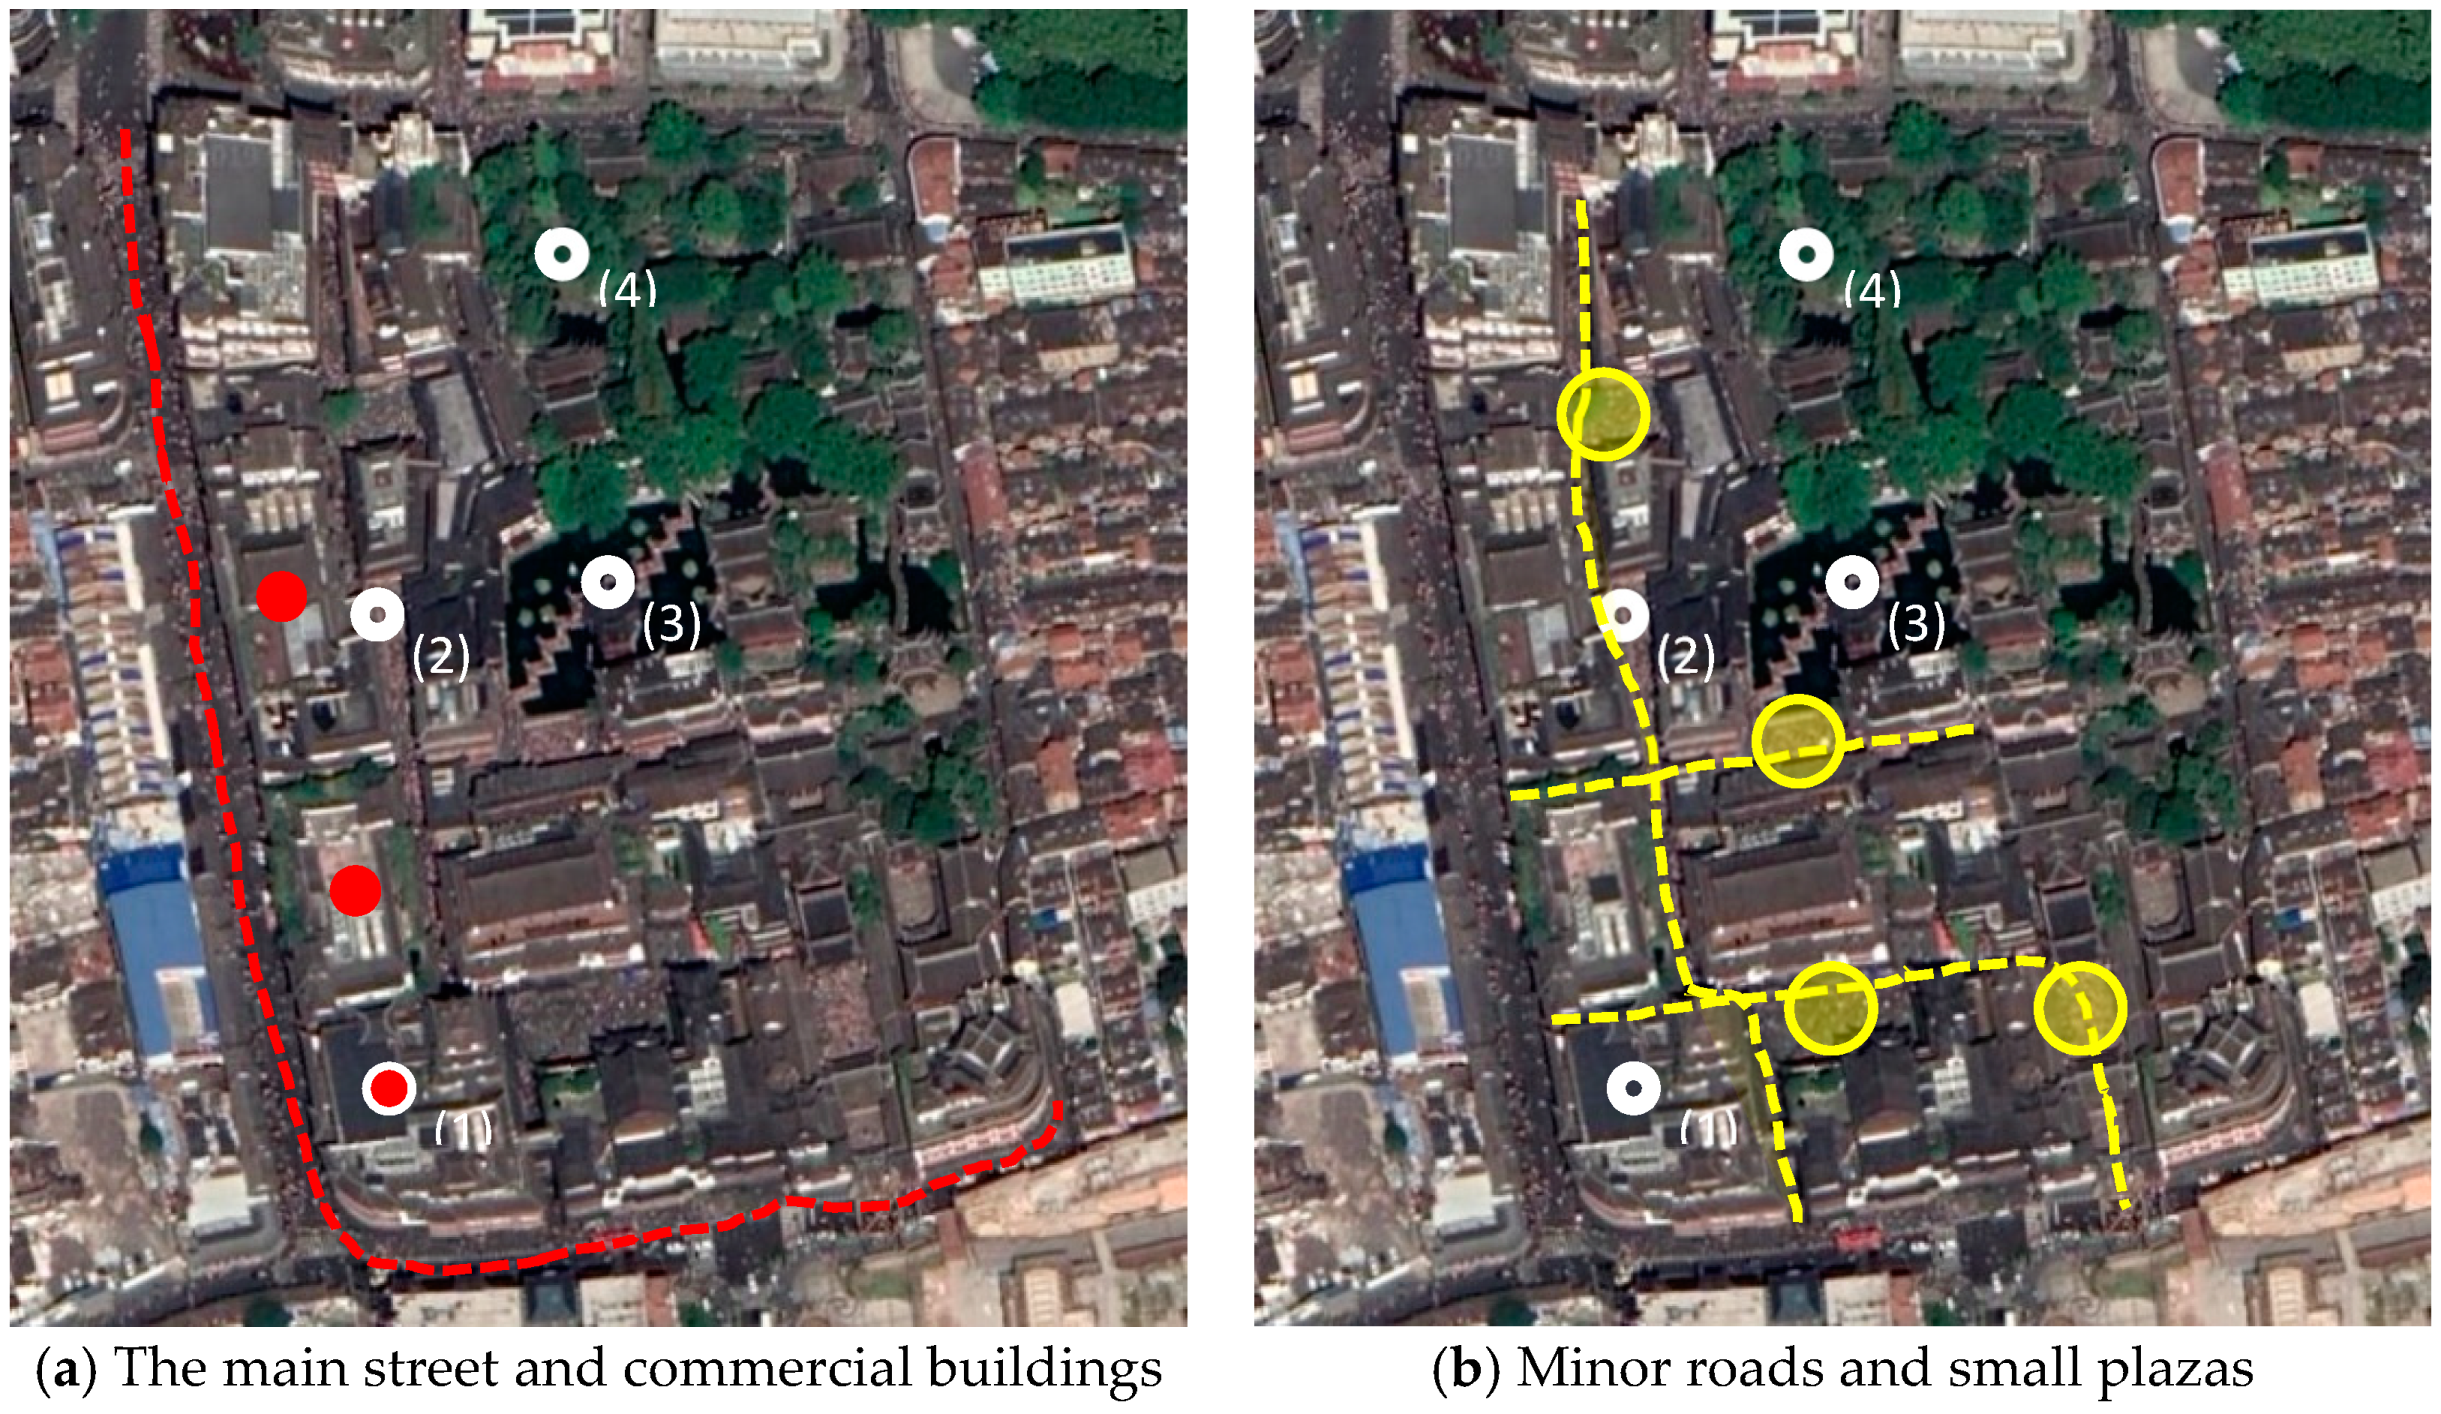
On the one hand, cities are complex socioeconomic and ecological systems, and the design and construction of urban gardens cannot be separated from the social and economic development of the city. In Figure 5a, the red dotted line indicates the location of the main street outside Yu Garden, while the red dots indicate the location of large-scale shopping malls and commercial buildings, which are located on both sides of the main road. In Figure 5b, the yellow dotted line indicates the location of minor roads in the neighborhood of Yu Garden, and the yellow circles indicate some small plazas. Cultural heritage areas are often located along these minor roads and plazas. These areas are typically the most prosperous and crowded areas within Yu Garden, and the number of people in them greatly exceeded the number inside the Yu Garden scenic area. Thus, the modern commercial area and cultural heritage area are clearly important components of the contemporary Yu Garden because they play an important socioeconomic role and satisfy the commercial needs of residents for entertainment, shopping, and other commercial activities. These outstanding features of Yu Garden also embody the compound function of contemporary urban gardens. Therefore, an optimal approach to garden design should seek to couple ecological and social benefits. In light of the important social and economic functions of cities, rational urban garden design should incorporate commercial elements into urban gardens, thereby extending the essential social functions of urban gardens in modern urban areas. However, the excessive pursuit of commercialization could also lead to unanticipated environmental problems; for example, the pursuit of perfect green lawns has led to groundwater pollution in the United States [15].
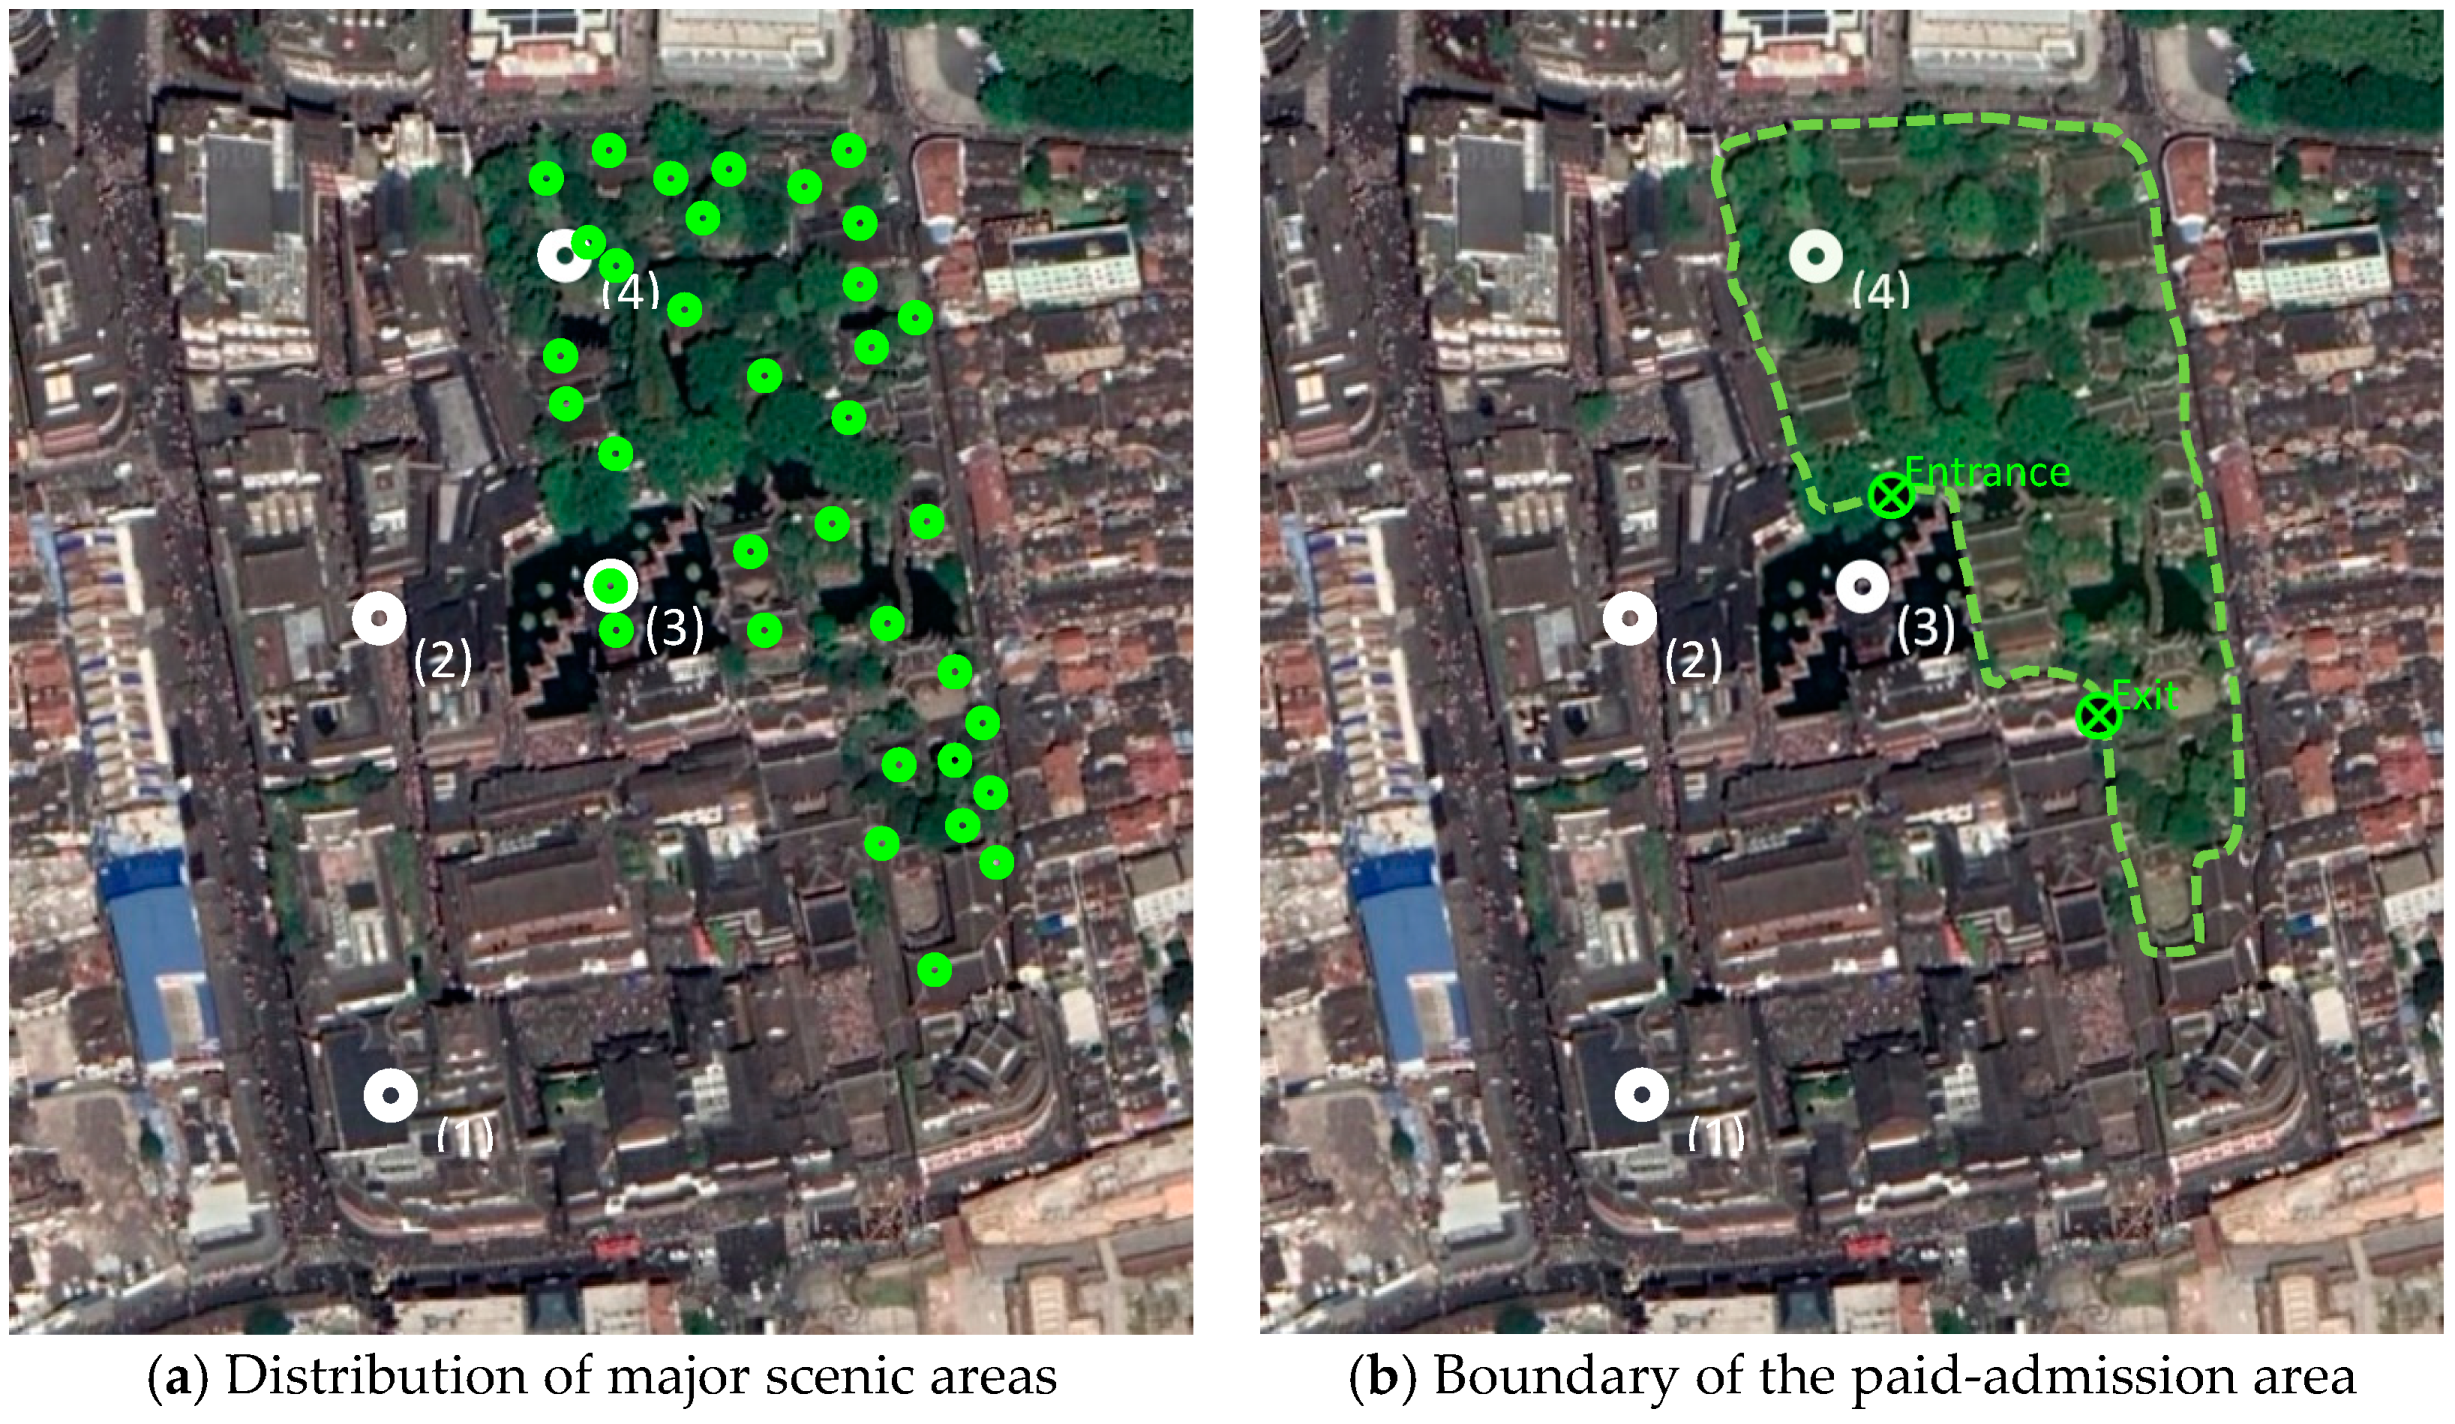
However, it is also important to maintain the original natural and historical resources of urban gardens. In our analysis of residents’ landscape-based preferences, it was found that Shanghai residents generally preferred urban gardens without commercial transformations; they instead prioritized the maintenance of the natural landscape and the historical and cultural heritage of urban gardens. In Figure 6a, the green dots indicate the location of the main scenic areas in Yu Garden. In Figure 6b, the area within the green dotted line is the area in the interior of the garden, for which a fee is charged for admission. This part of the area requires a ticket for admission and has a discrete entrance and exit. This garden layout indicates that the main scenic areas in the urban garden are often located in the paid-admission area, and this arrangement might be a good way to protect the garden’s resources while achieving economic benefits. In the context of today’s ongoing urbanization, most Shanghai residents express a desire to maintain the natural and historical authenticity of urban gardens to the greatest extent possible. Further, while the natural and ecological area emphasizes the original landscape, the area is not sparsely visited. In China, the uniqueness of the original landscape and resources in the Shanghai area attracts numerous visitors. Therefore, comprehensive management is necessary to ensure the safety of both visitors and garden resources. In conclusion, urban garden development should not only prioritize the authentic preservation of garden areas but should seek to promote the socioeconomic needs of developing urban societies.
3.4. Influencing Factors for Residents’ Preferences
To further explore the influencing factors affecting residents’ preferences, a multinomial logit regression analysis linking residents’ preferences for urban gardens with residents’ individual, family, and professional characteristics was conducted. First, the results of a fitting test and independent test of the original data showed that most variables were significant at the 0.05 level, except for “household income”, indicating that most of the variables significantly contributed to the model composition and would prove meaningful in the analysis process. The model’s likelihood ratio was 310.359 (significant at the 0.01 level) and the Cox and Snell coefficient and Nagelkerke coefficient were 0.216 and 0.245, respectively, indicating that the model could explain the variation of the original variables to a reasonable extent, and each alternative option conformed to the hypothesis of uncorrelated independence; that is, each dependent variable was independent of each other. In conclusion, the options studied met the requirements for parameter estimation with the logit model.
Based on the conclusions of the fitting degree test and independent test, the study adopted the maximum likelihood method of estimating the parameters of the influencing factors affecting residents’ preferences regarding urban gardens. Based on the Wald test results, the variables with estimated parameters of zero were eliminated to yield the final results (Table 5). Options 1, 2, and 3 were set as the experimental group, and option 4 was set as the reference group. Option 4 represented a purely natural urban garden without any artificial or commercial transformation; thus, it provided the clearest contrast with the characteristics of the other options.
Based on the analysis results, residents’ urban garden preferences were classified into four preference groups:
(1) Residents who prefer modern commercial areas. In our study, the education status of residents in this group was mostly primary school and below, and their understanding of the multiple functions of urban gardens was relatively limited. Many studies have pointed out that education is the most consistent predictor of environmental concern; that is, people with high education levels tend to care more about the environment [36,37]. Most residents in this group are company or corporation employees whose daily schedules are relatively structured and whose leisure time is relatively low. Further, the family size of these residents is relatively small, and although the number of times they visit urban gardens is higher than other groups, their expenditures in urban gardens are extremely low. Such residents may visit commercial areas near urban gardens for shopping and consumption with a relatively high frequency but enter garden interiors with a lower frequency, suggesting that they prefer and are more cognizant of noisy, bustling commercial environments than of the natural environment and historical and cultural resources of the urban gardens themselves.
(2) Residents who prefer cultural heritage areas. This group primarily includes young people aged 20 and below with strong curiosity and an interest in trying new things and middle-aged people aged 41–60 with a sense of connection to certain cultural heritage and historical custom; the probability that residents would express a preference for this garden type was higher within these two age groups than within others. Most residents in this group had stable work at public institutions and relatively moderate income. They preferred higher grade and more stylish commercial areas over simple shopping centers. In addition, such residents’ frequency of attendance and expenditures in urban gardens was relatively low, reflecting their work and income. Residents in this group did not go to the urban garden and nearby blocks for the sole purpose of shopping but rather to experience the lifestyle encapsulated in the urban garden and surrounding area. Finally, the typical family size of such residents was one person, and group members’ residences were within 500 m of the urban garden; thus, the time at which they visited was relatively flexible. Overall, residents in this group noted the authenticity of urban gardens and hoped to enjoy the experience of visiting chic commercial environments.
(3) Residents who prefer historical preservation areas. Most residents in this group were 21–40 years old and could be broadly classified as young people or migrant workers. Considering Shanghai’s demographics and the results in Table 2, residents of this age group account for a large proportion of Shanghai residents. Therefore, our results suggest that most residents primarily understand the urban landscape as a kind of “tourist attraction”. Such residents chiefly appreciate the urban garden as a scenic spot, prioritizing the maintenance of the natural landscape over commercialization. However, members of this group fail to consider urban gardens’ functions in resource management, commercial development, and various other services. Such residents view urban gardens simply as “places to visit”. Based on the results shown in Table 3, the largest proportion of residents prefer option 3 (historical preservation areas); however, the detailed characteristics of these residents were not sufficiently clarified in this study, highlighting the need for further exploration in the future.
(4) Residents who prefer natural and ecological areas. These residents are mostly students, with a middle school educational level. Compared with residents with only a primary school education, members of this group have a deeper understanding of urban garden functions as well as a better understanding of and appreciation for the ecosystem and wild animals. It is logical that people with a deeper understanding of nature will also prefer the ecologically sustainable landscapes [38]. Some residents’ household income was between 5000 and 10,000 yuan, and their economic capacity was relatively limited; this also limited their ability to shop in the modern commercial areas and the cultural heritage areas. Other group members’ incomes were between 20,001 and 25,000 yuan; these residents represent the middle- and high-income groups of Shanghai residents who generally do not experience economic and survival pressure. They pursue the experience of natural environments in urban gardens. In addition, the family size of members of this group was typically three people, and their average expenditures in urban gardens ranged from 51 to 100 yuan. That suggests that most of these residents visit urban gardens for family leisure and are willing to spend money to experience family-based recreational activities in the natural environments offered by urban gardens. Finally, the distance between these residents’ homes and urban gardens averaged between 1 and 5 km, which is considered a relatively moderate distance in Shanghai.
4. Discussion
This study explored residents’ preferences for urban gardens based on soundscape and landscape differences. To some extent, feedback from residents represents the most authentic attitude of the public toward urban gardens and thus it serves as an important basis for improving urban garden construction. Therefore, it is crucial to enhance the participation of residents in urban garden planning, development, and policy-making. Considering residents’ preference for natural and historical authenticity in urban gardens, approaches that yield “natural-looking” commercial environments can be applied in the garden design process to make them look “natural”. Such approaches should also consider the transformation of soundscape characters. To meet residents’ needs and preferences to the greatest extent possible, influencing factors, such as residents’ educational and economic status, that impact these preferences should be fully considered when designing and implementing urban gardens. Such practices could yield better integration of naturalness and commerciality in urban gardens. In Shanghai, the channels for resident participation in urban garden planning, development, and policy-making could be expanded, along with the diversity of urban garden characteristics in China. This would also increase the transparency and openness of urban-garden-related work by involving residents throughout garden construction through hearings, visits, and investigations, thus enhancing residents’ understanding of and participation in urban garden development and yielding projects that truly reflect residents’ preferences, demands, and needs. Obviously, encouraging residents to participate in urban-garden-related affairs will enhance their professional quality, thus changing their preferences for urban gardens and gaining better feedback in the development of urban gardens.
In addition, it is imperative to enhance the practicability of urban garden planning and construction. Urban garden construction ultimately aims to meet residents’ continuous development and changing needs. This research has shown that the influencing factors shaping residents’ preferences are highly specific. Ignoring these seemingly minor considerations may make urban gardens less well-suited to residents’ needs and desires; thus, the specific influencing factors that shape residents’ preferences must be considered. It was found that residents’ individual, family, and professional characteristics impact their preferences, yielding differences among the preferences of different groups of residents. For example, garden design should account for age differences. Urban gardens should meet the needs of young people for tourist attractions; thus, the historical value and cultural characteristics of urban gardens should be highlighted. At the same time, the desire of middle-aged people to experience cultural heritage in urban gardens should also be considered. Similarly, variations in residents’ expenditures in urban gardens are reflected in residents’ preferences regarding commercialization and naturalness. In summary, the different priorities and preferences of different groups of residents should be considered to improve the utilization and the suitability of urban gardens.
5. Conclusions
Based on a questionnaire survey of residents in the Shanghai urban area in 2019 and an investigation of soundscapes and landscapes differences, this study considered residents’ preferences regarding four urban garden types, namely, modern commercial areas, cultural heritage areas, historical preservation areas, and natural and ecological areas. Based on residents’ responses, this study adopted a multinomial logit model to explore potential influential factors affecting the residents’ preferences. The results of this study will provide useful information for planners, developers, and government officials related to urban gardens and serve as a basis for the construction of urban gardens with more practical value and increased natural benefits. The results show that the urban garden preferences reflect the trade-offs between natural and commercial environments. Overall, the study found that the Yu Garden soundscape experiences temporal variations that are closely related to its functional attributes and public-use patterns and that residents generally prefer urban gardens without commercial transformation; that is, they prioritize the preservation of the natural landscape and historical and cultural elements of urban gardens. These findings are consistent with the conclusions of some existing studies [39].
Soundscape variations were closely related to the characteristics of urban garden areas and resident usage patterns; the measured sound levels at different observation points varied significantly at different times. Regarding the absolute quantity of sound, the sound levels of the modern commercial area and cultural heritage area were greater than 60 dB, which exceeded urban noise limits in Shanghai. The overall sound level in the aforementioned areas presented a gradual increasing trend, and the overall sound level of the historical preservation area and natural and ecological area showed an M-shaped trend; these changes were associated with changes in the number of people in Yu Garden at different times of the day. Residents visiting Yu Garden much preferred natural sounds to artificial and human sounds, which reflected the general desire of residents to be close to nature. Accordingly, traffic sound was considered to be the most disliked type of sound. Similarly, the higher the subjective loudness of an artificial sound is, the less favorable the residents’ impressions of the sound, while the higher the subjective loudness of natural sound is, the higher the favorability associated with the sound. This indicates that the subjective loudness of different kinds of sounds have different effects on residents’ perception of the overall soundscape. Further, a relatively clear positive correlation existed between the favorability and landscape-soundscape coordination degree, indicating that residents experience the soundscape of urban gardens as a unified whole with an inseparable relationship between the soundscape and the overall landscape.
Regarding landscapes, it was found that Shanghai residents generally preferred urban gardens without artificial transformation; that is, residents prioritized natural landscaping and historical and cultural conservation in urban gardens. However, cities represent complex socioeconomic and ecological environment systems, and the planning and construction of urban gardens cannot be separated from the social and economic development of cities. Thus, the study concluded that the modern commercial area and cultural heritage area are essential components of Yu Garden because they play an important role in the social economy and satisfy the entertainment, shopping, and other commercial needs of residents. These components are among the outstanding features of the contemporary Yu Garden and embody the compound functions of modern urban gardens. Therefore, ideal urban gardens achieve a coupling of ecological and social benefits. However, it is also important to maintain the original natural and historical resources of urban gardens. The results show that the main scenic areas in Yu Garden were often located in an area where an admission fee is charged for entry; this approach may be a good way to protect urban garden resources and achieve economic benefits. These findings point to the need for comprehensive management of gardens to ensure visitor safety and the preservation of garden resources. In conclusion, urban garden development should prioritize not only the authentic preservation of garden resources but also the developing needs of the urban social economy.
Regarding the influencing factors that impacted residents’ preferences, the multinomial logit regression analysis results showed that educational status plays an important role. Other studies have highlighted the potential impact of media and education and individual preferences; this suggests that public preferences could be shaped through awareness campaigns and ecological education [40]. Our research suggests that a lower level of education can limit the residents’ understanding of the multiple functions of urban gardens, and a strong affinity for shopping enhances residents’ preferences for modern commercial areas; at the same time, teenagers and middle-aged people have higher preferences for cultural heritage areas and prioritize the lifestyles afforded by urban gardens. Such preferences reflect continuous improvements in the living standards of Chinese citizens and their expectations for a higher quality of life in recent years. In addition, young people and the migrant workers seem to prefer the historical sites inherent in urban gardens and pay less attention to commercial opportunities and the maintenance of gardens’ natural landscapes. Such residents represent the largest proportion of the urban population (Table 4), suggesting that most residents understand urban gardens as “tourist attractions” rather than seeing their important resource management, commercial development, and community service functions. Our results also highlight the need for more comprehensive urban garden development in the future. Finally, it was found that low economic status limits residents’ ability to shop in the commercial areas near urban gardens. Thus, along with middle- and high-income residents, low-income residents pay more attention to the experience of urban gardens as natural landscapes and ecological environments. Moreover, larger family sizes increase the probability that individuals will participate in recreational activities in the natural environment and enhance individuals’ preferences for natural and ecological areas. This influencing factor is newly identified in this study and represents a new feature of China’s ongoing urbanization.
Urbanization continues to progress in China, and the urban population is growing. Urban planners, policy makers, scholars, and the public all put forward higher requirements for the healthy and advantageous development of cities. Cities are complex man-made ecosystems, and the design, construction, and management of urban gardens is a key indicator of a city’s development level. This study believes that an understanding of residents’ authentic preferences for urban gardens will help to better structure gardens to meet residents’ needs and desires and will promote a balance between urban socioeconomic development and ecological environment protection. As for the replicability of the conclusion of this study, the urban development and resource endowment of Shanghai should be considered. Shanghai is an international metropolis and regional central city that is rich in urban landscape resources and has a large population. Meanwhile, Yu Garden is also an outstanding representative of the integration of city development and city ecological construction. It is a typical area where residents make contact with urban gardens widely. The research on urban gardens in Shanghai is representative and can provide a reference for the development of similar cities and urban gardens. In terms of the methodology, the combination of soundscape and landscape analysis is an innovative attempt and an important supplement to previous studies; this research paradigm can be used as a reference for other urban-garden-related research. In terms of the panoramic view of the overall urban garden, the results obtained from this study will help planners, developers, and government policy makers to design urban gardens with increased practical value and natural benefits. In future research, the types of urban gardens can be further subdivided and targeted research methods can be developed to yield more comprehensive and focused conclusions.
Author Contributions
Conceptualization, Z.Z. and Y.W.; methodology, Z.Z.; software, Y.W.; validation, Z.Z. and Y.H.; formal analysis and investigation, Z.Z. and Y.W.; resources, Y.H.; data curation, Z.Z.; writing—original draft preparation, Z.Z.; writing—review and editing, Y.H.; visualization, Z.Z.; supervision, Y.W.; project administration, Y.H.; funding acquisition, Y.W. and Z.Z. All authors have read and agreed to the published version of the manuscript.
Funding
This study was financially supported by Beijing Forestry University and Shanghai Normal University: Beijing Forestry University School of Economics and Management National Natural Science Foundation projects (JGZKPY002) and the General Scientific Research Project of Shanghai Normal University (SK202025).
Conflicts of Interest
The authors declare no conflict of interest. The founding sponsors had no role in the design of the study; in the collection, analyses, or interpretation of data; in the writing of the manuscript, and in the decision to publish the results.
References
- Allen, G.L. The organization of route knowledge. New Dir. Child Adolesc. Dev. 1982, 15, 31–39. [Google Scholar] [CrossRef]
- Allen, G.L.; Kirasic, K.C. Effects of the cognitive organization of route knowledge on judgments of macrospatial distance. Mem. Cogn. 1985, 13, 218–227. [Google Scholar] [CrossRef] [PubMed]
- Irga, P.J.; Burchett, M.D.; Torpy, F.R. Does urban forestry have a quantitative effect on ambient air quality in an urban environment? Atmos. Environ. 2015, 120, 173–181. [Google Scholar] [CrossRef] [Green Version]
- Clark, K.H.; Nicholas, K.A. Introducing urban food forestry: A multifunctional approach to increase food security and provide ecosystem services. Landsc. Ecol. 2013, 28, 1649–1669. [Google Scholar] [CrossRef] [Green Version]
- Majumdar, S.; Deng, J.; Zhang, Y.; Pierskallab, C. Using contingent valuation to estimate the willingness of tourists to pay for urban forests: A study in Savannah, Georgia. Urban For. Urban Green. 2011, 10, 275–280. [Google Scholar] [CrossRef]
- Dwyer, J.E.; Nowak, D.J.; Watson, G.W. Future directions for urban forestry research in the United States. J. Arboric. 2002, 28, 231–236. [Google Scholar]
- Kaplan, R. The role of nature in the context of the workplace. Landsc. Urban Plan. 1993, 26, 193–201. [Google Scholar] [CrossRef] [Green Version]
- Ode, A.; Fry, G.L.A. Visual aspects in urban woodland management. Urban For. Urban Green. 2002, 1, 15–24. [Google Scholar] [CrossRef]
- Peter, S. Wilderness & the American Mind. Kenyon Rev. 2001, 23, 74–75. [Google Scholar]
- Kaiser, F.G.; Wolfing, S.; Fuhrer, U. Environmental attitude and ecological behavior. J. Environ. Psychol. 1999, 19, 1–19. [Google Scholar] [CrossRef] [Green Version]
- Recher, H.A. Conserving forest biodiversity: A comprehensive multiscaled approach. Aust. Mammal. 2003, 25, 113–114. [Google Scholar] [CrossRef]
- Bradford, J.B. Ecology of Hierarchical Landscapes: From Theory to Application; Chen, J., Saunders, S.C., Brosofske, K.D., Crow, T.R., Eds.; Nova Science Publisher: New York, NY, USA, 2006. [Google Scholar]
- Tuan, Y.F. Topophilia: A Study of Environmental Perception, Attitudes end Values; Prentice-Hall Inc.: Engtewood Cliffs, NJ, USA, 1974. [Google Scholar]
- Steinberg, T. American Green-the Obsessive Quest for the Perfect Lawn; W.W. Norton & Company: New York, NY, USA, 2006. [Google Scholar]
- Robbins, P.; Birkenholtz, T. Turfgrass revolution: Measuring the expansion of the American lawn. Land Use Policy 2003, 20, 181–194. [Google Scholar] [CrossRef]
- Maas, J.; Verheij, R.A. Are health benefits of physical activity in natural environments used in primary care by general practitioners in The Netherlands? Urban For. Urban Green. 2007, 6, 227–233. [Google Scholar] [CrossRef] [Green Version]
- Nassauer, J.I. Messy ecosystems, orderly frames. Landsc. J. 1995, 14, 161–170. [Google Scholar] [CrossRef] [Green Version]
- Martin, C.A. Landscape water use in phoenix. Desert Plants 2001, 17, 26–31. [Google Scholar]
- Gobster, P.; Nassauer, J.I.; Daniel, T.C.; Fry, G. The shared landscape: What does aesthetics have to do with ecology? Landsc. Ecol. 2007, 22, 959–972. [Google Scholar] [CrossRef]
- Granö, J.G. Reine Geographie. Acta Geogra 1929, 2, 1–202. [Google Scholar]
- Schafer, R.M. The Soundscape: Our Sonic Environment and the Tuning of the World; Alfred Knopf: New York, NY, USA, 1997; pp. 10–200. [Google Scholar]
- Farina, A.; Pieretti, N. The soundscape ecology: A new frontier of landscape research and its application to islands and coastal systems. J. Mar. Isl. Cult. 2012, 1, 21–26. [Google Scholar] [CrossRef]
- Merchan, C.; Diaz- Balteiro, L.; Solino, M. Noise pollution in national parks: Soundscape and economic valuation. Landsc. Urban Plan. 2014, 123, 1–9. [Google Scholar] [CrossRef]
- Zhong, L. Research on environmental impacts of tourism in China: Progress and prospect. J. Environ. Manag. 2011, 92, 2972–2983. [Google Scholar] [CrossRef]
- Morillas, J.; Escobar, V.; Gozalo, G. Noise source analyses in the acoustical environment of the medieval centre of Cáceres. Appl. Acoust. 2013, 74, 526–534. [Google Scholar] [CrossRef]
- Brody, S.D.; Highfield, W.; Alston, L. Does location matter? Measuring environmental perceptions of creeks in two San Antonio watersheds. Environ. Behav. 2004, 36, 339–350. [Google Scholar] [CrossRef] [Green Version]
- Han, K.-T. The effect of nature and physical activity on emotions and attention while engaging in green exercise. Urban For. Urban Green. 2017, 24, 5–13. [Google Scholar] [CrossRef]
- Silvennoinen, H.; Pukkala, T.; Tahvanainen, L. Effect of cuttings on the scenic beauty of a tree stand. Scand. J. For. Res. 2002, 17, 263–273. [Google Scholar] [CrossRef]
- Carlson, A. The aesthetic appreciation of environmental architecture under different conceptions of environment. J. Aesthetic Educ. 2006, 40, 77–88. [Google Scholar] [CrossRef]
- Van den Berg, A.E.; Koole, S.L. New wilderness in the Netherlands: An investigation of visual preferences for nature development landscapes. Landsc. Urban Plan. 2006, 78, 362–372. [Google Scholar] [CrossRef]
- Fraser, E.D.G.; Kenney, W.A. Cultural background and landscape history as factors affecting perceptions of the urban forest. J. Arboric. 2000, 26, 106–112. [Google Scholar]
- Grusky, D.B.; Wheedon, K.A. Decom position without death: A research agenda for a new class analysis. Acta Sociol 2001, 44, 203–218. [Google Scholar] [CrossRef] [Green Version]
- Abello, R.P.; Bernaldez, F.G. Landscape preference and personality. Landsc. Urban Plan. 1986, 13, 19–28. [Google Scholar] [CrossRef]
- Maloney, M.P.; Ward, M.P. Ecology: Let’s hear from the people: An objective scale for the measurement of ecological attitudes and knowledge. Am. Psychol. 1973, 28, 583–586. [Google Scholar] [CrossRef]
- Arcury, T.A.; Scollay, S.J.; Johnson, T.P. Public Environmental Knowledge: A Statewide Survey. J. Environ. Educ. 1987, 18, 31–37. [Google Scholar] [CrossRef]
- Wall, G. General versus specific environmental concern: A Western Canadian case. Environ. Behav. 1995, 27, 294–316. [Google Scholar] [CrossRef]
- Ewert, A.; Baker, D. Standing for w here you sit: An exploratory analysis of the relationship between academic major and environment beliefs. Environ. Behav. 2001, 33, 687–707. [Google Scholar] [CrossRef]
- Fisher, R.F. Forests and Landscapes-Linking Ecology, Sustainability and Aesthetics. For. Ecol. Manag. 2002, 164, 307–308. [Google Scholar] [CrossRef]
- Ribe, R.G. The aesthetics of forestry: What has empirical preference research taught us? Environ. Manag. 1989, 13, 55–74. [Google Scholar] [CrossRef]
- Bandura, A. Social cognitive theory: An agentic perspective. Annu. Rev. Psychol. 2001, 52, 1–26. [Google Scholar] [CrossRef] [Green Version]
Figure 1.
Natural and artificial environments. The area labeled “A” in Figure 1 is a primitive classical garden area, and the area labeled “B” is a transformed commercial area.
Figure 1.
Natural and artificial environments. The area labeled “A” in Figure 1 is a primitive classical garden area, and the area labeled “B” is a transformed commercial area.

Figure 2.
Photos illustrating urban garden forms. This study further divided the Yu Garden into four specific urban garden forms, namely, the modern commercial area, the cultural heritage area, the historical preservation area, and the natural and ecological area. There are differences among the external layout and the internal natural and social functions of different urban garden forms.

Figure 3.
Smart Sensor Digital Sound Level Meter AS804.

Figure 4.
Sound levels at different observation points in Yu Garden.

Figure 5.
Spatial characteristics of the modern commercial area and cultural heritage area. In (a), the red dotted line indicates the location of the main street outside Yu Garden, while the red dots indicate the location of large-scale shopping malls and commercial buildings, which are located on both sides of the main road. In (b), the yellow dotted line indicates the location of minor roads in the neighborhood of Yu Garden, and the yellow circles indicate some small plazas. Cultural heritage areas are often located along these minor roads and plazas.

Figure 6.
Spatial characteristics of the historical preservation area and natural and ecological area. In (a), the green dots indicate the location of the main scenic areas in Yu Garden. In (b), the area within the green dotted line is the interior of the garden, for which a fee is charged for admission. This part of the area requires a ticket for admission and has a discrete entrance and exit.


Table 1.
Influencing factors of residents’ preferences for urban garden forms.
| Variables | Attribute Value |
|---|---|
| Urban garden forms | 1 = option 1: modern commercial area; 2 = option 2: cultural heritage area; 3 = option 3: historical preservation area; 4 = option 4: natural and ecological area |
| Individual characteristics | |
| Gender | 1 = men; 2 = women |
| Age | 1 = 20 and under; 2 = 21–40 years old; 3 = 41–60 years old; 4 = 60 and over |
| Education status | 1 = primary school and below; 2 = middle school; 3 = high school and above |
| Occupation | 1 = enterprise staff; 2 = public institutions personnel; 3 = government personnel; 4 = student; 5 = retired and unemployed |
| Family characteristics | |
| Family size | 1 = 1 person; 2 = 2 persons; 3 = 3 persons; 4 = 4 persons and above |
| Household income (monthly) | 1 = ¥5000 and below; 2 = ¥5001–10,000; 3 = ¥10,001–15,000; 4 = ¥15,001–20,000; 5 = ¥20,001–25,000; 6 = more than ¥25,000 |
| Residence in Shanghai | 1 = within 1 year; 2 = 1 to 5 years; 3 = 5 to 10 years; 4 = 10 years or more |
| Professional characteristics | |
| Frequency of going to urban gardens each year | 1 = not once; 2 = less than 5 times; 3 = 6–10 times; 4 = more than 10 times |
| Annual expenditure in urban garden | 1 = ¥0; 2 = ¥1–50; 3 = ¥51–100; 4 = more than ¥100 |
| Distance between family and urban garden | 1 = within 500 m; 2 = 500 m–1 km; 3 = 1–5 km; 4 = more than 5 km |
| The favorable degree | 1 to 5 means “very annoying” to “very much prefer” |
| The subjective loudness degree | 1 to 5 means “very quiet” to “very loud” |
| The coordination degree | 1 to 5 means “very uncoordinated” to “very coordinated” |
Table 2.
Descriptive statistics of samples.
| Variable | Frequency (Count) | Percentage (%) | Variable | Frequency (Count) | Percentage (%) |
|---|---|---|---|---|---|
| Gender | ¥5001–¥10,000 | 233 | 18.29 | ||
| Male | 590 | 46.31 | ¥10,001–¥15,000 | 267 | 20.96 |
| Female | 684 | 53.69 | ¥15,001–¥20,000 | 180 | 14.13 |
| Age | ¥20,001–¥25,000 | 144 | 11.30 | ||
| Age 20 and under | 162 | 12.72 | More than ¥25,000 | 135 | 10.60 |
| 21–40 years old | 775 | 60.83 | Residence in Shanghai | ||
| 41–60 years old | 278 | 21.82 | Within 1 year | 221 | 17.35 |
| Age 60 and over | 59 | 4.63 | 1 to 5 years | 457 | 35.87 |
| Education status | 5 to 10 years | 202 | 15.86 | ||
| Primary school and below | 33 | 2.59 | 10 years or more | 394 | 30.93 |
| Middle school | 324 | 25.43 | Frequency of going to urban gardens each year | ||
| High school and above | 917 | 71.98 | Not once | 53 | 4.16 |
| Occupation | Less than 5 times | 572 | 44.90 | ||
| Enterprise staff | 170 | 13.34 | 6–10 times | 362 | 28.41 |
| Public institutions Personnel | 809 | 63.50 | More than 10 times | 287 | 22.53 |
| Government personnel | 156 | 12.24 | Annual expenditure in urban garden | ||
| Student | 56 | 4.40 | ¥0 | 99 | 7.77 |
| Retired and unemployed | 83 | 6.51 | ¥1–¥50 | 484 | 37.99 |
| Family size | ¥51–¥100 | 297 | 23.31 | ||
| 1 person | 161 | 12.64 | More than ¥100 | 394 | 30.93 |
| 2 persons | 228 | 17.90 | Distance between family and urban garden | ||
| 3 persons | 545 | 42.78 | Within 500 m | 529 | 41.52 |
| 4 persons and above | 340 | 26.69 | 500 m–1 km | 382 | 29.98 |
| Household income (Monthly) | 1–5 km | 260 | 20.41 | ||
| ¥5000 and below | 315 | 24.73 | More than 5 km | 103 | 8.08 |
Table 3.
Results of the preference, subjective loudness, and landscape-soundscape coordination analysis of the Yu Garden soundscape.
Table 3.
Results of the preference, subjective loudness, and landscape-soundscape coordination analysis of the Yu Garden soundscape.
| Category | Element | Favorable Degree | Subjective Loudness Degree | Coordination Degree | |||||||||
|---|---|---|---|---|---|---|---|---|---|---|---|---|---|
| (1) | (2) | (3) | (4) | (1) | (2) | (3) | (4) | (1) | (2) | (3) | (4) | ||
| Natural sounds | Wind | 2.32 | 2.86 | 4.15 | 3.97 | 2.68 | 2.62 | 3.48 | 3.67 | 2.22 | 2.64 | 3.87 | 4.14 |
| Birdsong | 2.06 | 1.93 | 4.04 | 4.21 | 2.96 | 3.63 | 4.16 | 4.35 | 2.10 | 2.61 | 4.25 | 4.62 | |
| Leaves | 2.05 | 2.59 | 4.38 | 4.71 | 2.15 | 2.31 | 3.81 | 3.99 | 1.87 | 2.11 | 4.22 | 4.39 | |
| Water | 1.27 | 1.81 | 4.19 | 4.72 | 1.84 | 2.08 | 3.84 | 3.78 | 1.74 | 2.08 | 4.37 | 4.54 | |
| Average | 1.93 | 2.30 | 4.19 | 4.40 | 2.41 | 2.66 | 3.82 | 3.95 | 1.98 | 2.36 | 4.18 | 4.42 | |
| Human sounds | Chatting | 2.99 | 3.53 | 2.77 | 2.64 | 4.75 | 4.79 | 3.15 | 2.74 | 2.44 | 2.98 | 3.59 | 3.66 |
| Playing | 3.75 | 4.29 | 3.58 | 2.61 | 3.87 | 3.91 | 3.07 | 2.95 | 2.71 | 3.25 | 3.36 | 3.53 | |
| Peddling | 3.27 | 3.81 | 2.17 | 2.02 | 4.77 | 4.44 | 3.41 | 3.11 | 2.79 | 3.14 | 2.35 | 2.52 | |
| Entertainment activity | 2.44 | 3.98 | 3.27 | 3.09 | 4.49 | 4.63 | 3.69 | 3.48 | 2.69 | 3.23 | 3.14 | 3.01 | |
| Average | 3.11 | 3.90 | 2.95 | 2.59 | 4.47 | 4.44 | 3.33 | 3.07 | 2.66 | 3.15 | 3.11 | 3.18 | |
| Artificial sounds | Traffic | 1.23 | 1.37 | 1.16 | 1.48 | 4.06 | 3.97 | 2.16 | 2.05 | 2.29 | 2.83 | 2.94 | 2.11 |
| Entertainment equipment | 2.39 | 2.93 | 2.22 | 1.84 | 4.25 | 4.49 | 2.53 | 2.24 | 2.62 | 3.16 | 2.27 | 3.44 | |
| Music | 2.79 | 3.43 | 2.73 | 2.44 | 4.46 | 4.26 | 2.66 | 2.85 | 2.96 | 3.51 | 3.61 | 3.78 | |
| Construction | 1.97 | 1.91 | 1.81 | 1.62 | 4.51 | 4.74 | 3.61 | 2.55 | 1.83 | 1.37 | 1.48 | 1.65 | |
| Average | 2.10 | 2.41 | 1.98 | 1.85 | 4.32 | 4.37 | 2.74 | 2.42 | 2.43 | 2.72 | 2.58 | 2.75 | |
Table 4.
The residents’ preferences of urban garden forms.
| Urban Garden Forms | Citizens’ Direct Preferences (N = 1274) | Citizens’ Average Preference Score | ||
|---|---|---|---|---|
| Preference Number | Preference Frequency | Overall Average | Standard Deviation | |
| (1) | 230 | 18.05% | 2.96 | 1.46 |
| (2) | 90 | 7.06% | 2.96 | 1.51 |
| (3) | 777 | 60.99% | 3.02 | 1.42 |
| (4) | 177 | 13.89% | 3.03 | 1.46 |
Table 5.
Maximum likelihood estimation via multinomial logit regression for four urban garden forms.
Table 5.
Maximum likelihood estimation via multinomial logit regression for four urban garden forms.
| Variables | Multinomial Logit Model (N = 1274) | |||||||||
|---|---|---|---|---|---|---|---|---|---|---|
| ln(P1/P4) | ln(P2/P4) | ln(P3/P4) | Preference | |||||||
| B | Wald | Exp(B) | B | Wald | Exp(B) | B | Wald | Exp(B) | ||
| Intercept | 0.84 | 1.12 | - | −2.20 * | 2.10 | - | 2.71 *** | 17.13 | - | - |
| Gender | ||||||||||
| Men | −0.07 | 0.11 | 0.93 | −0.19 | 0.41 | 0.82 | −0.36 ** | 3.87 | 0.69 | Option 4 |
| Age | ||||||||||
| Age 20 and under | 0.04 | 0.01 | 1.04 | 0.44 | 0.47 | 1.56 | 0.29 | 0.59 | 1.34 | Option 2 |
| 21–40 years old | 0.02 | 0.00 | 1.02 | 1.02 | 1.16 | 2.78 | 1.04 ** | 3.61 | 2.84 | Option 3 |
| 41–60 years old | 0.22 | 0.57 | 1.25 | 1.19 *** | 8.77 | 3.30 | 0.22 | 0.81 | 1.25 | Option 2 |
| Education status | ||||||||||
| Primary school and below | 0.12 | 0.05 | 1.13 | −1.31 | 1.17 | 0.27 | −0.94 ** | 3.62 | 0.39 | Option 1 |
| Middle school | −0.12 | 0.21 | 0.88 | −1.90 *** | 8.61 | 0.15 | −0.22 | 0.96 | 0.80 | Option 4 |
| Occupation | ||||||||||
| Enterprise staff | 1.01 * | 3.33 | 2.73 | 0.28 | 0.06 | 1.32 | 0.33 | 0.53 | 1.39 | Option 1 |
| Public institutions Personnel | 0.63 | 1.92 | 1.88 | 1.38 * | 2.72 | 3.97 | 0.17 | 0.20 | 1.18 | Option 2 |
| Student | −0.65 | 1.01 | 0.52 | −0.23 | 0.04 | 0.79 | −0.25 | 0.24 | 0.78 | Option 4 |
| Family size | ||||||||||
| 1 person | 0.78 ** | 3.67 | 2.18 | 1.25 *** | 6.52 | 3.50 | 0.44 | 1.53 | 1.56 | Option 2 |
| 2 persons | 0.61 ** | 3.46 | 1.85 | 0.10 | 0.04 | 1.10 | 0.02 | 0.00 | 1.02 | Option 1 |
| 3 persons | −0.22 | 0.68 | 0.80 | −0.71 ** | 3.18 | 0.49 | −0.17 | 0.64 | 0.84 | Option 4 |
| Household income (Monthly) | ||||||||||
| ¥5000 and below | −0.24 | 0.28 | 0.78 | −0.36 | 0.34 | 0.70 | −0.02 | 0.00 | 0.98 | Option 4 |
| ¥5001–¥10,000 | −0.54 | 1.39 | 0.58 | −0.69 | 1.28 | 0.50 | −0.71 ** | 3.45 | 0.49 | Option 4 |
| ¥10,001–¥15,000 | −0.17 | 0.15 | 0.85 | 0.07 | 0.02 | 1.07 | −0.22 | 0.35 | 0.80 | Option 2 |
| ¥15,001–¥20,000 | 0.22 | 0.24 | 1.25 | 0.30 | 0.25 | 1.35 | −0.09 | 0.05 | 0.92 | Option 2 |
| ¥20,001–¥25,000 | −0.69 * | 2.15 | 0.50 | −0.15 | 0.07 | 0.86 | −0.68 * | 3.09 | 0.51 | Option 4 |
| Residence in Shanghai | ||||||||||
| Within 1 year | −0.95 ** | 4.10 | 0.39 | −1.09 | 2.92 | 0.34 | −0.64 * | 2.73 | 0.53 | Option 4 |
| 1 to 5 years | −0.86 *** | 7.23 | 0.42 | −0.96 ** | 4.64 | 0.38 | −0.59 ** | 4.71 | 0.55 | Option 4 |
| 5 to 10 years | −1.03 *** | 7.54 | 0.36 | −0.61 | 1.65 | 0.54 | −0.25 | 0.67 | 0.78 | Option 4 |
| Frequency of going to urban gardens each year | ||||||||||
| Less than 5 times | 0.10 | 0.12 | 1.10 | 1.01 ** | 5.00 | 2.74 | 0.30 | 1.68 | 1.35 | Option 2 |
| 6–10 times | 0.24 | 0.65 | 1.27 | 0.12 | 0.05 | 1.12 | 0.19 | 0.58 | 1.21 | Option 1 |
| Annual expenditure in urban garden | ||||||||||
| ¥0 | 0.29 | 0.33 | 1.34 | 0.06 | 0.00 | 1.06 | −0.35 | 0.54 | 0.71 | Option 1 |
| ¥1–¥50 | −0.84 *** | 7.97 | 0.43 | 0.63 * | 1.97 | 1.87 | −0.41 * | 2.64 | 0.66 | Option 2 |
| ¥51–¥100 | −1.26 *** | 17.90 | 0.28 | −0.27 | 0.32 | 0.76 | −1.26 *** | 25.11 | 0.28 | Option 4 |
| Distance between family and urban garden | ||||||||||
| Within 500 m | 0.55 | 1.12 | 1.74 | 1.41 | 1.58 | 4.09 | 0.03 | 0.00 | 1.03 | Option 2 |
| 500 m–1 km | 0.19 | 0.13 | 1.21 | −0.46 | 0.15 | 0.63 | −0.11 | 0.06 | 0.89 | Option 1 |
| 1–5 km | −0.15 | 0.07 | 0.86 | −1.73 * | 1.86 | 0.18 | −0.49 | 1.15 | 0.61 | Option 4 |
Note: ***, ** and * represent significant levels of 1%, 5%, and 10% respectively.
© 2020 by the authors. Licensee MDPI, Basel, Switzerland. This article is an open access article distributed under the terms and conditions of the Creative Commons Attribution (CC BY) license (http://creativecommons.org/licenses/by/4.0/).
Share and Cite
MDPI and ACS Style
Zhao, Z.; Wang, Y.; Hou, Y. Residents’ Spatial Perceptions of Urban Gardens Based on Soundscape and Landscape Differences. Sustainability 2020, 12, 6809. https://0-doi-org.brum.beds.ac.uk/10.3390/su12176809
AMA Style
Zhao Z, Wang Y, Hou Y. Residents’ Spatial Perceptions of Urban Gardens Based on Soundscape and Landscape Differences. Sustainability. 2020; 12(17):6809. https://0-doi-org.brum.beds.ac.uk/10.3390/su12176809
Chicago/Turabian StyleZhao, Zheng, Yanbin Wang, and Yilei Hou. 2020. "Residents’ Spatial Perceptions of Urban Gardens Based on Soundscape and Landscape Differences" Sustainability 12, no. 17: 6809. https://0-doi-org.brum.beds.ac.uk/10.3390/su12176809
Note that from the first issue of 2016, this journal uses article numbers instead of page numbers. See further details here.