Article

Evaluating the Performance of the Government Venture Capital Guiding Fund Using the Intuitionistic Fuzzy Analytic Hierarchy Process

1
College of Science & Technology, Ningbo University, Ningbo 315100, China
2
Alliance Manchester Business School, The University of Manchester, Manchester M13 9PT, UK
3
Griffith Business School, Griffith University, Gold Coast, QLD 4222, Australia
*
Author to whom correspondence should be addressed.
Sustainability 2020, 12(17), 6908; https://0-doi-org.brum.beds.ac.uk/10.3390/su12176908
Submission received: 7 July 2020 / Revised: 15 August 2020 / Accepted: 20 August 2020 / Published: 25 August 2020

Abstract

:
The performance evaluation of the government venture capital guiding fund (GVCGF) has come into focus in the field of venture capital. Most of the existing studies, such as whether the GVCGF has guided social capital to start-up enterprises and has played its due role in the process of enterprise growth and innovation, are all based on relevant work under the framework of econometric analysis. Unlike in these existing studies, we construct the performance analysis model of the GVCGF from four dimensions, including the standardization development of the guidance fund, the risk control ability, and the leverage and the support effects under the framework of a multi-attribute decision-making analysis. Taking a GVCGF project in Ningbo City, China, as an example, we comprehensively evaluate the development performance of the GVCGF using the intuitionistic fuzzy analytic hierarchy process (IFAHP). The results show that the development performance of the GVCGF is at a “relatively high” level. Compared with the traditional analytic hierarchy process (AHP), the IFAHP effectively avoids the false, enlarged influence caused by data subjectivity and evaluation uncertainty. This study provides a feasible analytical framework for the application of the IFAHP in other project performance evaluations.

1. Introduction

Many investors favor venture capital (VC) due to its unique foresight, flexibility, and high returns; this results in increased numbers of various commercial venture capital institutions [1]. Commercial venture capital has become an important intermediary in the financial market, providing the financial support needed for young high-tech companies to grow and playing an important role in promoting the growth and innovation of start-up companies [2,3,4,5,6,7,8,9,10,11,12,13,14,15]. However, the inherent profitability and the risk aversion tendency of commercial venture capital lead to insufficient concern and support for the start-up and seed-stage enterprises. Therefore, the potential market failures in the venture capital process, especially the ineffective resource allocation for innovation and entrepreneurship caused by the asymmetry of information and the externality of innovation, create an economic rationale for government involvement in venture capital markets [16,17]. Government intervention in the venture capital market can take the form of either direct financing subsidy or the form of a guiding fund attracting commercial venture capital through policy-oriented guide investment and exerting a “leverage effect”. However, the direct funding support for innovation and entrepreneurship may lead some companies to send false “innovation and entrepreneurship” signals and to receive rent-seeking income. In this case, the direct government funding for innovation and entrepreneurship causes distortions; in other words, inefficient enterprises may survive while the survival of efficient enterprises may be hindered [15]. As a result, governments around the world have introduced a large number of programs to support entrepreneurial businesses, typically through setting up the government venture capital (GVC) funds to invest in start-ups [18,19,20,21].
In China, government venture capital guiding funds (GVCGFs), as the government-established and market-oriented policy funds, have become an important policy tool to guide social capital into the field of venture capital and to guide venture capital into early-stage technology-based small and medium sized enterprises (SMEs). The funds aim to attract more capital investment in early-stage companies and to stimulate growth in government-encouraged innovative industries such as the Internet, big data, and clean energy [22]. In recent years, in order to implement and promote the strategic deployment of “mass entrepreneurship and innovation”, local governments have successively issued relevant policies and established or added some special funds for venture capital guidance. With the introduction of a series of national incentive policies, and the cultivation of public innovation and entrepreneurship, the GVCGF has entered a new round of high-speed development.
It is noteworthy that the GVCGF in China has experienced explosive growth since 2014. By the end of 2016, 448 national venture capital guiding funds in China had a total investment of RMB 51.865 billion, managing RMB 239,338 billion in total through equity participation, risk subsidy, and investment guarantee. Undoubtedly, the GVCGFs set up by different local governments have achieved some results in guiding funds into the field of “innovation and entrepreneurship”. A comprehensive evaluation of the GVCGFs established by local governments on, for example, whether they fully realize the original intention of the establishment of guiding funds and whether they effectively promote “innovation and entrepreneurship” in the region, is therefore needed. However, this has largely been ignored in the existing literature and our paper aims to fill this gap in the literature. Specifically, there are three reasons for conducting this research.
First, the existing literature focuses on the performance of the GVC in developed countries, especially the United States, Canada, Australia, Israel, the United Kingdom, and Germany [23], while there are few studies on the performance of the GVC in developing countries. As China is a large developing country, the performance of the Chinese GVCGFs, especially funds established by local governments, has not received much attention. Thus, we aim to have a deeper understanding of the performance of the local GVCGFs in China, which is the first motivation for this study.
Second, the existing literature on the evaluation of GVC in developed countries has not reached a consensus conclusion and has even reached opposing conclusions. This is shown in three aspects: (1) researchers have different views on whether the GVC has played a “guiding” role; some scholars give a positive answer [20,21,24], while other scholars hold that the direct government intervention cannot drive more private venture capital (PVC) [25,26] and may even “squeeze out” PVC [27,28,29]; (2) researchers have different views on whether the GVC promotes the growth of entrepreneurial enterprises; some scholars state that the GVC leads to better performance of entrepreneurs in different countries [30], while other scholars hold that the support from the GVC does not significantly promote the growth of entrepreneurs [31,32,33]; (3) researchers doubt the role of the GVC in corporate innovation; although some papers find that US Small Business Innovation Research (SBIR) projects have achieved good results in promoting research and development [34], other scholars show that the GVC alone can not stimulate enterprise innovation, but the joint investment from the GVC and the PVC has a positive impact [28,35]. These three conclusions are drawn based on the analysis of the GVC in developed countries, while little is known about the performance of the GVC in developing countries like China and which view they support. This leads to our second motivation.
Third, the complexity of the performance evaluation of the GVCGF needs to be studied indifferent dimensions and from multiple perspectives. Different research paradigms can help people understand the development performance of the GVCGF more comprehensively and deeply. Most of the papers use multi-regression methods to test whether the GVC has played a “guiding” role and whether it has a positive effect on promoting entrepreneurship, innovation, employment, and the growth of high-tech enterprises [16,19,21,26,28,31,33,36,37,38,39,40,41,42]. However, multiple regression analysis has specific requirements for the mathematical expression of the model and parameter estimation methods. For example, the use conditions of the least square (LS) method, generalized moment estimation (GMM) method, and maximum likelihood (LM) method are different. The number of samples and whether the sample data are stationary will affect the reliability of the empirical results. In addition, more importantly, the performance of the GVCGF is a relatively complex system problem, which involves its own normative development, risk prevention ability, leverage effect, the effect of supporting innovation and entrepreneurship, and so on. If we use a single econometric model to analyze, it is difficult to take these aspects into account at the same time. Therefore, there will be the problem of taking care of one and losing the other, and the conclusions may also be biased. In contrast, if the multi-attribute evaluation method can be introduced, the multi-dimensional evaluation of the development performance of the GVCGF can be organically combined, and then the decision-making problem of multi-objectives and multi-criteria can be transformed into a multi-level single objective problem. At last, a comprehensive evaluation result can be obtained through relatively simple mathematical operations. In recent years, multi-attribute evaluation under the intuitionistic fuzzy environment has attracted increasing attention due to its superiority. Currently, this method has been used to select start-up companies for the GVC [43,44,45], but has not been applied to evaluate the comprehensive performance of the GVC. This constitutes the third motivation for this study.
The goal of this study is to construct a multi-attribute decision-making model under an intuitionistic fuzzy environment to evaluate the development performance of the GVCGF. We use the GVCGF of Ningbo in China as a sample to conduct the evaluation, which provides a reference for other similar research projects. Our paper extends the literature in two ways. First, based on the existing project performance evaluation framework, we combine the literature and expert advice and select 19 out of 35 indicators from four dimensions, including standardization development, risk control capability, leverage effect, and support effect, to construct a comprehensive performance evaluation index system. The index system reflects the multi-development level of the GVCGF and also highlights the goal of the GVCGF to promote “innovation and entrepreneurship”. Second, we evaluate the performance of the GVCGF by the intuitionistic fuzzy analytic hierarchy process (IFAHP). Taking the GVCGF project of Ningbo in China as an example, we demonstrate the development performance evaluation process of the GVCGF under the intuitionistic fuzzy environment. We use the IFAHP to calculate the intuitionistic fuzzy weights of each evaluation index. The case study of the GVCGF of Ningbo confirms the relatively high performance of the GVCGF in Ningbo. Our comprehensive evaluation indicator system helps to better understand the performance of GVCGFs and provides an analysis framework for IFAHP applications.
The remainder of the paper is organized as follows: in Section 2, we review the related literature on the performance evaluation of the GVC and the evaluation methods; Section 3 presents our research design, including the goal, content, procedure, index system of performance evaluation, and methods used to assess the performance of the GVCGF; Section 4 elaborates the application of the performance evaluation model through the use of the GVCGF in Ningbo, China as an example; Section 5 concludes the article and draws some enlightenment.

2. Literature Review

2.1. The Performance Evaluation of the GVC

The existing literature on the performance evaluation of the GVC mainly focuses on three aspects. The first is whether the GVC plays a guiding role in the investment of venture capital; the second is what the economic performance of the GVC is; the third is whether to promote the innovation and entrepreneurship of enterprises. Specifically
(1) Has the guiding fund played its guiding role? The existing literature focuses on the “complementary” or “alternative” relationship and the “crowding in” or “squeezing out” effect between the GVC and the PVC. Views differ. Some scholars give a positive answer based on the analysis of the SBIR project in the US, the Finnish Industrial Investment Corporation (FII), the Israeli Yozma program, and the public venture capital programs in the UK [20,21,24]. In addition, empirical tests using data from different countries also find that financial support from the government can effectively increase a country’s entrepreneurial investment [16,26,37,46]. Other scholars have pointed out the shortages of the GVC. Even in the form of guiding funds, these funds still have difficulty in solving problems such as information asymmetry, and may even lead to distortion of investment strategies due to political interests [16]. Therefore, government direct intervention is ineffective [47]; guiding funds cannot attract private venture capital [25,26], and can even squeeze out private capital [27,28,29].
(2) What is the economic performance of the GVC? Some studies directly analyze the operational performance of the guiding fund itself, mainly by comparing the financial performance differences between the GVC and the PVC. For example, based on the analysis of the European Seed Capital Fund Scheme (ESCFS), Murray [48] finds that the policy venture capital support program with the nature of guiding funds has significantly lower returns than those of commercial venture capital. Other studies compare and analyze the operational performance of venture capital enterprises supported by guiding funds or other commercial guidance funds and thereby investigate the financial performance of the GVC in an indirect way. There are also different views on whether the GVC promotes the growth of invested entrepreneurs. Some researchers show that guiding funds can lead to better entrepreneurial performance in different countries, and that political connections can significantly improve corporate financing capabilities. Lerner [20] finds that companies funded by the US SBIR program for large public venture projects experience significant growth in employment and sales and are more likely to receive such financing in subsequent years. Audretsch et al. [34] state that the SBIR program contributes to promoting technological changes and improving the conversion rate of scientific and technological achievements by startups. Nightingale et al. [49] also find that government-backed venture capital schemes in the UK have a positive effect on corporate performance. Other scholars hold different opinions. Alperovych et al. [33] state that it is difficult for the support of government guidance funds to have a significant positive effect on the growth of startups. Sohn et al. [32] find that the financial performance of companies funded by the government has not improved significantly. Similarly, Grilli and Murtinu [31] hold that the impact of the GVC on corporate sales growth seems to be negligible; Zhang and Mayes [42] state that the performance of companies backed by the GVC is lower than those backed by the PVC.
(3) Does the venture capital guiding fund play a positive role in enterprise innovation? There is doubt that it does. Audretsch et al. [34] find that the US SBIR project has achieved good results in promoting research and development and that the GVC contributes to innovation. However, more studies suggest, for example, that commercial funds are more likely than regional public funds to lead innovation, that independent venture-backed companies outperform government-backed companies [35], and that companies receiving only public venture capital funding support are less likely to apply for a patent than those companies receiving investment from private venture capital funds [41]. Other studies hold that, though the GVC alone cannot promote enterprise innovation, the joint investment from the GVC and the PVC, especially when the PVC plays a dominant role, can improve the relationship between enterprise innovation investment and enterprise innovation. Thus, the GVC and the PVC should be united [28,35].

2.2. The Performance Evaluation Methods of the GVC

Most of the literature on the performance evaluation of the GVCGF is empirically tested in the framework of econometrics.
(1) Focusing on the guiding effect, Leleus and Surlemon [26] used weighted LS to to analyze the seeding or crowding out effect of public venture capital in 15 pan-European countries in 1990–1996; Cumming [37] used a fixed effect panel model confirm that government venture capital funds in Europe have not crowded out private venture capital investment; Guerini and Quas [50] used event history analysis and switching regression to investigate the screening and certification abilities of government-managed venture capital firms in Europe; Bertoni et al. [51] used panel probit regression to study how the GVC affects the investment behavior of the PVC.
(2) In terms of improving enterprise operational performance, Grilli and Murtinu [31] used GMM to assess the impact of government-managed and independent venture capital funds on the sales and employee growth of European high-tech entrepreneurial firms. Cumming et al. [19] used panel multi-nominal logit, probit, and panel instrumental variables to examine the impact of government versus private independent venture capital backing on the exit performance of entrepreneurial firms. Zhang [52] used logit regression and propensity score matching (PSM) to investigate the performance of mixed syndication involving both governmental and private venture capital firms in the context of China.
(3) On the promotion of innovation, Bertoni and Tykvová [35] used LSand obit regression to investigate which form of venture capital (governmental vs. private) is most supportive of innovation. Bertoni and Tykvov [25] used GMM to explore whether and how governmental venture capital investors spur invention and innovation in young biotech companies in Europe. Pierraki and Saridakis [41] used the negative binomial regression to examine the link between publicly backed venture capital funds and business innovation in the UK venture capital market.
Combined with different econometric methods, the existing empirical evidence has separately confirmed that the GVC can play a capital guiding role, and contributes to enterprise performance improvement and innovation. However, there is a lack of comprehensive evaluation of the self-development guiding effect and support effect of the GVC. It is difficult for econometrics to achieve the goal of multiple dimensions at the same time, while the introduction of a multi-attribute comprehensive evaluation method can easily achieve this goal. Chen [53] took the lead in designing of the comprehensive evaluation index system of the GVCGF, but she did not conduct specific case data analysis; further revising Chen’s [53] evaluation index system, Xiang [54] used the traditional fuzzy analytic hierarchy process (FAHP) to evaluate the performance of GVCGF in Ningbo and Hangzhou, and results show the performance of the GVCGF in Hangzhou. However, one of the most important defects of the traditional FAHP is that the determination of the index weight vector is more subjective.
We introduce a new multi-attribute comprehensive evaluation method, the IFAHP, to evaluate the development performance of the GVCGF. IFAHP is the application of the analytic hierarchy process (AHP) in an intuitionistic fuzzy environment. The AHP proposed by Saaty [55] is an effective method to transform semi-qualitative and semi-quantitative problems into quantitative calculations. The limitation of this method in project performance evaluation is reflected in the fact that the evaluation results rely heavily on the subjectivity of decision-makers, so the objectivity of evaluation is difficult to guarantee. For this reason, Laarhoven and Pedrycz [56] introduced fuzzy set theory into the AHP. Buckley [57] further proposed a fuzzy analytic hierarchy process (FAHP), based on Laarhoven and Pedrycz [58], which could fuzzify the subjective information of decision-makers. While the FAHP could solve the problem of subjective dependence on decision-makers in the AHP, it could not accurately reflect the hesitation or abstention of the respondents. In addition, a different method was needed to aggregate qualitative and quantitative factors. For this reason, Atanassov [58,59,60] introduced hesitation into Zadeh’s fuzzy set [61] and proposed an intuitionistic fuzzy set. Xu and Liao [62] further introduced the FAHP into an intuitionistic fuzzy information environment and developed the IFAHP to solve multi-attribute decision-making problems. This method not only improved the objectivity of expert judgment but also completed the whole process. It reflected the hesitant information of decision-makers when they make judgments on the evaluation objects. Another remarkable advantage was that, when the judgment matrix fails to pass the consistency test, there is no need to collect expert information again. Satisfactory results can be achieved by adjusting the iteration parameters and transforming the judgment matrix.
Currently, the IFAHP has been being used in various fields, such as business [45,63,64], energy [43,65], the environment [66,67], and human capital [68], as well as in many other areas. Although some scholars have used the multi-attribute decision-making method to study how GVC chooses startup investments [44,45], those papers do not target the comprehensive performance evaluation of the GVC. The aim of this paper is to fill this gap in the literature.

3. Research Design

3.1. Objectives and Contents of Performance Evaluation of the GVCGF

As a policy tool, the GVCGF has been set up to solve the problem of the failure of the venture capital market and to intervene in the capital supply side [28]. Although the names and connotations of the GVCGF in different countries are not identical, they all have policy characteristics. They are investment funds set up by governments, operated in a market-oriented way and for non-profit purposes. The purpose of their establishment is to guide social funds into specific venture capital areas, especially those fields which cannot completely rely on the market to allocate venture capital, such as investment stages, industries, or regions where the allocation of venture capital fails. To sum up, the GVCGF has four main roles: (1) to guide social capital and promote the formation of the aggregation mechanism of venture capital; (2) to guide the direction of investment and make up for the market gap; (3) to optimize the allocation of resources and promote independent innovation; and (4) to train talent and to promote the development of local venture capital. Therefore, from the perspective of functionalism, the performance evaluation of the GVCGF should focus on whether the GVCGF has played its dual role in guiding social capital into the field of venture capital and supporting and promoting innovation and entrepreneurship. From the perspective of sustainable development, the performance evaluation of the GVCGF should not only focus on whether the GVCGF realizes the basic purpose of its establishment, but should also pay attention to the development of the GVCGF itself. Therefore, the evaluation of the GVCGF should also pay attention to the standardization development, the risk prevention ability, and specialization development of the GVCGF project.

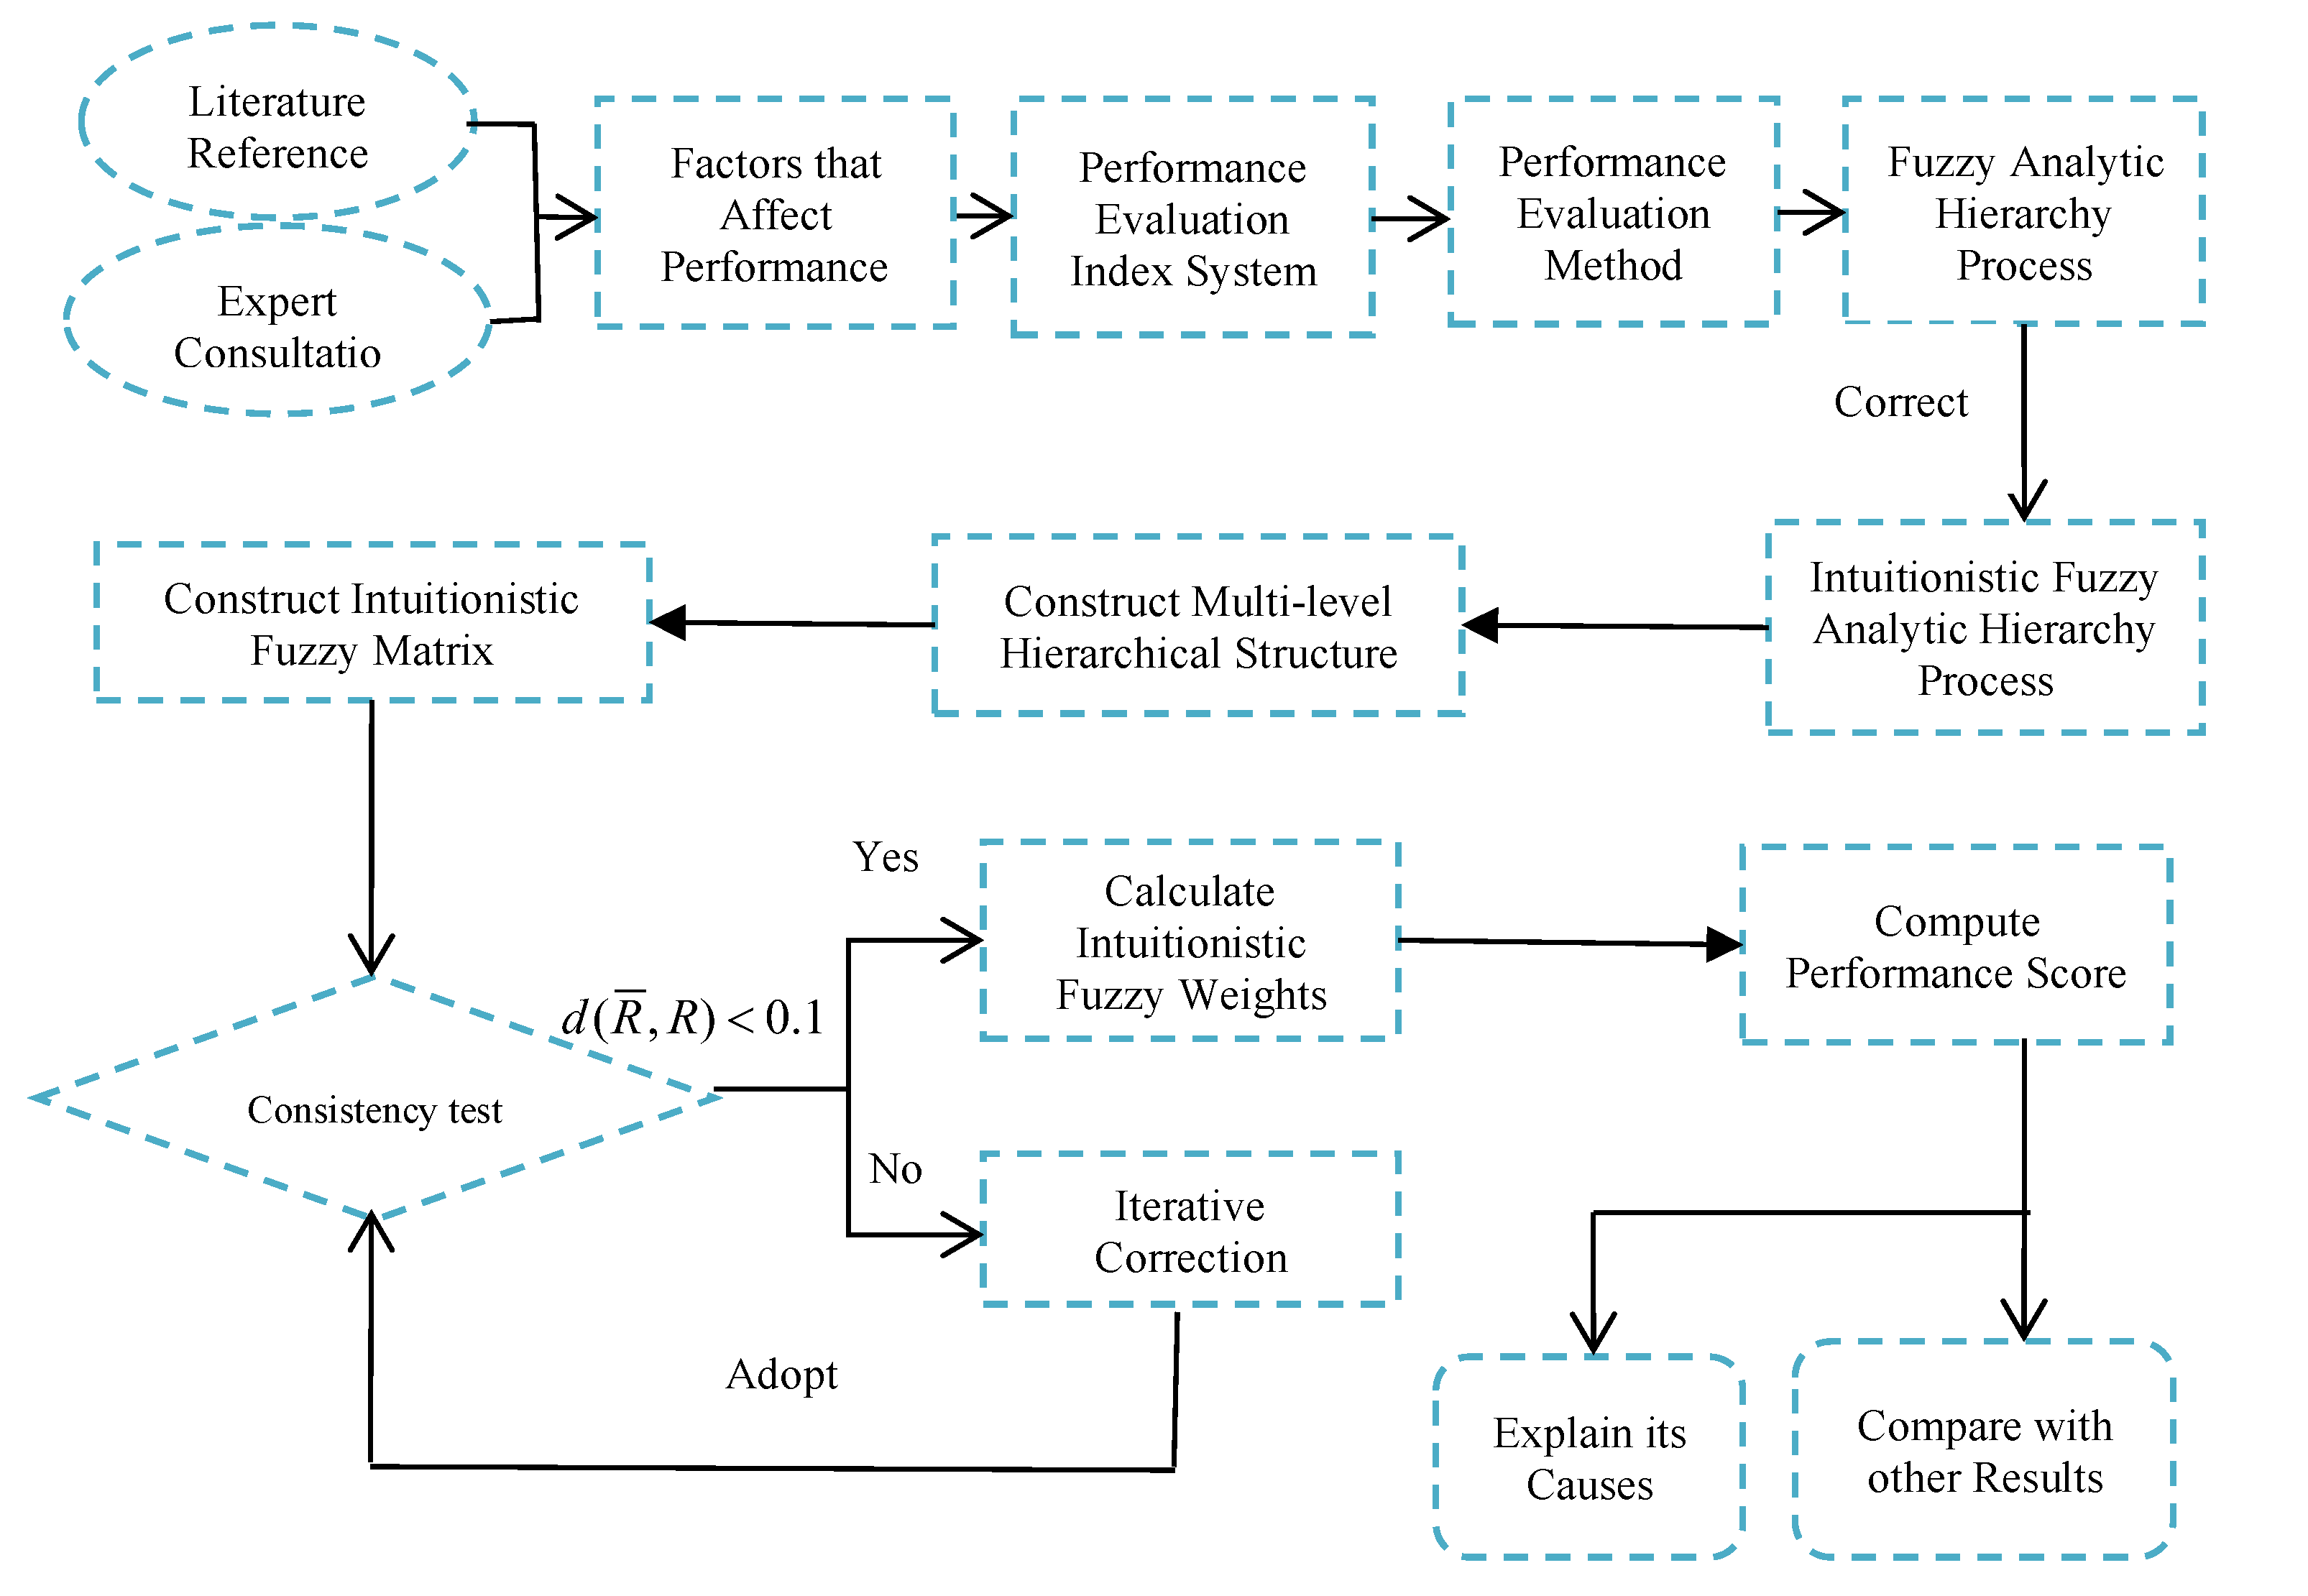
3.2. Procedure of Performance Evaluation of the GVCGF

In order to reasonably evaluate the comprehensive performance of the GVCGF, we at first construct the performance evaluation index system and select the most important indicators suitable for evaluating the performance of the GVCGF, based on the existing literature, on central and local government documents, and on expert advice. We then compare the advantages and disadvantages of different methods of comprehensive performance evaluation and choose the IFAHP approach to evaluate the performance of the sample GVCGF, the project of the GVCGF in Ningbo, China. We further compare the evaluation results of the IFAHP to the evaluation results of the traditional analytic hierarchy process (AHP), to check the consistency of the evaluation results with different methods and to reflect the flexibility and superiority of the IFAHP in dealing with fuzzy information in this paper. The procedure of evaluation is shown in Figure 1.

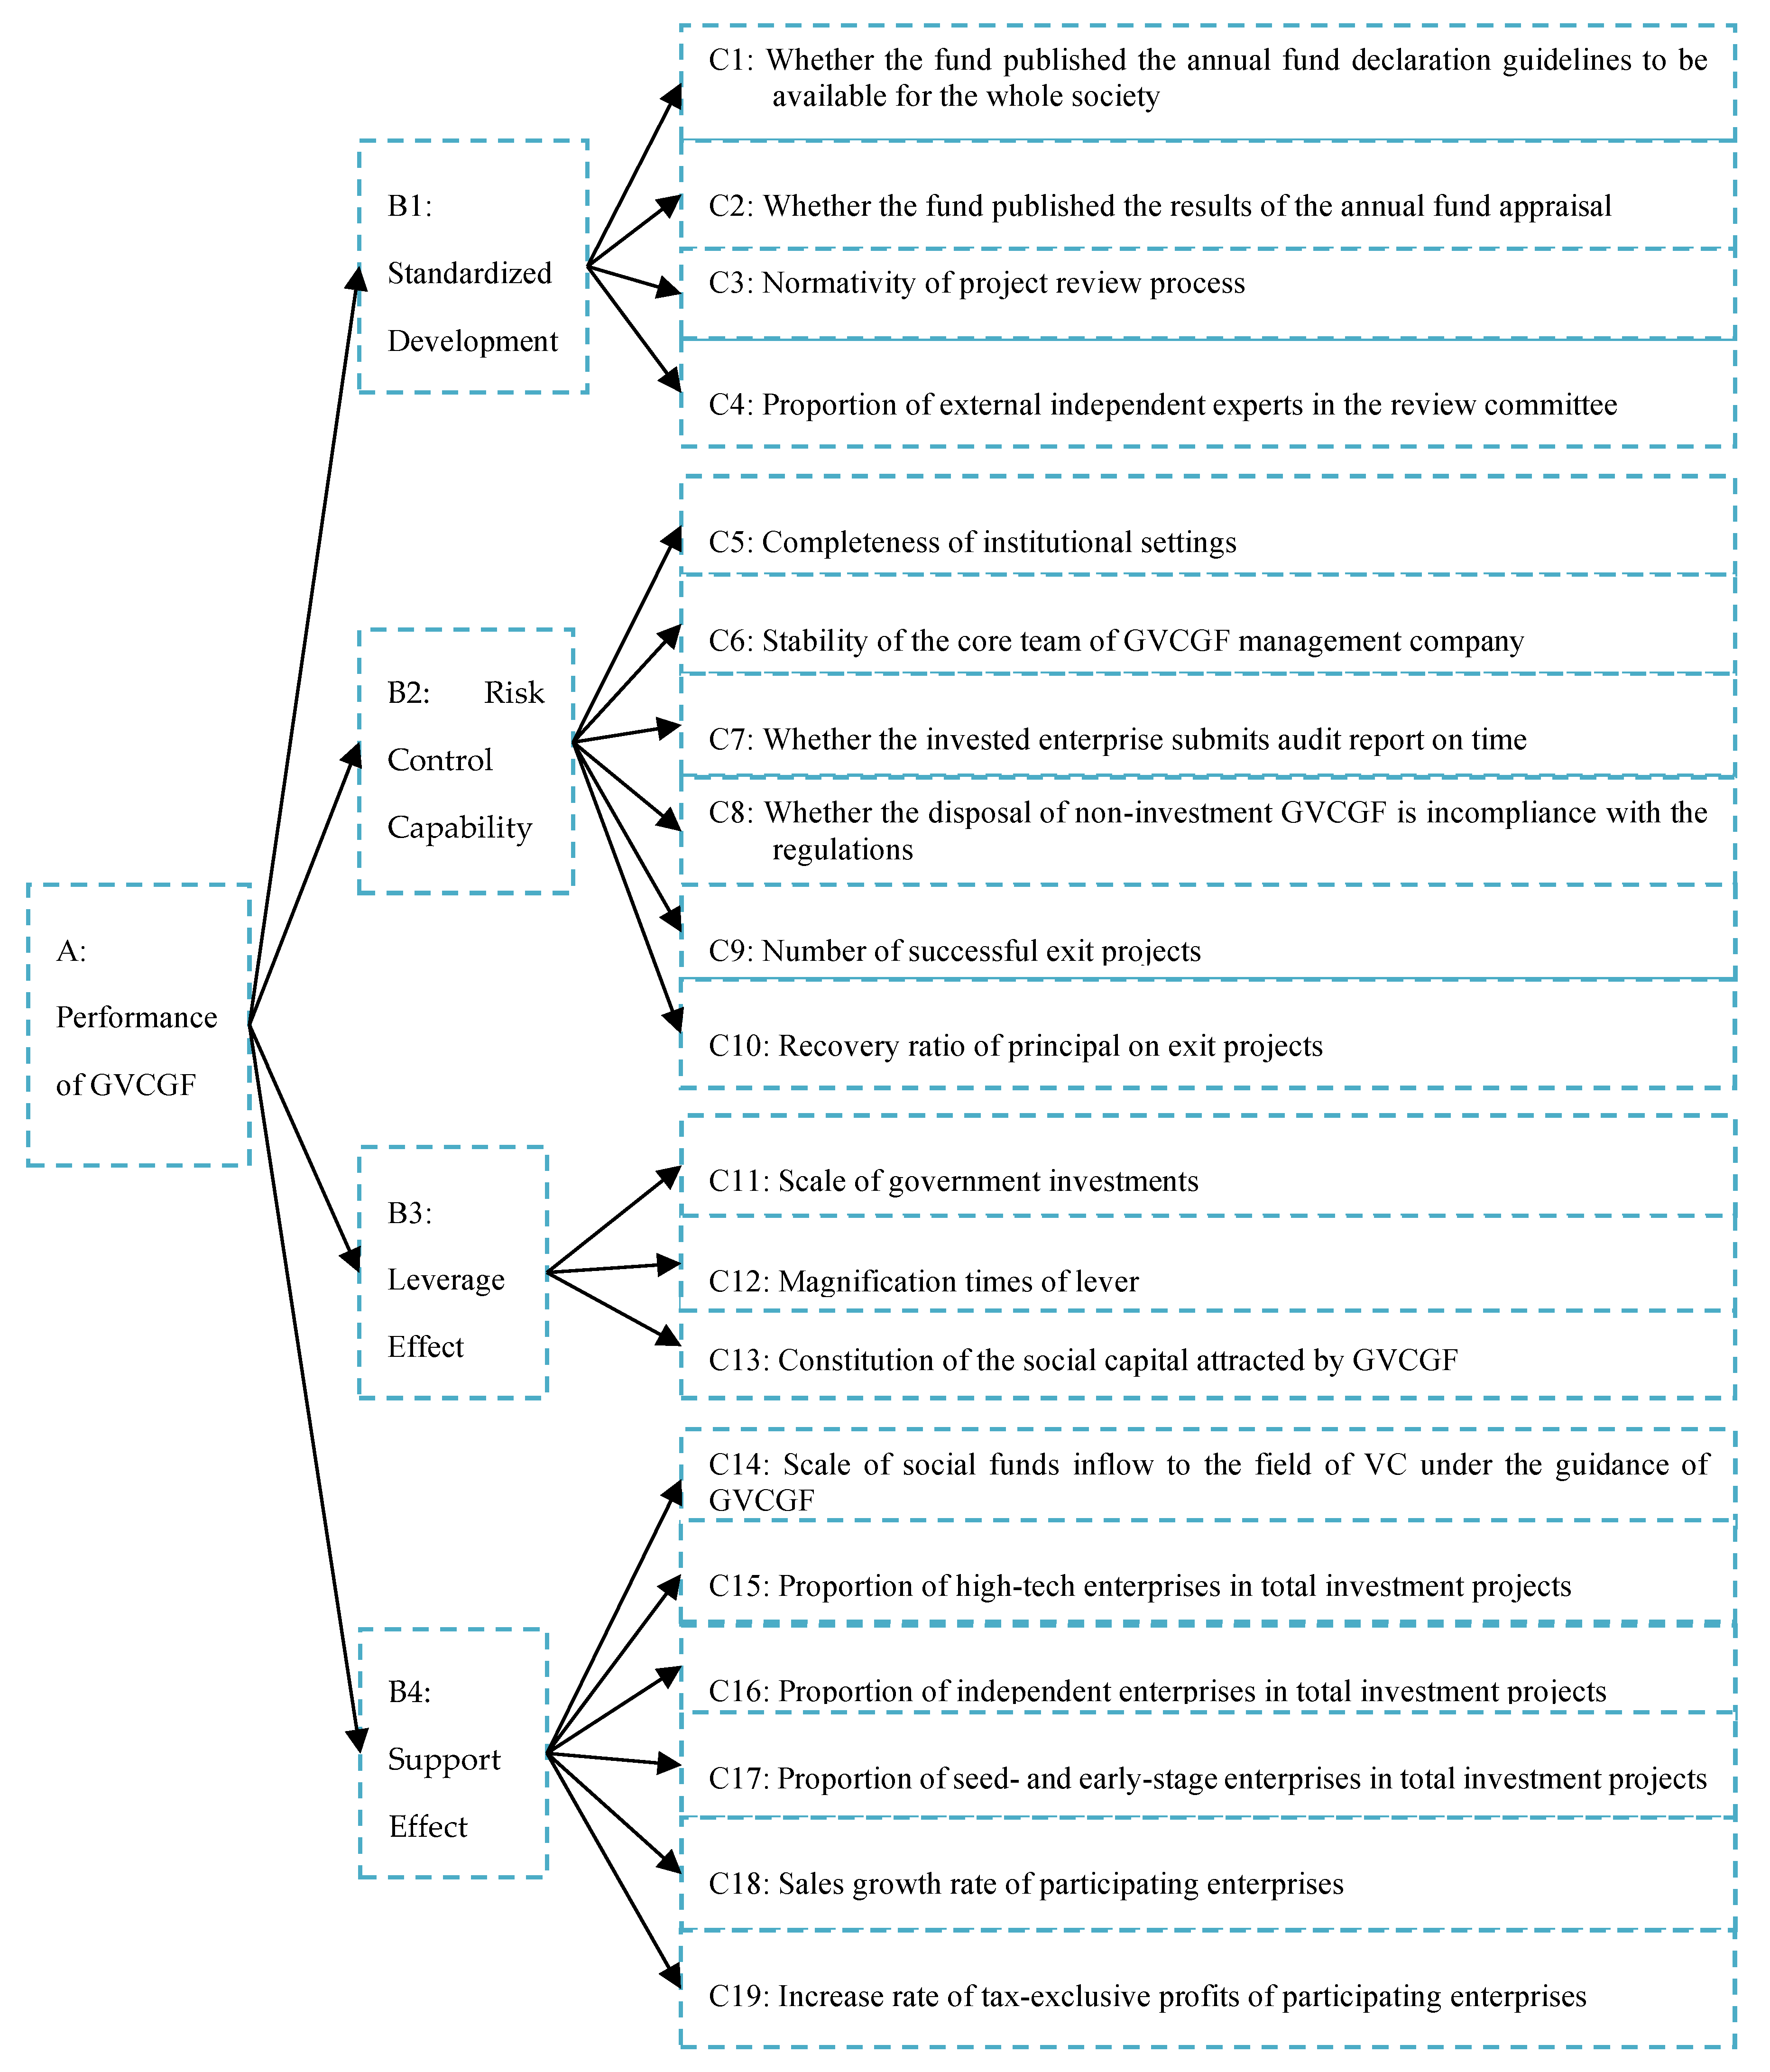
3.3. Construction of the Index System for Performance Evaluation of the GVCGF

The construction of a reasonable evaluation index system is a very important part of performance evaluation. In order to get a reasonable evaluation index system, we absorb and learn from the mature practices in the existing literature and extract 35 indicators to evaluate the performance of the GVC funds (see Appendix A). In order to select the most important indicators of the 35 indicators, we construct aLikert scale table and consult relevant experts. The specific steps are as follows:
Firstly, we determine the ratio scale for the importance of the criteria. The ratio scale (ai) describes the subjective view of a decision-maker about the importance of criteria in evaluating the performance of the GVCGF. Referring to Weng et al. [69], we identify the relevant commentary set of indicators that influence the development performance of the GVCGF, and determine the ratio scale a i = [ a 1 , a 2 , a 3 , a 4 ] = [unimportant, important, fairly important, very important] = [0.1, 0.4, 0.7, 0.9].
Secondly, we evaluate the importance of each indicator. Ten experts, including five industry experts and five researchers, are invited to conduct separate assessments. We then get the aggregation of decisions W n = ( r i / d ) × a i , where r i is the number of decision-makers who give the evaluation a i , n is the number of evaluated factors, n = 35 ; d is the total number of decision-makers, and d = 10 ; Y = [ w 1 , w 2 , , w n ] is the evaluation result matrix. The evaluation results of the importance of each factor are shown in Appendix A.
Finally, we choose the indicators that enter the evaluation model. In order to retain the fairly important and very important factors as the performance evaluation factors of the GVCGF, we select 19 factors whose importance score is more than 0.7.
The target layer of this study is the development performance of the GVCGF (expressed in A). The criterion layer includes four aspects: the standardized development of the GVCGF, the risk control ability of the GVCGF, the leverage effect of the GVCGF, and the support effect of the GVCGF (expressed in Bi). They are further subdivided into 19 index-level evaluation indicators (expressed in Ci). Then a hierarchical structure model of the performance evaluation of the GVCGF is constructed, as shown in Figure 2.

3.4. The IFAHP for Performance Evaluation of the GVCGF

Using a scientific calculation method is another key link in the performance evaluation. For the performance evaluation index system of the GVCGF in Figure 2, which has a clear hierarchical structure, the analytic hierarchy process is a natural choice. Considering the possible impact of hesitant information, when decision-makers make judgments on the performance evaluation results of the GVCGF, and the difficulty of re-collecting data, this paper chooses the IFAHP approach to analyze the development performance of the GVCGF. The specific steps are as follows:
Step 1: Construction of a performance evaluation index system. The evaluation index system of the development performance of the GVCGF is shown in Figure 2.
Step 2: Construction of the intuitionistic fuzzy judgment matrix (IFJM). Let X = [ x 1 , x 2 , x n ] , A = { x , μ A ( x ) , ν A ( x ) } is an intuitionistic fuzzy set on the universe, μ A and ν A denote that the degree of membership and the degree of non-membership of element x belong to fuzzy set A, respectively, and μ A [ 0 , 1 ] , μ B [ 0 , 1 ] , 0 μ A + ν A 1 . If π A = 1 μ A ν A , so π A can be expressed as the degree of hesitation of element x to A.
In the process of constructing the evaluation matrix of the intuitionistic fuzzy preference relationship for the development performance of the GVCGF, based on the evaluation criteria (see Table 1) of the relative importance of the two indicators, decision-makers are invited to make pairwise comparisons of indicators at the criterion level, and a comprehensive IFJM R = ( r i j ) n × n = ( μ i j , ν i j ) n × n is obtained by integrating the preference relationship matrix.
Referring to the evaluation criteria of the relative importance of two indexes, K decision-makersare invited to compare the criteria level indicators by pairwise comparisons, and the IFJM R = ( r i j ) n × n = ( μ i j , ν i j ) n × n of K decision-makers ‘evaluation information is obtained by using a preference relation matrix integration method. Among them, the degree of membership μ i j indicates the importance of the i t h index relative to the j t h index; the degree of non-membership ν i j indicates the importance of the j t h index over the i t h index; the degree of hesitation π i j = 1 μ i j ν i j .
In this paper, the integration method of the preference relation matrix refers to the practice of Xu and Cai [70]. Suppose R k = r i j ( k ) = ( μ i j ( k ) i j , ν i j ( k ) ) ( i , j = 1 , 2 , , n ; k = 1 , 2 , , l ) is the IFJM given by the Kth decision-maker for the evaluated object, ω k is the weight of the kth decision-maker, and l is the number of decision-makers. Then R = ( r i j ) n × n as the integration of R k = ( r i j ( k ) ) n × n is also an intuitionistic fuzzy matrix. Among them,
r i j = ( μ i j , ν i j ) , μ i j = k = 1 l ω k μ i j ( k ) , ν i j = k = 1 l ω k ν i j ( k ) , μ i i = ν i i = 0.5 , ( i , j = 1 , 2 , , n )
In the same way, we can also compare the importance of each index belonging to each criterion layer and get the IFJM after the index level is integrated.
Step 3: Check the consistency of the IFJM. Unlike Saaty’s [55] method of calculating the consistency ratio (CR) in the analytic hierarchy process, this paper uses the intuitionistic fuzzy information defined by Szmid and Kacprzyk [71] to measure the distance, and obtains the distance Formula (2) of the consistency of the IFJM:
d ( R ¯ , R ) = 1 2 ( n 1 ) ( n 2 ) i = 1 n j = 1 n ( | μ ¯ i j μ i j | + | ν ¯ i j ν i j | + | π ¯ i j π i j | )
where the IFJM R = ( r i j ) n × n is the result of comparing two indexes in each layer according to their relative importance. The IFJM R ¯ = ( r ¯ i j ) n × n is modified on the basis of the IFJM R using formulas (i)–(iii):
(i) If j > i + 1 , let r ¯ i j = ( μ ¯ i j , v ¯ i j ) ;
In which
μ ¯ ij = t = i + 1 j 1 μ i t μ t j j i 1 / ( t = i + 1 j 1 μ i t μ t j j i 1 + t = i + 1 j 1 ( 1 μ i t ) ( 1 μ t j ) j i 1 ) ,
ν ¯ ij = t = i + 1 j 1 ν i t ν t j j i 1 / ( t = i + 1 j 1 v i t v t j j i 1 + t = i + 1 j 1 ( 1 ν i t ) ( 1 ν t j ) j i 1 ) .
(ii) If j = i + 1 , let r ¯ i j = r i j
(iii) If j < i + 1 , let r ¯ i j = ( v ¯ i j , μ ¯ i j )
If d ( R ¯ , R ) < 0.1 , the IFJM R ¯ has passed the consistency test; if otherwise, it has not passed the test.
Step 4: Modify the IFJM to meet the consistency requirements. If R ¯ fails to pass the consistency test, iteration parameters σ need to be introduced to modify R ¯ by adjusting different σ values, σ [ 0 , 1 ] . If σ = 0 , R ˜ = R ; if σ = 1 , R ˜ = R ¯ and the iteration experiment is carried out with −0.01 as the step size from the beginning. In the actual iteration process, the larger the σ value, the easier it is to pass the consistency test. By adjusting the parameters σ , the IFJM R ˜ i j = ( r ˜ i j ) n × n is obtained. The specific conversion formula is as follows:
μ ˜ i j = ( μ i j ) 1 σ ( μ ¯ i j ) σ ( μ i j ) 1 σ ( μ ¯ i j ) σ + ( 1 μ i j ) 1 σ ( 1 μ ¯ i j ) σ ,   i , j   =   1 , 2 , n
ν ˜ i j = ( ν i j ) 1 σ ( ν ¯ i j ) σ ( ν i j ) 1 σ ( v ¯ i j ) σ + ( 1 ν i j ) 1 σ ( 1 ν ¯ i j ) σ ,   i , j   =   1 , 2 , n
We then further calculate the distance d with Formula (7), which is repeated until d ( R ˜ , R ) < 0.1 .
d ( R ˜ , R ) = 1 2 ( n 1 ) ( n 2 ) i = 1 n j = 1 n ( | μ ˜ i j μ i j | + | ν ˜ i j ν i j | + | π ˜ i j π i j | )
Step 5: Determine the weight of single-level indicators. As in the practice of Xu and Liao [62], the weight of each index at the criterion level and the index level are both calculated with Formula (8).
ω i = ( j = 1 n μ ˜ i j i = 1 n j = 1 n ( 1 v ˜ i j ) , 1 i = 1 n j = 1 n ( 1 v ˜ i j ) j = 1 n μ ˜ i j )
Step 6: Calculate the comprehensive weight of the indicators. According to operation rule (9) of the intuitionistic fuzzy number proposed by Xu [72], the weights of each index layer in Figure 2 and the corresponding indicator weights of the criterion layer are aggregated to obtain the comprehensive weights of a single evaluation indicator using Formula (10):
ω 1 ω 2 = ( μ ω 1 μ ω 2 , ν ω 1 + ν ω 2 ν ω 1 ν ω 2 )
ω ( w i ) = ω B k ω C i , k = 1 , 2 , , m ; i = 1 , 2 , n
Step 7: Normalize the weight of the indicators. Because the weight of each index obtained by Step 6 is still an intuitionistic fuzzy number, the weight of each index is obtained according to Formula (11), based on Gao et al. [73]. Then the weight of each index is normalized by Formula (12), and the normalized weight of the indicator is obtained.
H ( w i ) = ( 1 ν i ) / ( 1 + π i )
w ¯ i = H ( w i ) / i = 1 n H ( w i ) , j = 1 , 2 , , n
Step 8: Calculate the comprehensive performance. According to Formula (13), the comprehensive performance evaluation results are obtained by means of a weighted average.
A = i = 1 n w ¯ i x i
where x i is the membership degree of a single evaluation index and w ¯ i is the normalized evaluation indicator weight.

3.5. Judgement Criteria for the Development Performance of the GVCGF

Influenced by the normalization of evaluation indicators, the comprehensive evaluation index A of the development performance of the GVCGF should change between 0 and 1. The criteria for dividing the comprehensive evaluation results of different grades are shown in Table 2. According to Table 2, the development performance index of the GVCGF can be divided into four levels: if 0 A < 0.25 , the evaluation results are in level I; if 0.25 A < 0.5 , the evaluation results are in level II; if 0.5 A < 0.75 , the evaluation results are in level III; if 0.75 A 1 , the evaluation results are in level IV. Generally speaking, the higher the score of A, the higher the grade and performance level of the corresponding GVCGF.

4. Application of the Performance Evaluation Model

4.1. Performance Evaluation Process of the GVCGF in Ningbo, China

Ningbo City is an open-port city located on the southeast coast of China. In 2007, Ningbo City clearly put forward the establishment of the GVCGF in the document “Opinions on Further Promoting Independent Innovation and Building an Innovative City”. In October 2011, the General Office of the People’s Government of Ningbo Municipality issued the file “Ningbo Venture Capital Guiding Fund Management Measures”, formally establishing the Ningbo Venture Capital Guiding Fund, which has a total scale of RMB 1 billion. The GVCGF adopts two forms of investments, stage participation and follow-up investment, and focuses on “new materials, new equipment, new energy, new generation communication technology, marine high technology, energy conservation, and environmental protection, life and health, creative design and other fields”. By the end of July 2018, the GVCGF of Ningbo participated in 26 staged equity-participating companies, and reached 10 follow-up investment cooperation projects, with a total fundraising of more than RMB 2.4 billion, which was a magnification effect of about 5.3 times.
We use the IFAHP to synthesize the development performance of the GVCGF of Ningbo. The target layer, criterion layer, and index layer of the performance evaluation index system of the GVCGF are shown in Figure 2. We use the expert scoring method to obtain the intuitionistic fuzzy preference relationship matrix. We invite government managers, company executives, and researchers involved in the GVCGF to compare the importance of each criterion level index relative to the target level and the importance of each indicator to the criterion level. Six decision-makers reclassified into three groups, with the three groups are scored independently. The weight w k of the three groups is (0.4, 0.3, 0.3), respectively. The collective preference relation matrix, composed of three groups, is obtained by Formula (1). Among them, the integrated IFJM R of the criterion level is denoted as R A and the integrated IFJM R , of the index level, is denoted as R B 1 , R B 2 , R B 3 , and R B 4 respectively.
R A = [ ( 0.500 , 0.500 )   ( 0.325 , 0.570 )   ( 0.200 , 0.700 )   ( 0.115 , 0.870 )   ( 0.570 , 0.325 )   ( 0.500 , 0.500 )   ( 0.150 , 0.800 )   ( 0.150 , 0.800 )   ( 0.700 , 0.200 )   ( 0.800 , 0.150 )   ( 0.500 , 0.500 )   ( 0.325 , 0.570 )   ( 0.870 , 0.115 )   ( 0.800 , 0.150 )   ( 0.570 , 0.325 )   ( 0.500 , 0.500 ) ]
R B 1 = [ ( 0.500 , 0.500 )   ( 0.425 , 0.530 )   ( 0.250 , 0.600 )   ( 0.500 , 0.500 ) ( 0.530 , 0.425 )   ( 0.500 , 0.500 )   ( 0.500 , 0.500 )   ( 0.500 , 0.500 ) ( 0.600 , 0.250 )   ( 0.500 , 0.500 )   ( 0.500 , 0.500 )   ( 0.600 , 0.250 )   ( 0.500 , 0.500 )   ( 0.500 , 0.500 )   ( 0.250 , 0.600 )   ( 0.500 , 0.500 ) ]
R B 2 = [ ( 0.500 , 0.500 )   ( 0.200 , 0.700 )   ( 0.630 , 0.235 )   ( 0.250 , 0.600 )   ( 0.165 , 0.770 )   ( 0.250 , 0.600 ) ( 0.700 , 0.200 )   ( 0.500 , 0.500 )   ( 0.700 , 0.200 )   ( 0.200 , 0.700 )   ( 0.800 , 0.150 )   ( 0.290 , 0.640 ) ( 0.235 , 0.630 )   ( 0.200 , 0.700 )   ( 0.500 , 0.500 )   ( 0.250 , 0.600 )   ( 0.250 , 0.600 )   ( 0.410 , 0.560 )   ( 0.600 , 0.250 )   ( 0.200 , 0.700 )   ( 0.600 , 0.250 )   ( 0.500 , 0.500 )   ( 0.250 , 0.600 )   ( 0.425 , 0.530 )   ( 0.770 , 0.165 )   ( 0.150 , 0.800 )   ( 0.600 , 0.250 )   ( 0.600 , 0.250 )   ( 0.500 , 0.500 )   ( 0.400 , 0.540 ) ( 0.600 , 0.250 )   ( 0.640 , 0.290 )   ( 0.700 , 0.200 )   ( 0.530 , 0.425 )   ( 0.570 , 0.325   )   ( 0.500 , 0.500 ) ]
R B 3 = [ ( 0.500 , 0.500 )   ( 0.305 , 0.610 )   ( 0.235 , 0.630 )   ( 0.610 , 0.305 )   ( 0.500 , 0.500 )   ( 0.690 , 0.205 )   ( 0.630 , 0.235   )   ( 0.205 , 0.690 )   ( 0.500 , 0.500 ) ]
R B 4 = [   ( 0.500 , 0.500 )   ( 0.770 , 0.165 )   ( 0.740 , 0.180 )   ( 0.800 , 0.150 )   ( 0.235 , 0.630 )   ( 0.235 , 0.630 )     ( 0.165 , 0.770 )   ( 0.500 , 0.500 )   ( 0.500 , 0.500 )   ( 0.500 , 0.500 )   ( 0.250 , 0.600 )   ( 0.250 , 0.600 )     ( 0.180 , 0.740 )   ( 0.500 , 0.500 )   ( 0.500 , 0.500 )   ( 0.500 , 0.500 )   ( 0.220 , 0.660 )   ( 0.220 , 0.660 )   ( 0.150 , 0.800 )   ( 0.500 , 0.500 )   ( 0.500 , 0.500 )   ( 0.500 , 0.500 )   ( 0.250 , 0.600 )   ( 0.250 , 0.600 )     ( 0.630 , 0.235 )   ( 0.600 , 0.250 )   ( 0.660 , 0.220 )   ( 0.600 , 0.250 )   ( 0.500 , 0.500 )   ( 0.500 , 0.500 )     ( 0.630 , 0.235 )   ( 0.600 , 0.250 )   ( 0.660 , 0.220 )   ( 0.600 , 0.250 )   ( 0.500 , 0.500 )   ( 0.500 , 0.500 ) ]
According to Step 3 and Step 4, the consistency of the IFJM is checked and revised. For the IFJM R A of the criterion level index, the modified IFJM R ¯ A is firstly calculated according to formulas (i)–(iii) in Step 3.
R ¯ A = [   ( 0.500 , 0.500 )   ( 0.425 , 0.530 )   ( 0.425 , 0.530 )   ( 0.378 , 0.429 )   ( 0.530 , 0.425 )   ( 0.500   , 0.500 )   ( 0.500 , 0.500 )   ( 0.600 , 0.250 )   ( 0.530 , 0.425 )   ( 0.500 , 0.500 )   ( 0.500 , 0.500 )   ( 0.600 , 0.250 )   ( 0.429 , 0.378 )   ( 0.250 , 0.600 )   ( 0.250 , 0.600 )   ( 0.500 , 0.500 ) ]
The distance d between R A and R ¯ A is then calculated by Formula (2). d ( R ¯ A , R A ) = 0.1014 > 0.1 means that R ¯ A has not passed the consistency test, so it is necessary to introduce parameters to modify R ¯ A . According to Step 4, we take the parameter σ A [ 0 , 1 ] for the iteration test from the beginning number 1, with −0.01 as the step size. Finally, when σ A = 0.9500, the adjusted IFJM R ˜ A is as follows:
R ˜ A = [ ( 0.500 , 0.500 )   ( 0.325 , 0.570 )   ( 0.078 , 0.841 )   ( 0.092 ,   0.802 )   ( 0.570 , 0.325 )   ( 0.500   , 0.500 )   ( 0.150 , 0.800 )   ( 0.078 , 0.841 )   ( 0.841 , 0.078 )   ( 0.800 , 0.150 )   ( 0.500 , 0.500 )   ( 0.325 , 0.570 )   ( 0.802 , 0.092 )   ( 0.841 , 0.078 )   ( 0.570 , 0.325 )   ( 0.500 , 0.500 ) ]
The distance between R A and R ˜ A , d ( R ˜ A , R A ) = 0.0970 < 0.1, indicates that the modified IFJM R ˜ A has passed the consistency test.
Similarly, according to the idea of the consistency test, for the IFJM R B 1 , the distance d ( R ¯ B 1 , R B 1 ) calculated by the Formula (2) is 0.2060, which is larger than 0.1, which indicates that R ¯ B 1 has not passed the consistency test. Therefore, it is necessary to adjust the parameter σ B 1 . Take the parameter σ B 1 [ 0 , 1 ] and use the same process as before to carry out iterative experiments. Finally, when σ B 1 = 0.4500, the distance d ( R ˜ B 1 , R B 1 ) is equal to 0.0940 < 0.1, which indicates that R ˜ B 1 has passed the consistency test.
For the IFJM R B 2 , the distance d ( R ¯ B 2 , R B 2 ) = 0.2547 > 0.1, it is necessary to adjust the parameter σ B 2 , when σ B 2 = 0.3500, the distance d ( R ˜ B 2 , R B 2 ) is equal to 0.0894 < 0.1, which indicates that R ˜ B 2 has passed the consistency test.
For the IFJM R B 3 , the distance d ( R ¯ B 3 , R B 3 ) = 0.3426 > 0.1, it is necessary to adjust the parameter σ B 3 , when σ B 3 is equal to 0.2500, the distance d ( R ˜ B 3 , R B 3 ) is equal to 0.0871 < 0.1, which indicates that R ˜ B 3 has passed the consistency test.
For the IFJM R B 4 , the distance d ( R ¯ B 4 , R B 4 ) is equal to 0.0903 < 0.1, which means that R ¯ B 4 passes the consistency test.
Step 5 further determines the index weight of each level. To further determine the index weight of each level, as in Step5, the weights of the four criteria hierarchical indicators can be calculated by Formula (8) with the intuitionistic fuzzy consistency judgment matrix R ˜ A . The calculation results show that:
ω B 1 = (0.117, 0.828); ω B 2 = (0.153, 0.795); ω B 3 = (0.289, 0.639); ω B 4 = (0.319, 0.599).
The weight of each index hierarchy indicator can be calculated by Formula (8) according to the IFJM R ˜ B 1 , and the calculation result show that: ω C 1 = (0.200,0.743); ω C 2 = (0.245,0.709); ω C 3 = (0.256,0.678); ω C 4 = (0.189, 0.746). Similarly, the calculation results of ω C 5 to ω C 19 can be obtained based on R ˜ B 2 , R ˜ B 3 , and R ¯ B 4 , as shown in Table 3.
Step 6 aggregates the index weights of each index level with the corresponding index weights of the criterion level with formulas (9) and (10). For example, ω ( C 1 ) = ω B 1 ω C 1 = (0.117,0.828) (0.200,0.743) = (0.023,0.956). The remaining weights can be obtained similarly, as shown in Table 3.
According to Step 7, the normalized index weight (W1, W2, W3) can be obtained as shown in Table 3; according to Step 8, the comprehensive performance is calculated. In order to calculate the performance of the GVCGF of Ningbo, we need not only the weight of a single index (Wi), but also the membership degree of a single evaluation index (xi). For this purpose, 19 evaluation indicators need to be defined first, as shown in Appendix B.
Because the evaluation index value belongs to different types of data, its index dimension and nature are completely different, and there is no comparability between the different indicators. According to the requirements of the fuzzy comprehensive evaluation method, all kinds of data need to be normalized and transformed into values in the [0, 1] interval. Virtual binary variables (C1, C2, C7, C8) and virtual qualitative variables (C3, C5, C6) are obtained by investigating 10 decision-makers involved in venture capital funds; the basic data of the continuous variables (C4, C9, C10, C11, C12, C13, C14, C15, C16, C17, C18, C19) are derived from the publicity information of the website of Ningbo Venture Capital Guiding Fund Management Co., Ltd. and the relevant information published by Tianye Check Along with interviews with leading fund participating enterprises, we obtain the related data from 2014 to 2016, and then take the average of the three-year data as the final variable. Referring to the practice of Cerioli and Zani [74], we calculate the membership degree of the virtual binary variable (Dum) with Formula (14); the membership degree of the virtual qualitative variable (Qua) and the continuous variable (Con) are calculated by Formula (15).
Z ( x ) = { 0 i f x = 0 1 i f x = 1
Z ( x ) = { 0 x x min ( x x min ) / ( x max x min ) x min < x < x max 1 x x max
where, for the qualitative variable (Qua), x max and x min represent the maximum and minimum of the 10 scoring results, respectively; for continuous variables (Con), x max and x min represent the maximum and minimum values of the three-year sample data, respectively. The calculation results of the membership degree (Z1) of indicators are shown in the third column in Table 4. The evaluation results of the comprehensive performance, calculated according to Formula (13), are shown in Table 4.

4.2. Analysis of Performance Evaluation Results

It can be seen from Table 4 that the performance value of the GVCGF of Ningbo is 0.596. According to Table 2, this means that the performance level of the GVCGF of Ningbo falls within level III [0.50, 0.75] and is in a state of “relatively high” performance. The result is lower than Xiang’s [55] performance score of the GVCGF of Ningbo. The reason may be due to the difference in indicator dimension, data set collection, and calculation methods for comprehensive performance. Xiang [55] constructs a comprehensive evaluation index system based on the five dimensions, including policy effect index, management level index, economic value index, completion progress index, and growth potential index. The index values of Xiang [55] are all obtained according to the respondents’ score of the performance evaluation index of the GVCGF of Ningbo. The evaluation grades are divided into five grades: excellent, good, general, poor, and very poor, which are respectively assigned (1,0.8,0.6,0.4,0), and are not combined with the actual operation data of the GVCGF of Ningbo. In addition, the comprehensive evaluation results of hers are obtained by using the fuzzy AHP method.
An in-depth analysis of the contribution of each criterion level in the comprehensive evaluation index system can be used to better understand the reasons for the formation of the total performance results. The calculation results show that the contribution degree of the standardization development to comprehensive performance of GVCGH in Ningbo is 18.12% (0.108/0.596), the contribution degree of risk control ability is 19.59% (0.117/0.596), the contribution degree of the leverage effect is 29.01% (0.173/0.596), and the contribution of the support effect is 33.05% (0.197/0.596). This means that the ranking of the contribution degrees of the four dimensions is the supportive effect, leverage effect, risk control ability, and finally standardized development. This result is in line with the original intention of the local government when setting up the GVCGF. As a kind of policy-oriented guidance fund, the purpose of the GVCGF is to make up for the market failure of venture capital. It is based on the standard development of the guiding fund, is constrained by a certain range of risk tolerance, and guides more social capital into the venture capital sector as a means to promote the development of venture capital and innovative enterprises, and the importance of these four dimensions should also be gradually increasing. The evaluation results of this paper are highly consistent with the recognition of the importance of the four aspects by the competent government departments.

4.3. Comparison with the Results Obtained by AHP Methods

The significant difference between the IFAHP and AHP is that the weight calculation method of the criterion and index layer is different, so the corresponding weight calculated may be quite different, which will lead to a significant difference in comprehensive evaluation results. In order to compare the results of the IFAHP and AHP, we further use the AHP to calculate the performance evaluation results of the GVCGF in Ningbo. In the performance evaluation process by the AHP, we first calculate the weight of the performance evaluation index system with Yaaph software (see Appendix C for specific steps). It should be pointed out that the original judgment matrix A–B did not pass the consistency test (consistency check CR = 0.1070 > 0.1). After consulting experts again, the corrected judgment matrix A–B* passed the consistency test, and then calculated the corresponding index weight. The weighted average method is also used to obtain the comprehensive evaluation results of the development performance of the GVCGF in Ningbo (see Table 4).
Further comparing the results of the two methods, we find that the comprehensive evaluation values of the development performance of the GVCGF based on the IFAHP and AHP are 0.596 and 0.599, respectively, which are close to each other, and both are in the performance evaluation range of level III, indicating that the performance level of the GVCGF of Ningbo is relatively high. Although the results obtained by the two methods are basically consistent, the internal reasons for the results are not completely consistent, and we can learn from the contribution degree of each dimension to the total performance of the GVCGF in Ningbo. According to Table 4, the contribution degree of the standardized development of the GVCGF to the comprehensive performance is 18.12% and 16.71%, respectively; the contribution degree of the risk control ability is 19.59% and 9.84%, respectively; the contribution degree of the leverage effect is 29.01% and 22.42%, respectively; and the contribution degree of the support effect is 33.05% and 51.01%, respectively. The above results show that the ranking of the contribution degree of four dimensions (standardized development, risk control ability, leverage effect, and support effect) to the comprehensive performance calculated based on the IFAHP and AHP methods has the same ranking order, and the contribution degree of standardized development, the risk control ability, and the leverage effect to the comprehensive performance of the GVCGF in Ningbo is greater than the corresponding contribution calculated based on the AHP method, and the difference is not more than 10%. The most significant difference is that the contribution degree of the support effect to the comprehensive performance based on the AHP method is about 17.96% higher than that based on the IFAHP method, which may exaggerate the contribution of the support effect to the total performance to a certain extent. The results prove that the IFAHP method can effectively avoid data subjectivity and evaluation. Therefore, the results based on the IFAHP method have higher credibility.

5. Conclusions and Discussion

The performance evaluation of GVCGFs has become a hot issue in the field of venture capital. The relevant research on whether the GVCGF has guided social capital to start-up enterprises and played its due role in the process of enterprise growth and innovation is based on the framework of econometric analysis. Unlike the existing work, this paper constructs a development performance evaluation index system of GVCGFs from four dimensions, including standardization development, risk control ability, leverage effect, and support effect, and takes the GVCGF of Ningbo as an example, and the development performance of the GVCGF is evaluated by the IFAHP under the framework of multi-attribute decision-making analysis. The results show that the development performance of the GVCGF in Ningbo City is at a “relatively high” level. The conclusions based on the IFAHP approach and the FAHP approach are consistent but, compared with the contribution degree obtained by the IFAHP method, the AHP obviously exaggerates the contribution degree of the support effect to the comprehensive performance of the GVCGF of Ningbo. Due to the superiority of the IFAHP in dealing with uncertainties, this paper adopts the IFAHP method to effectively avoid the impact of data subjectivity and evaluation uncertainty in the process of the performance evaluation of the local GVCGF, and it makes the evaluation results more authentic and accurate. In short, the analytical framework of this study provides a feasible analytical framework for the application of the IFAHP method to other project performance evaluations.
The case study of Ningbo shows that the standardized development, risk control ability and leverage and support effects of the GVCGF have made different contributions to the performance improvement of the GVCGF of Ningbo. Therefore, if we want to improve the development performance of the GVCGF, we need to do the relevant improvement work from these four dimensions. Specifically, (1) in order to promote the healthy development of the GVCGF, it is necessary to guide the selection of the participating and follow-up funds to achieve transparency in the process and fairness in the results; (2) in order to improve the risk control ability of the GVCGF, it is necessary to improve the risk management institutions, strengthen the construction of the guiding fund management talent team, stabilize the core management team, and make rational and scientific decisions in the project and manage the savings (idle) in line with policy requirements; (3) in order to make full use of the leverage function of the GVCGF, it is necessary to control the scale, structure, speed, and rhythm of government-guided investment; and (4) in order to improve the support effect of the GVCGF, it is necessary to guide the money to flow into the enterprises in the initial stage, the innovative enterprises, and the strategic emerging enterprises. These are important facets of the sustainable development of the GVCGF.
Although this study has achieved the established research objectives, this work still has limitations. Firstly, this study provides a clear idea, concrete implementation method, and complete reference sample for the comprehensive evaluation of the GVCGF projects under the framework of multi-attribute decision analysis, which can be applied to the performance evaluation of other GVCGFs. However, due to the availability of data, this study does not study the performance of the GVCGF in similar cities, and this paper does not compare the performance of the GVCGF of Ningbo with that of similar cities.
Secondly, the index system constructed in this paper deserves further improvement and amendment. This is because the performance evaluation of the GVCGF is a complex task and many factors affect its performance. A set of performance evaluation criteria of the GVCGF proposed in this paper may not be fully applicable to all the requirements of government jurisdiction around the world for the performance evaluation of the GVCGF. Moreover, sub-factors need to be judged by decision-makers [44]. In view of this, the corresponding evaluation factors can be adjusted or modified according to the actual evaluation need in order to adapt to the project performance evaluation problems at hand. What is more, the constructed index system cannot be directly applied to the performance evaluation of other government-supported guiding funds, such as industry guidance funds, infrastructure, public service investment guidance funds, and so on.
Finally, there are many alternatives to the IFAHP. In the intuitionistic fuzzy analytic hierarchy process, checking and judging the consistency of preference relations are very important. The IFAHP method adopted in this study can effectively correct the inconsistency of the IFJM, which reflects the flexibility and superiority of the IFAHP. However, it should be pointed out that the IFAHP is also strongly dependent on the knowledge elicitation process, which is up to the managers and experts [75]. In the process of multi-attribute decision-making, hesitant fuzzy sets [76,77], hesitant fuzzy language terminology sets [78,79], and so on are also powerful alternative tools for intuitionistic fuzzy sets, which can be applied to the performance evaluation of the GVCGF.

Author Contributions

J.X., L.Y., and R.G. collaboratively worked on the theoretical framework. J.X. wrote the draft paper. J.X., L.Y., and R.G. revised the paper. All authors have read and agreed to the published version of the manuscript.

Funding

This work was sponsored by the Humanities and Social Sciences Research Youth Foundation Project of the Ministry of Education in China (No.16YJCZH124; 17YJCZH218), the Soft Science Research Project of the Science and Technology Department in Zhejiang Province (No.2018C35G2070227), Key Funding Projects of Humanities and Social Sciences of Universities in Zhejiang Province (No. 2016QN005), and Key Program of Science and Technology Innovation in Ningbo (2019B10009).

Acknowledgments

Thanks for the respondents who participated in the survey.

Conflicts of Interest

The authors declare no conflict of interest.

Appendix A

Table A1. The importance score of performance evaluation indicators of the government venture capital guiding fund (GVCGF).
CategoryIndicatorReferencea1 (0.1)a2 (0.4)a3 (0.7)a4 (0.9)ScoreRetain
Standardized developmentWhether the fund published the annual fund declaration guidelines to be available for the whole society[53]01270.81Yes
Whether the fund published the results of the annual fund appraisal[53]00280.86Yes
Quality of information provided on official websites[53]23320.53No
Normativity of the project review process[53]02440.72Yes
Normative selection of cooperative VC enterprises[53]03430.67No
Office capacity of the GVCGF Board[27]04330.64No
Proportion of external independent experts on the review committee[53]02440.72Yes
Professional evaluation ability of the GVCGF expert appraisers[80]03340.69No
Risk control capabilityWhether the record information is complete[53]13420.59No
Effectiveness of internal control mechanism[53]03520.65No
Completeness of institutional settings[80]02350.74Yes
Stability of the core team of the GVCGF management company[49]02530.70Yes
Whether the invested enterprise submits audit report on time[53]02440.72Yes
Whether the disposal of non-investment GVCGF is incompliance with the regulations[53]02350.74Yes
Number of exit projects[28]32320.50No
Number of successful exit projects[42]01540.75Yes
Recovery ratio of principal on exit projects[18,42]02350.74Yes
Leverage effectScale of government investments[16]02440.72Yes
Growth rate of the GVCGF[16]23320.53No
Magnification times of lever[26]02350.74Yes
Rate of the GVCGF in place[80]32230.52No
Investment structure of the GVCGF[81]12430.64No
Constitution of the social capital attracted by the GVCGF[80]02350.74Yes
Support effectWhether the fund investment in the related industry is supported and encouraged by the government[80]22420.56No
Scale of social funds inflow to the field of VC under the guidance of the GVCGF[16]02350.74Yes
Growth rate of social funds inflow to the field of VC under the guidance of the GVCGF[80]12430.64No
Proportion of high-tech enterprises in total investment projects[18,28]01450.77Yes
Proportion of local enterprises in total investment projects[38]13420.59No
Proportion of independent enterprises in total investment projects[35]02450.81Yes
Proportion of small and medium-sized enterprises in total investment projects[80]22420.56No
Proportion of seed- and early-stage enterprises in total investment projects[19]02350.74Yes
Employment growth rate of participating enterprises[31]12430.64No
Sales growth rate of participating enterprises[28]02440.72Yes
Number of successful R&D projects of participating enterprises[35]22330.58No
Increase rate of tax-exclusive profits of participating enterprises[49]02530.70Yes

Appendix B

Table A2. Definition and value of the performance evaluation index of the GVCGF.
Indicators NameDefinitionType
C1: Whether the fund published the annual fund declaration guidelines to be available to the whole societyPublished = 1, unpublished = 0Dum
C2: Whether the fund published the results of the annual fund appraisalPublished = 1, unpublished = 0Dum
C3: Normativity of project review processNon-normative = 0, relatively normative = 1, normative = 3, very normative = 5Qua
C4: Proportion of external independent experts on the review committeeNumber of external independent experts/Total number of review committeesCon
C5: Completeness of institutional settingsIncomplete = 0, relatively complete = 1, complete = 3, very complete = 5Qua
C6: Stability of the core team of the GVCGF management companyInstability = 0, relatively stable = 1, stable = 3, very stable = 5Qua
C7: Whether the invested enterprise submits audit report on timeDelivery on time = 1, delivery not on time = 0Dum
C8: Whether the disposal of non-investment the GVCGF is incompliance with the regulationsCompliance = 1, non-compliance = 0Dum
C9: Number of successful exit projectsNumber of successful exit projects/Total exit projectsCon
C10: Recovery ratio of principal on exit projectsPrincipal/Input number of exit projectsCon
C11: Scale of government investmentsGovernment input amountCon
C12: Magnification times of leverGovernment funds/Social fundsCon
C13: Constitution of the social capital attracted by the GVCGFThe sum of private capital/Social capitalCon
C14: Scale of social funds inflow to the field of VC under the guidance of the GVCGFThe amount of social capital entering entrepreneurial enterprisesCon
C15: Proportion of high-tech enterprises in total investment projectsHigh-tech enterprises/Total invested enterprisesCon
C16: Proportion of independent enterprises in total investment projectsIndependent enterprises/Total invested enterprisesCon
C17: Proportion of seed- and early-stage enterprises in total investment projectsSeed- and early-stage enterprises/Total invested enterprisesCon
C18: Sales growth rate of participating enterprisesCurrent sales increase/Previous sales of invested enterprisesCon
C19: Net profit growth rate of participating enterprisesNet profit growth rate = (net profit for the current year-net profit for the previous year)/net profit for the previous year × 100%Con
Note: Con denotes continuous variables; Dum denotes virtual binary variables, i.e., 0 or 1 variables; Qua denotes virtual qualitative variables.

Appendix C. The Analytic Hierarchy Process to Calculate the Weight

The analytic hierarchy process (AHP) can be divided into three steps to calculate the weight:
Step A1: Establishment of hierarchical structure.
The performance evaluation index system of government venture capital guidance fund (GVCGF) is hierarchical, and a structural model of an analytic hierarchy process is constructed (see Figure 2).
Step A2: Constructing comparison judgment matrix.
In the hierarchical structure, the importance scale of element i to element j is usually assigned according to a scale of 1–9. The meaning of the scale of 1–9 is listed in Table A3. In this case, the pairwise comparison judgment matrix is shown in Table A5.
Table A3. Scale standard.
ScaleMeaning
1Element i and element j are equally important
3Element i is slightly more important than element j
5Element i is significantly more important than element j
7Element i is strongly more important than element j
9Element i is extremely more important than element j
2,4,6,8The intermediate values of the above adjacent judgments
ReciprocalIf g i j is the importance ratio of the element to the element j, then g j i is the importance ratio of the element j to the element i. That is to say, g j i = 1 / g i j
For a certain criterion layer, a pairwise comparison judgment matrix G = ( g i j ) n × n is obtained by comparing the relative importance of n elements. Here, g i j is the importance scaling of the element i relative to the element j. Not all judgment matrices satisfy the consistency condition, so they need to be tested.
Step A3: Calculation of relative weight of elements and consistency check of judgment matrix.
The maximum eigenvalue of the judgment matrix G is obtained according to G W = λ max W , and the weight vector is the normalized eigenvalue vector W = ( ω 1 , ω 2 , , ω n ) T . When calculating the weight vector under a single criterion, a consistency check must be carried out. If the consistency ratio (CR) < 0.1, the consistency of the judgment matrix is acceptable; if CR ≥ 0.1, the judgment matrix should be modified appropriately. C R = C I / R I , and the calculation formula of the consistency index (CI) is CI = ( λ max n ) / ( n 1 ) and the average consistency random index (RI) can be found in Table A4, which can be obtained by calculating the 1–8 order positive reciprocal matrix 1000 times. The consistency check results of the case study are shown in Table A5.
Table A4. Consistency index.
Matrix Order12345678
RI000.520.891.121.261.361.41
Table A5. Judgment matrix and consistency test results.
The judgment matrix of criterion layers A–B
AB2B3B4B1Wi
B12.0000.5000.2501.000-
B21.0000.3330.2500.500-
B33.0001.0000.3335.000-
B44.0003.0001.0004.000-
Consistency check CR = 0.1070 > 0.1
The judgment matrix of criterion layers A–B *
AB2B3B4B1Wi
B12.0000.5000.2501.0000.143
B21.0000.3330.2500.5000.093
B33.0001.0000.3332.0000.239
B44.0003.0001.0004.0000.525
Consistency check CR = 0.0329 < 0.1; λmax = 4.0878
The judgment matrix of index layers B1–C
B1C11C12C13C14Wi
C11.0001.0001.0001.0000.242
C21.0001.0003.0001.0000.338
C31.0000.3331.0001.0000.192
C41.0001.0001.0001.0000.229
Consistency check CR = 0.0687 < 0.1 λmax = 4.1223
The judgment matrix of index layers B2–C
B2C21C22C23C24C25C26Wi
C51.0001.0002.0001.0001.0001.0000.172
C61.0001.0001.0002.0000.5000.5000.151
C70.5001.0001.0001.0000.3330.3330.099
C81.0000.5001.0001.0002.0001.0000.174
C91.0002.0003.0000.5001.0001.0000.196
C101.0002.0003.0001.0001.0001.0000.209
Consistency check CR = 0.0714 < 0.1; λmax = 0.4499
The judgment matrix of index layers B3–C
B3C31C32C33Wi
C111.0000.5001.0000.250
C122.0001.0002.0000.500
C131.0000.5001.0000.250
Consistency check CR = 0.0000 < 0.1; λmax = 3.0000
The judgment matrix of index layers B4–C
B4C41C42C43C44C45C46Wi
C141.0003.0003.0003.0001.0001.0000.266
C150.3331.0001.0001.0000.5000.5000.101
C160.3331.0001.0001.0000.5000.5000.101
C170.3331.0001.0001.0000.5000.5000.101
C181.0002.0002.0002.0001.0001.0000.216
C191.0002.0002.0002.0001.0001.0000.216
Consistency check CR = 0.0044 < 0.1; λmax = 6.0275
Note: A–B * indicates the corrected judgment matrix of criterion layers A–B.

References

  1. Ning, Y.; Xu, G.; Long, Z. What Drives the Venture Capital Investments in China? Chin. Manag. Stud. 2019, 13, 574–602. [Google Scholar] [CrossRef]
  2. Bernstein, S.; Giroud, X.; Townsend, R.R. The Impact of Venture Capital Monitoring. J. Financ. 2016, 71, 1591–1622. [Google Scholar] [CrossRef]
  3. Croce, A.; Martí, J.; Murtinu, S. The Impact of Venture Capital on the Productivity Growth of European Entrepreneurial Firms: ‘Screening’ or ‘Value Added’ Effect? J. Bus. Ventur. 2013, 28, 489–510. [Google Scholar] [CrossRef]
  4. Gompers, P.; Lerner, J. The Venture Capital Cycle; MIT Press: Cambridge, UK, 1999. [Google Scholar]
  5. Gompers, P.; Lerner, J. The Venture Capital Revolution. J. Econ. Perspect. 2001, 15, 145–168. [Google Scholar] [CrossRef] [Green Version]
  6. Gompers, P.; Lerner, J. Short-Term America Revisited? Boom and Bust in the Venture Capital Industry and the Impact on Innovation. Innov. Policy Econ. 2003, 3, 1–27. [Google Scholar] [CrossRef] [Green Version]
  7. Gompers, P.A.; Lerner, J. The Venture Capital Cycle, 2nd ed.; MIT Press: Cambridge, UK, 2004. [Google Scholar]
  8. Gompers, P.; Kovner, A.; Lerner, J.; Scharfstein, D. Venture Capital Investment Cycles: The Impact of Public Markets. J. Financ. Econ. 2008, 87, 1–23. [Google Scholar] [CrossRef] [Green Version]
  9. Groh, A.P.; Von Liechtenstein, H. The First Step of the Capital Flow from Institutions to Entrepreneurs: The Criteria for Sorting Venture Capital Funds. Eur. Financ. Manag. 2001, 17, 532–559. [Google Scholar] [CrossRef] [Green Version]
  10. Groh, A.P.; von Liechtenstein, H.; Lieser, K. The European Venture Capital and Private Equity Country Attractiveness Indices. J. Corp. Financ. 2010, 16, 205–224. [Google Scholar] [CrossRef]
  11. Keuschnigg, C. Venture Capital Backed Growth. J. Econ. Growth 2004, 9, 239–261. [Google Scholar] [CrossRef] [Green Version]
  12. Li, X.; Tan, H.H.; Wilson, C.; Wu, Z. When Should Venture Capitalists Exit Their Investee Companies? Int. J. Manag. Financ. 2013, 9, 351–364. [Google Scholar] [CrossRef]
  13. Nahata, R. Venture Capital Reputation and Investment Performance. J. Financ. Econ. 2008, 90, 127–151. [Google Scholar] [CrossRef]
  14. Nahata, R.; Hazarika, S.; Tandon, K. Success in Global Venture Capital Investing: Do Institutional and Cultural Differences Matter? J. Financ. Quant. Anal. 2014, 49, 1039–1070. [Google Scholar] [CrossRef] [Green Version]
  15. Xue, J.; Klein, P.G. Regional Determinants of Technology Entrepreneurship. Int. J. Entrep. Ventur. 2010, 1, 291–308. [Google Scholar] [CrossRef]
  16. Brander, J.A.; Du, Q.; Hellmann, T. The Effects of Government-Sponsored Venture Capital: International Evidence. Rev. Financ. 2015, 19, 571–618. [Google Scholar] [CrossRef]
  17. Martin, S.; Scott, J.T. The Nature of Innovation Market Failure and The Design of Public Support for Private Innovation. Res. Policy 2000, 29, 437–447. [Google Scholar] [CrossRef] [Green Version]
  18. Cumming, D. Government policy towards entrepreneurial finance: Innovation investment funds. J. Bus. Ventur. 2007, 22, 193–235. [Google Scholar] [CrossRef]
  19. Cumming, D.J.; Grilli, L.; Murtinu, S. Governmental and Independent Venture Capital Investments in Europe: A Firm-Level Performance Analysis. J. Corp. Financ. 2017, 42, 439–459. [Google Scholar] [CrossRef]
  20. Lerner, J. The Government as Venture Capitalist: The Long-Run Effects of the SBIR Program. J. Bus. 1999, 72, 285–318. [Google Scholar] [CrossRef]
  21. Munari, F.; Toschi, L. Assessing the Impact of Public Venture Capital Programmes in the United Kingdom: Do Regional Characteristics Matter? J. Bus. Ventur. 2015, 30, 205–226. [Google Scholar] [CrossRef] [Green Version]
  22. Lin, L. Engineering a Venture Capital Market: Lessons from China. Columbia J. Asian Law 2017, 30, 160–220. [Google Scholar]
  23. Wang, J.; Wang, J.; Ni, H.; He, S. How Government Venture Capital Guiding Funds Work in Financing High-Tech Start-Ups in China: A ‘Strategic Exchange’ Perspective. Strateg. Chang. 2013, 22, 417–429. [Google Scholar] [CrossRef] [Green Version]
  24. Murray, G.; Maula, M.V.J. Finnish Industry Investment Ltd.: An International Evaluation; Ministry of Trade and Industry Publication: Helsinki, Finland, 2003; pp. 53–61.
  25. Bertoni, F.; Tykvová, T. Does Governmental Venture Capital Spur Invention and Innovation? Evidence from Young European Biotech Companies. Res. Policy 2015, 44, 925–935. [Google Scholar] [CrossRef]
  26. Leleux, B.; Surlemont, B. Public Versus Private Venture Capital: Seeding or Crowding Out? APan-European Analysis. J. Bus. Ventur. 2003, 18, 81–104. [Google Scholar] [CrossRef]
  27. Cumming, D.; Macintosh, J. Crowding Out Private Equity: Canadian Evidence. J. Bus. Ventur. 2006, 21, 569–609. [Google Scholar] [CrossRef]
  28. Colombo, M.G.; Cumming, D.J.; Vismara, S. Governmental Venture Capital for Innovative Young Firms. J. Technol. Transfer. 2016, 41, 10–24. [Google Scholar] [CrossRef]
  29. Rin, M.D.; Nicodano, G.; Sembenelli, A. Public Policy and the Creation of Active Venture Capital Markets. J. Public Econ. 2006, 90, 1699–1723. [Google Scholar] [CrossRef] [Green Version]
  30. Faccio, M.; Masulis, R.W.; Mcconnell, J.J. Political Connections and Corporate Bailouts. J. Financ. 2006, 61, 2597–2635. [Google Scholar] [CrossRef]
  31. Grilli, L.; Murtinu, S. Government, Venture Capital and the Growth of European High-Tech Entrepreneurial Firms. Res. Policy 2014, 43, 1523–1543. [Google Scholar] [CrossRef]
  32. Sohn, D.W.; Kim, H.J.; Hur, W. Effect of Venture Capital and Government Support on the Performance of Venture Firms in Korea. Asian J. Technol. Innov. 2012, 20, 309–322. [Google Scholar] [CrossRef]
  33. Alperovych, Y.; Hübner, G.; Lobet, F. How Does Governmental Versus Private Venture Capital Backing Affect A Firm’s Efficiency? Evidence from Belgium. J. Bus. Ventur. 2015, 30, 508–525. [Google Scholar] [CrossRef] [Green Version]
  34. Audretsch, D.B.; Link, A.N.; Scott, J.T. Public/Private Technology Partnerships: Evaluating SBIR-supported Research. Res. Policy 2002, 31, 145–158. [Google Scholar] [CrossRef]
  35. Bertoni, F.; Tykvová, T. Which Form of Venture Capital Is Most Supportive of Innovation; ZEW Discussion Paper No.12-018; Mannheim, German. 2012. Available online: https://www.zew.de/publikationen/which-form-of-venture-capital-is-most-supportive-of-innovation/ (accessed on 8 July 2020).
  36. Buzzacchi, L.; Scellato, G.; Ughetto, E. The Investment Strategies ofPublicly Sponsored Venture Capital Funds. J. Bank. Financ. 2013, 37, 707–716. [Google Scholar] [CrossRef]
  37. Cumming, D. Public Economics Gone Wild: Lessons from Venture Capital. Int. Rev. Financ. Anal. 2014, 36, 251–260. [Google Scholar] [CrossRef]
  38. Cumming, D.; Johan, S. Pre-Seed Government Venture Capital Funds. J. Int. Entrep. 2009, 7, 26–56. [Google Scholar] [CrossRef]
  39. Islam, M.; Fremeth, A.; Marcus, A. SignalingbyEarly Stage Start-Ups: Us Government Research Grants and Venture Capital Funding. J. Bus. Ventur. 2018, 33, 35–51. [Google Scholar] [CrossRef]
  40. Lim, S.; Kim, Y. How to Design Public Venture Capital Funds: Empirical Evidence from South Korea. J. Small Bus. Manag. 2015, 53, 843–867. [Google Scholar] [CrossRef]
  41. Pierrakis, Y.; Saridakis, G. Do Publicly Backed Venture Capital Investments Promote Innovation? Differences between Privately and Publicly Backed Funds in the UK Venture Capital Market. J. Bus. Ventur. Insights 2017, 7, 55–64. [Google Scholar] [CrossRef] [Green Version]
  42. Zhang, Y.; Mayes, D.G. The Performance of Governmental Venture Capital Firms: A Life Cycle Perspective and Evidence from China. Pac. Basin Financ. J. 2018, 48, 162–185. [Google Scholar] [CrossRef]
  43. Abdullah, L.; Najib, L. Sustainable Energy Planning Decision Using the Intuitionistic Fuzzy Analytic Hierarchy Process: Choosing Energy Technology in Malaysia. Int. J. Sustain. Energy 2016, 35, 360–377. [Google Scholar] [CrossRef]
  44. Afful-Dadzie, E.; Afful-Dadzie, A. A Decision Making Model for Selecting Start-Up Businesses in a Government Venture Capital Scheme. Manag. Decis. 2016, 54, 714–734. [Google Scholar] [CrossRef]
  45. Afful-Dadzie, E.; Afful-Dadzie, A.; Oplatkova, Z.K. Assessing Commercial Viability of Technology Start-Up Businesses in a Government Venture Capital under Intuitionistic Fuzzy Environment. Int. J. Fuzzy Syst. 2017, 19, 400–413. [Google Scholar] [CrossRef]
  46. Cumming, D.; Li, D. Public Policy, Entrepreneurship, and Venture Capital in the United States. J. Corp. Financ. 2013, 23, 345–367. [Google Scholar] [CrossRef] [Green Version]
  47. Karsai, J. Government venture capital in Central and Eastern Europe. Ventur. Cap. Int. J. Entrep. Financ. 2018, 20, 73–102. [Google Scholar] [CrossRef]
  48. Murray, G.C. A Policy Responseto Regional Disparitiesin the Supply of Risk Capital to New Technology-based Firms in the European Union: The European Seed Capital and Scheme. Reg. Stud. 1998, 32, 405–419. [Google Scholar] [CrossRef]
  49. Nightingale, P.; Murray, G.; Cowling, M.; Baden-Fuller, C.; Mason, C.; Siepel, J.; Hopkins, M.; Dannreuther, C. From Funding Gaps to Thin Markets: UK Government Support for Early-Stage Venture Capital; NESTA Research Report; London, UK. 2009. Available online: https://papers.ssrn.com/sol3/papers.cfm?abstract_id=1478902 (accessed on 8 July 2020).
  50. Guerini, M.; Quas, A. Governmental Venture Capital in Europe: Screening and Certification. J. Bus. Ventur. 2016, 31, 175–195. [Google Scholar] [CrossRef]
  51. Bertoni, F.; Colombo, M.G.; Quas, A. The Role of Governmental Venture Capital in the Venture Capital Ecosystem: An Organizational Ecology Perspective. Entrep. Theory Pract. 2019, 43, 611–628. [Google Scholar] [CrossRef]
  52. Zhang, Y. Gain or Pain? New Evidence on Mixed Syndication between Governmental and Private Venture Capital Firms in China. Small Bus. Econ. 2018, 51, 995–1031. [Google Scholar] [CrossRef]
  53. Chen, Y. Establishment of the Target Evaluation System of Venture Capital Guidance Fund: Taking Hangzhou as an Example. Master’s Thesis, Zhejiang Gongshang University, Hangzhou, China, 2014. [Google Scholar]
  54. Xiang, Y. The Research on the Performance Evaluation of Government Venture Capital Guiding Fund-Take the Instance of Hangzhou and Ningbo. Master’s Thesis, Zhejiang University, Hangzhou, China, 2018. [Google Scholar]
  55. Saaty, T.L. A Scaling Method for Priorities in Hierarchical Structures. J. Math. Psychol. 1977, 15, 234–281. [Google Scholar] [CrossRef]
  56. Laarhoven, P.J.M.V.; Pedrycz, W. A fuzzy Extension of Saaty’s Priority Theory. Fuzzy Sets Syst. 1983, 11, 229–241. [Google Scholar] [CrossRef]
  57. Buckley, J.J. Fuzzy hierarchical analysis. Fuzzy Sets Syst. 1985, 17, 233–247. [Google Scholar] [CrossRef]
  58. Atanassov, K.T. Intuitionistc Fuzzy Sets. Fuzzy Sets Syst. 1986, 20, 87–96. [Google Scholar] [CrossRef]
  59. Atanassov, K.T. More on Intuitionistic Fuzzy Sets. Fuzzy Sets Syst. 1989, 33, 37–45. [Google Scholar] [CrossRef]
  60. Atanassov, K.T. Intuitionistic Fuzzy Sets Theory and Applications; Physica-Verlag: Heidelberg, Germany; New York, NY, USA, 1999. [Google Scholar]
  61. Zadeh, L.A. Fuzzy Sets. Inf. Control 1965, 8, 338–353. [Google Scholar] [CrossRef] [Green Version]
  62. Xu, Z.; Liao, H. Intuitionistic Fuzzy Analytic Hierarchy Process. IEEE Trans. Fuzzy Syst. 2014, 22, 749–761. [Google Scholar] [CrossRef]
  63. Kaur, P. Selection of Vendor Based on Intuitionistic Fuzzy Analytical Hierarchy Process. Adv. Oper. Res. 2014, 2014, 1–10. [Google Scholar] [CrossRef]
  64. Nguyen, H. An Application of Intuitionistic Fuzzy Analytic Hierarchy Process in Ship System Risk Estimation. J. KONES Powertrain Transp. 2016, 23, 365–372. [Google Scholar]
  65. Wang, J.; Sun, Y. The Intuitionistic Fuzzy Sets in Evaluation of Risks in Projects of Energy Management Contrac. Syst. Eng. Procedia 2012, 3, 30–35. [Google Scholar] [CrossRef]
  66. Sadiq, R.; Tesfamariam, S. Environmental Decision-Making under Uncertainty Using Intuitionistic Fuzzy Analytic Hierarchy Process (IF-AHP). Stoch. Environ. Res. Risk Assess. 2009, 23, 75–91. [Google Scholar] [CrossRef]
  67. Wang, Y.; Xu, Z. Evaluation of the Human Settlement in Lhasa with Intuitionistic Fuzzy Analytic Hierarchy Process. Int. J. Fuzzy Syst. 2018, 20, 29–44. [Google Scholar] [CrossRef]
  68. Jaafar, S.; Abdullah, L.; Taib, I. Intuitionistic Fuzzy Analytic Hierarchy Process Approach in Ranking of Human Capital Indicators. J. Appl. Sci. 2013, 13, 423–429. [Google Scholar]
  69. Weng, Y.J.; Deng, Q.Z.; Du, L. Systematic Analysis of the Factors Influencing the Size of Local Government Administrative Establishment from the Perspective of Complex System: Based on Dematel-ISM Integration Method. Math. Pract. Theory 2015, 45, 110–119. [Google Scholar]
  70. Xu, Z.; Cai, X. Intuitionistic Fuzzy Information Aggregation. In Intuitionistic Fuzzy Information Aggregation; Springer: Berlin, Germany, 2012. [Google Scholar]
  71. Szmidt, E.; Kacprzyk, J. Distances between Intuitionistic Fuzzy Sets. Fuzzy Sets Syst. 2000, 114, 505–518. [Google Scholar] [CrossRef]
  72. Xu, Z. Intuitionistic Fuzzy Aggregation Operators. IEEE Trans. Fuzzy Syst. 2007, 15, 1179–1187. [Google Scholar]
  73. Gao, H.Y.; Wang, C.; Ha, M.H. Intuitive Fuzzy Analytic Hierarchy Process. J. Hebei Univ. Eng. (Nat. Sci. Ed.) 2011, 28, 101–105. [Google Scholar]
  74. Cerioli, A.; Zani, S.A. Fuzzy Approach on Measurement of Poverty. In Income and Wealth Distribution and Inequality and Poverty: Studies in Contemporary Economics; Dagum, C., Zenga, M., Eds.; Springer: Berlin, Germany, 1990. [Google Scholar]
  75. Aloini, D.; Dulmin, R.; Mininno, V. A Peer IF-Topsis Based Decision Support System for Packaging Machine Selection. Expert Syst. Appl. 2014, 41, 2157–2165. [Google Scholar] [CrossRef]
  76. Torra, V. Hesitant Fuzzy Sets. Int. J. Intell. Syst. 2010, 25, 525–539. [Google Scholar] [CrossRef]
  77. Liao, H.; Xu, Z. A Vikor-Based Method for Hesitant Fuzzy Multi-Criteria Decision Making. Fuzzy Optim. Decis. Mak. 2013, 12, 373–392. [Google Scholar] [CrossRef]
  78. Rodriguez, R.M.; Martinez, L.; Herrera, F. Hesitant Fuzzy Linguistic Term Sets for Decision Making. IEEE Trans. Fuzzy Syst. 2012, 20, 109–119. [Google Scholar] [CrossRef]
  79. Liao, C.H.; Xu, Z.S. Hesitant Fuzzy Decision Making Methodologies and Applications; Springer: Berlin/Heidelberg, Germany, 2017. [Google Scholar]
  80. Campbell, T.; Ulrich, B.; Alexandre, B. Evaluation of EIF Funding of Venture Capital Fund-EIB/ETF Mandate; European Investment Bank Evaluation Report; Luxembourg. 2007. Available online: https://www.eib.org/attachments/ev/ev_eif_funding_of_venture_capital_funds_en.pdf (accessed on 8 July 2020).
  81. Bartzokas, A.; Mani, S. (Eds.) Financial Systems, Corporate Investment in Innovation, and Venture Capital; Edward Elgar Publishing: Cheltenham, UK, 2004. [Google Scholar]
Figure 1. The procedure of performance evaluation of the GVCGF.
Sustainability 12 06908 g001
Figure 2. Performance evaluation index system of the GVCGF.
Sustainability 12 06908 g002
Table 1. Linguistic scale for the importance of a criterion.
Linguistic TermsIntuitionistic Fuzzy Number
Extremely important(0.90,0.10,0.00)
Very important(0.80,0.15,0.05)
Medium importance(0.70,0.20,0.10)
Slightly important(0.60,0.25,0.15)
Equally important(0.50,0.50,0.00)
Table 2. Classification standard of performance of the GVCGF.
LevelLevel ILevel IILevel IIILevel IV
Interval[0, 0.25)[0.25, 0.50)[0.50, 0.75)[0.75, 1.00]
Characteristics of PerformanceVery lowLowRelatively HighVery high
Table 3. The weight of the indicators.
Weight of Criterion Layer BWeight of Index Layer CComprehensive Weights
(0.117, 0.828)(0.200, 0.743)(0.023, 0.956)
(0.245, 0.709)(0.029, 0.950)
(0.256, 0.678)(0.030, 0.944)
(0.189, 0.746)(0.022, 0.956)
(0.153, 0.795)(0.095, 0.833)(0.015, 0.966)
(0.158, 0.762)(0.024, 0.951)
(0.087, 0.845)(0.013, 0.968)
(0.126, 0.794)(0.019, 0.958)
(0.154, 0.764)(0.023, 0.952)
(0.175, 0.744)(0.027, 0.947)
(0.289, 0.639)(0.226, 0.675)(0.065, 0.883)
(0.371, 0.520)(0.107, 0.827)
(0.257, 0.633)(0.074, 0.868)
(0.319, 0.599)(0.192, 0.731)(0.061, 0.892)
(0.110, 0.849)(0.035, 0.940)
(0.110, 0.848)(0.035, 0.939)
(0.111, 0.845)(0.035, 0.938)
(0.157, 0.772)(0.050, 0.909)
(0.163, 0.767)(0.052, 0.906)
Table 4. Computation results of comprehensive performance.
Method: Intuitionistic Fuzzy Analytic Hierarchy ProcessMethod: Analytic Hierarchy Process
BCZ1W1Z2W2Z2 × W2W3Z1 × W3Z1W1Z2W2Z2 × W2W3Z1 × W3
B1C10.7800.2290.7070.1530.1080.0330.0260.7800.2420.7000.1430.1000.0230.018
C20.7200.2620.0380.0270.7200.3380.0270.019
C30.8000.2850.0420.0340.8000.1920.0290.024
C40.5000.2240.0330.0170.5000.2290.0230.012
B2C50.7800.1340.6390.1830.1170.0260.0200.7800.1720.6340.0930.0590.0160.013
C60.7800.1890.0370.0290.7800.1510.0230.018
C70.7400.1240.0240.0180.7400.0990.0150.011
C80.8000.1640.0320.0260.8000.1740.0200.016
C90.3330.1870.0360.0120.3330.1960.0230.008
C100.5000.2030.0390.0200.5000.2090.0250.012
B3C110.3800.2790.5480.3160.1730.0860.0330.3800.250.5620.2390.1340.0480.018
C120.6540.4090.1250.0820.6540.50.0700.046
C130.5600.3120.0960.0540.5600.250.0540.030
B4C140.5710.2230.5670.3480.1970.0790.0450.5710.2660.5820.5250.3060.0460.026
C150.5060.1290.0450.0230.5060.1010.0260.013
C160.4490.130.0460.0210.4490.1010.0270.012
C170.4520.1320.0460.0210.4520.1010.0270.012
C180.6670.1900.0680.0450.6670.2160.0400.026
C190.6670.1950.0690.0460.6670.2160.0400.027
A 0.596 0.596 0.599 0.599
Note: Z1 = Membership degree of index layer; Z2 = Membership degree of criterion layer; W1 = Weight of index layer; W2 = Weight of criterion layer; W3 = Comprehensive weight.

