An Assessment of Tourism Climate Comfort in the China–Pakistan Economic Corridor
by
 , and
, and
Di Zeng
1,2, 
Jinkui Wu
1,*,
Yaqiong Mu
1,2,
Hongyuan Li
1,2,
Mingshan Deng
2,3,
Yanqiang Wei
4 and
Weibing Sun
1,2 1
Key Laboratory of Eco-hydrology of Inland River Basin, Northwest Institute of Eco-Environment and Resources, Chinese Academy of Sciences, Lanzhou 730000, China
2
College of Resources and Environment, University of Chinese Academy of Sciences, Beijing100049, China
3
Key Laboratory of Land Surface Process and Climate Change in Cold and Arid Regions, Northwest Institute of Eco-Environment and Resources, Chinese Academy of Sciences, Lanzhou 730000, China
4
Key Laboratory of Remote Sensing of Gansu Province, Northwest Institute of Eco-Environment and Resources, Chinese Academy of Sciences, Lanzhou 730000, China
*
Author to whom correspondence should be addressed.
Sustainability 2020, 12(17), 6981; https://0-doi-org.brum.beds.ac.uk/10.3390/su12176981
Submission received: 3 August 2020
/
Revised: 18 August 2020
/
Accepted: 26 August 2020
/
Published: 27 August 2020
Abstract
:Pleasant climates can be divided into two types: the comfortable summer climate and the comfortable winter climate, but existing studies rarely pay attention to the distribution characteristics and differences between the two types of climate. This study investigates the spatial distribution of comfortable summer and winter climates in the China–Pakistan Economic Corridor (CPEC) and their differences based on the European Centre for Medium-Range Weather Forecasts Re-Analysis-Interim (ERA-interim) reanalysis data from 1979 to 2018. The Universal Thermal Climate Index was used to analyze climatic suitability. The findings are as follows. First, the comfortable summer climate regions of the CPEC were mainly distributed in Khyber Pakhtunkhwa in Pakistan and some regions of Xinjiang in China and also sporadically distributed in high altitude mountains, such as the western plateau area. The comfortable winter climate regions were mainly distributed in vast areas except for Karakoram and nearby areas. Second, there are a few regions with dual attributes of comfortable summer and winter climates in CPEC. Third, according to the calculation and comparison of the regional area of different climate comfort levels in summer and winter, it is found that the comfortable summer climate is scarcer in CPEC and is a monopoly resource. The comfortable winter climate is widely distributed, belonging to the ubiquitous resources. These findings can be helpful for the tourism development of local climate resources.
1. Introduction
Tourism, which is one of the largest industries in the world, has the most powerful developmental momentum. The development of tourism is deeply affected by climate [1], leading to significant challenges and potential paradoxes in governance and long-term development [2]. Adaptation to climate is the premise of promoting sustainable tourism development. Nationwide tourism climate information will be helpful for the optimization of the tourism industry and the development of tourism destinations [3]. Thermal indices are a basic index to measure whether the thermal condition of the region is suitable for tourism activities.
Since the 20th century, more than 100 thermal indices have been developed to define thermal comfort in the world [4,5]. Among these indices, several indices have been calculated and proposed to assess the suitability of the climate for tourism activities [1,2,6,7,8,9,10,11]. The Climate Index for Tourism (CIT) proposed by Mieczkowski is the most widely known and applied index to evaluate the tourism thermal environment [12]. However, the CIT does not consider human thermo-physiology, human comfort, and discomfort, which are important factors for tourists and their satisfaction during a holiday [13]. Besides this, there is a critical limitation of the CIT in that it is as an ‘expert-based’ index. The meaning attached to the index was secondarily derived from the biometeorology literature and Mieczkowski’s subjective opinion [9]. Therefore, several methods were designed and proposed for calculating thermal comfort based on human biometeorology. More specifically, one such index is the Universal Thermal Climate Index (UTCI), applied in many countries, regions or localities to assess human thermal comfort. Some studies found that UTCI was sensitive to slight changes in climatic variables and was suitable for thermal assessments in all climates and seasons, and on any scale [14,15]. Additionally, UTCI depicted the temporal variability of thermal conditions better than other indices [16].
Pleasant climate refers to climate conditions that the human body feels comfortable in without the help of hot and cold prevention facilities. It can be divided into two types: the comfortable summer climate and the comfortable winter climate. Many studies have used various thermal indices to evaluate thermal conditions for tourism. Fang and Yin [17] through seasonal distribution maps of CIT scores found that the climates of most regions in China are comfortable for tourists during spring and autumn, while the climate conditions differ greatly in summer and winter, with “excellent”, “good”, “acceptable” and “unfavorable” existing almost by a latitudinal gradation. Morgan et al. [6] made the link between user-generated ratings for various climatic conditions and published climate data, developed the Beach Comfort Index (BCI), and evaluated the most major Euro-Mediterranean/Black Sea and a range of other beach tourism areas on a month-by-month basis. Similar thermal comfort assessments for tourism have been studied in Hungary [18], Algeria [19], Croatia [20], Iran [21], etc. Until now, according to the research on the pleasant climate of the China–Pakistan Economic Corridor (CPEC), there are only some studies on indoor thermal comfort and urban outdoor heat exposure [22,23]. In a previous study [24], we studied the overall distribution characteristics of UTCI in this region. However, the research is relatively rough, and there is no special research on tourism. In recent years, the number of tourists in the China–Pakistan Economic Corridor (CPEC) has increased significantly. For example, 1.6 million and 6.6 million tourists were received across Pakistan in 2014 and in 2018, respectively, with a total increase of 317% over five years. Therefore, it is necessary to meet the needs of the rapid development of tourism in the CPEC and carry out large regional-scale tourism climate research.
To summarize, the CIT does not consider human thermal physiology and human comfort. Moreover, it is subjective to a certain extent. Thus, even if it is the mainstream method of tourism climate comfort evaluation, the UTCI, with its stronger applicability, is adopted in this study to meet the needs of the large research areas, complex climatic conditions, and multiple research seasons. In addition, the research objects of the relevant literature of the study area are mostly focused on a very small scale, mainly for indoor thermal comfort and urban outdoor heat exposure evaluation, with less research on a regional scale. There are also a few pieces of literature that compare the distribution characteristics and differences between the comfortable climate types in summer and winter. A comparison of these two types of climates is helpful to understand the distribution of climate resources in the study area and it is of great significance to guide the development of tourism-related industries in reality.
Therefore, this study is based on the ERA-interim reanalysis data from 1979 to 2018 for 40 years, combined with the UTCI model to investigate the spatial distribution of comfortable summer and winter climates in CPEC and their differences.
2. Materials and Methods
2.1. Study Area
The China–Pakistan Economic Corridor (CPEC) covers an area of 1.05 million km2, with mountainous areas accounting for about half of the territory (Figure 1). It is composed of China’s Kashgar region and Pakistan, with more than 212 million inhabitants. The Kashgar region in China has a warm temperate continental climate, with hot summers but short hot summer periods, no severe winters, but long low-temperature periods. Pakistan has a tropical climate with generally high temperatures and sparse precipitation. Areas with annual precipitation less than 250 mm account for more than three quarters of the country’s total area. The rest has a subtropical climate. The southern part is hot and humid, affected by monsoons, and the rainy season is longer; the northern part is dry and cold, and some places have snow all year round. The average annual temperature is 27 °C. Because of the wide range of climatic conditions in CPEC [25], rich tourism resources have been created. In addition to the rich natural landscape such as the mountains, plateau lakes, deserts, oceans, etc., CPEC also has a rich cultural landscape. This cultural landscape includes Islamabad, Taxila, Peshawar, and other famous religious tourist attractions, including ancient city sites representing the brilliant Indus River civilization such as Mohenjo-Daro, an international metropolis with seaside resorts such as Karachi, and the South Region of Xinjiang, which is rich with ethnic customs. These tourism resources are attracting more and more attention from global tourists. Tourism in CPEC has extensive and favorable development prospects.
2.2. Data
There are problems with insufficient numbers and the uneven distribution of meteorological stations. Grid data can solve these problems to a certain extent. Therefore, we plan to use ERA-interim reanalysis data as the basic data of the study. In our previous study, we confirmed the applicability of this data in this study area. The ERA-interim dataset [26] is the third-generation reanalysis dataset of the European Center for Medium-Range Weather Forecasts for the period since 1979. ERA-interim is considered an optimized version of ERA-15 and ERA-40. The moisture analysis, satellite data error correction, and other technologies were improved, and the latest four-dimensional variation data assimilation (4D-Var) was used, which has greatly improved the quality of the dataset.
We obtained 0.25° gridded daily ERA-interim reanalysis data during the period 1979–2018, including = 2-m air temperature(Ta, °C), 2-m dew-point temperature(Td, °C), 10-m V-component of wind (Vv, m/s), 10-m U-component of wind(Vu, m/s), and total cloud cover(N) at 11:00 and 17:00 Pakistan Standard Time (PKT) per day.
2.3. Methods
The UTCI provides a one-dimensional quantity reflecting the human physiological response to the multi-dimensional definition of actual thermal comfort [27,28]. It adopts a multi-node model of human thermoregulation and an adaptive clothing model to simulate human reaction [27]. UTCI is defined as the air temperature (Ta) of the reference condition, which causes the same model response as the actual condition [16,28]. These reference conditions include a person walking with a speed of 4 km/h (equivalent to a metabolic rate of 2.3 MET), a wind speed measured at a 10-m height following the meteorological convention of 0.5 m/s, a mean radiant temperature equaling air temperature, a relative humidity of 50% for Ta ≤ 29 °C, and a vapor pressure of 20 hPa for Ta > 29 °C [28]. The stress categories scale (Table 1) was developed on the basis of the simulated physiological and psychological response combined with the thermal physiological response of the human body [28].
It is computationally intensive and time-consuming to calculate UTCI by repeatedly running a temperature regulation model. For simple and fast computation, the UTCI calculation method based on the 6th order of UTCI approximated by a polynomial in 2-m air temperature (Ta), 10-m wind speed (V), vapor pressure (e), and mean radiant temperature (Tmrt) was employed [28].
The wind speed can be computed from the 10-m V-component of wind and 10-m U-component of wind:
The vapor pressure is calculated from the dew point temperature [29]:
The formulation of the mean radiation temperature is as follows [30,31,32,33]:
where Rprim is the solar radiation absorbed by a nude man and can be estimated by the SolAlt model, which has been proven reasonable by Douglas [34].
where Tg (°C) is surface temperature.
These calculation procedures are calculated by Bioklima2.6 software [35]. The UTCI was calculated at 11:00 and 17:00 PKT during the daytime. The daily UTCI was taken as the maximum of two values in the daytime. The estimation period was from 1 January 1979 to 31 December 2018.
The definition of comfortable summer climates and comfortable winter climates is the basis of this paper. The UTCI index is taken as the basic reference condition of climate types. According to the meteorological standard, the seasons are from June to August in summer and from December to February in winter. Based on the classification standard of thermal stress and thermal perception (see Table 1), a climate that is “cool” or “comfort” or “warm” is defined as pleasant climate, that is, 0 ≤ UTCI in summer ≤ 32 is a comfortable summer climate, and 0 ≤ UTCI in winter ≤ 32 is a comfortable winter climate.
3. Results
3.1. General Distribution Characteristics of UTCI in Summer
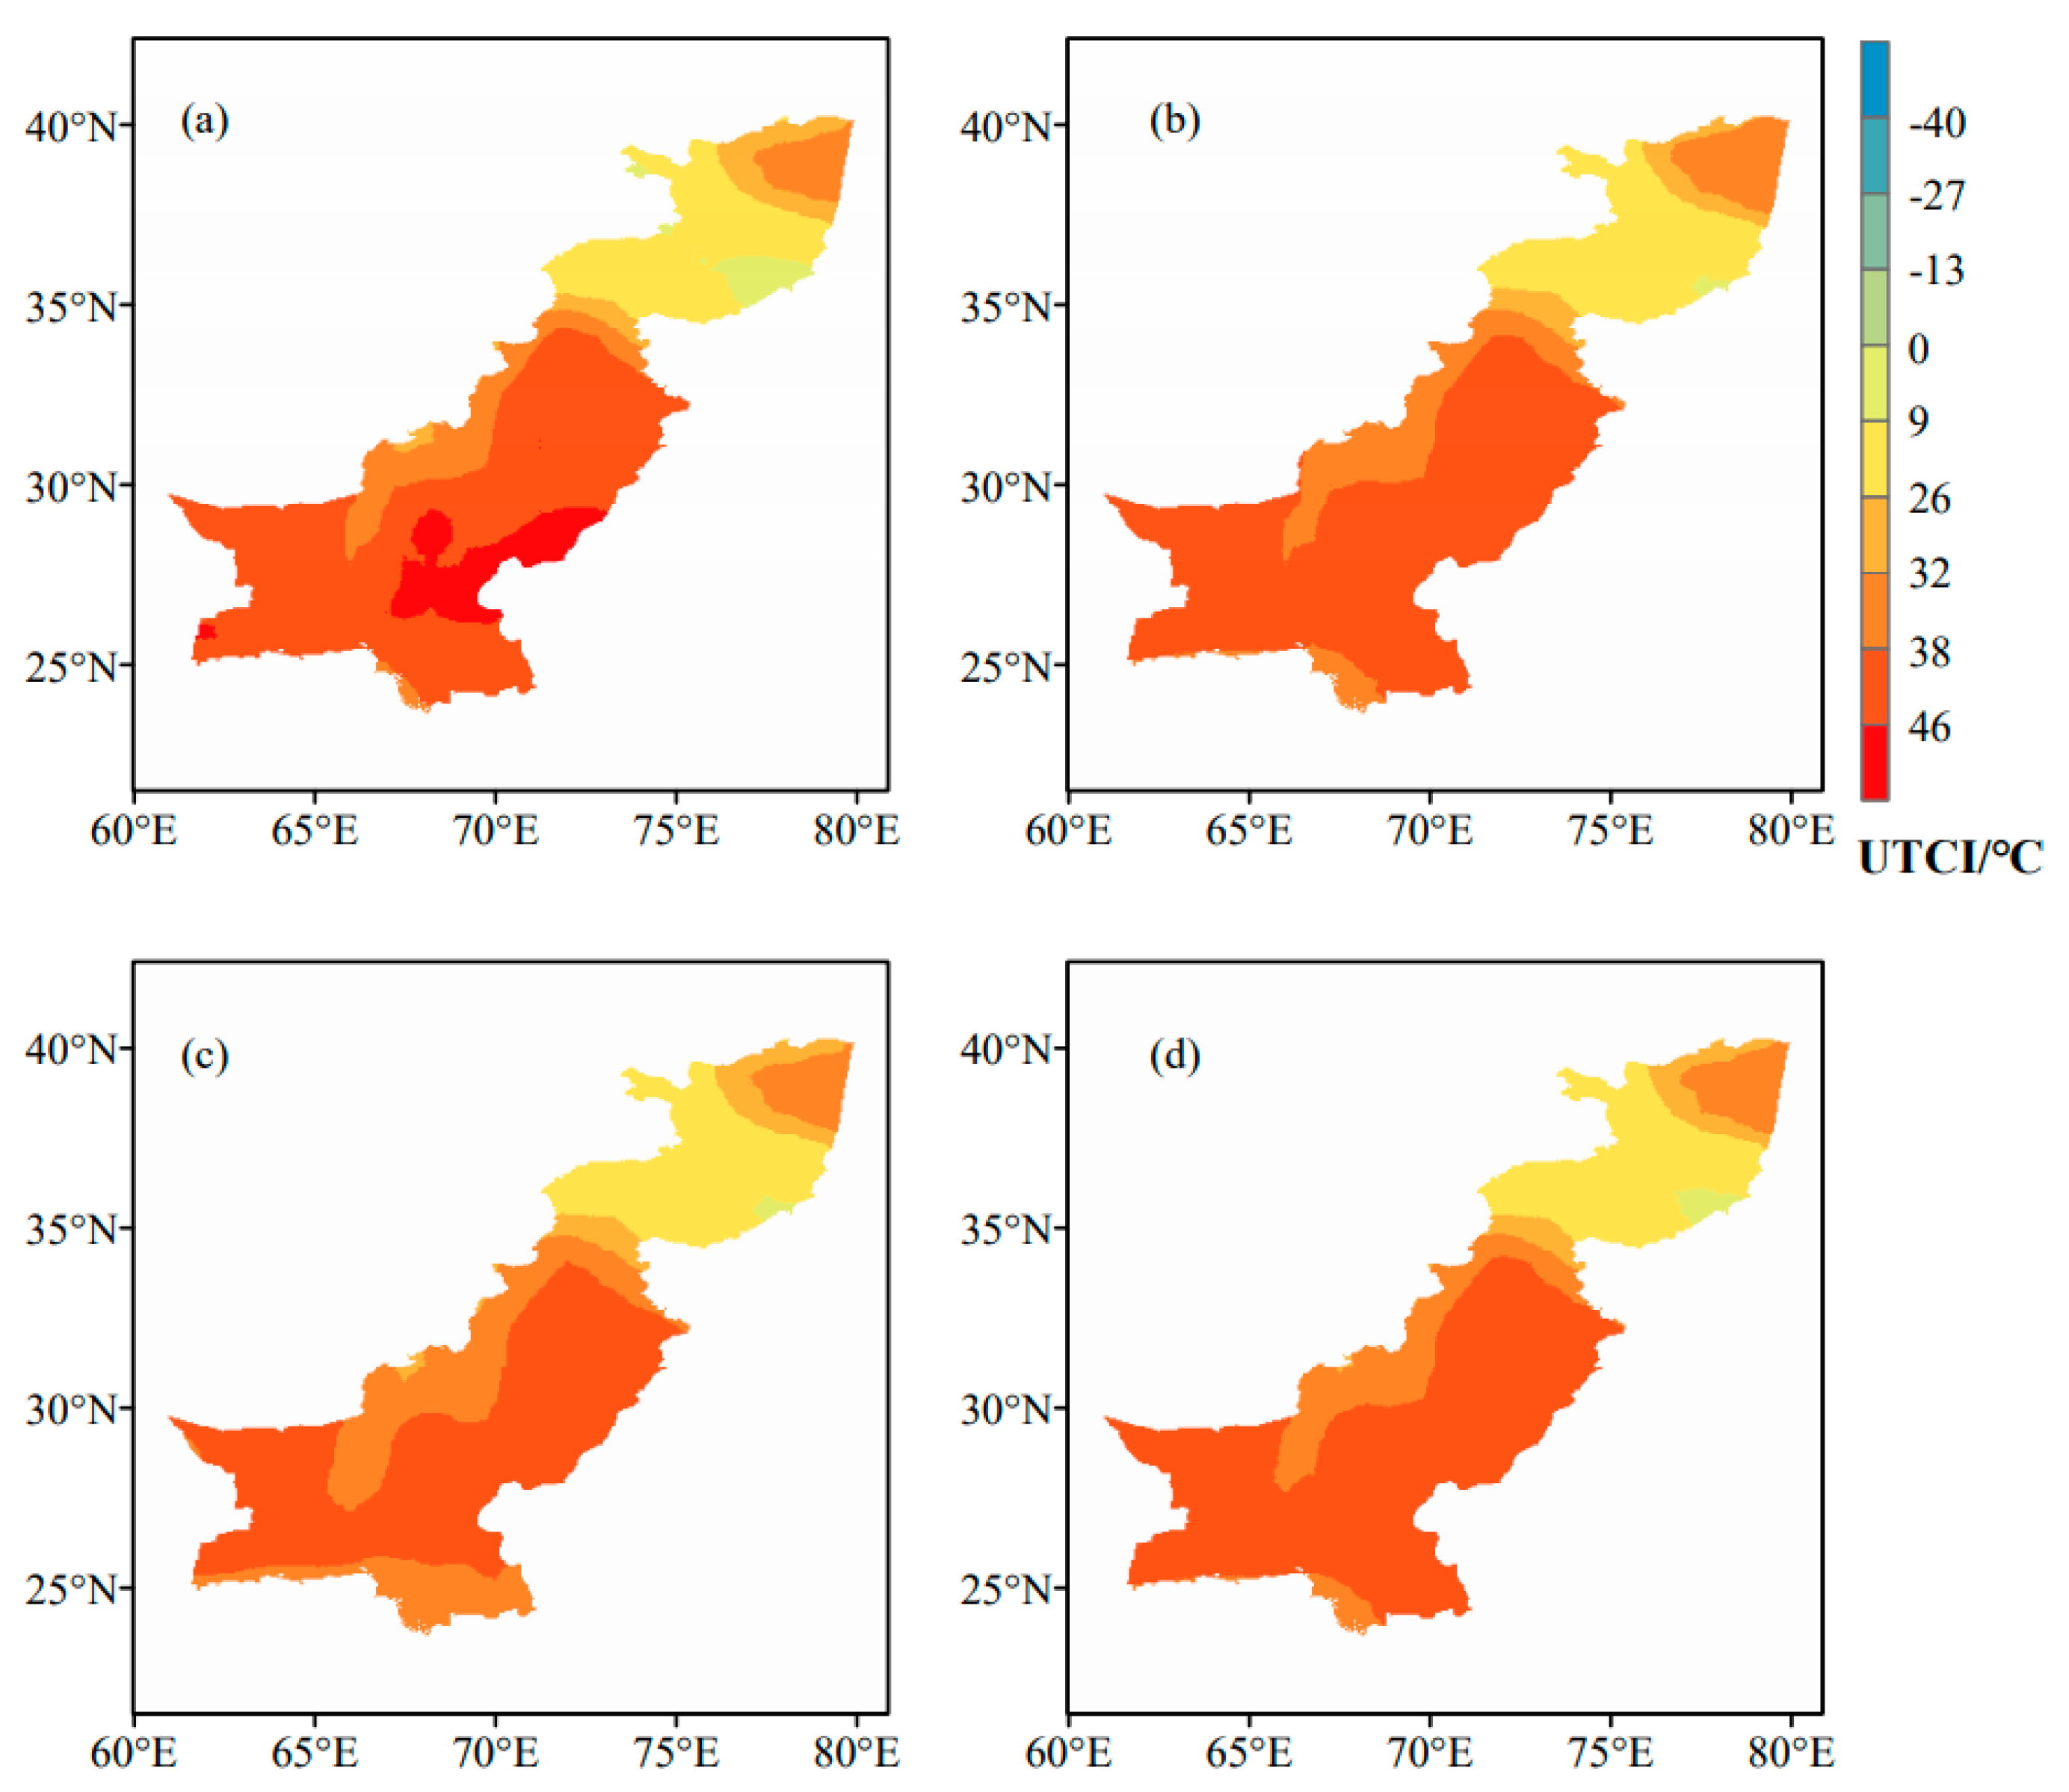
Figure 2 shows the spatial distribution of the UTCI in summer (June, July, August, and summer mean) of the CPEC. The results show that the distribution of a comfortable summer climate in CPEC is similar. The UTCI in the summer of the CPEC presents the regional distribution characteristics of two basic different regions in the north and the south. The UTCI in the north is generally lower than that in the south. In summer, the UTCI is mainly affected by latitude and terrain, and the areas with lower general thermal climate index have the characteristics of middle–high latitude or high altitude.
Specifically, the comfortable summer climate of the CPEC is concentrated in the surrounding areas of Karakoram, mainly including Khyber Pakhtunkhwa in Pakistan and some regions of Xinjiang in China. In addition, the comfortable summer climate is also sporadically distributed in high altitude mountains, such as the western plateau area. Among them, a slightly lower elevation area near Karakoram is the most comfortable area in summer.
Relatively speaking, the spatial distribution range of less comfortable grades in summer is relatively large, mainly concentrated in northern Kashgar and the Indus River Plain. The average UTCI of these areas is above 32 degrees, involving Xinjiang, Sindh, Punjab, and Baluchistan. In addition, in June, the thermal stress level in southern Punjab, northern Sindh, and northeast Baluchistan is “extreme heat stress”, and the thermal feeling is torrid. Generally speaking, the areas without a comfortable climate are widely distributed in summer, including Islamabad, Karachi, Lahore, and other economically developed and densely populated areas. There is a strong demand for tourism in the summer.
3.2. General Distribution Characteristics of UTCI in Winter
Figure 3 shows the spatial distribution of the UTCI in winter (December, January, February, and winter mean) in the CPEC. Based on the different months, the spatial distribution range of comfortable winter climate is the smallest in January (Figure 3b), and the area of the uncomfortable climate area is the largest, especially in Xinjiang. Compared with other months, the area of the uncomfortable climate in this region is obviously expanded. The climate distribution in December (Figure 3a) is basically consistent with that in winter (Figure 3d). In February (Figure 3c), the area of the comfortable winter climate was the largest, and “moderate heat stress” appeared in the southern coastal area.
As shown in Figure 3, the spatial distribution of UTCI during winter is obviously affected by altitude and latitude. The UTCI has a low value near the Karakorum. Xinjiang, in the north of the Karakorum Mountains, is affected by latitude. Compared with the vast areas in the south, the UTCI is also lower. In some parts of the western plateau, the UTCI is significantly lower than the surrounding areas.
The comfortable winter climate is mainly distributed in the vast areas except for Karakoram and nearby areas. The slight cold stress is mainly distributed in Xinjiang. The vast areas in the South including Sindh, Punjab, Baluchistan, and Khyber Pakhtunkhwa experience no thermal stress.
Generally speaking, the winter climate comfort degree of most areas in the CPEC is ideal. The comfort degree in the south of 35 °N is at the most comfortable level. The distribution areas that do not belong to the pleasant climate are mainly located near the Karakoram, where the altitude is relatively high, the population is relatively small and the economy is underdeveloped. Objectively speaking, there is little demand for cold shelter in the CPEC.
3.3. Differences in the Distribution of Summer Comfortable Climate and Winter Comfortable Climate
3.3.1. Distribution Characteristic of Different Types of Climate
Based on the UTCI of summer and winter, when the two UTCIs in summer and winter are both at the thermal feeling levels of “cool”, “comfort” and “warm”, i.e., 0–32, this is defined as a corresponding pleasant climate grid point. According to the climate attributes of comfortable summer and winter climates, the grids in CPEC are classified into four types: comfortable summer climate, comfortable winter climate, comfortable summer and winter climates, and unsuitable climate.
Combined with the number of different types of grid points (Table 2) and distribution characteristics (Figure 4), the grid points that belong to comfortable summer and winter climates in the CPEC are relatively small, mainly distributed in southern Karakoram and Xinjiang, and sporadically distributed in the western plateau. The number of comfortable winter climate grid points accounted for 73.39%, mainly distributed in the south at 35 °N. Relatively speaking, there are only 320 grid points for comfortable summer climate, reaching 19.99% of the total grid points, which are concentrated in the high altitude areas near Karakoram, Xinjiang and other high-latitude areas. The grid points of unsuitable climate types accounted for the smallest proportion of the four types, as low as 1.94%, and were mainly distributed in Xinjiang.
From the above analysis, it can be seen that the comfortable winter climate is widely distributed in the CPEC. However, the distribution of the comfortable summer climate is relatively concentrated, and the demand for summer vacations is more considerable than that for winter vacations. Therefore, the comfortable summer climate is a potential tourism resource. However, due to the spatial heterogeneity of the climate, there are few places with comfortable summer climates and comfortable winter climates. The two types of climates show obvious regional separation characteristics.
3.3.2. Area Comparison of Different Thermal Stress Levels in Summer and Winter
The distribution of thermal stress categories during summer and winter from 1979 to 2018 are shown in Table 3. According to the statistics of the monthly and monthly average area in the quarter, the area of comfortable summer climate accounts for 24.67% of the CPEC, and the comfort level is around 18.24%. At the same time, the regional area of uncomfortable areas accounted for 75.33%, while 56.78% were in the “very strong heat stress” category with a thermal perception of it feeling hot.
The regional comfortable winter climate area accounted for 78.08%, of which about 87.68% reached the comfort level. The discomfort area only accounts for a small part, 21.92%, and the ratio of the “very strong cold stress” area only 0.5%.
To summarize, it can be seen that the area with a comfortable summer climate is relatively small in CPEC. In summer, only a few regions such as Karakoram can meet the demand as a summer resort. Therefore, the comfortable summer climate is a scarce resource in CPEC and has monopoly characteristics. Relatively speaking, the winter climate has a wide area of distribution and is a relatively ubiquitous resource.
4. Discussion
This paper provides research results on the differences between two types of pleasant climate characteristics and points out that the superiority of the development of climate resources not only lies in the comfort level and length of the comfort period but also is related to the types of pleasant climate, which have important practical significance for the site selection and development of tourist attractions and second residences. In recent years, there has been a rise in summer resorts and winter resorts in pleasant climates, as these are tourism resources that are sought after. However, the misjudgment of the superiority of climate resources can easily lead to blind investment. A comprehensive understanding of the distribution differences between different types of pleasant climates can guide people to invest in tourism products related to summer or winter resorts. At present, there is no study on tourism climate comfort in the CPEC, so our method is the first to evaluate the climate suitability in the region.
Mountain resorts in the northern regions, which are winter sports resorts in the cold season and health tourism resorts during the hot season, are dominated by cold weather conditions. From this point of view, there are similar factors between the climate of the northern mountains and the northeast region of Romania [36]. They are numerous because they are located in the same climate (temperate zone).
On a seasonal scale, the Indus River Plain has very strong heat stress in summer. Although the altitude of the western plateau is higher and the thermal stress level has decreased, it still belongs to the “strong thermal stress” category. Therefore, to the south of Karakoram, the whole region experiences a strong thermal stress level in summer. The region comprises Karachi, Hyderabad, Multan, and other big cities, so there is a very strong summer demand for the CPEC in summer. In this region, there are also summer resorts represented by Karakoram and its nearby high-altitude area, which makes the region have both touristic climate resources and tourism demand. The existence of both resources and demand proves that regional summer tourism has a broad development prospect in summer. Compared with summer tourism, the demand for winter tourism is much smaller. In addition to Karakoram and Kashgar, the vast southern part of the CPEC is in the range of “no thermal stress” in winter and has the most comfortable climate conditions. The uncomfortable areas in winter are mainly distributed in areas with lower populations. Therefore, in the CPEC, there is little demand for winter tourism. However, in cold countries, such as Russia, the winter is long and cold. There is no winter resort in its territory. Karachi, as an international metropolis, has a very comfortable winter climate, which can provide cold-sheltering conditions for Russia and other countries. Therefore, in winter, although the market demand in the region is limited, some cities can be developed as typical international tourism cities.
For tourism management departments, it is necessary to encourage the location and design of tourism-related facilities and make rational use of tourism resources to adapt to the seasonal changes in tourism. For example, in the areas with a comfortable winter climate, various glacier tourism projects such as scenic spots, ski resorts, international ice, and snow festivals can be held. In the areas with a comfortable summer climate such as coastal areas, coastal sightseeing, sailing, diving, and other special tourism projects can be developed. At the same time, it is worth noting that, in addition to adapting to the seasonal changes in tourism, it is also necessary to strengthen the seasonal management of tourism. Departments should develop specific strategies to attract tourists throughout the year, and ensure year-round tourism opportunities for the region to promote sustainable tourism development. In this study, there are some deficiencies. The basic data of this study are based on the highest value of UTCI during the day. As we all know, the temperature at 14:00 p.m. local time is the daily maximum temperature. UTCI is affected by temperature to a certain extent, so the UTCI value at 14:00 is more likely to be the daily maximum value. However, due to the time limitation of reanalysis data, only the UTCI values of 11:00 and 17:00 PKT may affect the distribution characteristics of the whole region. In addition, the index UTCI has regional characteristics. The UTCI mainly considers the dressing habits of North America and Europe, and may not be consistent with Asians on this point, which may have a certain impact on the calculation results. At present, some cities such as Xi’an have adjusted the classification standard of thermal stress levels according to the local climate conditions [37]. However, because Xi’an can only represent the temperate monsoon climate, and the climate types in the CPEC are diverse, the standard of Xi’an is not of referential significance. Moreover, there are also some regional studies in Asia that also follow the original classification criteria [15,29,38,39], which proves that the original criteria have a certain referential significance on a regional scale. Thus, this paper still uses the original classification criteria. In future works, the adjustment of the regional UTCI classification standard for Asia must be addressed. Overall, in this paper, the mean radiation temperature was calculated using the radiation flux obtained from the simulation of cloud amount and temperature. There will be some errors in the results; however, it was found that the uncertainty of four meteorological inputs in UTCI do not have a significant impact on the annual and seasonal thermal comfort assessment results [40].
When applying the research results of this paper to the tourism development of local climate resources, in reality, we should also consider the impact of tourism resource abundance and traffic accessibility on the tourism development potential of climate resources in different regions.
5. Conclusions
Based on the daily ERA-interim reanalysis data from 1979 to 2018, combined with the UTCI, the climate comfort index of summer and winter in CPEC was calculated, and the distribution characteristics and differences between pleasant summer and winter climates were deeply studied. The results show that:
- (1)
- The comfortable summer climate is affected by middle–high latitudes or high altitudes. The comfortable summer climate regions of the CPEC were mainly distributed in Khyber Pakhtunkhwa in Pakistan and some regions of Xinjiang in China and also sporadically distributed in high-altitude mountains, such as the western plateau area. The comfortable winter climate regions were mainly distributed in vast areas, except for Karakoram and nearby areas. Compared with other countries and regions, altitude has the most significant impact on the distribution of a pleasant climate.
- (2)
- The climate has spatial heterogeneity, and the two types of pleasant climates show obvious regional separation characteristics. There are few regions with dual attributes of comfortable summer and winter climates in CPEC.
- (3)
- According to the calculation and comparison of the regional area of different climate comfort levels in summer and winter, it is found that the comfortable summer climate is scarcer in CPEC and is a monopoly resource, whereas the comfortable winter climate is widely distributed, meaning that it is a ubiquitous resource.
Author Contributions
Conceptualization: D.Z. methodology: D.Z. software: D.Z., Y.W. data curation: D.Z., H.L., M.D. writing—original draft preparation: D.Z. writing—review and editing: D.Z., J.W., Y.M., W.S. All authors have read and agreed to the published version of the manuscript.
Funding
The research was funded by the Strategic Priority Research Program of the Chinese Academy of Sciences (Grant No. XDA23060702 and XDA19070501), China National Natural Science Foundation (Grant No. 41771084, 41730751).
Conflicts of Interest
In a unanimous agreement, all authors declare no conflict of interest in the present study.
References
- Gómez Martín, M.B. Weather, climate and tourism a geographical perspective. Ann. Tour. Res. 2015, 32, 571–591. [Google Scholar] [CrossRef]
- United Nations World Tourism Organization (UNWTO); United Nations Environmental Programme (UNEP); World Meteorological Organization (WMO). Climate Change and Tourism: Responding to Global Challenges; UNWTO: Madrid, Spain; UNEP: Paris, France; WMO: Geneva, Switzerland, 2008. [Google Scholar]
- Freitas, C.R.D. Tourism climatology: Evaluating environmental information for decision making and business planning in the recreation and tourism sector. Int. J. Biometeorol. 2003, 48, 45–54. [Google Scholar] [CrossRef]
- De Freitas, C.R.; Grigorieva, E.A. A comparison and appraisal of a comprehensive range of human thermal climate indices. Int. J. Biometeorol. 2017, 61, 487–512. [Google Scholar] [CrossRef]
- Potchter, O.; Cohen, P.; Lin, T.-P.; Andreas, M. Outdoor human thermal perception in various climates: A comprehensive review of approaches, methods and quantification. Sci. Total. Environ. 2018, 631–632, 390–406. [Google Scholar] [CrossRef]
- Morgan, R.; Gatell, E.; Junyent, R.; Micallef, A.; Ozhan, E.; Williams, A.T. An improved user-based beach climate index. J. Coast. Conserv. 2000, 6, 41–50. [Google Scholar] [CrossRef] [Green Version]
- Hamilton, J.; Lau, M. The role of climate information in tourist destination choice decision-making. In Tourism, Recreation and Climate Change; Gossling, S., Hall, C.M., Eds.; Routledge: London, UK, 2005; pp. 229–250. [Google Scholar]
- Lise, W.; Tol, R.S.J. Impact of climate on tourism demand. Clim. Chang. 2002, 55, 429–449. [Google Scholar] [CrossRef]
- De Freitas, C.R.; Scott, D.; McBoyle, G. A second generation climate index for tourism (CIT): Specification and verification. Int. J. Biometeorol. 2008, 52, 399–407. [Google Scholar] [CrossRef]
- Lin, T.P.; Matzarakis, A. Tourism climate and thermal comfort in sunmoon Lake, Taiwan. Int. J. Biometeorol. 2008, 51, 281–290. [Google Scholar] [CrossRef]
- Zaninović, K.; Matzarakis, A. The bioclimatological leaflet as a means conveying climatological information to tourists and the tourism industry. Int. J. Biometeorol. 2009, 53, 369–374. [Google Scholar] [CrossRef]
- Mieczkowski, Z. The tourism climatic index: A method for evaluating world climates for tourism. Can. Geogr. 1985, 29, 220–233. [Google Scholar] [CrossRef]
- Matzarakis, A. Weather-and climate-related information for tourism. Tour. Hosp. Plan. Dev. 2006, 3, 99–115. [Google Scholar] [CrossRef]
- Błażejczyk, K.; Epstein, Y.; Jendritzky, G.; Staiger, H.; Tinz, B. Comparison of UTCI to selected thermal indices. Int. J. Biometeorol. 2012, 56, 515–535. [Google Scholar] [CrossRef] [Green Version]
- Roshan, G.; Yousefi, R.; Błażejczyk, K. Assessment of the climatic potential for tourism in Iran through biometeorology clustering. Int. J. Biometeorol. 2018, 62, 525–542. [Google Scholar] [CrossRef] [PubMed]
- Jendritzky, G.; de Dear, R.; Havenith, G. UTCI-why another thermal index? Int. J. Biometeorol. 2012, 56, 421–428. [Google Scholar] [CrossRef] [Green Version]
- Fang, Y.; Yin, J. National assessment of climate resources for tourism seasonality in china using the tourism climate index. Atmosphere 2015, 6, 183–194. [Google Scholar] [CrossRef] [Green Version]
- Kovács, A.; Németh, Á.; Unger, J.; Kántor, N. Tourism climatic conditions of Hungary—Present situation and assessment of future changes. Idojaras 2017, 121, 79–99. [Google Scholar]
- Sahabi Abed, S.; Matzarakis, A. Quantification of the tourism climate of Algeria based on the climate-tourism-information-scheme. Atmosphere 2018, 9, 250. [Google Scholar] [CrossRef] [Green Version]
- Brosy, C.; Zaninovic, K.; Matzarakis, A. Quantification of climate tourism potential of Croatia based on measured data and regional modeling. Int. J. Biometeorol. 2014, 58, 1369–1381. [Google Scholar] [CrossRef]
- Roshan, G.R.; Saleh Almomenin, H.; Queiroz, D.S.H.S.; Attia, S. Estimate of outdoor thermal comfort zones for different climatic regions of Iran. Urban Clim. 2019, 27, 8–23. [Google Scholar] [CrossRef]
- Jacobs, C.; Singh, T.; Gorti, G.; Iftikhar, U.; Saeed, S.; Syed, A.; Abbas, F.; Ahmad, B.; Bhadwal, S.; Siderius, C. Patterns of outdoor exposure to heat in three South Asian cities. Sci. Total Environ. 2019, 674, 264–278. [Google Scholar] [CrossRef]
- Mahar, W.A.; Verbeeck, G.; Singh, M.K.; Attia, S. An investigation of thermal comfort of houses in dry and semi-arid climates of quetta, pakistan. Sustainability 2019, 11, 5203. [Google Scholar] [CrossRef] [Green Version]
- Zeng, D.; Wu, J.; Mu, Y.; Deng, M.; Wei, Y.; Sun, W. Spatial-temporal pattern changes of UTCI in the China-Pakistan economic corridor in recent 40 years. Atmosphere 2020, 11, 858. [Google Scholar] [CrossRef]
- Nicol, J.F.; Raja, I.A.; Allaudin, A.; Jamy, G.N. Climatic variations in comfortable temperatures: The Pakistan projects. Energy Build. 1999, 30, 261–279. [Google Scholar] [CrossRef]
- Dee, D.P.; Uppala, S.M.; Simmons, A.J.; Berrisford, P.; Poli, P.; Kobayashi, S.; Andrae, U.; Balmaseda, M.A.; Balsamo, G.; Bauer, P.; et al. The era-interim reanalysis: Configuration and performance of the data assimilation system. Q. J. R. Meteorol. Soc. 2011, 137, 553–597. [Google Scholar] [CrossRef]
- Jendritzky, G.; Havenith, G.; Weihs, P.; Batchvarova, E.; De Dear, R.J. The universal thermal climate index UTCI goal and state of COSTaction 730. In Environmental Ergonomics XII; Mekjavic, I.B., Kounalakis, S.N., Taylor, N.A.S., Eds.; Biomed: Ljubljana, Slovenia, 2007; pp. 509–512. [Google Scholar]
- Brode, P.; Fiala, D.; Blazejczyk, K.; Holmer, I.; Jendritzky, G.; Kampmann, B.; Tinz, B.; Havenith, G. Deriving the operational procedure for the Universal Thermal Climate Index (UTCI). Int. J. Biometeorol. 2012, 56, 481–494. [Google Scholar] [CrossRef] [Green Version]
- Ge, Q.; Kong, Q.; Xi, J.; Zheng, J. Application of UTCI in China from tourism perspective. Theor. Appl. Climatol. 2016, 128, 551–561. [Google Scholar] [CrossRef]
- Blazejczyk, K. Assessment of recreational potential of bioclimate based on the human heat balance. In Proceedings of the 1st International Workshop on Climate, Tourism and Recreation, International Society of Biometeorology Commission on Climate Tourism and Recreation, Neos Marmaras, Halkidiki, Greece, 5–10 October 2001; Matzarakis, A., de Freitas, C.R., Eds.; 2001; pp. 133–152. [Google Scholar]
- Blazejczyk, K. Multiannual and seasonal weather fluctuations and tourism in Poland. In Climate Change and Tourism-Assessment and Copying Strategies. Institute of Geography and Spatial Organization. Polish Academy of Sciences; Amelung, B., Blazejczyk, K., Matzarakis, A., Eds.; Maastricht-Warsaw-Freiburg: Maastricht, The Netherlands, 2007; pp. 69–90. [Google Scholar]
- Blazejczyk, K.; Matzarakis, A. Assessment of bioclimatic differentiation of Poland based on the human heat balance. Geogr. Pol. 2007, 80, 63–82. [Google Scholar]
- Matzarakis, A.; Rutz, F.; Mayer, H. Modelling radiation fluxes in simple and complex environments: Basics of the RayMan model. Int. J. Biometeorol. 2010, 54, 131–139. [Google Scholar] [CrossRef] [Green Version]
- Douglas, V.H. Percent of possible sunshine and the total cloud cover. Mon. Weather Rev. 1977, 105, 648–652. [Google Scholar]
- Błażejczyk, K. BioKlima—Universal Tool for Bioclimatic and Thermophysiological Studies. Available online: https://www.igipz.pan.pl/Bioklima-zgik.html (accessed on 15 April 2020).
- Mihaila, D.; Bistricean, P.I.; Briciu, A.E. Assessment of the climate potential for tourism. Case study: The North-East Development Region of Romania. Theor. Appl. Climatol. 2019, 137, 601–622. [Google Scholar] [CrossRef]
- Xu, M.; Hong, B.; Mi, J.; Yan, S. Outdoor thermal comfort in an urban park during winter in cold regions of China. Sustain. Cities Soc. 2018, 43, 208–220. [Google Scholar] [CrossRef]
- Kong, Q.; Zheng, J.; Fowler, H.J.; Ge, Q.; Xi, J. Climate change and summer thermal comfort in China. Theor. Appl. Climatol. 2019, 137, 1077–1088. [Google Scholar] [CrossRef] [Green Version]
- Wu, F.; Yang, X.; Shen, Z. Regional and seasonal variations of outdoor thermal comfort in China from 1966 to 2016. Sci. Total Environ. 2019, 665, 1003–1016. [Google Scholar] [CrossRef]
- Weihs, P.; Staiger, H.; Tinz, B.; Batchvarova, E.; Rieder, H.; Vuilleumier, L.; Maturilli, M.; Jendritzky, G. The uncertainty of UTCI due to uncertainties in the determination of radiation fluxes derived from measured and observed meteorological data. Int. J. Biometeorol. 2012, 56, 537–555. [Google Scholar] [CrossRef]
Figure 1.
Topography and major cities of China–Pakistan Economic Corridor (CPEC).

Figure 2.
Spatial distribution of the UTCI during June (a), July (b), August (c), and summer (d) in CPEC.
Figure 2.
Spatial distribution of the UTCI during June (a), July (b), August (c), and summer (d) in CPEC.

Figure 3.
Spatial distribution of the UTCI during December (a), January (b), February (c), and winter (d) in CPEC.
Figure 3.
Spatial distribution of the UTCI during December (a), January (b), February (c), and winter (d) in CPEC.

Figure 4.
Spatial distribution of different types of climate in CPEC.


Table 1.
Universal Thermal Climate Index (UTCI) equivalent temperatures categorized in terms of thermal stress and thermal perception.
Table 1.
Universal Thermal Climate Index (UTCI) equivalent temperatures categorized in terms of thermal stress and thermal perception.
| UTCI (°C) | Stress Category | Thermal Perception |
|---|---|---|
| >46 | Extreme heat stress | Torrid |
| 38–46 | Very strong heat stress | Hottish |
| 32–38 | Strong heat stress | Hot |
| 26–32 | Moderate heat stress | Warm |
| 9–26 | No thermal stress | Comfortable |
| 0–9 | Slight cold stress | Cool |
| −13–0 | Moderate cold stress | Coolish |
| −27–−13 | Strong cold stress | Cold |
| −40–−27 | Very strong cold stress | Chilly |
| <−40 | Extreme cold stress | Freezing |
Table 2.
Comparative analysis of grid points in regard to different types of climates.
| Grid Type | Grid Number | Proportion (%) | Main Distribution Provinces |
|---|---|---|---|
| Summer | 320 | 19.99 | Xinjiang, Khyber Pakhtunkhwa |
| Winter | 1175 | 73.39 | All |
| Summer and Winter | 75 | 4.68 | Xinjiang, Khyber Pakhtunkhwa |
| Unsuitable | 31 | 1.94 | Xinjiang |
Table 3.
Distribution of thermal stress categories by total area and percentage of the area during summer and winter from 1979 to 2018.
Table 3.
Distribution of thermal stress categories by total area and percentage of the area during summer and winter from 1979 to 2018.
| Extreme Cold Stress | Very Strong Cold Stress | Strong Cold Stress | Moderate Cold Stress | Slight Cold Stress | ||||||
| Area | Percentage | Area | Percentage | Area | Percentage | Area | Percentage | Area | Percentage | |
| June | 0 | 0 | 0 | 0 | 0 | 0 | 0 | 0 | 32.18 | 3.06 |
| July | 0 | 0 | 0 | 0 | 0 | 0 | 0 | 0 | 3.94 | 0.37 |
| August | 0 | 0 | 0 | 0 | 0 | 0 | 0 | 0 | 3.94 | 0.37 |
| Summer | 0 | 0 | 0 | 0 | 0 | 0 | 0 | 0 | 13.13 | 1.25 |
| December | 0 | 0 | 1.31 | 0.12 | 89.31 | 8.49 | 139.21 | 13.24 | 90.62 | 8.62 |
| January | 0 | 0 | 7.88 | 0.75 | 102.44 | 9.74 | 174.68 | 16.61 | 61.07 | 5.81 |
| February | 0 | 0 | 5.25 | 0.50 | 77.49 | 7.37 | 102.44 | 9.74 | 143.81 | 13.68 |
| Winter | 0 | 0 | 5.25 | 0.50 | 87.34 | 8.31 | 137.90 | 13.12 | 101.13 | 9.62 |
| No Thermal Stress | Moderate Heat Stress | Strong Heat Stress | Very Strong Heat Stress | Extreme Heat Stress | ||||||
| Area | Percentage | Area | Percentage | Area | Percentage | Area | Percentage | Area | Percentage | |
| June | 179.93 | 17.11 | 59.10 | 5.62 | 149.07 | 14.18 | 533.88 | 50.78 | 97.19 | 9.24 |
| July | 195.69 | 18.61 | 47.28 | 4.50 | 202.26 | 19.24 | 602.17 | 57.28 | 0 | 0 |
| August | 203.57 | 19.36 | 61.07 | 5.81 | 286.97 | 27.30 | 495.79 | 47.16 | 0 | 0 |
| Summer | 191.75 | 18.24 | 54.50 | 5.18 | 195.03 | 18.55 | 596.92 | 56.78 | 0 | 0 |
| December | 730.22 | 69.46 | 0.66 | 0.06 | 0 | 0 | 0 | 0 | 0 | 0 |
| January | 705.27 | 67.08 | 0.00 | 0 | 0 | 0 | 0 | 0 | 0 | 0 |
| February | 671.12 | 63.84 | 51.22 | 4.87 | 0 | 0 | 0 | 0 | 0 | 0 |
| Winter | 719.72 | 68.46 | 0.00 | 0 | 0 | 0 | 0 | 0 | 0 | 0 |
© 2020 by the authors. Licensee MDPI, Basel, Switzerland. This article is an open access article distributed under the terms and conditions of the Creative Commons Attribution (CC BY) license (http://creativecommons.org/licenses/by/4.0/).
Share and Cite
MDPI and ACS Style
Zeng, D.; Wu, J.; Mu, Y.; Li, H.; Deng, M.; Wei, Y.; Sun, W. An Assessment of Tourism Climate Comfort in the China–Pakistan Economic Corridor. Sustainability 2020, 12, 6981. https://0-doi-org.brum.beds.ac.uk/10.3390/su12176981
AMA Style
Zeng D, Wu J, Mu Y, Li H, Deng M, Wei Y, Sun W. An Assessment of Tourism Climate Comfort in the China–Pakistan Economic Corridor. Sustainability. 2020; 12(17):6981. https://0-doi-org.brum.beds.ac.uk/10.3390/su12176981
Chicago/Turabian StyleZeng, Di, Jinkui Wu, Yaqiong Mu, Hongyuan Li, Mingshan Deng, Yanqiang Wei, and Weibing Sun. 2020. "An Assessment of Tourism Climate Comfort in the China–Pakistan Economic Corridor" Sustainability 12, no. 17: 6981. https://0-doi-org.brum.beds.ac.uk/10.3390/su12176981
Note that from the first issue of 2016, this journal uses article numbers instead of page numbers. See further details here.