Dry Port Terminal Location Selection by Applying the Hybrid Grey MCDM Model


1
Faculty of Transport and Traffic Engineering, University of Belgrade, 11000 Belgrade, Serbia
2
Department of Technology Management and Economics, Chalmers University of Technology, 41296 Gothenburg, Sweden
3
Faculty of Transport and Traffic Sciences, University of Zagreb, 10000 Zagreb, Croatia
*
Author to whom correspondence should be addressed.
Sustainability 2020, 12(17), 6983; https://0-doi-org.brum.beds.ac.uk/10.3390/su12176983
Submission received: 28 July 2020
/
Revised: 22 August 2020
/
Accepted: 24 August 2020
/
Published: 27 August 2020
(This article belongs to the Special Issue Operational Research Tools for Solving Sustainable Engineering Problems)
Abstract
:Globalization and decentralization of production generate the intensive growth of goods and transport flows, mostly performed by the maritime transport. Ports, as the main nodes in the global logistics networks, are becoming congested, space for their expansion limited, and traffic in their hinterland congested. As a solution to these and many other hinterland-transport-related problems stands out the development of dry port (DP) terminals. Selection of their location is one of the most important strategic decisions on which depends their competitiveness in the market and the functionality of the logistics network. Accordingly, the evaluation and selection of locations for the development of the DP in accordance with the requirements of various stakeholders is performed in this paper, as a prerequisite for the establishment of an ecological, economic, and socially sustainable logistics network in the observed area. To solve this problem, a new hybrid model of multi-criteria decision-making (MCDM) that combines Delphi, AHP (Analytical Hierarchy Process), and CODAS (Combinative Distance-based Assessment) methods in a grey environment is developed. The main contributions of this paper are the defined model, the problem-solving approach based on finding a compromise solution, simultaneous consideration of the environmental, economic, and social sustainability of the DP concept and its implementation in the regional international markets. The applicability of the approach and the defined MCDM model is demonstrated by solving a real-life case study of ranking the potential DP locations in the Western Balkans region. Based on the obtained results, it is concluded that in the current market conditions, it would be most realistic to open three DP terminals, in Zagreb, Ljubljana, and Belgrade.
1. Introduction
Trends in the global economy, implying decentralized production and a significant increase in the flow of goods around the world, generate major problems and challenges for the logistics sector [1]. As 80% of the total quantity and 70% of the total value [2] of goods flows are done by maritime transport, seaports as nodes in the logistics networks through which connections are established between two transport systems, maritime and land, become key factors for supply chain efficiency [1]. However, the increasing intensity of activities in ports leads to increased traffic congestion, especially in the immediate vicinity of the port, lack of space for port operations, and environmental pollution [1]. There is also a significant increase in pressure on the transport flows in the port hinterland, especially in terms of sustainability, which is manifested in the form of public opinion pressure or through formal legislation [3]. In addition, the part of the logistics chain in the port hinterland represents as much as 60% of the total logistics costs of the chain [4]. As a sustainable solution to all these problems, in not only environmental, but also economic and social terms, the use of dry port (DP) terminals is advocated by researchers.
When it first appeared, the term DP referred to a land terminal where (or for which) shipping companies could issue a bill of loading [5]. Later, the term DP had different definitions and was equated with terms such as inland clearance depot, inland container depot, intermodal terminal, land freight terminal, land port, etc. [6]. There are different definitions of DP in the literature, but in this paper the term DP is used in accordance with the definition given by Roso et al. [7], according to which the DP is an inland intermodal terminal directly connected by various modes of transport, primarily rail with one or more seaports, in which users can leave/pick up the goods as if directly at a seaport. It is important to emphasize that the DP, being an inland intermodal terminal, can be connected to the other inland terminals (freight centers) in the logistics network in a wider catchment area in the port hinterland by various transport modes.
The main positive effects and, at the same time, the basic motive for the implementation of the DP concept are the reduction of negative impacts generated by transport flows on the environment, efficiency improvement of the logistics activities, and economic development of the region. DP plays a key role in achieving the sustainability of logistics processes in the port hinterland, and its efficiency and ability to reach full potential largely depend on the choice of an adequate location [3]. Terminal location is one of the most important strategic decisions in the implementation of the DP concept. The functionality of the entire logistics network [8] and its competitiveness in the market depend on this decision [9,10], which is why it requires a thorough analysis [1,6,11]. Therefore, the main purpose of this research is to develop a new hybrid MCDM model, combining the Delphi, AHP (Analytical Hierarchy Process), and CODAS (Combinative Distance-based Assessment) methods in a grey environment, for the location of the DP terminal as a way to achieve economic, environmental, and social sustainability of the logistics system. The model provides compromise solutions that take into account the requirements of different stakeholders and was tested in a real-life case study of locating the DP terminals in the Western Balkans. For the observed area, Zagreb, Ljubljana, and Belgrade are obtained as the most favorable locations for the establishment of the DP terminals. An approach to solving this location problem, based on reaching the compromise solution and including the various aspects of the sustainable development, the new hybrid model, and its application in a case study covering the regional international market, is the main contribution of this paper.
The paper is organized as follows. The second section provides an overview of the literature on the application of the DP concept in the function of sustainability, the location of DP terminals, and the methods that make up the hybrid MCDM model. The third section describes the developed MCDM model in detail and gives the steps of its application. The structure of the problem for the observed case study, application of the MCDM model, sensitivity analysis, and the discussion of the obtained results are presented in the fourth section. The last section provides concluding remarks and future research directions.
2. Literature Review
This section provides an overview of the literature in accordance with the basic aspects of observing the defined problem. The first aspect involves the development of the DP terminals as a concept for achieving environmental, economic, and social sustainability. The second aspect refers to the technique of the DP terminal location selection as one of the most important factors for its efficient functioning and achieving the full potential. The third aspect involves an overview of the basic characteristics of the methods that make up the model developed in this paper for locating the DP terminals.
2.1. Dry Port Terminals in the Function of Sustainability
The term “dry port” was first mentioned in scientific papers in 1984 as the “Port of Memphis as a dry port for New Orleans” [6], but more extensive research on DP terminals was done by Beresford and Dubey on landlocked countries in Africa in 1990 [7,12]. DP is interesting as a subject of research due to numerous advantages generated by its implementation, and some of them are: significant reduction of traffic congestion in the immediate vicinity of the seaport it serves, as well as on the roads connecting the port to the hinterland; more efficient transport and faster movement of goods; improved rail–sea intermodal capacity; port competitiveness improvements through the better market access; significant increase of the market share of railway and inland waterway transport operators; transport cost reduction; expansion of the range of logistics services offered to the customers (shippers and recipients); improvement of the efficiency and reliability of supply chains; reduction of the environmental impacts (air pollution, noise, vibration); development of the regional economy through the creation of new jobs; and attraction of a larger volume of flows, etc. [3,6,13,14,15].
The DP concept has been the subject of various studies dealing with the geographical location of the terminals (e.g., [16]), hinterland access strategies (e.g., [17]), the selection of efficient terminal types (e.g., [18]), directions of the concept development (e.g., [19]), etc. However, taking into account the role of the DP terminal in logistics networks and some of the basic effects it generates, one of the most important directions of research relates to the analysis of the sustainability of the concept. The impact of the DP terminal concept on the environmental sustainability has been most frequently investigated in the literature, especially the effect of reducing the emissions of carbon dioxide and other carbon-based components [6,20,21,22,23,24], and also other positive effects on the environment, such as reduction of emissions of other gases, particles, noise and vibration, and reduction of traffic congestion, traffic accidents, etc. (e.g., [25]). There are also a significant number of studies that, in addition to the environmental, also take into account the economic or social sustainability (e.g., [6,13,26,27]), while the studies that simultaneously analyze environmental, economic, and social sustainability are very rare [1,28,29]. This paper follows up the previous research in this area and builds upon it by considering the most favorable locations for establishing the concept of the DP terminals based on criteria that include the requirements of all stakeholders in the decision-making process in order to achieve environmental, economic, and social sustainability of the logistics system of the observed area.
2.2. Dry Port Terminal Location Selection
The location of the DP terminal plays a key role in achieving the competitive advantage of the terminal, high efficiency of the terminal operation, and the full potential of the terminal in achieving the goals of sustainable development. In the literature, the problem of the DP terminal location selection has been solved in different ways, i.e., by applying different techniques. A significant group is formed by the studies in which the DP terminals are located by solving the optimization problems, most often formulated as the mixed integer linear programming (MILP) problems (e.g., [30,31,32,33,34]). Various metaheuristics are often used to solve these problems, e.g., greedy algorithm (e.g., [35]), genetic algorithm (e.g., [36]), or heuristics developed exclusively to solve the defined problem (e.g., [37]). There are also examples in the literature where DP terminal locations are selected using the cluster analysis (e.g., [38,39,40]), simulation models (e.g., [26,41,42]), or by combining different techniques, e.g., geographic information systems (GIS) and heuristics [43], data mining and complex network theory [44], etc. However, the problem with all of the above techniques is that decisions on DP terminal locations are made solely on the basis of one or several parameters, most often investment and operating costs, and neglect the whole set of qualitative factors that have a significant impact on location [11]. Therefore, for solving this type of problem the MCDM methods, able to consider a large number of criteria, stand out in the literature. Some of the MCDM methods applied to locating the DP terminals, either alone or in combination with some other methods, in a conventional form or in the fuzzy environment, are: Analytical Network Process (ANP) [10,45,46], AHP [8,47], a combination of AHP and ELECTRE methods [48], a combination of CFA, MACBETH and PROMETHEE methods [49], etc. However, in most of these studies, the location of the DP terminal was done without considering the requirements and goals of different stakeholders. One of the few studies in which the views of different stakeholders were considered when locating the DP terminals is the work of Nguyen and Notteboom [11], but even they did not obtain the location as a compromise solution but simply by aggregating the results of the independent potential location rankings by each stakeholder. This is another research gap that this paper covers, since the final ranking of the potential DP locations is obtained as a compromise solution that integrates the requirements of all stakeholders.
Considering the geographical area of research, most papers deal with the DP terminal locations in Asia (e.g., [10,35,36,43,46]) and Europe (e.g., [8,26,33,41]), and considerably fewer with locations in Africa (e.g., [34]), North America (e.g., [50]), and South America (e.g., [47]). The vast majority of papers deal with the DP terminal locations for the area of a state or region within a state, as well as for serving a single port [51]. Studies covering areas of multiple countries and ports, such as the case in this paper, are very rare [30,31,52].
2.3. An Overview of the Methods that Make Up the MCDM Model
The paper proposes a new hybrid MCDM model based on a combination of Delphi, AHP, and CODAS methods in a grey environment to solve the defined problem. As the problem has a hierarchical structure with criteria, sub-criteria, and alternatives at different levels, it was justified to apply the AHP method to solve it. However, as the AHP method requires comparison of all pairs of elements (criteria, sub-criteria, alternatives) at the same hierarchical levels, and considering the large scale of the problem (large number of elements), the AHP method was used only to determine the criteria weights. The CODAS method was used for the evaluation of the alternatives and the final ranking, which significantly reduced the complexity of the problem. Since evaluations were performed by the decision makers representing different stakeholders for whom the considered criteria may have different significance, a part of the Delphi method that enabled the unification of the different evaluations was introduced into the model. The entire MCDM model was developed in a grey environment because it enabled the processing of partial data, as well as the combination of unclear and incomplete assessments by the decision makers. Below is a review of the literature on the methods that make up the model.
The Delphi method was developed by Dalkey and Helmer [53], and is generally used to iteratively process the decision makers’ opinions until a consensus on the subject of research is reached [54]. The Delphi method is used in situations where there is a risk of subjectivity; when problems are large, complex, and multidisciplinary; when there is uncertainty in the decision-making process and the time frame for decision-making is short; when the opinions of multiple decision makers are sought and anonymity is desirable, etc. [55]. Accordingly, the basic characteristics as well as the advantages of this method are: anonymity, iterativity, controlled feedback, and statistical group response [55]. Some of the disadvantages are the need for multiple repetition of the questionnaire to achieve the convergence of the assessments and the high cost of data collection, especially for large and complex problems [56]. The Delphi method is widely accepted in the literature, and either alone or in combination with some other methods it has been used to solve various problems, such as defining the typical structures of the intermodal terminals [57], selecting the development indicators of the urban sustainability [58], planning of intermodal terminals [59], selecting the maintenance strategy for ship machinery systems [60], locating intermodal terminals [61], etc.
The AHP method was developed by Saaty [62], and is based on defining the hierarchical structure of the problem, i.e., arranging the elements of the problem (criteria, sub-criteria, alternatives) in several levels and their mutual comparison within them. As a result, it gives the weights, i.e., the significance of the elements at each hierarchical level in relation to the decision-making goal. It is used to solve complex problems with a large number of elements that have a strong mutual influence [63]. The AHP method is theoretically easy to understand and simple to apply in practice [64], allows consideration of both quantitative and qualitative parameters [62], and the pairwise comparison of elements, on which it is based, makes it one of the most transparent and technically most appropriate methods for determining the weights (significance) of the problem elements [65]. On the other hand, the main disadvantages of the method are that it requires a large number of comparisons in cases of larger problems, making it very difficult to maintain consistency of the decision makers’ assessments [63], as well as that it uses a discrete scale for comparisons, which cannot adequately express ambiguity and vagueness in the decision makers’ assessments [66]. The AHP method requires a greater effort to obtain a solution, compared to some other methods that perform direct ranking of elements, such as the SMART or SWARA methods [67], but on the other hand allows decision makers to better understand the relative importance of and interactions between the elements and to perform more precise evaluation, resulting in better solutions [68,69]. In addition, compared to the methods that require complete consistency, e.g., MACBETH or FUCOM [70], the AHP method is more flexible and allows for an increase or decrease in the tolerance threshold according to the decision makers’ preferences [71,72]. Because of the above, AHP is one of the most commonly used MCDM methods, especially for determining the criteria weights, and either alone or in combination with some other methods it has found wide application for solving various problems, such as evaluating energy systems [73], selecting intermodal transport chains [74], locating warehouses for humanitarian logistics [75], ranking of logistics systems scenarios [76], locating dry port terminals [77], locating city logistics terminals [78], etc.
The CODAS method was developed by Ghorabaee et al. [79], and is based on determining the overall performance of the elements of the decision problem (usually an alternative), based on the Euclidean and Taxicab distances from the negative ideal point (solution, alternative). Euclidean distances are used as the primary measures of evaluation, and if these distances are too close for some alternatives, Taxicab distances are included in the evaluation to make the alternatives easier to compare. The degree of closeness (similarity) of Euclidean distances is determined on the basis of the closeness threshold parameter. The CODAS method, as well as methods such as TOPSIS, VIKOR, EDAS, COPRAS, etc., belongs to the group of distance-based methods. The main advantage of these, in relation to some other methods such as AHP, ANP, BWM, etc., is that they do not require comparison of all pairs of elements (criteria, sub-criteria, alternatives), which makes them much more efficient, especially when considering problems with a large number of elements. On the other hand, the advantage of the CODAS method over the other methods from the same group is the ability to evaluate the elements of the problem by applying more than one type of distance, which significantly increases the accuracy of results and allows fine differentiation between closely ranked alternatives [79]. CODAS is a relatively new method, but in a short period of time it has been applied, either alone or in combination with some other methods, to solve problems in various areas, such as locating dismantling centers in reverse logistics [80], evaluating organizational culture in the field of innovation and sustainable development [81], selecting staff [82], selecting suppliers [83,84], selecting renewable energy sources [85], etc.
Most of the shortcomings of the individual methods that make up the model can be solved by applying intuitive or interval sets (e.g., fuzzy, rough, grey). Fuzzy [86], rough [87], and grey [88] sets are the different ways of representing uncertainty in data sets [89]. They are introduced into the MCDM with the aim of more efficient problem-solving in situations where elements of the problem are assessed by the decision makers, who very often give inaccurate, incomplete, or ambiguous evaluations. Although there are some overlaps between them, these sets differ significantly. Grey sets, unlike fuzzy and rough sets, allow better processing of partial data as well as combining obscure and incomplete data into one model [89]. In addition, grey sets can present situations that cannot be represented by either fuzzy or rough sets [89]. Therefore, in this paper, the previously described MCDM methods are combined in a grey environment. Grey extension of the Delphi method was performed by Lingkan [90] and has since been applied to solve various problems, either alone or in combination with other methods [91,92,93], while grey extension of the AHP method was first performed by Liu et al. [94] and has since been recorded in different variants of the AHP method applications in the grey environment for solving various problems, either alone or in combination with some other methods [95,96,97]. There have been no examples in the literature so far of extending the CODAS method in the grey environment, nor of combining these three methods in any form (conventional or in an environment of intuitive or interval assessments). This is another research gap covered by this paper, i.e., another of the main contributions of the paper.
3. Hybrid Grey MCDM Model
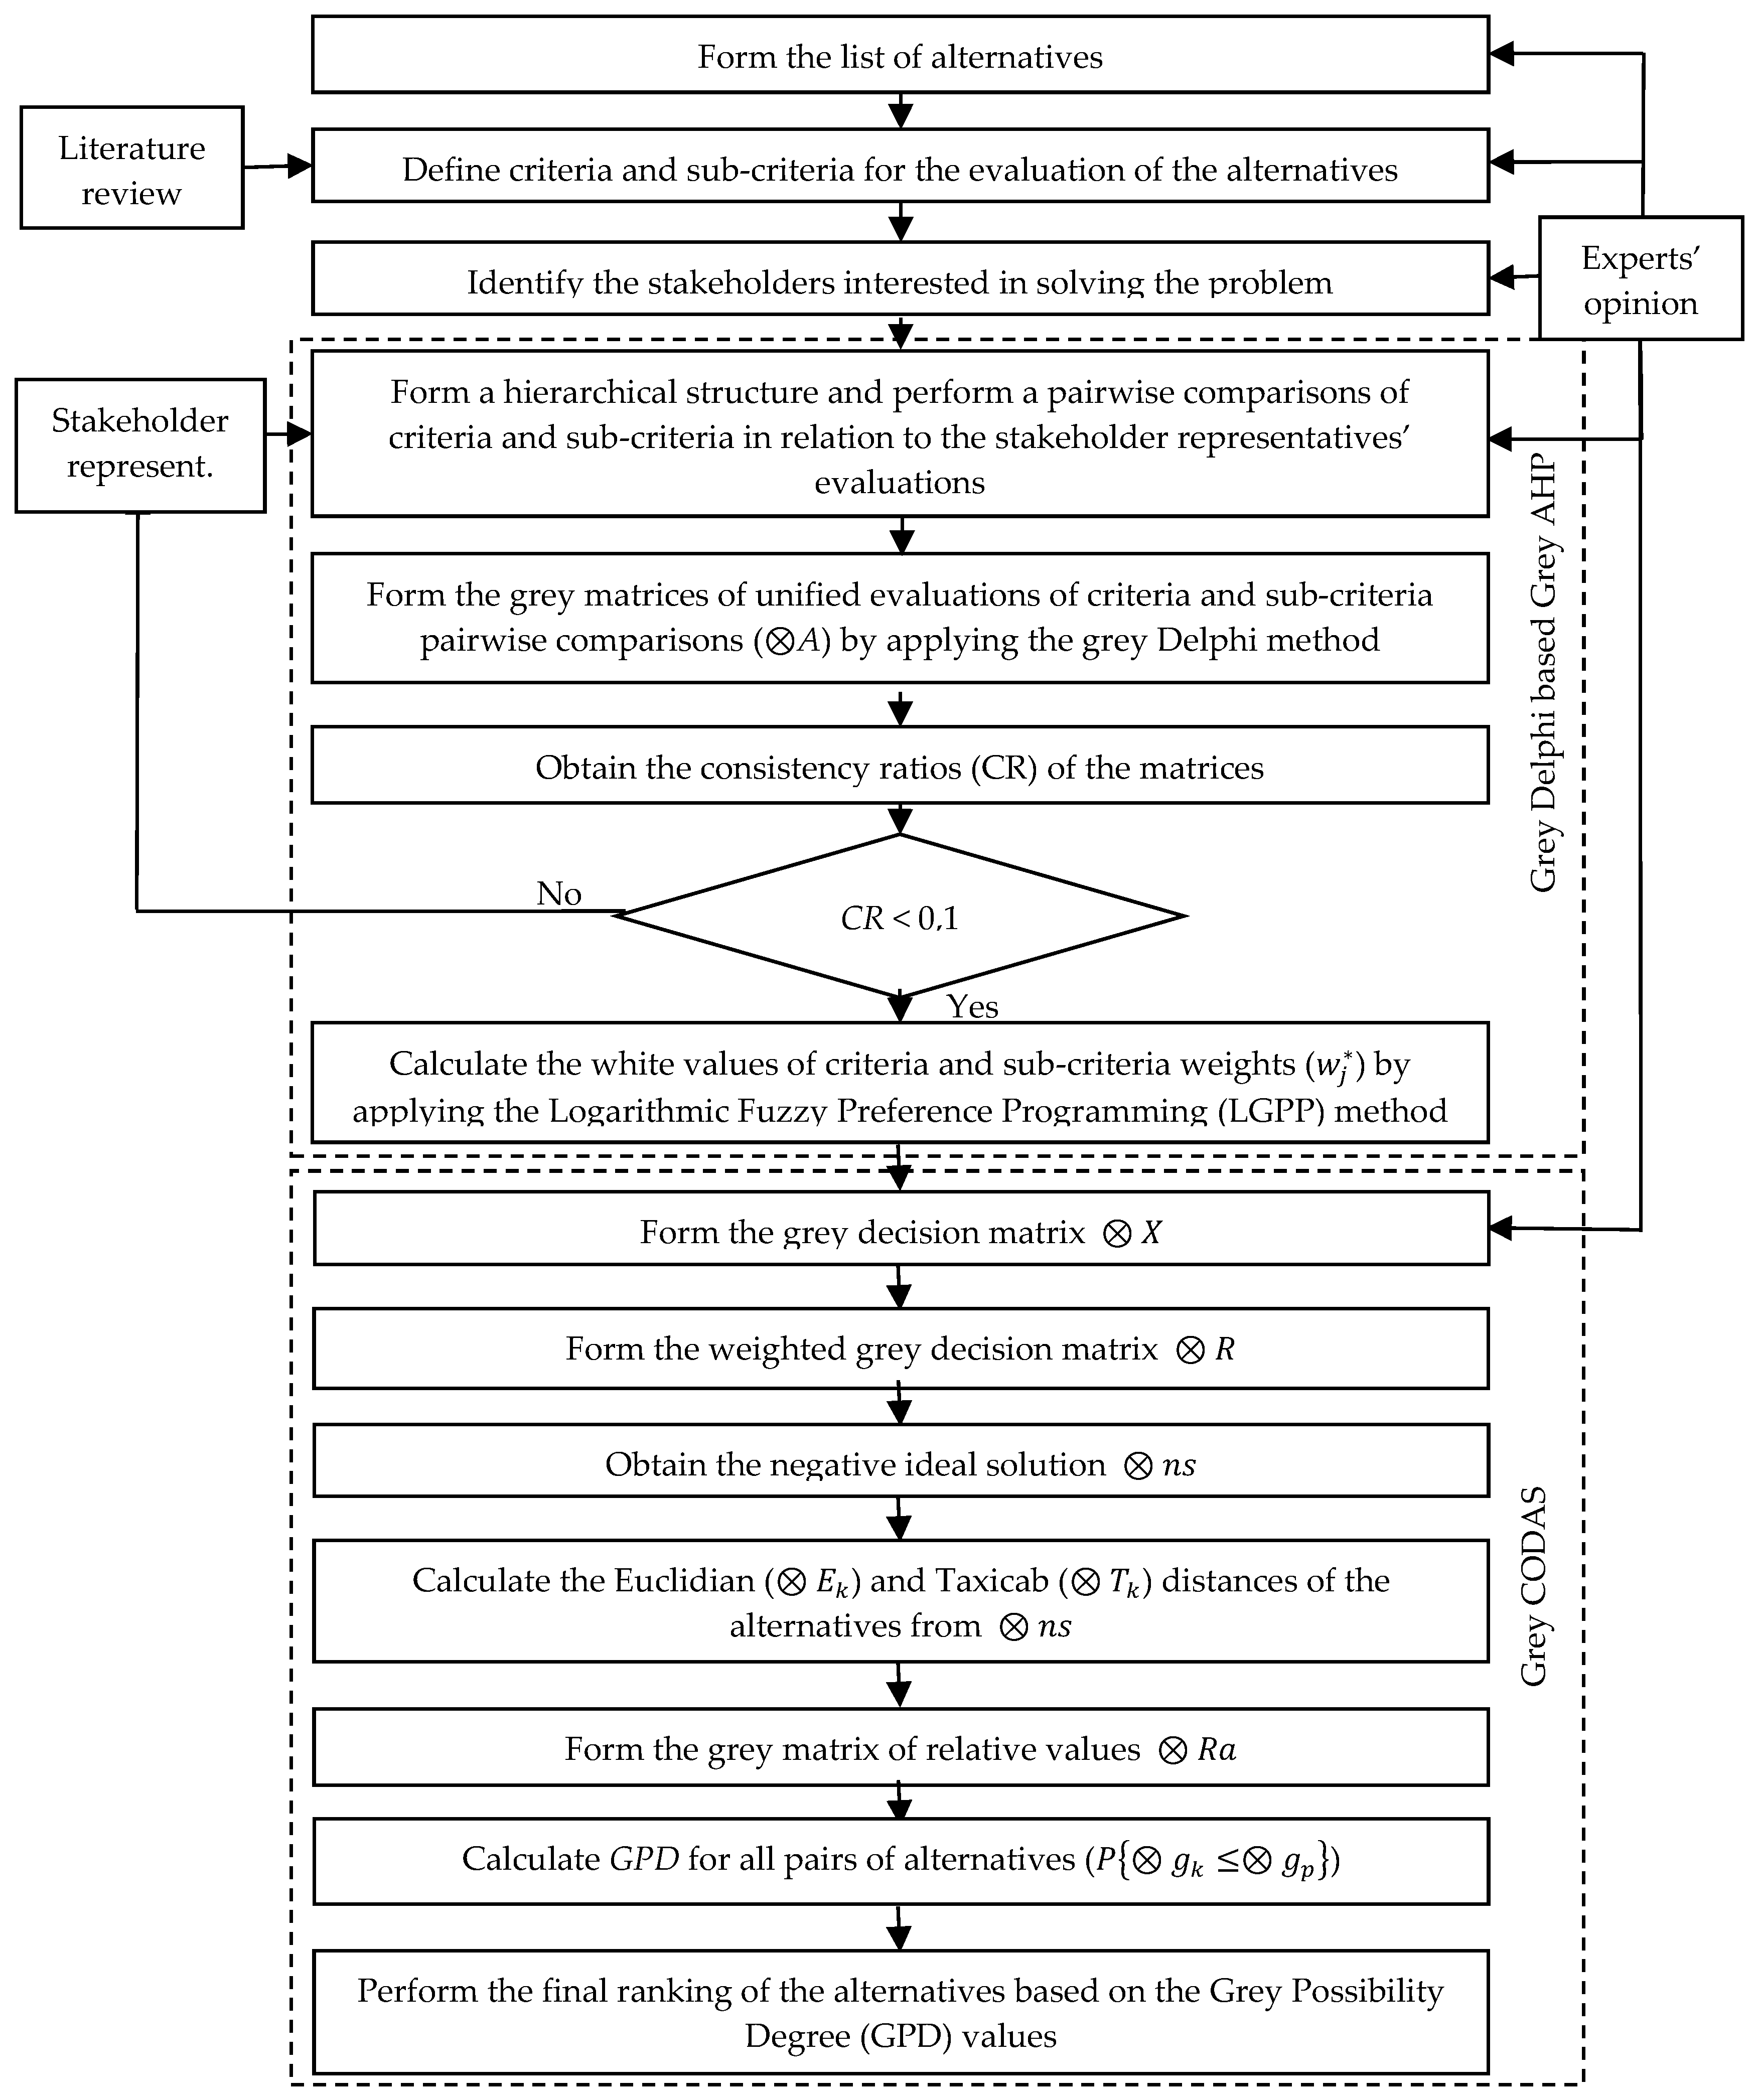
The hybrid MCDM model proposed in this paper for the DP terminal location selection involved the application of the Grey Delphi-based grey AHP (GDAHP) method for determining criteria and sub-criteria weights and the Grey CODAS (GCODAS) method for ranking and selecting the most favorable alternatives. The steps for applying the model are explained in detail below, and a general overview of the model structure is given in Figure 1.
Step 1: Define the problem structure, i.e., form the sets of alternatives, criteria, and sub-criteria for their evaluation and identify the stakeholders.
Step 2: Define the grey scale for the evaluation of the criteria, sub-criteria, and the alternatives by the decision makers. Linguistic terms and the corresponding grey values are given in Table 1.
Step 3: Obtain the criteria and sub-criteria weights by applying the GDAHP method. Decision makers belonging to the different stakeholders perform the pairwise comparisons of the elements (criteria and sub-criteria) using the linguistic terms, which can be transformed into grey values according to the relations given in Table 1. These values indicate the relative importance, i.e., the elements’ preference in relation to the other elements.
Step 3.1: Unify the decision makers’ evaluations by applying the following equations:
where and are the lower and upper values of the unified grey evaluation , respectively, and stands . and are the lower and upper values of the grey evaluation indicating the comparison of the element (criteria, sub-criteria) i in relation to the element j by the decision maker belonging to the stakeholder h. n is the number of criteria/sub-criteria, and o is the number of stakeholders involved in the process.
Step 3.2: Form the grey decision matrix () elements of which are the unified values of the criteria/sub-criteria comparisons :
Step 3.3: Calculate the relative weights of the elements (criteria, sub-criteria). For each matrix of the pairwise comparisons, it is necessary to obtain the priority vector. For obtaining the priority vector the Logarithmic Grey Preference Programming (LGPP) method is developed, based on the Logarithmic Fuzzy Preference Programming (LFPP) method developed by Wang and Chin [98]. The elements of the grey decision matrix are approximated by the logarithms of the grey evaluations by applying the following equation:
For obtaining the elements’ priority values (wj) it is necessary to solve the following non-linear priority model:
subject to:
where λ is the minimum membership degree obtained in the following way:
J denotes the objective function, which should be minimized, are the white values of the priority vector, for , and M is the large enough constant such as . and for are the non-negative deviation variables introduced in order to avoid λ from taking a negative value. It is most desirable that the values of the deviation variables are as small as possible, and that they meet the following inequalities:
Let be the optimal solution to the model (6)–(11). Normalized criteria values for the grey decision matrix are obtained in the following way:
where exp() is the exponential function, namely, for . This method results in white normalized weights.
In order to control the result of the method, the Consistency Ratio (CR) for each matrix is calculated as follows [98]:
where CI is the Consistency Index and is calculated as follows:
is the eigenvalue of the matrix . RI the Random Index, whose values for matrices of various sizes are contained in Saaty [99]. The CR values should be less than 0.10 in order for comparisons to be acceptable.
Step 4: Perform the alternatives evaluation by applying the GCODAS method developed in this paper as the grey extension of the conventional CODAS method developed by Ghorabaee et al. [79].
Step 4.1: Form the grey decision matrix (⊗X) in the following way:
where represents the grey evaluation of the alternative k () in relation to the criterion j (), while and represent the lower and upper values of the grey number .
Step 4.2: Form the weighted grey decision matrix (⊗R) in the following way:
where represents the values indicating the weight of the criterion j.
Step 4.3: Define the negative ideal solution in the following way:
Step 4.4: Calculate the grey Euclidian distances () of the alternatives from the negative ideal solution in the following way:
where and are the lower and upper values of the grey number obtained in the following way:
Step 4.5: Calculate the grey Taxicab distances () of the alternatives from the negative ideal solution in the following way:
Step 4.6: Form the grey matrix () of the relative values of comparisons of the alternatives’ distances from the negative ideal solution () in the following way:
where and are the lower and upper values of the grey number obtained in the following way:
where is the index of the alternative with which all the other alternatives k are compared (all pairs of alternatives are compared), and represents the function that determines the equality threshold of the Euclidian distances of any two alternatives, and it is obtained in the following way:
where white(⊗Ek,p) is obtained by applying the following equation [100]:
In the Function (33) τ represents the threshold parameter defined by the decision maker. It is recommended that this parameter take the value between 0.1 and 0.5. Introduction of this parameter ensures that if the difference of the Euclidian distances of any two alternatives is greater than τ, the alternatives are compared by the values, including the Taxicab distances, as well.
Step 4.7: Calculate the Grey Possibility Degrees (GPDs) for all pairs of alternatives in the following way [101]:
where L represents the span of the grey value obtained as the difference between the lower and upper values of a grey number, and are the grey values of the unified distances of the alternatives from the negative ideal solution, while and , i.e., and , are their lower and upper values, respectively, obtained in the following way:
The defined GPDs have the following characteristics:
If , then ,
If , then ,
If , then .
When there is an intersection between and , if then is less than , and if then is less than .
Step 4.8: Perform the final ranking of the alternatives based on the GPD values. The best alternative is the one that has the GPD < 0.5 in most of the alternative pairs comparisons.
4. Case Study: Locating a Dry Port in the Western Balkans
The case study discussed in this section of the paper implies the location selection for the DP terminal in the Western Balkans region, in a geographical and not a political sense, which includes the territories of the following countries: Slovenia, Croatia, Serbia, Bosnia and Herzegovina, Montenegro, North Macedonia, and Albania. This region is of great importance for the transport flows through Europe. It is a gateway for a significant part of the goods flows entering Europe, primarily from Asia, through the ports that gravitate towards it: Trieste, Koper, Rijeka, Split, Ploče, Bar, Durres, and Thessaloniki [102,103]. In addition, it is very well-connected by land with both Central and Western Europe via Pan-European [102] and TENtec corridors [103], and with Asia via Eurasian corridors [104]. All this makes the region of the Western Balkans ideal for the development of the DP concept. However, not all countries in this region are equally suitable for the development of the concept. Apart from obvious differences in geographical terms (position, access to the sea, inland waterways, etc.), the countries of the Western Balkans also differ significantly in terms of political, economic, and technological development as a consequence of different cultural and historical heritage. There are also significant differences in the transport sector. Slovenia long ago understood the importance of adequate planning and development of this area through institutionalization and definition of financing models, with the developed system of public bodies, institutions and economic organizations, and related documents defined in accordance with the needs of the country [105]. Croatia and Serbia lag behind, so even though they have defined strategies and plans, they are not updated regularly and do not have clearly defined dynamics, priority goals, and measures [105]. The problem in these countries is the lack, or insufficient development, of the systems that interlock the economy and science, state bodies, and economic entities at the national level, so groups within a sector of the ministry responsible for traffic or transportation deal with transport [105]. Other countries, Montenegro, Bosnia and Herzegovina, Macedonia, and Albania, above all, have inadequately developed plans that contain clumsily inserted parts of planning documents of other countries. Because of the above, the independent development of the DP concept in each of the countries of the region is not justified, but it is necessary to observe a broader, regional aspect that would imply the opening of the DP terminals for the markets transcending the national borders. Accordingly, a comprehensive approach that takes into account different aspects of the problem is necessary to locate them. The structure of the problem is defined below, i.e., the sets of potential locations, as well as the criteria and sub-criteria for their evaluation.
4.1. Potential Locations and the Criteria for Their Evaluation
The problem considered in this paper was structured as follows. The capitals of the Western Balkan countries, being the economic, administrative, political, traffic, etc., centers of the region, were defined as potential locations (PLs) for the establishment of the DP. These were Ljubljana (PL1), Zagreb (PL2), Belgrade (PL3), Sarajevo (PL4), Podgorica (PL5), Skopje (PL6), and Tirana (PL7). For the evaluation of potential DP locations, 20 sub-criteria were defined that could be classified into one of the four groups of criteria: environmental (EN), economic (EC), infrastructure (IN), and socio-political (SP). Environmental, economic, and socio-political criteria in the process of selecting the DP locations directly included the principles of the basic pillars of sustainability (environmental, economic, and social). On the other hand, the infrastructure criteria indirectly considered the environmental and economic sustainability of the DP locations. The criteria were defined based on an extensive review of the literature on locating the DP terminals using the MCDM methods [8,10,11,45,46,48,49,106]. An overview of the defined criteria and sub-criteria, as well as their description, are given in Table 2.
4.2. Application of the Hybrid MCDM Model for Ranking the Potential DP Locations
The first step in applying the model, in addition to defining a set of alternatives and criteria and sub-criteria for their evaluation, involved identifying stakeholders interested in solving the problem. Three stakeholders were identified: investors/owners and operators (Inv.), users (Use.), and government/administration and residents (A&R). The main goal of investors and operators was to maximize profit, i.e., financial benefits, as a result of successful operation of the terminal. A large number of secondary goals contributed to the realization of this primary goal, such as minimization of logistics costs, optimization of position in the logistics chain, synergy with existing activities, synergy with external strategic initiatives, maximization of expansion possibilities, and utilization of the available infrastructure capacity, etc. The main goal of the users was to get quality service at a reasonable price. Regardless of whether the logistics and organization of transport were the primary activities of users, service quality was crucial for the efficiency of their business, while the price directly affected the possibility of making a profit. The goals of administration and residents were divided into economic and strategic. The main economic goal was the economic development of the surrounding area (city, region, state) in which the terminal was located. The main strategic goal was the ecological and social responsibility through preserving the environment, improving mobility and accessibility, reducing traffic congestion, reducing traffic accidents, etc.
For the purpose of this research, the representatives belonging to each group of defined stakeholders, who had the noticeable knowledge and experience in the investigated field, were selected. They were given by the questioners the instructions to neglect their personal territorial, political, cultural, etc., preferences in order to provide an attitude that was as objective as possible of the stakeholder group they represented, for the observed area. The questions were designed to be as simple as possible in order to capture the attitudes of the stakeholders’ representatives by the defined criteria. For example, they were asked: “In your opinion, how much more important is energy consumption (C1) than harmful emissions (C2)?” In the same manner the questioner followed all remaining criteria and sub-criteria. In accordance with their preferences, the stakeholders’ representatives evaluated the significance of the criteria with linguistic evaluations, which were then converted into the grey evaluations using the relations given in Table 1. An example of an evaluation of the EN criteria by the stakeholders’ representatives is given in Table 3.
By applying the Equations (1)–(3), their evaluations were re-unified and the grey decision matrix (4) was formed. For each matrix of comparison of criteria, and then the sub-criteria, the nonlinear priority model (6) was solved, subject to (7)–(11), and the optimal solutions were obtained and normalized by using the Equation (12). In this way, the white weights of criteria and sub-criteria were obtained. For each matrix of criteria or sub-criteria comparison, the consistency ratios were calculated by the Equations (13) and (14), and since all the values were less than 0.10, it was concluded that the evaluations were valid. The final sub-criteria weights for the potential locations evaluation were obtained by multiplying the weights of criteria with the weights of the belonging sub-criteria. These weights are shown in Table 4.
Then, the evaluation of alternatives in relation to the sub-criteria was performed according to the reports and indicators of the development of logistics, transport, economy, and political situation in each country [107], statistical data [108], environmental indicators of the transport chain operations [109], the results of previous research [30,31,32,110], and the experience of the decision makers. Linguistic evaluations of the alternatives in relation to the sub-criteria, given in Table 5, were then converted into the grey evaluations by applying the relations given in Table 1, and thus a grey decision Matrix (15) was formed.
By applying the Equations (16) and (17), the weighted grey decision matrix was formed, and then by applying the Equations (18) and (19), the negative ideal solution was defined. By applying the Equations (20)–(25), the grey Euclidian distances were obtained, and by applying the Equations (26)–(28), the grey Taxicab distances of the alternatives from the negative ideal solution were obtained. Afterwards, by applying the Equations (29)–(34), the grey matrix of the relative values of the alternatives was obtained and is presented in Table 6.
By applying the Equations (35)–(38), the GPD values were calculated, based on which the final ranking of the alternatives, i.e., potential locations, was obtained (Table 7).
4.3. Sensitivity Analysis
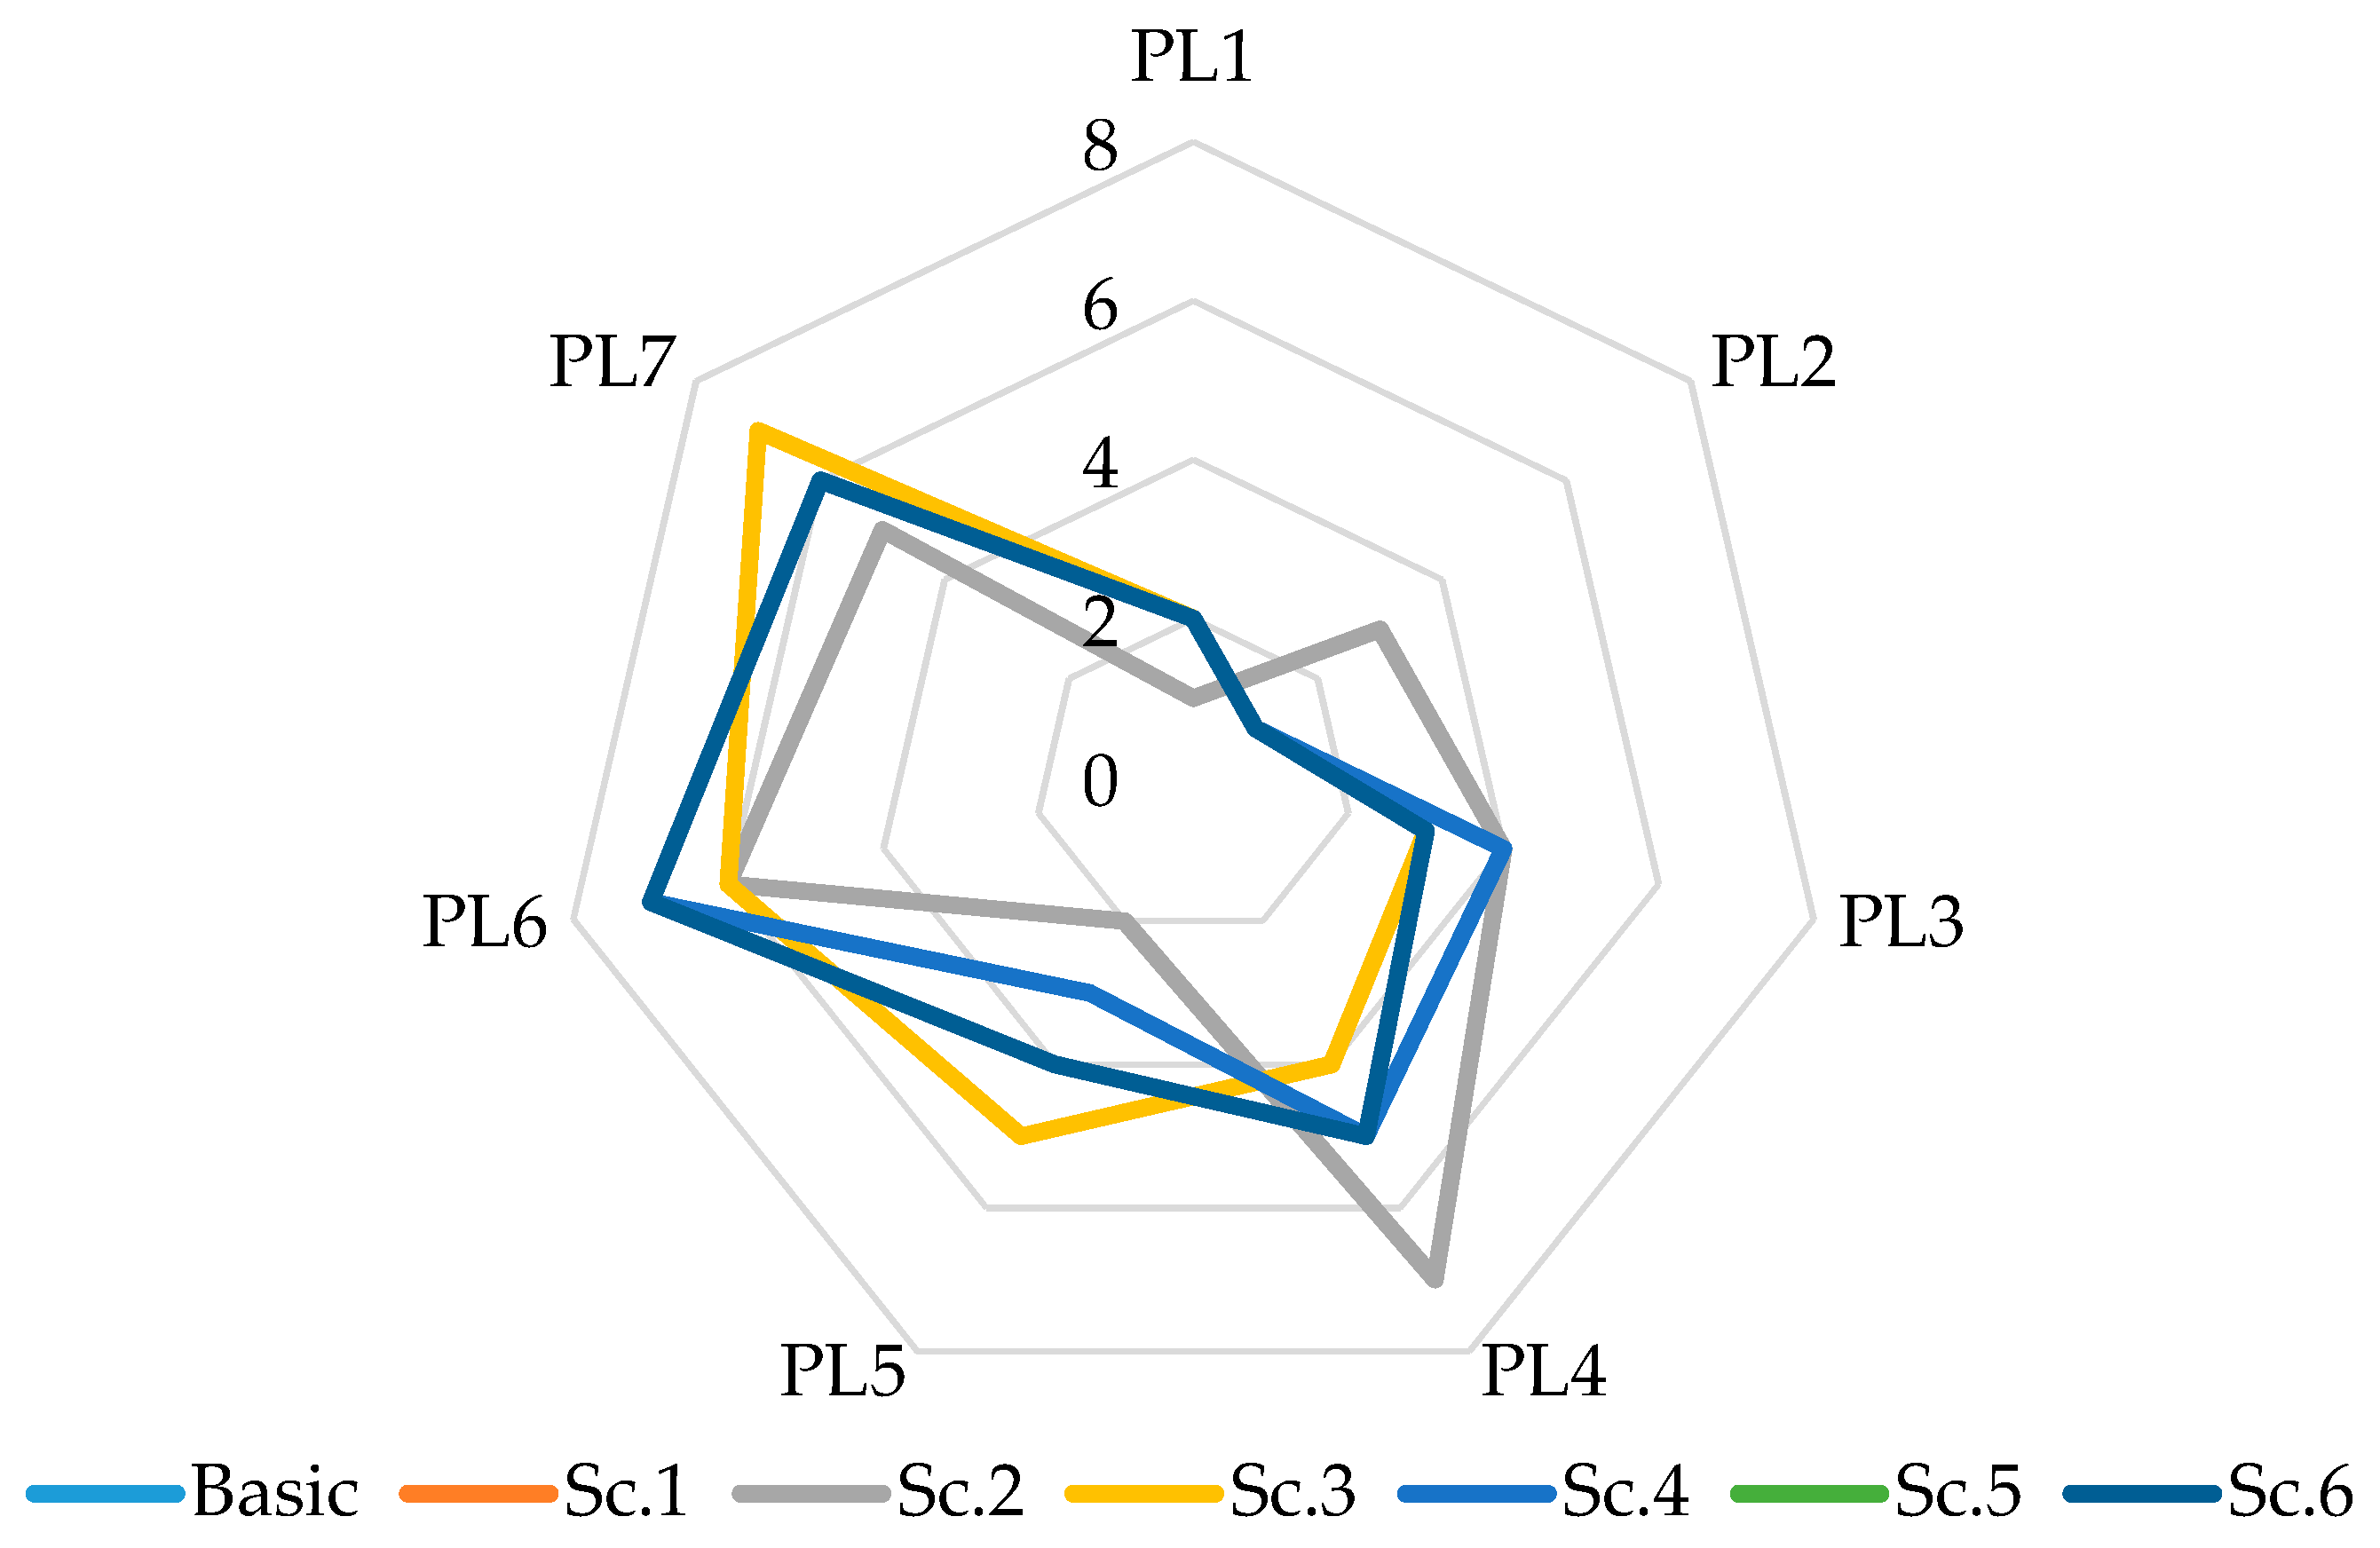
In order to examine the stability of the obtained solution, a sensitivity analysis was performed in which the influence of changes in certain parameters on the result was examined. For this purpose, six additional scenarios were defined, the first of which (Sc.1) implied the equalization of the importance of all criteria, while the other scenarios implied the exclusion of one of the five most important criteria, i.e., the criteria with the greatest weight and thus the strongest influence on the potential location ranking. Criteria C6 (Sc.2), C3 (Sc.3), C13 (Sc.4), C5 (Sc.5), and C16 (Sc.6), respectively, were excluded in the scenarios. Changes in the ranking of potential locations in additional scenarios compared to the initial (basic) scenario are shown in Table 8 and Figure 2. As it can be seen from the conducted sensitivity analysis, in all scenarios except Sc.2, PL2 was ranked first and PL1 second. PL3 was ranked third in all scenarios except Sc.2 and Sc.4. The remaining potential locations were mostly ranked between fourth and seventh place in all scenarios, and the only step forward was made by PL5, which was ranked second in Sc.2 and third in Sc.4, respectively. Taking everything into account, it can be concluded that the obtained solution is sufficiently stable and that Zagreb (PL2), Ljubljana (PL1), and Belgrade (PL3) stand out as the most favorable potential locations, respectively. The worst locations for the opening of the DP terminal are Skopje (PL6) and Tirana (PL7), respectively.
4.4. Discussion of the Obtained Results and Analysis of the Proposed Approach
Zagreb (PL2) is the best ranked potential location for the opening of the DP terminal in the Western Balkans region. As well as in the case of Ljubljana (PL1), which is the second-ranked potential location, proximity and good transport connections with the ports of Koper, Trieste, Rijeka, Split, and Ploče, as well as the fact that the countries whose capitals are these potential locations are EU member states, mostly contributed to their good ranking. As such, they have more developed economies, they are more politically stable and part of a single customs zone, they have higher levels of development of planning and regulatory documents, etc., which result in better potential to attract more goods and better connectivity. On the other hand, Belgrade (PL3), as the capital of Serbia, is ranked third, with a significant advantage over the remaining PLs, despite the fact that Serbia is not an EU member and is the only country in the Western Balkans, besides North Macedonia, that has no access to the sea. Belgrade has a very good geographical position at the crossroads between Western Europe and Asia. It is the only PL that has the possibility of using inland waterways, and although no seaport is close to it, all ports are within a radius of 700 km, which gives it a significant advantage in relation to all the other PLs and makes it the only one with a realistic possibility to achieve a significant connection with all observed ports. Cheaper labor and lower investment and operating costs are other factors that make this PL better than PL2 and PL1. On the other hand, although plans and regulations are not at a satisfactory level, they are significantly more developed than in the other countries, whose capitals are ranked lower. The lack and insufficient development of planning and regulatory documents, as well as political instability, lack of professional staff, and underdeveloped economy are some of the main reasons for the weaker ranking of the other PLs. In addition, these PLs mainly gravitate to the local ports (in the immediate vicinity), they are not located, or are partially located, on major transport routes, and it is not realistic to expect that they could attract a larger volume of flows and achieve more significant status in the network.
The implications of the obtained results of potential location rankings are such that when considering the Western Balkans region for the opening of a DP terminal, it is not possible to talk about the opening of a single terminal. None of the defined PLs would fully satisfy the requirements of the market, goods flows between the observed ports and their wider catchment areas, i.e., the markets of Central and Western Europe. Accordingly, the end result of the analysis is the establishment of three DP terminals, in Zagreb, Ljubljana, and Belgrade, since this would be the only way to achieve the full effect of redirecting flows from the observed ports and to create preconditions for the development of a sustainable logistics network in the Western Balkans and its integration into a comprehensive European network. This does not mean that DP terminals should never be considered for the remaining PLs, but it means that in the current market conditions the emphasis should be placed on establishing the selected locations, while the remaining locations could be activated in later stages of the DP terminal network development. These PLs would most likely be used for the establishment of the close- and mid-range DP terminals that would enable the connection of the ports from their immediate surroundings with the rest of the network.
The applicability of the proposed hybrid model, which combines Delphi, AHP, and CODAS methods in a grey environment, was proven by solving a real-life case study. Since the problem was structured as a hierarchy, with the ultimate goal at the top, groups of criteria and sub-criteria, and the alternatives, i.e., the potential locations, at the bottom, the AHP method imposed itself as a logical technique for solving it. However, considering that when applying only the AHP method the dimensions of the problem would be very large due to the need to compare all pairs of alternatives in relation to each of the sub-criteria, and that its solution would require significant time, financial and other resources, the CODAS method was introduced in the MCDM model. Since, on the other side, the criteria did not have the same significance for all stakeholders involved in the problem, a part of the Delphi method was introduced in the model in order to obtain unified assessments of the criteria. The model was developed in a grey environment because the elements of the problem were evaluated by the decision makers who very often gave inaccurate, incomplete, or ambiguous assessments. The model is universally applicable and after certain adjustments it can be used to solve various problems, in both this and other areas. The main advantages of the defined model are simplicity of application, provision of quality results with reasonable consumption of resources, and the possibility of fine differentiation between mutually similar alternatives. The limitations of the defined model are reflected in the inability to consider possible cause-and-effect relationships between the criteria themselves. This can be solved by applying the ANP (Analytical Network Process) method [99], but in that case one should take into account the number of criteria and sub-criteria that are considered, because the problem dimensions grow exponentially with their increase. The model also does not take into account the different influence that stakeholders have on problem solving, but views them all as equals, which is not usually the case in real-life situations, but this aspect can easily be included in the model by assigning the different weights to the stakeholders.
5. Conclusions
The subject of the paper was the selection and evaluation of locations for the DP terminals with the aim of establishing an environmentally, economically, and socially sustainable logistics network in the hinterlands of the ports, taking into account the requirements of different stakeholders. To solve the defined problem, a new hybrid MCDM model, which combined Delphi, AHP, and CODAS methods in a grey environment, was developed. The applicability of the developed model was successfully demonstrated by solving a real-life case study of ranking the potential locations for the establishment of the DP terminals in the Western Balkans region. As the result, the most realistic scenario would be the opening of three DP terminals, in Zagreb, Ljubljana, and Belgrade.
The main contributions of the paper are defining a new approach for the ranking and selection of the DP terminal locations based on finding a compromise solution that integrates the requirements of all stakeholders, as well as the extension of the CODAS method in a grey environment and development of the new hybrid MCDM model. In addition, the paper makes a significant contribution and upgrade to the previous research in the field of sustainability analysis of the DP concept and its implementation for the needs of regional international markets.
In future research, the defined MCDM model can be extended to include cause-and-effect relationships between the criteria and sub-criteria, e.g., by including the ANP method, as well as the different influences of stakeholders through the assignment of weighting coefficients to their grades. The number of stakeholders’ representatives could also be increased in order to capture the fine differentiations in the characteristics of the regions within the observed area. Since the defined MCDM model is universally applicable and can be applied to solve various problems after certain adjustments, one of the directions of future research can be its application to solve problems with a similar structure, in this or any other area. In addition, in future research, some new, different approaches can be developed to solve the defined problem, and the problem itself can be expanded to include a wider area, a larger number of ports, and more potential locations. It would be interesting to define models and plans for the future development of the logistics network and to explore the possibilities and conditions for activating the other potential DP locations, both existing and the newly defined.
Author Contributions
Conceptualization, S.T., M.K., V.R. and N.B.; Formal analysis, S.T., M.K., V.R. and N.B.; Methodology, S.T. and M.K.; Writing—original draft, S.T., M.K., V.R. and N.B. All authors have read and agreed to the published version of the manuscript.
Funding
This research received no external funding.
Conflicts of Interest
The authors declare no conflict of interest.
References
- Awad-Núñez, S.; González-Cancelas, N.; Soler-Flores, F.; Camarero-Orive, A. How Should The Sustainability of The Location of Dry Ports Be Measured? A Proposed Methodology Using Bayesian Networks and Multi-Criteria Decision Analysis. Transport 2015, 30, 312–319. [Google Scholar] [CrossRef] [Green Version]
- UNCTAD—United Nations Conference on Trade and Development. Review of Maritime Transportation; United Nations Publication, UNCTAD: Geneva, Switzerland, 2017; Available online: https://unctad.org/en/PublicationsLibrary/rmt2017_en.pdf (accessed on 16 July 2020).
- Khaslavskaya, A.; Roso, V. Outcome-Driven Supply Chain Perspective on Dry Ports. Sustainability 2019, 11, 1492. [Google Scholar] [CrossRef] [Green Version]
- Beresford, A.; Pettit, S.; Xu, Q.; Williams, S. A study of dry port development in China. Marit. Econ. Logist. 2012, 14, 73–98. [Google Scholar] [CrossRef]
- UNCTAD—United Nations Conference on Trade and Development. Multimodal Transport and Containerisation. TD/B/C.4/238/Supplement 1, Part Five: Ports and Container Depots; United Nations Publication, UNCTAD: Geneva, Switzerland, 1982. [Google Scholar]
- Khaslavskaya, A.; Roso, V. Dry ports: Research outcomes, trends, and future implications. Marit. Econ. Logist. 2020, 22, 265–292. [Google Scholar] [CrossRef] [Green Version]
- Roso, V.; Woxenius, J.; Lumsden, K. The dry port concept: Connecting container seaports with the hinterland. J. Transp. Geogr. 2009, 17, 338–345. [Google Scholar] [CrossRef]
- Roso, V.; Brnjac, N.; Abramovic, B. Inland Intermodal Terminals Location Criteria Evaluation: The Case of Croatia. Transp. J. 2015, 54, 496. [Google Scholar] [CrossRef]
- Wang, C.; Chen, Q.; Huang, R. Locating dry ports on a network: A case study on Tianjin Port. Marit. Policy Manag. 2018, 45, 71–88. [Google Scholar] [CrossRef]
- Wei, J.; Sun, A.; Zhuang, J. The Selection of Dry Port Location with the Method of Fuzzy-ANP. In Lecture Notes in Electrical Engineering; LNEE 72; Luo, Q., Ed.; Springer: Berlin/Heidelberg, Germany, 2010; pp. 265–273. [Google Scholar] [CrossRef]
- Nguyen, L.C.; Notteboom, T. A Multi-Criteria Approach to Dry Port Location in Developing Economies with Application to Vietnam. Asian J. Shipp. Logist. 2016, 32, 23–32. [Google Scholar] [CrossRef]
- Beresford, A.K.C.; Dubey, R.C. Handbook on the Management and Operation of Dry Ports; United Nations Publication: Geneva, Switzerland, 1990; Available online: https://unctad.org/en/Docs/rdpldc7_en.pdf (accessed on 16 July 2020).
- Henttu, V.; Hilmola, O.-P. Financial and environmental impacts of hypothetical Finnish dry port structure. Res. Transp. Econ. 2011, 33, 35–41. [Google Scholar] [CrossRef]
- Hui, F.; Aye, L.; Duffield, C. Engaging Employees with Good Sustainability: Key Performance Indicators for Dry Ports. Sustainability 2019, 11, 2967. [Google Scholar] [CrossRef] [Green Version]
- Veenstra, A.; Zuidwijk, R.; Van Asperen, E. The extended gate concept for container terminals: Expanding the notion of dry ports. Marit. Econ. Logist. 2012, 14, 14–32. [Google Scholar] [CrossRef]
- Roso, V.; Russell, D.; Ruamsook, K.; Stefansson, G. Inland port services for seaport’s competitive advantage. World Rev. Intermodal Transp. Res. 2015, 5, 263–280. [Google Scholar]
- Monios, J. The role of inland terminal development in the hinterland access strategies of Spanish ports. Res. Transp. Econ. 2011, 33, 59–66. [Google Scholar] [CrossRef] [Green Version]
- Tadić, S.; Krstić, M.; Brnjac, N. Selection of efficient types of inland intermodal terminals. J. Transp. Geogr. 2019, 78, 170–180. [Google Scholar] [CrossRef]
- Bask, A.; Roso, V.; Andersson, D.; Hämäläinen, E. Development of seaport–dry port dyads: Two cases from Northern Europe. J. Transp. Geogr. 2014, 39, 85–95. [Google Scholar] [CrossRef]
- Facchini, F.; Digiesi, S.; Mossa, G. Optimal dry port configuration for container terminals: A non-linear model for sustainable decision making. Int. J. Prod. Econ. 2020, 219, 164–178. [Google Scholar] [CrossRef]
- Li, W.; Hilmola, O.-P.; Panova, Y. Container Sea Ports and Dry Ports: Future CO2 Emission Reduction Potential in China. Sustainability 2019, 11, 1515. [Google Scholar] [CrossRef] [Green Version]
- Kurtulus, E.; Cetin, I.B. Assessing the Environmental Benefits of Dry Port Usage: A Case of Inland Container Transport in Turkey. Sustainability 2019, 11, 6793. [Google Scholar] [CrossRef] [Green Version]
- Tao, X.; Wu, Q.; Zhu, L. Mitigation potential of CO2 emissions from modal shift induced by subsidy in hinterland container transport. Energy Policy 2017, 101, 265–273. [Google Scholar] [CrossRef]
- Regmi, M.B.; Hanaoka, S. Assessment of Modal Shift and Emissions along a Freight Transport Corridor Between Laos and Thailand. Int. J. Sustain. Transp. 2013, 9, 192–202. [Google Scholar] [CrossRef]
- Roso, V. Evaluation of the dry port concept from an environmental perspective: A note. Transp. Res. Part D Transp. Environ. 2007, 12, 523–527. [Google Scholar] [CrossRef]
- Lattila, L.; Henttu, V.; Hilmola, O.-P. Hinterland operations of sea ports do matter: Dry port usage effects on transportation costs and CO2 emissions. Transp. Res. Part E Logist. Transp. Rev. 2013, 55, 23–42. [Google Scholar] [CrossRef]
- Cezar-Gabriel, C. Performance assessment in operating dry ports. Ann. Fac. Econ. 2010, 1, 934–938. [Google Scholar]
- Tsao, Y.-C.; Thanh, V.-V. A multi-objective mixed robust possibilistic flexible programming approach for sustainable seaport-dry port network design under an uncertain environment. Transp. Res. Part E Logist. Transp. Rev. 2019, 124, 13–39. [Google Scholar] [CrossRef]
- Awad-Núñez, S.; Cancelas, N.G.; Orive, A.C. Setting of factors considered when determining the location area of a dry port and its hierarchies through a Delphi methodology. Rev. Transp. Territ. 2015, 13, 100–121. [Google Scholar] [CrossRef]
- Krstić, M.; Kovač, M.; Tadić, S. Dry port location selection: Case study for the Adriatic ports. In Proceedings of the XLVI International Symposium of Operational Research, SYM-OP-IS 2019, Kladovo, Serbia, 15–18 September 2019; pp. 303–308. (In Serbian). [Google Scholar]
- Tadić, S.; Kovač, M.; Zečević, S.; Krstić, M. Implementation of the dry port concept in the West Balkans region. In Proceedings of the VII International symposium: New Horizons of Transport and Communications, Doboj, Republic of Srpska, 29–30 November 2019; pp. 422–427. (In Serbian). [Google Scholar]
- Tadić, S.; Krstić, M.; Kovač, M. Location of dry port terminals: Case study for the territory of Republic of Serbia. In Proceedings of the fifth scientific conference with international participation “Politehnika”, Belgrade, Serbia, 13 December 2019; pp. 558–563. (In Serbian). [Google Scholar]
- Ambrosino, D.; Sciomachen, A. Location of Mid-range Dry Ports in Multimodal Logistic Networks. Procedia Soc. Behav. Sci. 2014, 108, 118–128. [Google Scholar] [CrossRef] [Green Version]
- Mwemezi, J.J. PInland container depot integration into logistics networks based on network flow model: The Tanzanian perspective. Afr. J. Bus. Manag. 2012, 6, 7149–7157. [Google Scholar] [CrossRef] [Green Version]
- Feng, X.; Zhang, Y.; Li, Y.; Wang, W. A Location-Allocation Model for Seaport-Dry Port System Optimization. Discret. Dyn. Nat. Soc. 2013, 2013, 1–9. [Google Scholar] [CrossRef]
- Chang, Z.; Notteboom, T.; Lu, J. A two-phase model for dry port location with an application to the port of Dalian in China. Transp. Plan. Technol. 2015, 38, 442–464. [Google Scholar] [CrossRef]
- Ng, A.K.Y.; Gujar, G.C. The Spatial Characteristics of Dry Ports in India. Trans. Commun. Bull. Asia Pac. 2009, 78, 102–111. [Google Scholar]
- Li, F.; Shi, X.; Hu, H. Location Selection of Dry Port Based on AP Clustering—The Case of Southwest China. J. Syst. Manag. Sci. 2011, 1, 79–88. [Google Scholar]
- Wang, Y.; Wang, J. The optimal location of dry port: A case study of the hinterland of Western Side of the Taiwan Straits Port Group. In Proceedings of the IEEE 17th International Conference on Industrial Engineering and Engineering Management, Xiamen, China, 29–31 October 2010; pp. 1864–1868. [Google Scholar]
- Zhang, Z. Applying fuzzy C-clustering to location planning of dry port. J. Shanghai Marit. Univ. 2008, 29, 34–37. [Google Scholar]
- Muravev, D.; Rakhmangulov, A. Environmental Factors’ Consideration at Industrial Transportation Organization in the «Seaport—Dry port» System. Open Eng. 2016, 6, 476–484. [Google Scholar] [CrossRef] [Green Version]
- Henttu, V.; Lättilä, L.; Hilmola, O.P. Financial and Environmental Impacts of a Dry Port to Support Two Major Finnish Transit Seaports; Department of Industrial Management, Faculty of Technology Management, Lappeenranta University of Technology: Lappeenranta, Finland, 2010. [Google Scholar]
- Abbasi, M.; Pishvaee, M.S. A two-stage GIS-based optimization model for the dry port location problem: A case study of Iran. J.Ind. Syst. Eng. 2018, 11, 50–73. [Google Scholar]
- Van Nguyen, T.; Zhang, J.; Zhou, L.; Meng, M.; He, Y. A data-driven optimization of large-scale dry port location using the hybrid approach of data mining and complex network theory. Transp. Res. Part E Logist. Transp. Rev. 2020, 134, 101816. [Google Scholar] [CrossRef]
- Abdoulkarim, H.T.; Fatouma, S.H.; Kalgora, B. The Selection of Dry Port Location by Analytic Network Process Model: A Case Study of Dosso-Niger. J. Transp. Technol. 2019, 9, 146–155. [Google Scholar] [CrossRef] [Green Version]
- Wang, C.-H.; Wei, J.Y. Research on the Dry Port Location of Tianjin Port Based on Analytic Network Process. In Proceedings of the 2008 International Seminar on Business and Information Management, Wuhan, China, 19 December 2008; pp. 75–78. [Google Scholar]
- Gonçalves, W.; De Freitas, R.R.; Chiquieri, J.; Júnior, L.O.R.; Mattos, A.L.; Zatta, F.N. Regional development and Organization of space: An Approach to the Dry Port location using the Hybrid Method Fuzzy-AHP. Int. J. Adv. Eng. Res. Sci. 2019, 6, 521–530. [Google Scholar] [CrossRef] [Green Version]
- Ka, B. Application of Fuzzy AHP and ELECTRE to China Dry Port Location Selection. Asian J. Shipp. Logist. 2011, 27, 331–353. [Google Scholar] [CrossRef] [Green Version]
- Komchornrit, K. The Selection of Dry Port Location by a Hybrid CFA-MACBETH-PROMETHEE Method: A Case Study of Southern Thailand. Asian J. Shipp. Logist. 2017, 33, 141–153. [Google Scholar] [CrossRef]
- Rahimi, M.; Asef-Vaziri, A.; Harrison, R. An Inland Port Location-Allocation Model for a Regional Intermodal Goods Movement System. Marit. Econ. Logist. 2008, 10, 362–379. [Google Scholar] [CrossRef]
- Flämig, H.; Hesse, M. Placing dryports. Port regionalization as a planning challenge—The case of Hamburg, Germany, and the Süderelbe. Res. Transp. Econ. 2011, 33, 42–50. [Google Scholar] [CrossRef]
- Do, N.-H.; Nam, K.-C.; Le, Q.-L.N. A consideration for developing a dry port system in Indochina area. Marit. Policy Manag. 2011, 38, 1–9. [Google Scholar] [CrossRef]
- Dalkey, N.; Helmer, O. An Experimental Application of the DELPHI Method to the Use of Experts. Manag. Sci. 1963, 9, 458–467. [Google Scholar] [CrossRef]
- Delbecq, A.L.; Van De Ven, A.H.; Gustafson, D.H. Group Techniques for Program Planning: A Guide to Nominal Group and Delphi Processes; Scott Foresman: Glenview, IL, USA, 1975. [Google Scholar]
- Safari, H.; Soufi, M.; Aghasi, E. Select a Hypermarket Location Based on Fuzzy Multi Criteria Decision Making (F-MCDM) Techniques (Hybrid of F-Delphi, F-AHP, F-LLSM and F-PROMTHEE). Kuwait Chapter Arab. J. Bus. Manag. Rev. 2014, 4, 76–95. [Google Scholar] [CrossRef] [Green Version]
- Ishikawa, A.; Amagasa, M.; Shiga, T.; Tomizawa, G.; Tatsuta, R.; Mieno, H. The max-min Delphi method and fuzzy Delphi method via fuzzy integration. Fuzzy Sets Syst. 1993, 55, 241–253. [Google Scholar] [CrossRef]
- Tadić, S.; Krstić, M.; Zečević, S. Defining the Typical Structures of the Intermodal Terminals. In Quantitative Methods in Logistics; Vidović, M., Kilibarda, M., Zečević, S., Radivojević, G., Eds.; Faculty of Transport and Traffic Engineering, University of Belgrade: Beograd, Serbia, 2020; pp. 67–86. [Google Scholar]
- Chan, P.; Lee, M.-H. Developing Sustainable City Indicators for Cambodia through Delphi Processes of Panel Surveys. Sustainability 2019, 11, 3166. [Google Scholar] [CrossRef] [Green Version]
- Tadić, S.; Krstić, M.; Roso, V.; Brnjac, N. Planning an Intermodal Terminal for the Sustainable Transport Networks. Sustainability 2019, 11, 4102. [Google Scholar] [CrossRef] [Green Version]
- Emovon, I.; Norman, R.; Murphy, A.J. Hybrid MCDM based methodology for selecting the optimum maintenance strategy for ship machinery systems. J. Intell. Manuf. 2015, 29, 519–531. [Google Scholar] [CrossRef]
- Zečević, S.; Tadić, S.; Krstić, M. Intermodal Transport Terminal Location Selection Using a Novel Hybrid MCDM Model. Int. J. Uncertain. Fuzziness Knowl.-Based Syst. 2017, 25, 853–876. [Google Scholar] [CrossRef]
- Saaty, T.L. The Analytic Hierarchy Process: Planning, Priority Setting, Resource Allocation; McGraw-Hill International Book Co.: New York, NY, USA, 1980. [Google Scholar]
- Calabrese, A.; Costa, R.; Levialdi, N.; Menichini, T. Integrating sustainability into strategic decision-making: A fuzzy AHP method for the selection of relevant sustainability issues. Technol. Forecast. Soc. Chang. 2019, 139, 155–168. [Google Scholar] [CrossRef]
- Wang, J.; Jing, Y.-Y.; Zhang, C.-F.; Zhao, J.-H. Review on multi-criteria decision analysis aid in sustainable energy decision-making. Renew. Sustain. Energy Rev. 2009, 13, 2263–2278. [Google Scholar] [CrossRef]
- Zardari, N.H.; Ahmed, K.; Shirazi, S.; Bin Yusop, Z. Literature review. In Weighting Methods and Their Effects on Multi-Criteria Decision Making Model Outcomes in Water Resources Management; Springer: Berlin, Germany, 2015; pp. 7–67. [Google Scholar]
- Tesfamariam, S.; Sadiq, R. Risk-based environmental decision-making using fuzzy analytic hierarchy process (F-AHP). Stoch. Environ. Res. Risk Assess. 2006, 21, 35–50. [Google Scholar] [CrossRef]
- Hajkowicz, S.A.; McDonald, G.T.; Smith, P.N. An Evaluation of Multiple Objective Decision Support Weighting Techniques in Natural Resource Management. J. Environ. Plan. Manag. 2000, 43, 505–518. [Google Scholar] [CrossRef]
- Ishizaka, A.; Siraj, S. Are multi-criteria decision-making tools useful? An experimental comparative study of three methods. Eur. J. Oper. Res. 2018, 264, 462–471. [Google Scholar] [CrossRef] [Green Version]
- Konidari, P.; Mavrakis, D. Multi-criteria evaluation of climate policy interactions. J. Multi-Criteria Decis. Anal. 2006, 14, 35–53. [Google Scholar] [CrossRef]
- Durmić, E. The Evaluation of the Criteria for Sustainable Supplier Selection by Using the FUCOM Method. Oper. Res. Eng. Sci. Theory Appl. 2019, 2, 91–107. [Google Scholar] [CrossRef]
- Ishizaka, A.; Nemery, P. Multi-criteria Decision Analysis: Methods and Software; John Wiley & Sons: Hoboken, NJ, USA, 2013. [Google Scholar]
- Alonso, J.A.; Lamata, M.T. Consistency in the analytic hierarchy process: A new approach. Int. J. Uncertain. Fuzz. 2006, 14, 445–459. [Google Scholar] [CrossRef] [Green Version]
- Taylan, O.; AlAmoudi, R.; Kabli, M.; Aljifri, A.; Ramzi, F.; Herrera-Viedma, E. Assessment of Energy Systems Using Extended Fuzzy AHP, Fuzzy VIKOR, and TOPSIS Approaches to Manage Non-Cooperative Opinions. Sustainability 2020, 12, 2745. [Google Scholar] [CrossRef] [Green Version]
- Zečević, S.; Tadić, S.; Krstić, M. Selection of the intermodal transport chain variant using AHP method. In Proceedings of the 3rd International Conference on Traffic and Transport Engineering-ICTTE, Guimarães, Portugal, 4–7 September 2016; Scientific Research Center Ltd.: Belgrade, Serbia, 2016; pp. 339–345. [Google Scholar]
- Roh, S.Y.; Jang, H.M.; Han, C.H. Warehouse Location Decision Factors in Humanitarian Relief Logistics. Asian J. Shipp. Logist. 2013, 29, 103–120. [Google Scholar] [CrossRef] [Green Version]
- Tadić, S.; Zečević, S.; Krstić, M. Ranking of Logistics System Scenarios for Central Business District. Promet Traffic Transp. 2014, 26, 159–167. [Google Scholar] [CrossRef]
- Kashani, A.H.; Nodehi, A.N.; Bandpey, S. Prioritization of Dry Ports by Using Pair Comparison Technique to Enhance AHP. J. Int. Bus. Stud. 2014, 3, 34–45. [Google Scholar]
- Tadić, S.; Zečević, S.; Krstić, M. City logistics terminal location selection using combined fuzzy AHP and fuzzy TOPSIS analysis. In Proceedings of the 1st International Conference on Traffic and Transport Engineering, ICTTE, Belgrade, Serbia, 29–30 November 2012; pp. 345–358. [Google Scholar]
- Ghorabaee, M.K.; Zavadskas, E.K.; Turskis, Z.; Antucheviciene, J. A new Combinative Distance-Based Assessment (CODAS) method for multi-criteria decision-making. Econ. Comput. Econ. Cybern. 2016, 50, 25–44. [Google Scholar]
- Karagoz, S.; Deveci, M.; Simic, V.; Aydin, N.; Bolukbas, U. A novel intuitionistic fuzzy MCDM-based CODAS approach for locating an authorized dismantling center: A case study of Istanbul. Waste Manag. Res. 2020, 38, 660–672. [Google Scholar] [CrossRef] [PubMed]
- Sansabas-Villalpando, V.; Olguín, I.J.C.P.; Pérez-Domínguez, L.; Rodríguez-Picón, L.A.; Méndez-González, L.C. CODAS HFLTS Method to Appraise Organizational Culture of Innovation and Complex Technological Changes Environments. Sustainability 2019, 11, 7045. [Google Scholar] [CrossRef] [Green Version]
- Yeni, F.B.; Özçelik, G. Interval-Valued Atanassov Intuitionistic Fuzzy CODAS Method for Multi Criteria Group Decision Making Problems. Group Decis. Negot. 2018, 28, 433–452. [Google Scholar] [CrossRef]
- Bolturk, E. Pythagorean fuzzy CODAS and its application to supplier selection in a manufacturing firm. J. Enterp. Inf. Manag. 2018, 31, 550–564. [Google Scholar] [CrossRef]
- Badi, I.; Abdulshahed, A.M.; Shetwan, A. A case study of supplier selection for a steelmaking company in Libya by using the Combinative Distance-based Assessment (CODAS) model. Decis. Mak. Appl. Manag. Eng. 2018, 1, 1–12. [Google Scholar] [CrossRef]
- Bolturk, E.; Karasan, A. Interval valued neutrosophic CODAS method for renewable energy selection. In Data Science and Knowledge Engineering for Sensing Decision Support; Liu, J., Lu, J., Xu, Y., Martinez, L., Kerreiçinde, E., Eds.; World Scientific Publishers: London, UK, 2018; pp. 1026–1033. [Google Scholar] [CrossRef]
- Zadeh, L. Fuzzy sets. Inf. Control. 1965, 8, 338–353. [Google Scholar] [CrossRef] [Green Version]
- Pawlak, Z. Rough sets. Int. J. Comput. Inf. Sci. 1982, 11, 341–356. [Google Scholar] [CrossRef]
- Ju-Long, D. Control problems of grey systems. Syst. Control. Lett. 1982, 1, 288–294. [Google Scholar] [CrossRef]
- Yang, Y.; John, R. Grey sets and greyness. Inf. Sci. 2012, 185, 249–264. [Google Scholar] [CrossRef] [Green Version]
- Lingkan, Y. Analyzing the main factors in the forming of torrential rain debris flow—Applying Grey Systems Theory in Dealing with the Findings of an Investigation by the Delphi Method. B. Soil Water Conserv. 1987, 2. Available online: https://en.cnki.com.cn/Article_en/CJFDTOTAL-STTB198702005.htm (accessed on 26 August 2020).
- Lü, X.; Fan, H.-T.; Xin, L. Study on the risk assessment approach of port facility security based on a comprehensive model of Delphi method, analytic hierarchy process, grey theory and fuzzy evaluation method. In Proceedings of the 2015 International Conference on Transportation Information and Safety (ICTIS), Wuhan, China, 25–28 June 2015; pp. 628–632. [Google Scholar]
- Chen, Y.J.; Duan, L.; Xiao, Y. Constructing driving behavior indicators using principal component analysis and combination of fuzzy and grey Delphi method. J. Saf. Environ. 2012, 12, 228–232. [Google Scholar]
- Ma, Z.; Shao, C.; Ma, S.; Ye, Z. Constructing road safety performance indicators using Fuzzy Delphi Method and Grey Delphi Method. Expert Syst. Appl. 2011, 38, 1509–1514. [Google Scholar] [CrossRef]
- Liu, G.; Zhou, Z.C.; Shen, Y.W. Warfare Efficiency Evaluation of Surface Warships Formation Based on AHP and Grey Evaluation Method. Command Control Simul. 2007, 29, 69–73. [Google Scholar]
- Sahoo, S.; Dhar, A.; Debsarkar, A.; Kar, A. Future Scenarios of Environmental Vulnerability Mapping Using Grey Analytic Hierarchy Process. Nat. Resour. Res. 2019, 28, 1461–1483. [Google Scholar] [CrossRef]
- Guru, S.; Mahalik, D.K. A comparative study on performance measurement of Indian public sector banks using AHP-TOPSIS and AHP-grey relational analysis. Opsearch 2019, 56, 1213–1239. [Google Scholar] [CrossRef]
- Çelikbilek, Y. Using an Integrated Grey AHP–MOORA Approach for Personnel Selection: An Application on Manager Selection in the Health Industry. Alphanumeric J. 2018, 6, 69. [Google Scholar] [CrossRef]
- Wang, Y.; Chin, K.-S. Fuzzy analytic hierarchy process: A logarithmic fuzzy preference programming methodology. Int. J. Approx. Reason. 2011, 52, 541–553. [Google Scholar] [CrossRef] [Green Version]
- Saaty, T.L.; Vargas, L.G. The Analytic Network Process; RWS Publications: Pittsburgh, PA, USA, 1996. [Google Scholar]
- Osati, M.; Omidvari, M. Performance measurement of electricity suppliers using PROMETHEE and balance scorecard. Manag. Sci. Lett. 2016, 6, 387–394. [Google Scholar] [CrossRef]
- Mukherjee, S.; Ghosh, B. Application of Grey Possibility Degree in Comparing Poverty. International Journal of Innovative Research in Science. Eng. Technol. 2015, 4, 4698–4703. [Google Scholar] [CrossRef]
- Pan-European Corridors to Major Transport Axes. Available online: https://www.unece.org/trans/main/wp5/wp5_workshop2.html (accessed on 17 July 2020).
- EC—European Commission. The Core Network Corridors: Trans European Transport Network; Directorate General for Mobility and Transport: Brussels, Belgium, 2013. [Google Scholar]
- UN—United Nations. Joint Study on Developing Euro-Asia Transport Linkages, Prepared under the United Nations Development Account Project on “Capacity Building through Cooperation in Developing Land and Land-Sea Interregional Transport Linkages”; United Nations: Geneva, Switzerland, 2008. [Google Scholar]
- Tadić, S.; Zečević, S.; Milenković, D. Intermodal transport treatment in developed and developing countries. Tehnika 2017, 67, 897–902. (In Serbian) [Google Scholar] [CrossRef] [Green Version]
- Black, J.; Roso, V.; Marušić, E.; Brnjac, N. Issues in Dry Port Location and Implementation in Metropolitan Areas: The Case of Sydney, Australia. Trans. Marit. Sci. 2018, 7, 41–50. [Google Scholar] [CrossRef] [Green Version]
- The World Bank. Global Rankings. 2018. Available online: https://lpi.worldbank.org/international/global (accessed on 17 July 2020).
- Eurostat. Main Tables. Available online: https://ec.europa.eu/eurostat/web/national-accounts/data/main-tables (accessed on 17 July 2020).
- EcoTransit. Calculation Parameters. Available online: https://www.ecotransit.org/calculation.en.html (accessed on 17 July 2020).
- Tadić, S.; Zečević, S.; Milenković, D. Problems regarding intermodal transport in the Danube Region. In Proceedings of the 4th International Conference on Traffic and Transport Engineering, ICTTE 2018, Belgrade, Serbia, 27–28 September 2018; City Net Scientific Research Center Ltd.: Belgrade, Serbia, 2018; pp. 483–489. [Google Scholar]
Figure 1.
Structure of the proposed hybrid multi-criteria decision-making (MCDM) model.

Figure 2.
Sensitivity analysis.


Table 1.
Grey scale for the evaluations.
| Linguistic Term | Abbreviation | Grey Scale |
|---|---|---|
| None | N | [0, 2] |
| Very low | VL | [1, 3] |
| Low | L | [2, 4] |
| Moderately low | ML | [3, 5] |
| Medium | M | [4, 6] |
| Moderately high | MH | [5, 7] |
| High | H | [6, 8] |
| Very high | VH | [7, 9] |
| Extremely high | EH | [8, 10] |
Table 2.
Criteria and sub-criteria for the evaluation of the potential dry port (DP) locations.
| Criteria | Sub-Criteria | Description |
|---|---|---|
| Environmental criteria (EN) | Energy consumption (C1) | The amount of energy required to realize the transport flows between ports and potential DP locations, as well as the total energy savings as a result of the DP terminal implementation. |
| Harmful emissions (C2) | The amount of harmful gasses, particles, and noise emission as a result of the transport flows realization between ports and potential DP locations, as well as the total emission reduction as a result of the DP terminal implementation. | |
| Traffic congestion (C3) | The degree of traffic congestion as a result of activating the DP location as well as the overall reduction of traffic congestion (primarily on roads) as a result of the DP terminal implementation. | |
| Traffic accidents (C4) | The risk of traffic accidents as a result of more intensive transport flows due to the activation of the DP location, as well as the overall reduction of accidents (primarily on roads) as a result of the DP terminal implementation. | |
| Economic criteria (EC) | Economic development (C5) | The economic development of the country in which the potential DP location is located, observed through the GDP, production indices, trade, state of the market, etc., as well as the impact of the DP terminal implementation on the economic growth. |
| Volume of flows (C6) | Potential volume of flows that the DP could attract at the designated location. | |
| Investment costs (C7) | Costs of activating a potential DP location that depend on the land price, costs of building and equipping the terminal, etc. | |
| Exploitation costs (C8) | The operating costs of the DP terminal, which largely depend on the labor price in the countries of potential locations, but also the price of energy, consumables, tax policy, utilities, etc. | |
| Transportation costs (C9) | Freight transport costs depending on the mode of transport, as well as the costs of establishing and maintaining lines in rail and inland waterway transport. | |
| Transport time (C10) | The time required for the realization of transport, depending on the mode of transport, established lines, quality of infrastructure, etc. | |
| Infrastructure criteria (IN) | Distances (C11) | Distances of potential DP locations from the ports they are supposed to serve on one side, and potential markets (primarily Central and Western European countries) on the other. |
| Transport infrastructure (C12) | The degree of development and condition of the transport infrastructure of all modes of transport used in connecting the ports, potential DP locations and markets. | |
| Multimodality (C13) | Possibility of using multiple transport modes in connecting the ports and potential DP locations, and especially in connecting the DP locations with the markets in Europe. | |
| Network status (C14) | Connection of potential DP locations with the TENec network, development of the logistics network in the surrounding area (presence of logistics centers, logistics providers, etc.), the possibility of achieving a significant status in the network. | |
| Information infrastructure (C15) | The development of information technologies in the surroundings of the potential location, application of newer generation networks, internet speed, etc. | |
| Socio-political criteria (SP) | Political stability (C16) | Stability of the political situation in the country where the potential DP location is situated, which includes corruption control, government efficiency, absence of violence, rule of law, freedom of speech, etc. |
| EU integration (C17) | Status of the country/region in which the potential DP location is located in relation to the EU (member, accession negotiations are underway, candidate, potential candidate). | |
| Strategies and planes (C18) | The development and implementation of development strategies and plans (economy, logistics and transport, etc.) at the national, regional, EU level. | |
| Regulation (C19) | Existence and the degree of application of laws in the field of logistics, transport, traffic, international trade, customs, finance, insurance, etc. | |
| Labor force (C20) | Employment rate and availability of labor force, primarily qualified experts in the field of logistics. |
Table 3.
Evaluation of the EN criteria by the stakeholders’ representatives.
| C1 | C2 | C3 | C4 | |||||||||
|---|---|---|---|---|---|---|---|---|---|---|---|---|
| Inv. | Use. | A&R | Inv. | Use. | A&R | Inv. | Use. | A&R | Inv. | Use. | A&R | |
| C1 | / | / | / | M | VL | VL | ||||||
| C2 | S | / | / | / | VL | L | ||||||
| C3 | VL | L | ML | MH | ML | / | / | / | L | VL | VL | |
| C4 | VL | L | ML | L | / | / | / | |||||
Inv.—investors/owners and operators, Use.—users, A&R—government/administration and residents.
Table 4.
Criteria and sub-criteria weights.
| Criterion | Weight | Sub-Criterion | Weight | Final Weight |
|---|---|---|---|---|
| EN | 0.230 | C1 | 0.088 | 0.020 |
| C2 | 0.048 | 0.011 | ||
| C3 | 0.663 | 0.153 | ||
| C4 | 0.201 | 0.046 | ||
| EC | 0.427 | C5 | 0.204 | 0.087 |
| C6 | 0.491 | 0.210 | ||
| C7 | 0.111 | 0.047 | ||
| C8 | 0.056 | 0.024 | ||
| C9 | 0.111 | 0.047 | ||
| C10 | 0.028 | 0.012 | ||
| IN | 0.197 | C11 | 0.013 | 0.003 |
| C12 | 0.131 | 0.026 | ||
| C13 | 0.585 | 0.115 | ||
| C14 | 0.237 | 0.047 | ||
| C15 | 0.033 | 0.007 | ||
| SP | 0.145 | C16 | 0.564 | 0.082 |
| C17 | 0.017 | 0.002 | ||
| C18 | 0.096 | 0.014 | ||
| C19 | 0.288 | 0.042 | ||
| C20 | 0.035 | 0.005 |
Table 5.
Evaluations of the alternatives in relation to the sub-criteria.
| PL1 (Ljubljana) | PL2 (Zagreb) | PL3 (Belgrade) | PL4 (Sarajevo) | PL5 (Podgorica) | PL6 (Skopje) | PL7 (Tirana) | |
|---|---|---|---|---|---|---|---|
| C1 | VH | EH | H | MH | M | VL | ML |
| C2 | VH | EH | M | MH | H | VL | ML |
| C3 | M | ML | L | MH | EH | H | VH |
| C4 | ML | ML | MH | EH | H | M | VH |
| C5 | EH | VH | H | M | MH | ML | L |
| C6 | VH | EH | H | MH | M | ML | L |
| C7 | ML | H | EH | H | MH | VH | H |
| C8 | L | ML | MH | EH | MH | VH | H |
| C9 | VH | EH | EH | H | MH | ML | M |
| C10 | MH | H | EH | VH | M | ML | L |
| C11 | H | EH | VH | M | L | N | VL |
| C12 | EH | VH | H | MH | M | MH | ML |
| C13 | M | MH | EH | M | ML | ML | ML |
| C14 | EH | VH | H | L | N | M | VL |
| C15 | EH | VH | VH | H | MH | M | ML |
| C16 | EH | VH | ML | L | H | M | MH |
| C17 | EH | EH | VH | MH | VH | H | H |
| C18 | EH | H | H | MH | MH | ML | ML |
| C19 | EH | VH | H | M | MH | ML | L |
| C20 | VH | VH | EH | MH | M | ML | L |
Table 6.
Grey matrix of relative values of the alternatives.
| PL1 | PL2 | PL3 | PL4 | PL5 | PL6 | PL7 | |
|---|---|---|---|---|---|---|---|
| PL1 | [–1.1, 1.1] | [–3.2, 5.4] | [–1.3, 0.9] | [–5.6, 2.8] | [–5.3, 2.9] | [–6.5, 0.8] | [–5.6, 1] |
| PL2 | [–5.4, 3.2] | [–1, 1] | [–6.1, 2.9] | [–6.9, 1.8] | [–6.5, 2] | [–7.8, –0.1] | [–6.9, 0.1] |
| PL3 | [–0.9, 1.3] | [–2.9, 6.1] | [–1.1, 1.1] | [–1.2, 0.9] | [–1, 0.9] | [–6.2, 1.5] | [–5.2, 1.7] |
| PL4 | [–2.8, 5.6] | [–1.8, 6.9] | [–0.9, 1.2] | [–0.9, 0.9] | [–0.8, 1] | [–5.2, 2.3] | [–4.2, 2.5] |
| PL5 | [–2.9, 5.3] | [–2, 6.5] | [–0.9, 1] | [–1, 0.8] | [–0.8, 0.8] | [–5.3, 1.9] | [–4.4, 2.1] |
| PL6 | [–0.8, 6.5] | [0.1, 7.8] | [–1.5, 6.2] | [–2.3, 5.2] | [–1.9, 5.3] | [–0.9, 0.9] | [–0.6, 1] |
| PL7 | [–1, 5.6] | [–0.1, 6.9] | [–1.7, 5.2] | [–2.5, 4.2] | [–2.1, 4.4] | [–1, 0.6] | [–0.7, 0.7] |
Table 7.
Grey Possibility Degree (GPD) values of the alternatives’ comparisons and the final ranking.
Table 7.
Grey Possibility Degree (GPD) values of the alternatives’ comparisons and the final ranking.
| GPD (PLk ≤ PLk) | PL1 | PL2 | PL3 | PL4 | PL5 | PL6 | PL7 | Rank |
|---|---|---|---|---|---|---|---|---|
| PL1 | / | 0.583 | 0.443 | 0.391 | 0.407 | 0.271 | 0.3 | 2 |
| PL2 | 0.417 | / | 0.353 | 0.311 | 0.324 | 0.205 | 0.228 | 1 |
| PL3 | 0.557 | 0.647 | / | 0.435 | 0.454 | 0.294 | 0.329 | 3 |
| PL4 | 0.609 | 0.689 | 0.565 | / | 0.519 | 0.365 | 0.401 | 5 |
| PL5 | 0.593 | 0.676 | 0.546 | 0.481 | / | 0.345 | 0.381 | 4 |
| PL6 | 0.729 | 0.795 | 0.706 | 0.635 | 0.655 | / | 0.541 | 7 |
| PL7 | 0.7 | 0.772 | 0.671 | 0.599 | 0.619 | 0.459 | / | 6 |
Table 8.
Sensitivity analysis.
| Basic | Sc.1 | Sc.2 | Sc.3 | Sc.4 | Sc.5 | Sc.6 | |
|---|---|---|---|---|---|---|---|
| PL1 | 2 | 2 | 1 | 2 | 2 | 2 | 2 |
| PL2 | 1 | 1 | 3 | 1 | 1 | 1 | 1 |
| PL3 | 3 | 3 | 4 | 3 | 4 | 3 | 3 |
| PL4 | 5 | 4 | 7 | 4 | 5 | 5 | 5 |
| PL5 | 4 | 5 | 2 | 5 | 3 | 4 | 4 |
| PL6 | 7 | 6 | 6 | 6 | 7 | 7 | 7 |
| PL7 | 6 | 7 | 5 | 7 | 6 | 6 | 6 |
© 2020 by the authors. Licensee MDPI, Basel, Switzerland. This article is an open access article distributed under the terms and conditions of the Creative Commons Attribution (CC BY) license (http://creativecommons.org/licenses/by/4.0/).
Share and Cite
MDPI and ACS Style
Tadić, S.; Krstić, M.; Roso, V.; Brnjac, N. Dry Port Terminal Location Selection by Applying the Hybrid Grey MCDM Model. Sustainability 2020, 12, 6983. https://0-doi-org.brum.beds.ac.uk/10.3390/su12176983
AMA Style
Tadić S, Krstić M, Roso V, Brnjac N. Dry Port Terminal Location Selection by Applying the Hybrid Grey MCDM Model. Sustainability. 2020; 12(17):6983. https://0-doi-org.brum.beds.ac.uk/10.3390/su12176983
Chicago/Turabian StyleTadić, Snežana, Mladen Krstić, Violeta Roso, and Nikolina Brnjac. 2020. "Dry Port Terminal Location Selection by Applying the Hybrid Grey MCDM Model" Sustainability 12, no. 17: 6983. https://0-doi-org.brum.beds.ac.uk/10.3390/su12176983
Note that from the first issue of 2016, this journal uses article numbers instead of page numbers. See further details here.