The Mineral Fertilizer-Dependent Chemical Parameters of Soil Acidification under Field Conditions

 ,
,
Abstract
:1. Introduction
2. Materials and Methods
2.1. Site Description and Experimental Design
2.2. Soil Sampling and Analysis
2.3. Statistical Analysis
3. Results and Discussion
4. Conclusions
Author Contributions
Funding
Conflicts of Interest
References
- Bolan, N.S.; Adriano, D.C.; Curtin, D. Soil acidification and liming interactions with nutrient and heavy metal transformation and bioavailability. Adv. Agron. 2003, 78, 215–272. [Google Scholar]
- Bolan, N.S.; Adriano, D.C.; Curtin, D. Acidity. In Encyclopedia of Soils in the Environment; Hillel, D., Ed.; Academic Press: Cambridge, MA, USA, 2004; pp. 11–17. [Google Scholar]
- Filipek, T.; Badora, A.; Lipiński, W.; Brodowska, M.S.; Domańska, J.; Harasim, P.; Kozłowska-Strawska, J.; Skowron, P.; Skowrońska, M.; Tkaczyk, P. Acidification and Liming of Soils; FAPA: Warsaw, Poland, 2015; p. 236. (In Polish) [Google Scholar]
- Goulding, K.W.T. Soil acidification and the importance of liming agricultural soils with particular reference to the United Kingdom. Soil Use Manag. 2016, 32, 390–399. [Google Scholar] [CrossRef] [PubMed]
- Hao, T.; Zhu, Q.; Zeng, M.; Shen, J.; Shi, X.; Liu, X.; Zhang, F.; de Vries, W. Impacts of nitrogen fertilizer type and application rate on soil acidification rate under a wheat-maize double cropping system. J. Environ. Manag. 2020, 270, 110888. [Google Scholar] [CrossRef] [PubMed]
- Kunhikrishnan, A.; Thangarajan, R.; Bolan, N.; Xu, Y.; Mandal, S.; Gleeson, D.; Seshadri, B.; Zaman, M.; Barton, L.; Tang, C.; et al. Functional relationships of soil acidification, liming, and greenhouse gas flux. In Advances in Agronomy; Sparks, D.L., Ed.; Elsevier Inc.: Amsterdam, The Netherlands, 2016; pp. 1–71. [Google Scholar]
- Verma, P.; Sagar, R. Effect of nitrogen (N) deposition on soil-N processes: A holistic approach. Sci. Rep. 2020, 10, 10470. [Google Scholar] [CrossRef] [PubMed]
- Abdulaha-Al Baquy, M.; Li, J.; Shi, R.; Kamran, M.A.; Xu, R. Higher cation exchange capacity determined lower critical soil pH and higher Al concentration for soybean. Environ. Sci. Pollut. Res. 2018, 25, 6980–6989. [Google Scholar] [CrossRef]
- Cai, Z.; Wang, B.; Xu, M.; Zhang, H.; He, X.; Zhang, L.; Gao, S. Intensified soil acidification from chemical N fertilization and prevention by manure in an 18-year field experiment in the red soil of southern China. J. Soils Sediments 2015, 15, 260–270. [Google Scholar] [CrossRef]
- Zhang, Y.; de Vries, W.; Thomas, B.W.; Hao, X.; Shi, X. Impacts of long-term nitrogen fertilization on acid buffering rates and mechanisms of a slightly calcareous clay soil. Geoderma 2017, 305, 92–99. [Google Scholar] [CrossRef]
- Piesse, M. Global Food and Water Security in 2050: Demographic Change and Increased Demand. Strategic Analysis Paper. 4 February 2020; Future Directions International Pty Ltd.: Nedlands, Australia, 2020; p. 6. [Google Scholar]
- Skowrońska, M.; Filipek, T. Life cycle assessment of fertilizers: A review. Int. Agrophys. 2014, 28, 101–110. [Google Scholar] [CrossRef]
- Thangavel, P.; Sridevi, G. Soil Security: A Key Role for Sustainable Food Productivity. In Sustainable Agriculture towards Food Security; Dhanarajan, A., Ed.; Springer: Singapore, 2017. [Google Scholar]
- Tian, D.; Niu, S. A global analysis of soil acidification caused by nitrogen addition. Environ. Res. Lett. 2015, 10, 024019. [Google Scholar] [CrossRef]
- Zhou, J.; Xia, F.; Liu, X.; He, Y.; Xu, J.; Brookes, P.C. Effects of nitrogen fertilizer on the acidification of two typical acid soils in South China. J. Soils Sediments 2014, 14, 415–422. [Google Scholar] [CrossRef]
- Lucas, R.W.; Klaminder, J.; Futter, M.N.; Bishop, K.H.; Egnell, G.; Laudon, H.; Högberg, P. A meta-analysis of the effects of nitrogen additions on base cations: Implications for plants, soils, and streams. For. Ecol. Manag. 2011, 262, 95–104. [Google Scholar] [CrossRef]
- ISO 10381-1:2002. Soil Quality—Sampling—Part 1: Guidance on the Design of Sampling Programs; International Organization for Standardization: Geneva, Switzerland, 2002. [Google Scholar]
- ISO 10390:2005. Soil Quality—Determination of pH; International Organization for Standardization: Geneva, Switzerland, 2005. [Google Scholar]
- Soil Survey Laboratory Methods Manual. Soil Survey Investigation Report; United States Department of Agriculture, Natural Resources Conservation Service, National Soil Survey Center: Washington, DC, USA, 1996; p. 42. [Google Scholar]
- Messiga, A.J.; Ziadi, N.; Belanger, G.; Morel, C. Soil Nutrients and Other Major Properties in Grassland Fertilized with Nitrogen and Phosphorus. Soil Sci. Soc. Am. J. 2013, 77, 643–652. [Google Scholar] [CrossRef]
- Stroia, C.; Morel, C.; Jouany, C. Nitrogen fertilization effects on grassland soil acidification: Consequences on diffusive phosphorus ions. Soil Sci. Soc. Am. J. 2011, 75, 112–120. [Google Scholar] [CrossRef]
- Liu, X.; Shi, H.; Bai, Z.; Liu, X.; Yang, B.; Yan, D. Assessing Soil Acidification of Croplands in the Poyang Lake Basin of China from 2012 to 2018. Sustainability 2020, 12, 3072. [Google Scholar] [CrossRef]
- Zeng, M.; De Vries, W.; Bonten, L.T.C.; Zhu, Q.; Hao, T.; Liu, H.; Xu, M.; Shi, X.; Zhang, F.; Shen, J. Model-based analysis of the long-term effects of fertilization management on cropland soil acidification. Environ. Sci. Technol. 2017, 51, 3843–3851. [Google Scholar] [CrossRef] [PubMed]
- Cai, Z.; Wang, B.; Xum, M.; Zhang, H.; Zhang, L.; Gao, S. Nitrification and acidification from urea application in red soil (Ferralic Cambisol) after different long-term fertilization treatments. J. Soils Sediments 2014, 14, 1526–1536. [Google Scholar] [CrossRef]
- Hojito, M. Productivity of acidified grassland caused by acidic nitrogen fertilizer and aluminum tolerance of grasses and legumes. JARQ 1998, 32, 87–96. [Google Scholar]
- Yang, X.-D.; Ni, K.; Shi, Y.-Z.; Yi, X.-Y.; Zhang, Q.-F.; Fang, L.; Ma, L.-F.; Ruan, J. Effects of long-term nitrogen application on soil acidification and solution chemistry of a tea plantation in China. Agric. Ecosyst. Environ. 2018, 252, 74–82. [Google Scholar] [CrossRef]
- Šimanský, V.; Jonczak, J. Sorption capacity of sandy soil under long-term fertilisation. Agriculture 2019, 65, 164–171. [Google Scholar] [CrossRef] [Green Version]
- Blaser, P.; Walthert, L.; Zimmermann, S.; Graf Pannatier, E.; Luster, J. Classification schemes for the acidity, base saturation, and acidification status of forest soils in Switzerland. J. Plant Nutr. Soil Sci. 2008, 171, 163–170. [Google Scholar] [CrossRef]
- Xu, D.; Carswell, A.; Zhu, Q.; Zhang, F.; de Vries, W. Modelling long-term impacts of fertilization and liming on soil acidification at Rothamsted experimental station. Sci. Total Environ. 2020, 713, 136249. [Google Scholar] [CrossRef] [PubMed]
- Schroder, J.L.; Zhang, H.; Girma, K.; Raun, W.R.; Penn, C.J.; Payton, M.E. Soil acidification from long-term use of nitrogen fertilizers on winter wheat. Soil Sci. Soc. Am. J. 2011, 75, 957–964. [Google Scholar] [CrossRef]
- Cai, J.; Luo, W.; Liu, H.; Feng, X.; Zhang, Y.; Wang, R.; Xu, Z.; Zhang, Y.; Jiang, Y. Precipitation-mediated responses of soil acid buffering capacity to long-term nitrogen addition in a semi-arid grassland. Atmos. Environ. 2017, 17, 312–318. [Google Scholar] [CrossRef]
- Reeves, J.L.; Liebig, M.A. Soil pH and exchangeable cation responses to tillage and fertilizer in dryland cropping systems. Commun. Soil Sci. Plant Anal. 2016, 47, 2396–2404. [Google Scholar] [CrossRef]
- Šimanský, V.; Lukáč, C. Soil structure after 18 years of long-term different tillage systems and fertilisation in Haplic Luvisol. Soil Water Res. 2018, 13, 140–149. [Google Scholar]
- Šimanský, V.; Kováčik, P.; Jonczak, J. The effect of different doses of N fertilization on the parameters of soil organic matter and soil sorption complex. J. Ecol. Eng. 2017, 18, 104–111. [Google Scholar] [CrossRef] [Green Version]


| Fertilization | P1 | P2 | P3 | Mean N | ||||||
|---|---|---|---|---|---|---|---|---|---|---|
| K1 | K2 | K3 | K1 | K2 | K3 | K1 | K2 | K3 | ||
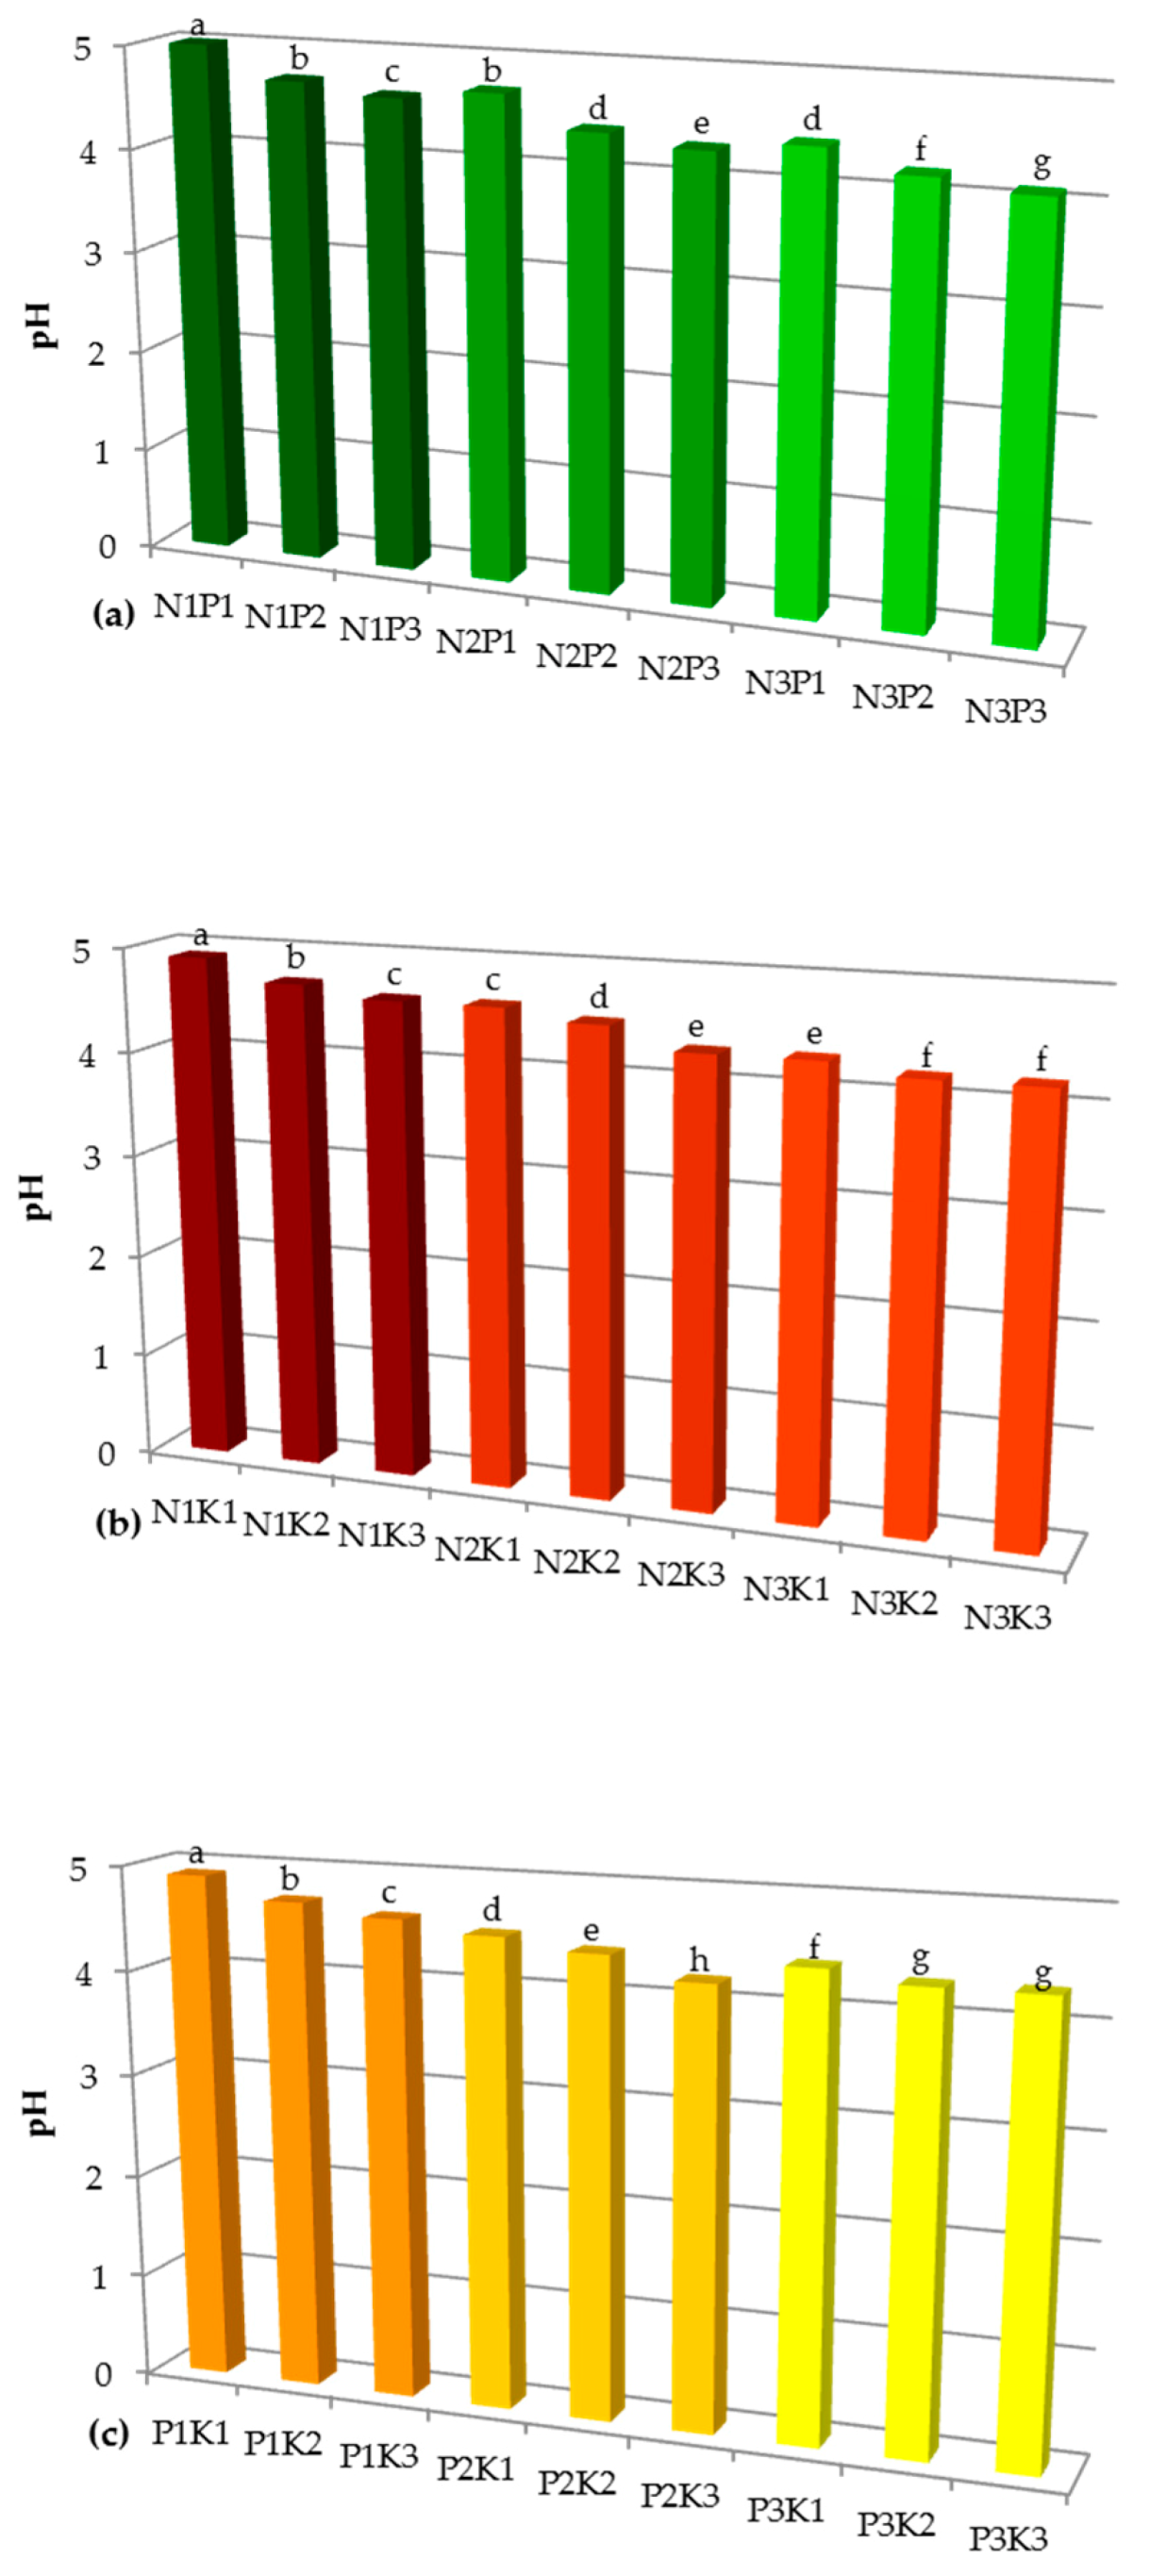
| pH | ||||||||||
| N1 | 5.3 a * | 4.9 b,c | 4.8 c,d | 4.7 d,e | 4.7 d,e | 4.5 f,g | 4.7 d,e | 4.6 e,f | 4.4 g,h | 4.7 a |
| N2 | 4.9 b,c * | 4.8 c,d * | 4.6 e,f * | 4.5 f,g | 4.4 g,h | 4.1 i | 4.4 g,h | 4.3 h | 4.3 h | 4.5 b |
| N3 | 4.5 f,g * | 4.4 g,h * | 4.4 g,h | 4.3 h | 4.1 i * | 4.1 i | 4.1 i | 4.1 i | 4.1 i | 4.2 c |
| Mean P | 4.7 a | 4.4 b | 4.3 c | |||||||
| Mean K | 4.6 a | 4.5 b | 4.4 c | |||||||
| Fertilization | P1 | P2 | P3 | Mean N | ||||||
|---|---|---|---|---|---|---|---|---|---|---|
| K1 | K2 | K3 | K1 | K2 | K3 | K1 | K2 | K3 | ||
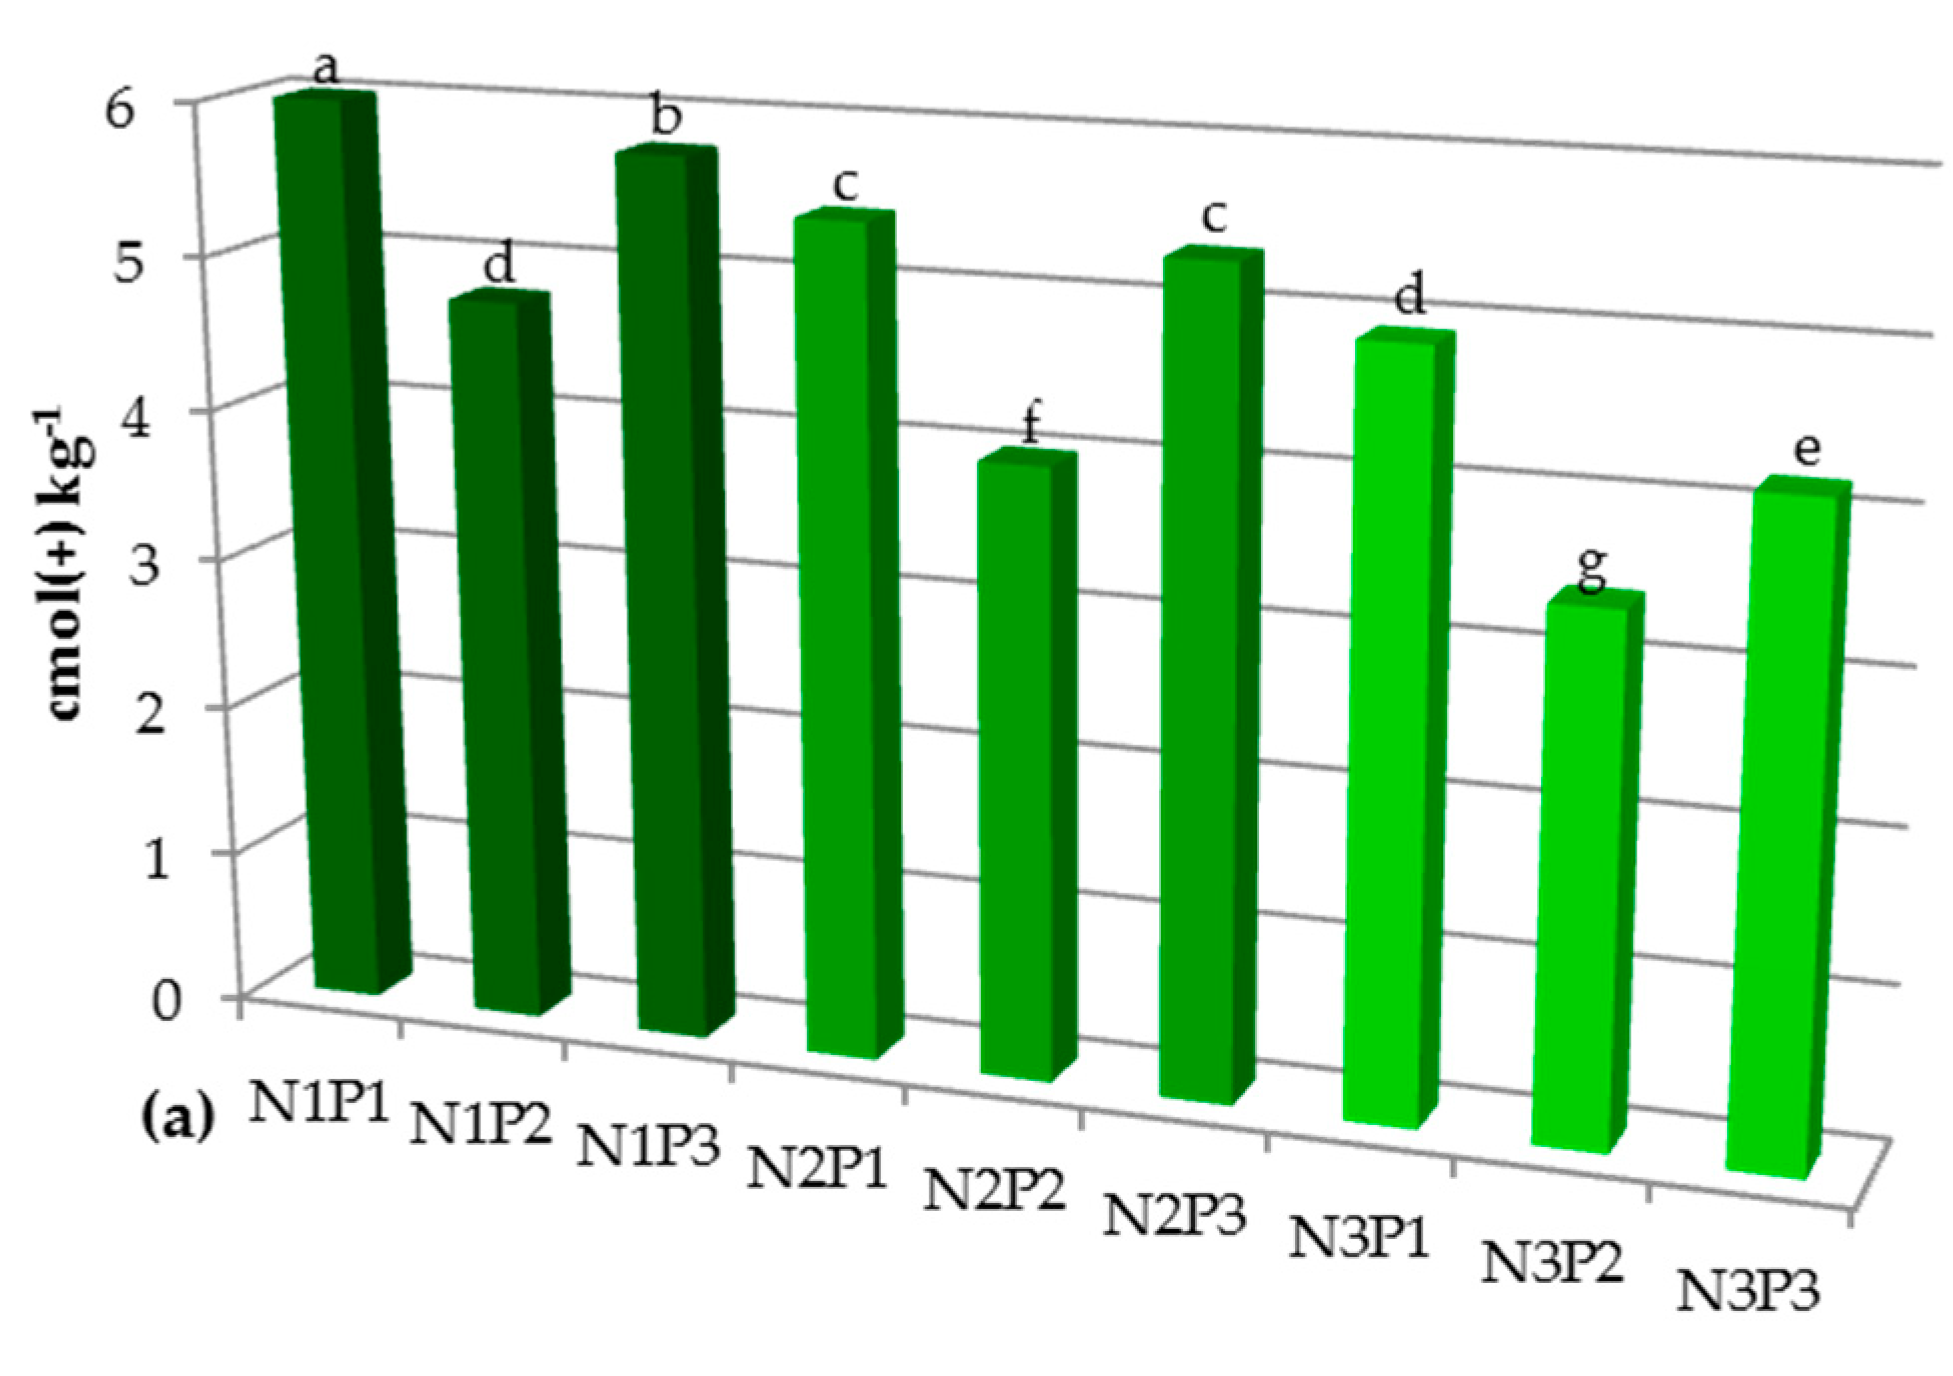
| cmol(+) kg−1 | ||||||||||
| N1 | 2.23 n * | 2.70 m | 2.69 m | 3.28 j,k | 3.11 k,l | 3.72 g,h | 3.27 j,k | 3.41 I,j | 3.63 n,i | 3.12 b |
| N2 | 2.89l m | 3.08 k,l | 3.51 n,I,j | 3.93 f,g | 4.25 d,e | 5.07 b | 3.91 f,g | 4.12 e,f | 4.45 c,d | 3.91 a |
| N3 | 3.60 n,i | 4.24 d,e | 4.23 d,e | 4.49 c,d | 4.27 d,e | 4.65 c | 5.11 a,b | 5.37 a | 4.99 b | 4.55 a |
| Mean P | 3.24 b | 4.08 a | 4.25 a | |||||||
| Mean K | 3.63 c | 3.84 b | 4.10 a | |||||||
| Saturation of Acid Cations [%] | ||||||||||
| N1 | 26.1 | 28.4 | 31.2 | 40.4 | 36.5 | 47.8 | 34.1 | 37.4 | 40.8 | 35.7 |
| N2 | 32.1 | 37.5 | 41.1 | 45.8 | 52.1 | 59.9 | 41.6 | 43.1 | 47.5 | 44.3 |
| N3 | 39.1 | 49.5 | 46.9 | 52.1 | 59.5 | 59.2 | 55.1 | 56.5 | 54.5 | 52.2 |
| Mean P | 36.9 | 50.4 | 45.6 | |||||||
| Mean K | 40.7 | 40.2 | 47.7 | |||||||
| Fertilization | P1 | P2 | P3 | Mean N | ||||||
|---|---|---|---|---|---|---|---|---|---|---|
| K1 | K2 | K3 | K1 | K2 | K3 | K1 | K2 | K3 | ||
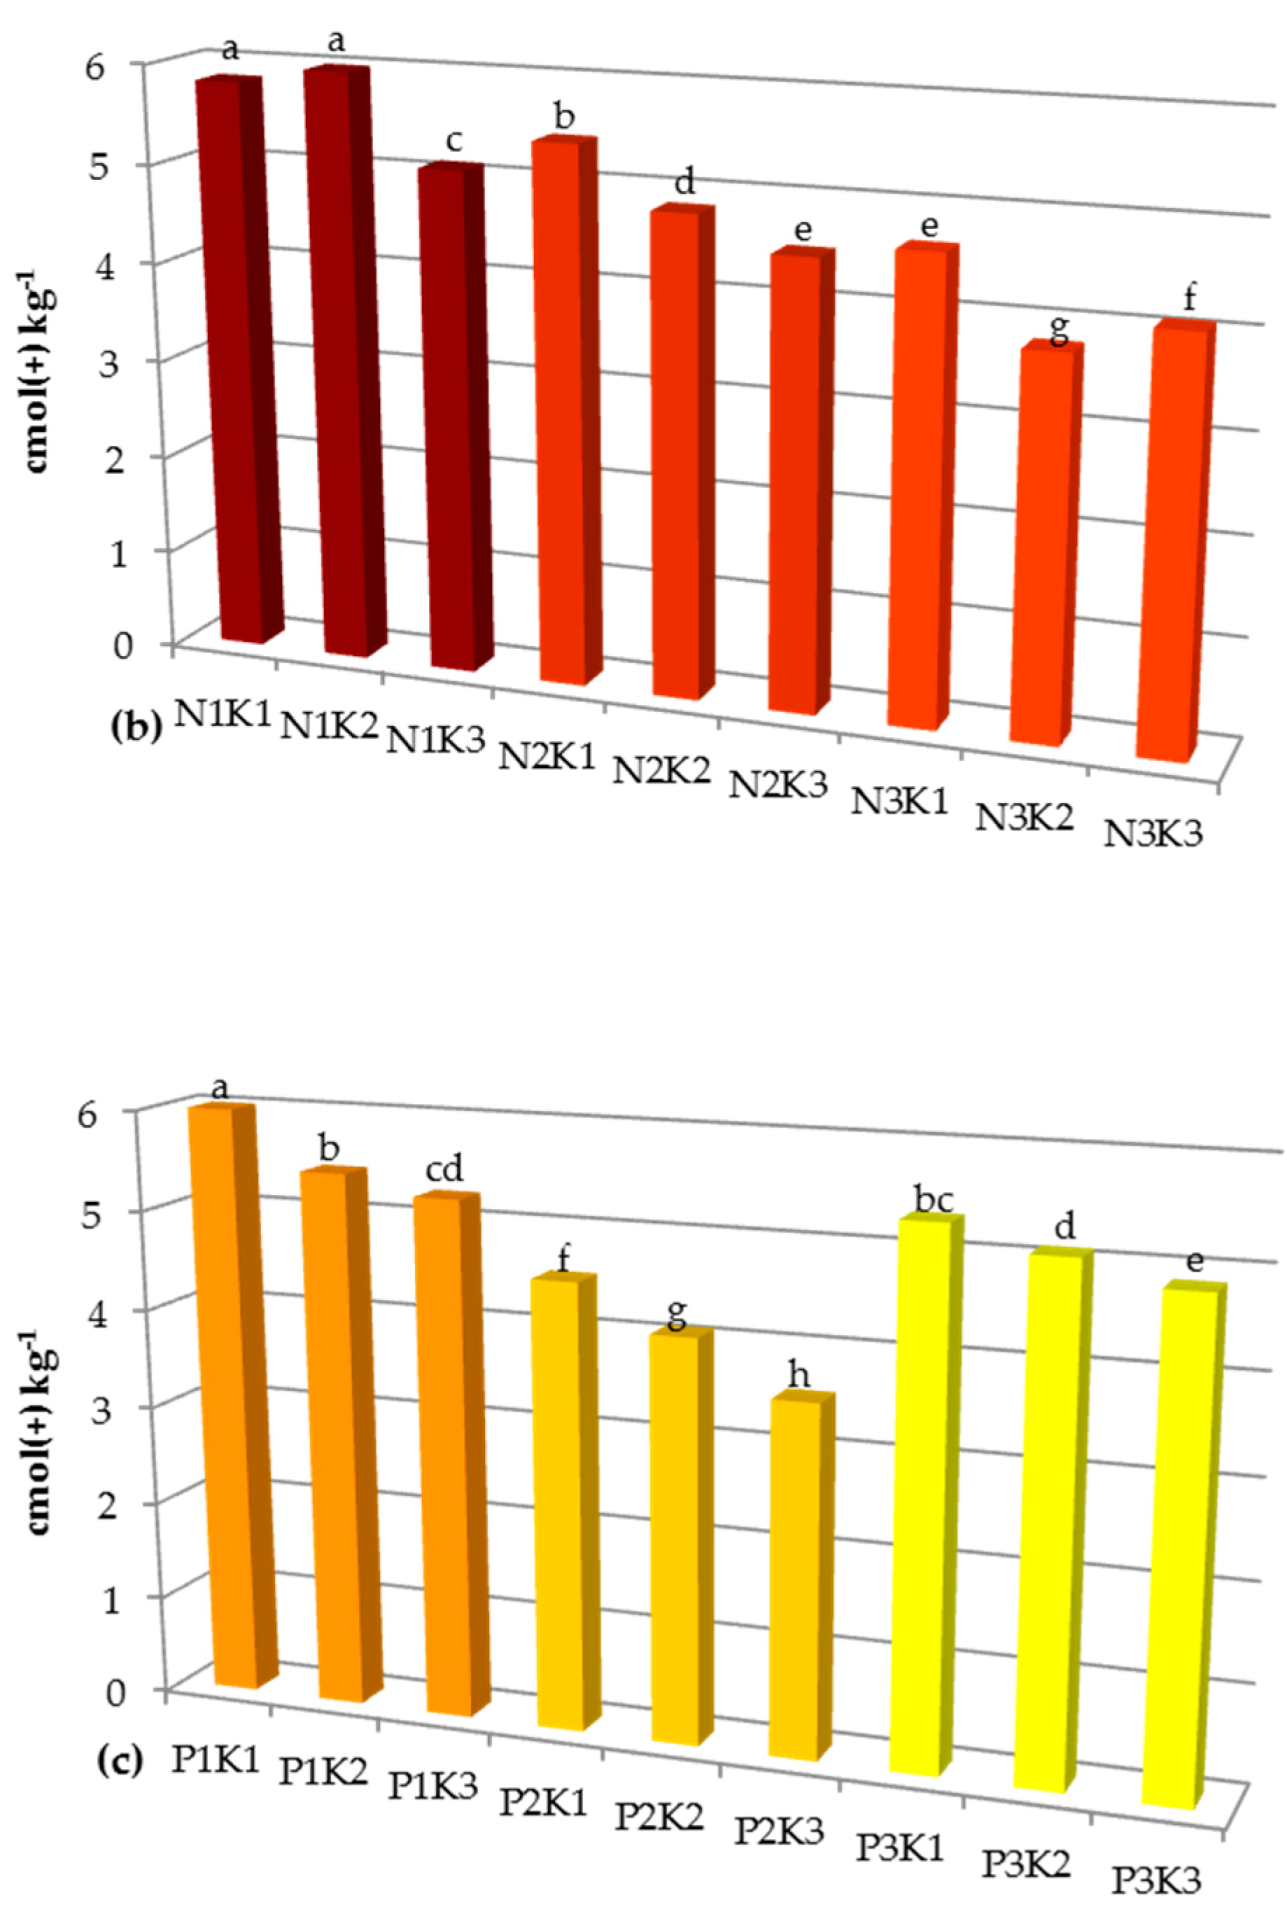
| cmol(+) kg−1 | ||||||||||
| N1 | 6.31 a,b * | 6.82 a | 5.94 b,c,d | 4.83 I,j,k | 5.42 e,f,g | 4.06 m,n | 6.33 a | 5.71 c,d,e | 5.26 f,g,h,i | 5.63 a |
| N2 | 6.12 a,b,c | 5.13 g,h,I,j | 5.02 h,I,j | 4.66 k,l | 3.91 n | 3.39 o,p | 5.49 e,f,g | 5.44 e,f,g | 4.92 i,j,k | 4.92 b |
| N3 | 5.60 d,e,f | 4.33 l,m | 4.79 j,k | 4.12 m,n | 2.91 r | 3.20 p,r | 4.17 m,n | 4.14 m,n | 4.17 m,n | 4.17 c |
| Mean P | 5.56 a | 4.05 c | 5.09 b | |||||||
| Mean K | 5.29 a | 4.87 b | 4.55 c | |||||||
| Base Saturation [%] | ||||||||||
| N1 | 73.9 | 71.6 | 68.8 | 59.6 | 63.5 | 52.2 | 65.9 | 62.6 | 59.2 | 64.3 |
| N2 | 67.9 | 62.5 | 58.9 | 54.2 | 47.9 | 40.1 | 58.4 | 56.9 | 52.5 | 55.7 |
| N3 | 60.9 | 50.5 | 53.1 | 47.9 | 40.5 | 40.8 | 44.9 | 43.5 | 45.5 | 47.8 |
| Mean P | 63.1 | 49.6 | 54.4 | |||||||
| Mean K | 59.3 | 59.8 | 52.3 | |||||||
| Fertilization | P1 | P2 | P3 | Mean N | ||||||
|---|---|---|---|---|---|---|---|---|---|---|
| K1 | K2 | K3 | K1 | K2 | K3 | K1 | K2 | K3 | ||
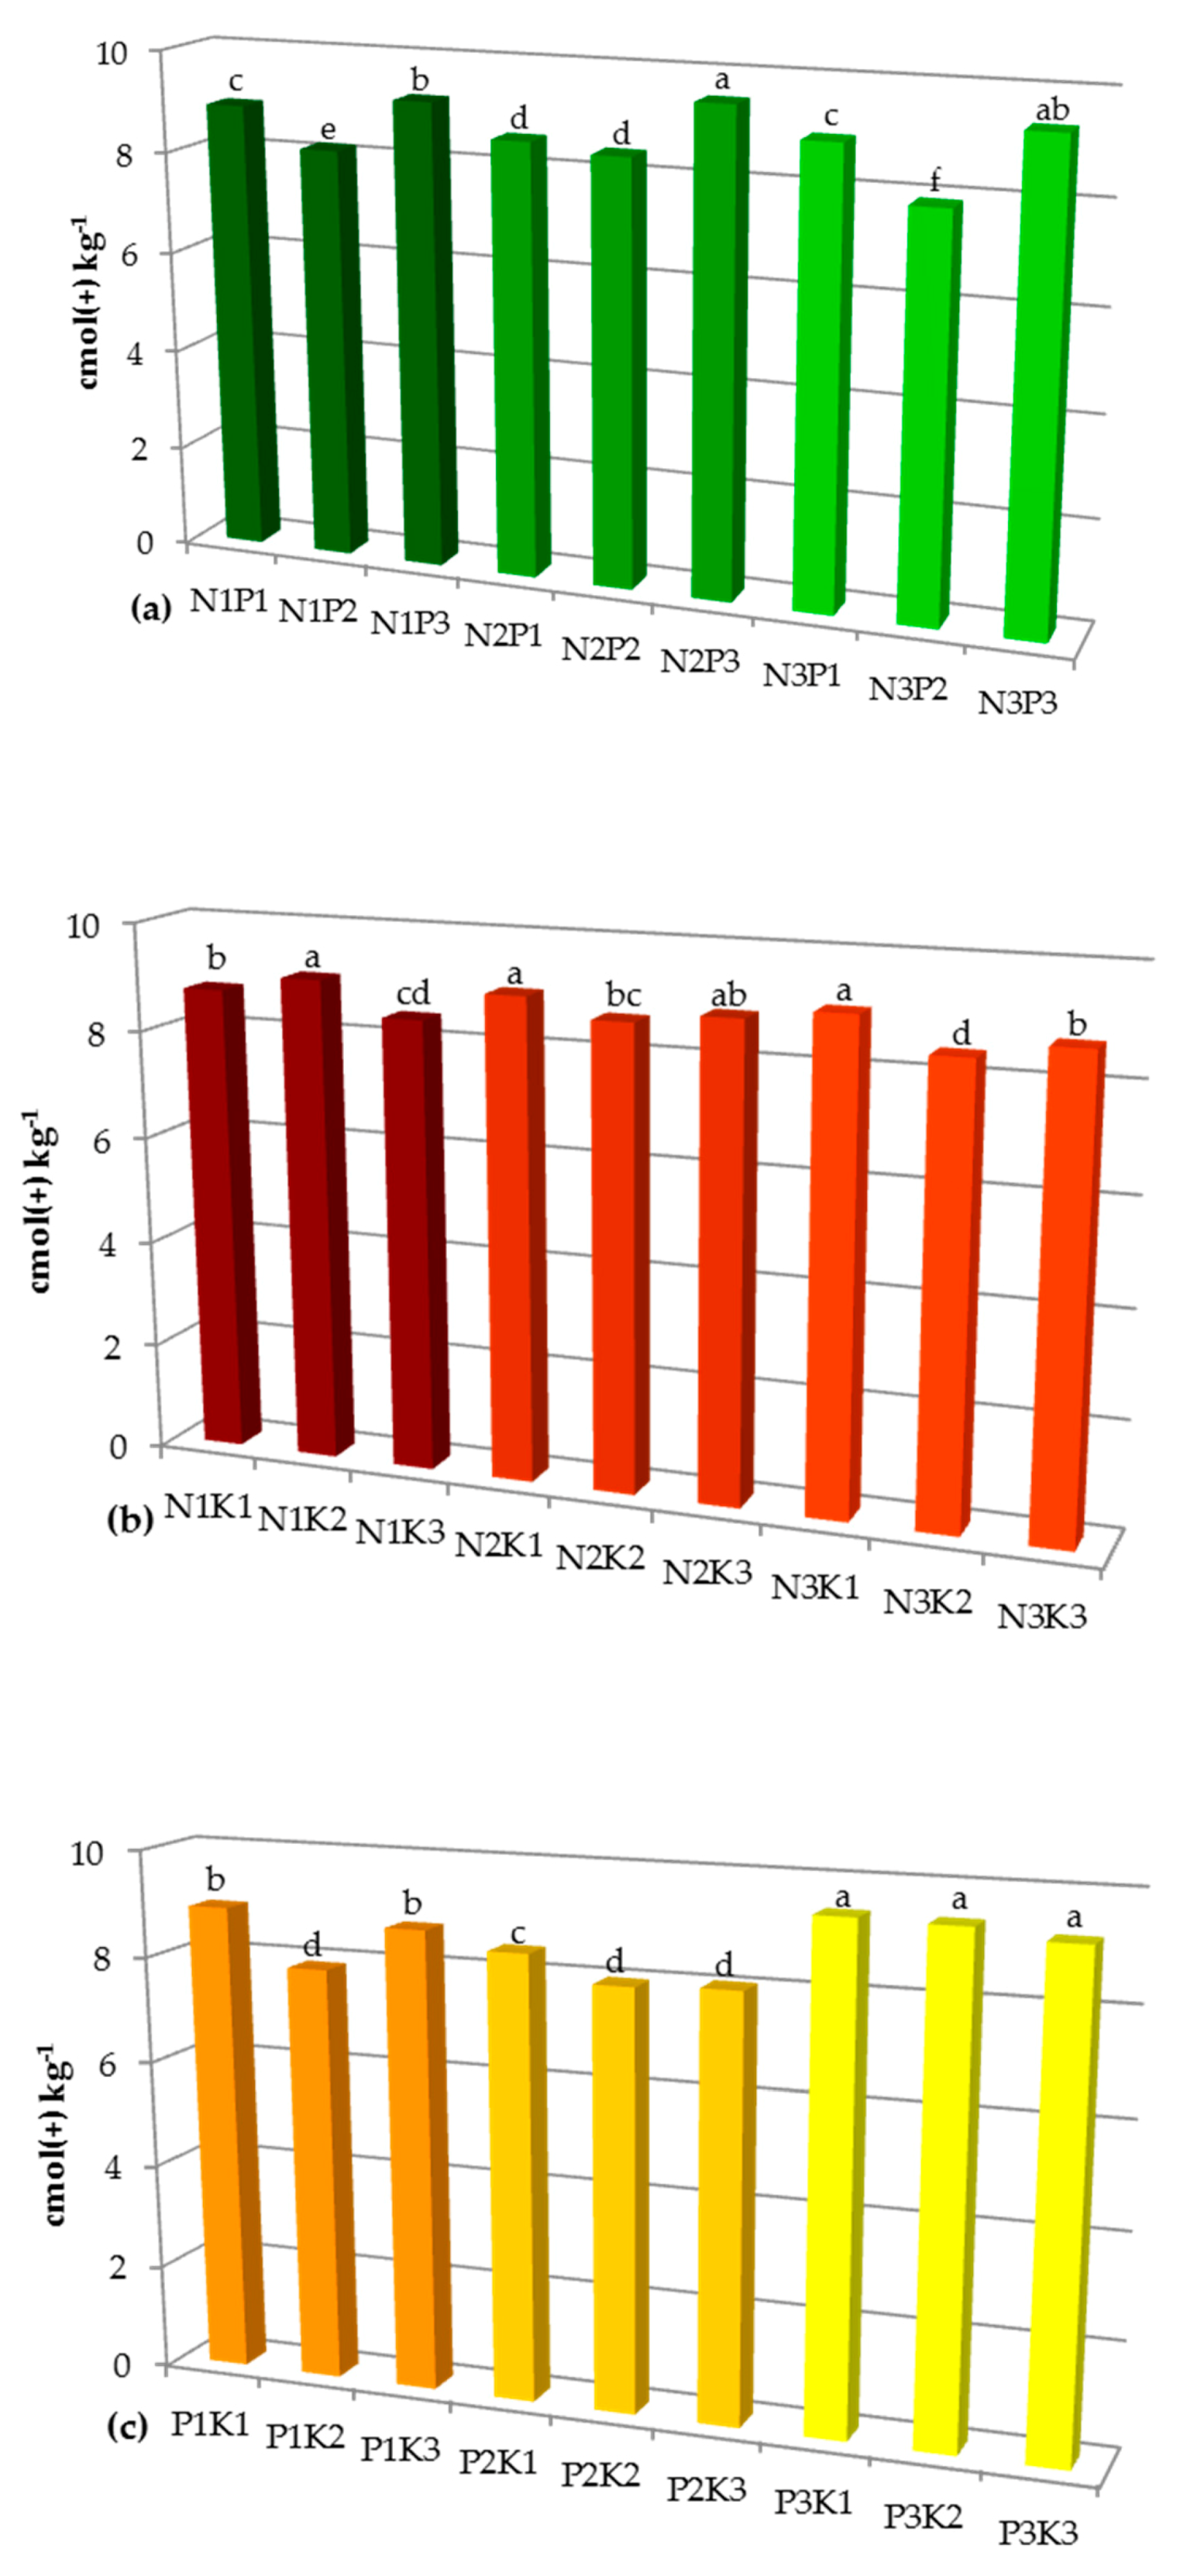
| cmol(+) kg−1 | ||||||||||
| N1 | 8.54 f,g,h,i * | 9.52 a,b | 8.63 e,f,g | 8.11 i,j,k | 8.53 f,g,h,i | 7.78 k | 9.60 a | 9.12 b,c,d | 8.89 d,e,f,g | 8.75 a,b |
| N2 | 9.01 c,d,e | 8.21 h,I,j,k | 8.53 f,g,h,i | 8.59 e,f,g,h | 8.16 h,I,j,k | 8.46 g,i | 9.40 a,b,c,d | 9.56 a,b | 9.37 a,b,c,d | 8.83 a |
| N3 | 9.20 a,b,c,d | 8.57 e,f,g,h | 9.02 c,d,e | 8.61 e,f,g,h | 7.18 l | 7.85 j,k | 9.28 a,b,c,d | 9.51 a,b | 9.16 a,b,c,d | 8.72 b |
| Mean P | 8.80 b | 8.14 c | 9.32 a | |||||||
| Mean K | 8.92 a | 8.71 b | 8.63 b | |||||||
© 2020 by the authors. Licensee MDPI, Basel, Switzerland. This article is an open access article distributed under the terms and conditions of the Creative Commons Attribution (CC BY) license (http://creativecommons.org/licenses/by/4.0/).
Share and Cite
Tkaczyk, P.; Mocek-Płóciniak, A.; Skowrońska, M.; Bednarek, W.; Kuśmierz, S.; Zawierucha, E. The Mineral Fertilizer-Dependent Chemical Parameters of Soil Acidification under Field Conditions. Sustainability 2020, 12, 7165. https://0-doi-org.brum.beds.ac.uk/10.3390/su12177165
Tkaczyk P, Mocek-Płóciniak A, Skowrońska M, Bednarek W, Kuśmierz S, Zawierucha E. The Mineral Fertilizer-Dependent Chemical Parameters of Soil Acidification under Field Conditions. Sustainability. 2020; 12(17):7165. https://0-doi-org.brum.beds.ac.uk/10.3390/su12177165
Chicago/Turabian StyleTkaczyk, Przemysław, Agnieszka Mocek-Płóciniak, Monika Skowrońska, Wiesław Bednarek, Sebastian Kuśmierz, and Elżbieta Zawierucha. 2020. "The Mineral Fertilizer-Dependent Chemical Parameters of Soil Acidification under Field Conditions" Sustainability 12, no. 17: 7165. https://0-doi-org.brum.beds.ac.uk/10.3390/su12177165