Article

Drainage N Loads Under Climate Change with Winter Rye Cover Crop in a Northern Mississippi River Basin Corn-Soybean Rotation

1
USDA-ARS, National Laboratory for Agriculture and the Environment, Ames, IA 50011, USA
2
USDA-ARS, Grazing lands Research Laboratory, El Reno, OK 73036, USA
3
Department of Ag & Biosystems Engineering, Iowa State University, Ames, IA 50011, USA
4
Institute of Soil and Water Conservation, Chinese Academy of Sciences, Yangling 712100, China
5
Department of Civil and Environmental Engineering, Princeton University, Princeton, NJ 08544, USA
6
USDA-ARS, Rangeland Resources and Systems Research Unit, Fort Collins, CO 80526, USA
7
Department of Bioresource Engineering, McGill University, Sainte-Anne-de-Bellevue, QC H9X 3V9, Canada
8
Department of Statistics, Iowa State University, Ames, IA 50011, USA
*
Author to whom correspondence should be addressed.
Sustainability 2020, 12(18), 7630; https://0-doi-org.brum.beds.ac.uk/10.3390/su12187630
Submission received: 26 August 2020 / Revised: 9 September 2020 / Accepted: 11 September 2020 / Published: 16 September 2020

Abstract

:
To help reduce future N loads entering the Gulf of Mexico from the Mississippi River 45%, Iowa set the goal of reducing non-point source N loads 41%. Studies show that implementing winter rye cover crops into agricultural systems reduces N loads from subsurface drainage, but its effectiveness in the Mississippi River Basin under expected climate change is uncertain. We used the field-tested Root Zone Water Quality Model (RZWQM) to estimate drainage N loads, crop yield, and rye growth in central Iowa corn-soybean rotations. RZWQM scenarios included baseline (BL) observed weather (1991–2011) and ambient CO2 with cover crop and no cover crop treatments (BL_CC and BL_NCC). Scenarios also included projected future temperature and precipitation change (2065–2085) from six general circulation models (GCMs) and elevated CO2 with cover crop and no cover crop treatments (CC and NCC). Average annual drainage N loads under NCC, BL_NCC, CC and BL_CC were 63.6, 47.5, 17.0, and 18.9 kg N ha−1. Winter rye cover crop was more effective at reducing drainage N losses under climate change than under baseline conditions (73 and 60% for future and baseline climate), mostly because the projected temperatures and atmospheric CO2 resulted in greater rye growth and crop N uptake. Annual CC drainage N loads were reduced compared with BL_NCC more than the targeted 41% for 18 to 20 years of the 21-year simulation, depending on the GCM. Under projected climate change, average annual simulated crop yield differences between scenarios with and without winter rye were approximately 0.1 Mg ha−1. These results suggest that implementing winter rye cover crop in a corn-soybean rotation effectively addresses the goal of drainage N load reduction under climate change in a northern Mississippi River Basin agricultural system without affecting cash crop production.

1. Introduction

Hypoxic or dead zones in coastal oceans have been expanding since the 1960s and are forecast to increase with climate change if reduction strategies are not implemented [1,2,3]. In North America, the size of the hypoxic area in the Gulf of Mexico correlates strongly with spring nitrate-N loads from the Mississippi River [4]. To address the growing dead zone in the Gulf of Mexico, the USEPA created the Mississippi River/Gulf of Mexico Nutrient Task Force in 1997 [5]. This Gulf Hypoxia Task Force set a goal to reduce total nitrogen (N) loads from the Mississippi River Basin 45% by 2035, as compared with the baseline loads between 1980 and 1996 [6,7]. To achieve this goal, 12 states with surface water discharging to the Mississippi River were tasked to develop strategies to reduce N loading to the Gulf of Mexico [8].
The state of Iowa’s strategy includes the goal of reducing N loads to waterways by 41% from non-point sources such as artificially drained corn and soybean fields [9,10]. Central Iowa is one of the more important areas to reduce N loads to meet Iowa’s non-point source goal and to reduce N loading to the Mississippi River, because it has a large fraction of land in artificially drained row crops [11]. Artificial drainage coupled with high row crop production contributes to streams within Iowa being among the greatest sources of N loading to the Mississippi River Basin [12,13]. These conditions of relatively large subsurface drainage N loads from row crop production entering streams makes central Iowa a key region for nitrate reduction efforts.
Drainage water N loads have been projected to increase with future shifts in climate conditions [14,15,16], which will complicate the goal of future N load reduction compared with baseline loads. Wang et al. [16] concluded that studies are needed to better understand management strategies that reduce future projected N loads.
Cover crops are widely regarded as a practice that reduces N leaching and drainage N loads [17,18,19]. If managed effectively, winter rye cover crops with corn-soybean rotations is one of the more promising methods to reduce drainage N loads in central Iowa without affecting cash crop yield [20,21]. However, nutrient management strategies must be effective not only under current and past climatic conditions, but also under future climate conditions. With an expected shift to higher temperatures and CO2 and changing precipitation patterns [22,23], the effectiveness of winter rye cover crops as an N reduction strategy in the future needs to be understood.
Studies have addressed several of the environmental benefits associated with winter cover crops under climate change. Bowles et al. [24] reported that a main principle for reducing N loss in a changing climate is to increase agroecosystem resilience, accomplished partly through winter cover crops. Kaye and Quemada [25] reported ecosystem services that are traditionally expected from cover cropping such as soil carbon sequestration, reduced erosion, and retention of N mineralization can be promoted synergistically with services related to climate change. A critical global review reported cover crops significantly decreased N leaching and increased soil organic carbon sequestration and could mitigate net greenhouse gas balances [26]. Studies using agricultural system models suggest that winter cover crops under projected climate change reduce soil erosion, increase soil carbon, and reduce CO2 emission from soil [27,28]. Malone et al. [29] reported that the effectiveness of winter rye cover crop to reduce drainage N loads increased with higher spring and fall temperatures, which suggests winter rye cover crop may be more effective under projected climate change than baseline climate. Higher fall, winter, and spring temperatures are associated with higher rye grain yield [30,31,32]. Furthermore, a two-year Free Air CO2 Enrichment (FACE) experiment reported that elevated CO2 (600 v 393 ppm) increased winter wheat grain yield and N uptake up to 12% [33].
Few studies, however, have investigated the impact of projected climate change on cash crop production and N budget components that include subsurface drainage N loads with winter rye cover crop in corn-soybean rotations in the Mississippi River Basin. In fact, Wang et al. [16] reported that an integrated study of drainage N loads under projected climate change that considered both advanced crop yield and drainage estimates had never been conducted. Both accurate crop growth and soil N mineralization estimates are required to investigate drainage N loads under climate change [16]. N uptake by crops is often the largest component of a corn-soybean system’s overall N budget [29,34], and climate change is projected to adversely affect future corn production [16,35,36]. Additionally, Wang et al. [16] estimated that, under climate change compared to baseline conditions, drainage N loads increased mostly because of increased N mineralization from soil organic matter.
While few, if any, studies have investigated both corn-soybean production and N loss to subsurface drainage with winter rye cover crops under climate change in the Mississippi River Basin, the SWAT model has been used to investigate the effectiveness of winter rye cover crop in reducing N loads to streams within the Chesapeake Bay Watershed under climate change [37].This study [37] also reported that without winter cover crops, annual nitrate loads increased under climate change compared with baseline climate. However, the study did not report the effect of cover crop on cash crop production under climate change and conditions within the Chesapeake Bay Watershed are considerably different from conditions in the northern Mississippi River Basin [37]. Mehan et al. [38] used the SWAT model to estimate that N loads were reduced under climate change compared to baseline conditions in a predominately subsurface drained agricultural watershed in northeastern Indiana, which contrasted with the results of other studies [16,37]. Missing in the studies of Lee and Mehan [37,38] were the complete N budget including mineralization and uptake by crops under projected climate change.
The Root Zone Water Quality Model (RZWQM) has been used by several studies to investigate the effects of climate change on crop production [39,40,41]. RZWQM has also been used to investigate both crop production and drainage N loads under climate change [16]. RZWQM may simulate N dynamics more realistically than the SWAT simulations mentioned above [37,38]. Malone et al. [42] reported that RZWQM simulates N dynamics in corn-soybean rotations differently and perhaps more accurately than the SWAT model because of more mechanistic soil N mineralization and microbial immobilization routines. RZWQM has been shown to reasonably predict the effectiveness of winter rye cover crop in reducing N loads from drainage at two different Iowa field sites [29,43,44]. Using data from a central Iowa field site [20,21,45], Gillette et al. [34] were able to improve upon the RZWQM simulations of nitrogen dynamics with cover crops made by Malone et al. [29].
We hypothesize that despite possible increased drainage N loads under climate change, including winter rye cover crop in corn-soybean rotations will reduce N loads in central Iowa below the reduction goal of 41% set to address the hypoxic zone in the Gulf of Mexico without reducing cash crop production, due to anticipated increases in rye uptake of crop available N and water under climate change. Here, we use the calibrated and tested RZWQM [34] to estimate drainage N loads (along with other N budget components) and crop yield and growth in a central Iowa corn-soybean rotation both with and without winter rye cover crop under 1) observed baseline 1991–2011 weather and ambient CO2 and 2) projected future 2065–2085 temperature and precipitation from six general circulation models (GCMs) and elevated CO2.

2. Materials and Methods

The study site is situated on the Des Moines Lobe landform region in central Iowa, that previous studies described in detail [21,34,42,45]. This area within the Des Moines Lobe has the principal soil association of Clarion–Nicolette–Webster, which requires artificial drainage for corn production [46]. Described below are baseline and projected climate, model scenarios, model calibration and testing against observed field data, and statistical analysis of model simulations.

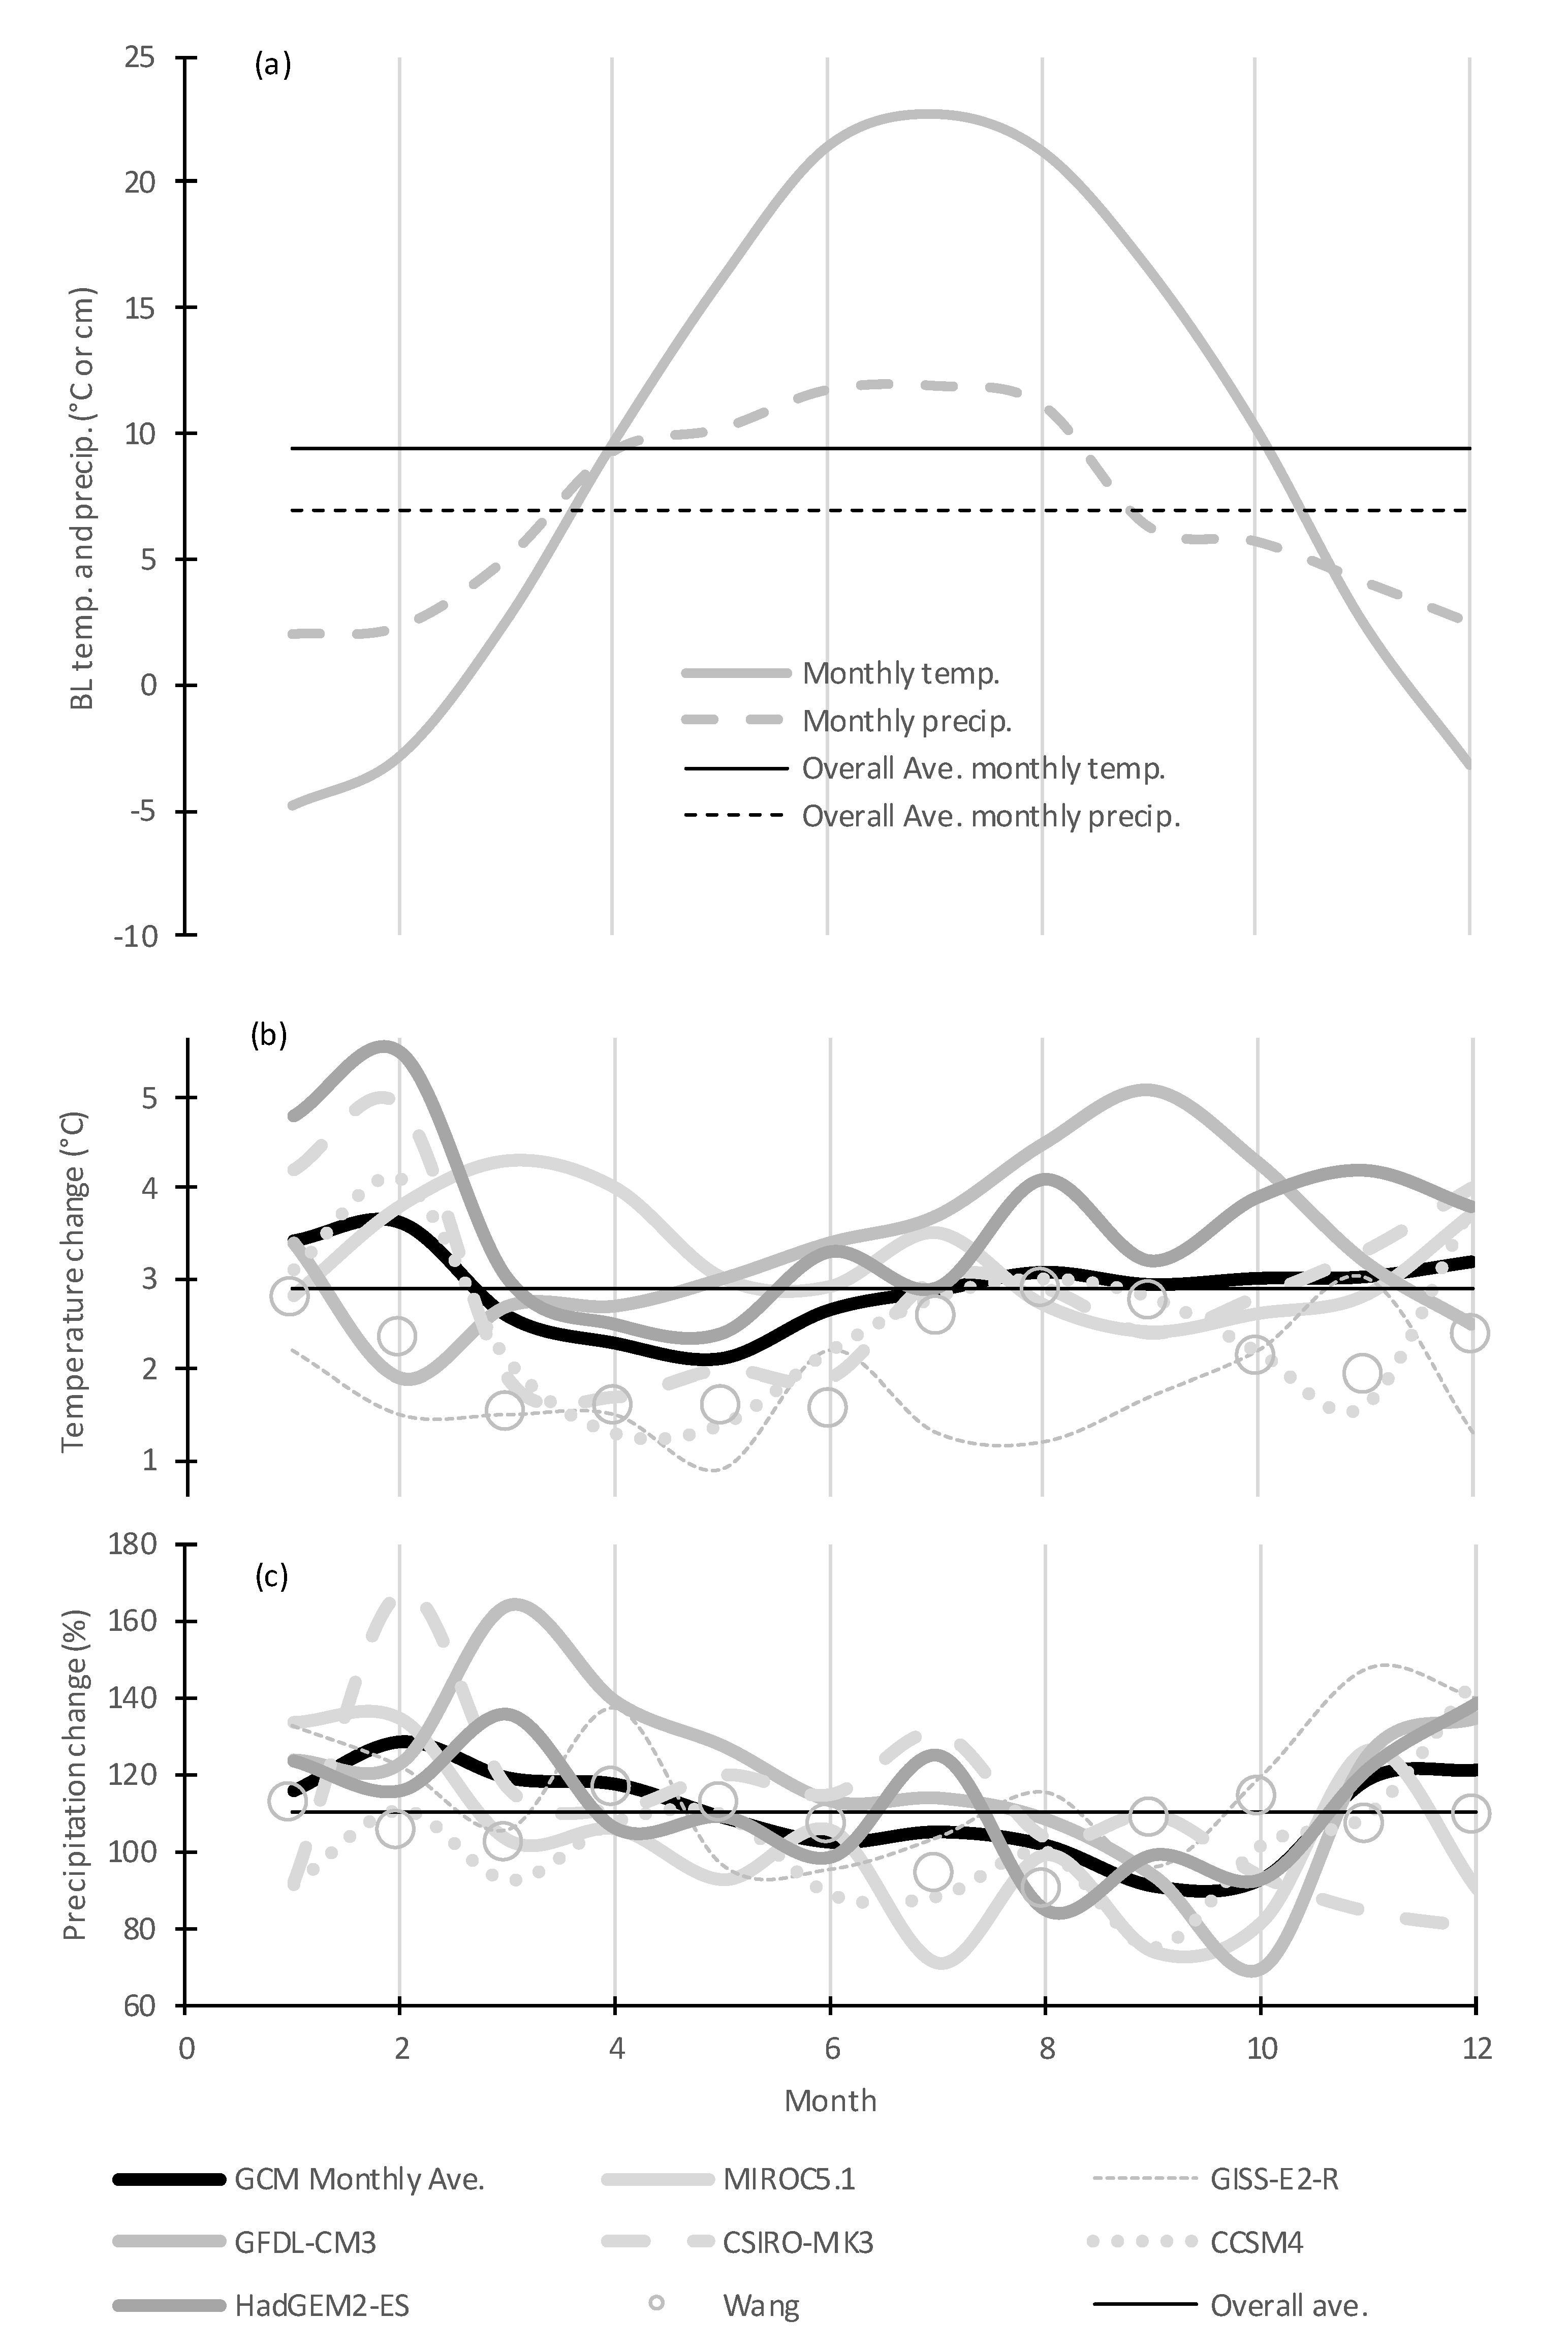
2.1. Climate Scenarios

Projected temperature and precipitation for 2065–2085 (centered around 2075) were developed for Ames, Iowa. We used six general circulation models (GCMs): CCSM4, GFDL-CM3, GISS-E2-R, HadGEM2-ES, CSIRO-MK3, and MIROC5.1. The GCM projections used in this study were extracted from the Coupled Modeled Intercomparison Project phase 5 (CMIP5) archive of the World Climate Research Programme for the 1/8th degree grid which encompasses the Ames, Iowa rain gauges [47]. The selected GCMs used in this study and details concerning the associated methods were described by Garbrecht and Zhang [48]. Studies evaluating impacts of climate change on water quality often center around mid-century [16,49], late-century [37], or both these periods [50,51]. Our projection centered around 2075 is a compromise of mid and late century periods.
Future temperature and precipitation were determined under greenhouse gas emissions from Representative Concentration Pathways (RCP) 4.5. RCP4.5 is an intermediate stabilization pathway where radiative forcing is stabilized at approximately 4.5 W m−2 after 2100 [52]. RCP4.5 and RCP6.0 are considered likely scenarios while RCP8.5 is an unlikely worst-case scenario [53]. We only include likely projected results using RCP4.5 because preliminary model runs suggested very similar cover crop growth and drainage N losses between RCP4.5 and 6.0, which is reasonable, given their nearly identical projected atmospheric CO2 concentrations and radiative forcing through about 2060 [52,54]. While many studies considered both RCP4.5 and RCP8.5 when projecting agricultural effects under climate change, others considered either RCP4.5 or RCP8.5 [27,51,55].
The selected GCMs simulate climate change processes with a monthly temporal resolution. For agricultural system models, GCM climate projections must be downscaled to daily to accurately model N loss, crop growth, etc. A synthetic weather generator called SYNTOR was used to downscale the monthly GCM projections to daily precipitation and temperature [56,57]. The resulting weather values have the statistical characteristics of the underlying 1986–2015 baseline data of Ames, Iowa and the monthly temperature and precipitation characteristics of the selected GCMs.
RZWQM baseline simulations for the central Iowa site were run from 1991–2011 (centered around 2001) using observed weather data [34] with an atmospheric CO2 concentration of 370 ppm. Future climate input for RZWQM was produced by superimposing average monthly differences of temperature (°C) and percent change in precipitation for each GCM downscaled as described above. An atmospheric CO2 concentration of 529 ppm was used for the future simulations.
The (1) method of superimposing monthly weather differences to produce future climate input for RZWQM and (2) region of the current study are similar to those of Wang et al. [16]. That study used baseline climate from 1990–2009 for Gilmore City, Iowa and climate change simulations for the year 2055. They used baseline and future CO2 levels of 369 and 548 ppm. Gilmore City is approximately 100 km north and 70 km west of Ames. With the similarities of the two studies, we compare our temperature and precipitation projections to theirs. We do not include future projected changes in relative humidity, short wave radiation, and wind speed, because these were reported to have only small impacts on nitrate concentration in drainage and grain yields [16].
Average monthly temperature and percent precipitation over the six climate models increased 2.9 °C and 110.5% from baseline (100% = baseline). These values are greater than the 2.2 °C and 106.9% reported by Wang et al. [16] (Figure 1b,c). We have larger temperature and precipitation changes, even with less CO2 change. This is partly because of the lag in CO2 effect and our projections being 20 years further into the future than Wang et al. [16]. The timing difference between a CO2 emission and the maximum temperature response can be a decade or longer [58,59]. Additionally, the individual climate model with the largest average temperature change was 3.6 °C from HadGEM-ES2 Figure 1b, which Wang et al. did not include [16]. Their largest annual change was 2.6 °C with CRCM_CCSM. The average annual precipitation amount change was +6.2 cm or 7.5% for our study and +4.4 cm or 5.7% for Wang et al. [16].

2.2. RZWQM Scenarios

The RZWQM modeling scenarios included corn-soybean rotations with (1) no winter rye cover crop and baseline weather (BL_NCC) or future projected weather from the six GCMs (NCC) and (2) winter rye cover crop with the seven different climate scenarios (BL_CC and CC). The corn and soybean planting dates were 27-April and 13-May. Corn and soybean were harvested within one to three days after simulated crop maturity, following the approach of Wang et al. [16]. The average soybean harvest date was 19-September, and ranged from 10-September to 01-October. The average corn harvest date was 13-September, and ranged from 30-August to 13-October. Winter rye was planted three to six days after simulated maturity of corn and soybean under baseline weather for all scenarios to mimic over-seeding of rye into standing crops [29,60]. All corn, soybean, and rye were planted and harvested or terminated on the same date for all scenarios: baseline climate, projected climate change, and with and without winter rye. For example, corn reached maturity earlier under the future climate scenarios, but the harvest date remained the same as the scenarios with baseline weather. The winter rye was terminated 10 days before corn planting and 3 days before soybean planting [29].
For each climate scenario and treatment, the model was run twice: (1) with corn in odd years and (2) with soybean in odd years. For the N and water budget calculations, we averaged the two scenarios (corn or soybean in odd years) to represent a field in both corn and soybean production for a given year [61]. A total of 28 scenarios were produced and executed to account for the six climate projections and baseline climate, winter rye and no rye treatments, and corn and soybean planted in both odd and even years.
A few additional scenarios were produced and executed. These also included corn and soybean in both odd and even years. First, scenarios were produced with the average future changes of Wang et al. [16]: monthly temperature (Figure 1b), precipitation (Figure 1c), and CO2. We used these scenarios to compare RZWQM simulated crop yield to a similar Iowa study. For example, RZWQM input included average February temperature and precipitation changes determined by Wang et al. [16] of 2.4 °C and 105% (Figure 1b,c). Second, scenarios were produced with average monthly temperature and/or precipitation changes from the six GCMs (Figure 1b,c) and/or CO2 changes. We used these scenarios to investigate the impacts of individual climate variables on annual rye growth and the associated N budgets (temperature-only, CO2-only, precipitation-only, all-). For example, RZWQM input included scenarios with February temperature and precipitation changes of 3.6 °C and 129% (Figure 1b,c). The all-scenario had all three climate-related variables adjusted (CO2, temperature, and precipitation). Third, several scenarios were produced with the three climate-related variables varied between baseline (BL_CC) values and the “all-scenario” values to investigate effects of likely intermediate climate between the years 2001 and 2075. Temperature and atmospheric CO2 are projected to continuously increase between the years 2000 and 2100 for RCP4.5 [52].
We simulated a fertilizer application of 200 kg N ha−1, based on the 202 kg N ha−1 average applied to corn in these field studies from 2002 to 2010 [34]. Malone et al. [42] discussed that this N rate could be considered high for central Iowa but that lower N rates resulted in N stress and unacceptably reduced RZWQM estimated corn yields. An N rate of 20 kg ha−1 was applied in the fall after soybean harvest, associated with P and K application [34]

2.3. RZWQM Calibration and Testing

Gillette et al. [34] used RZWQM to simulate winter rye growth, N uptake by crops, corn and soybean yield, drainage N loads, and N2O emissions reasonably well compared with 9 years (2002–2010) of observed data near Ames, Iowa. Therefore, we modeled the no cover crop and winter rye cover crop scenarios using nearly the same RZWQM calibration.
A few changes were needed to the RZWQM calibration of Gillette et al., partly because they used the RZWQM default atmospheric CO2 of 330 ppm [34]. As discussed in Appendix A and shown in Table A1, the model changes resulted in nearly identical model performance to Gillette et al. [34].

2.4. Statistical Analysis

For each GCM, 21 years of annual drainage N load values (kg N ha−1) were produced for scenarios with winter rye cover crop (2065–2085). The 41% target reduction in drainage N load consist of the 21 annual baseline values (1991–2011) for scenarios without cover crops multiplied by 0.59 (BL_NCC*0.59). Statistical analysis of these values was carried out using the JMP software (Pro 14, SAS Institute, Cary, NC, USA).
The drainage N load for each GCM are correlated with the target values, with the correlation coefficients between 0.75 and 0.82 for the six GCMs. The Shapiro-Wilk test [62] showed strong evidence that the N load for five of the six GCMs are non-normally distributed (with p-values all less than 0.024 except for GISS-E2-R). Therefore, the Wilcoxon signed-rank test [63] was used to compare the drainage N load for each GCM with the target drainage N load reduction. This test is non-parametric and used to compare two related samples, which fits well here: the N load for each GCM and the target N load values are correlated (related and matched year by year, 1991 to 2065, 1992 to 2066, etc.), and the test requires no normality assumption for the values [63].

3. Results and Discussion

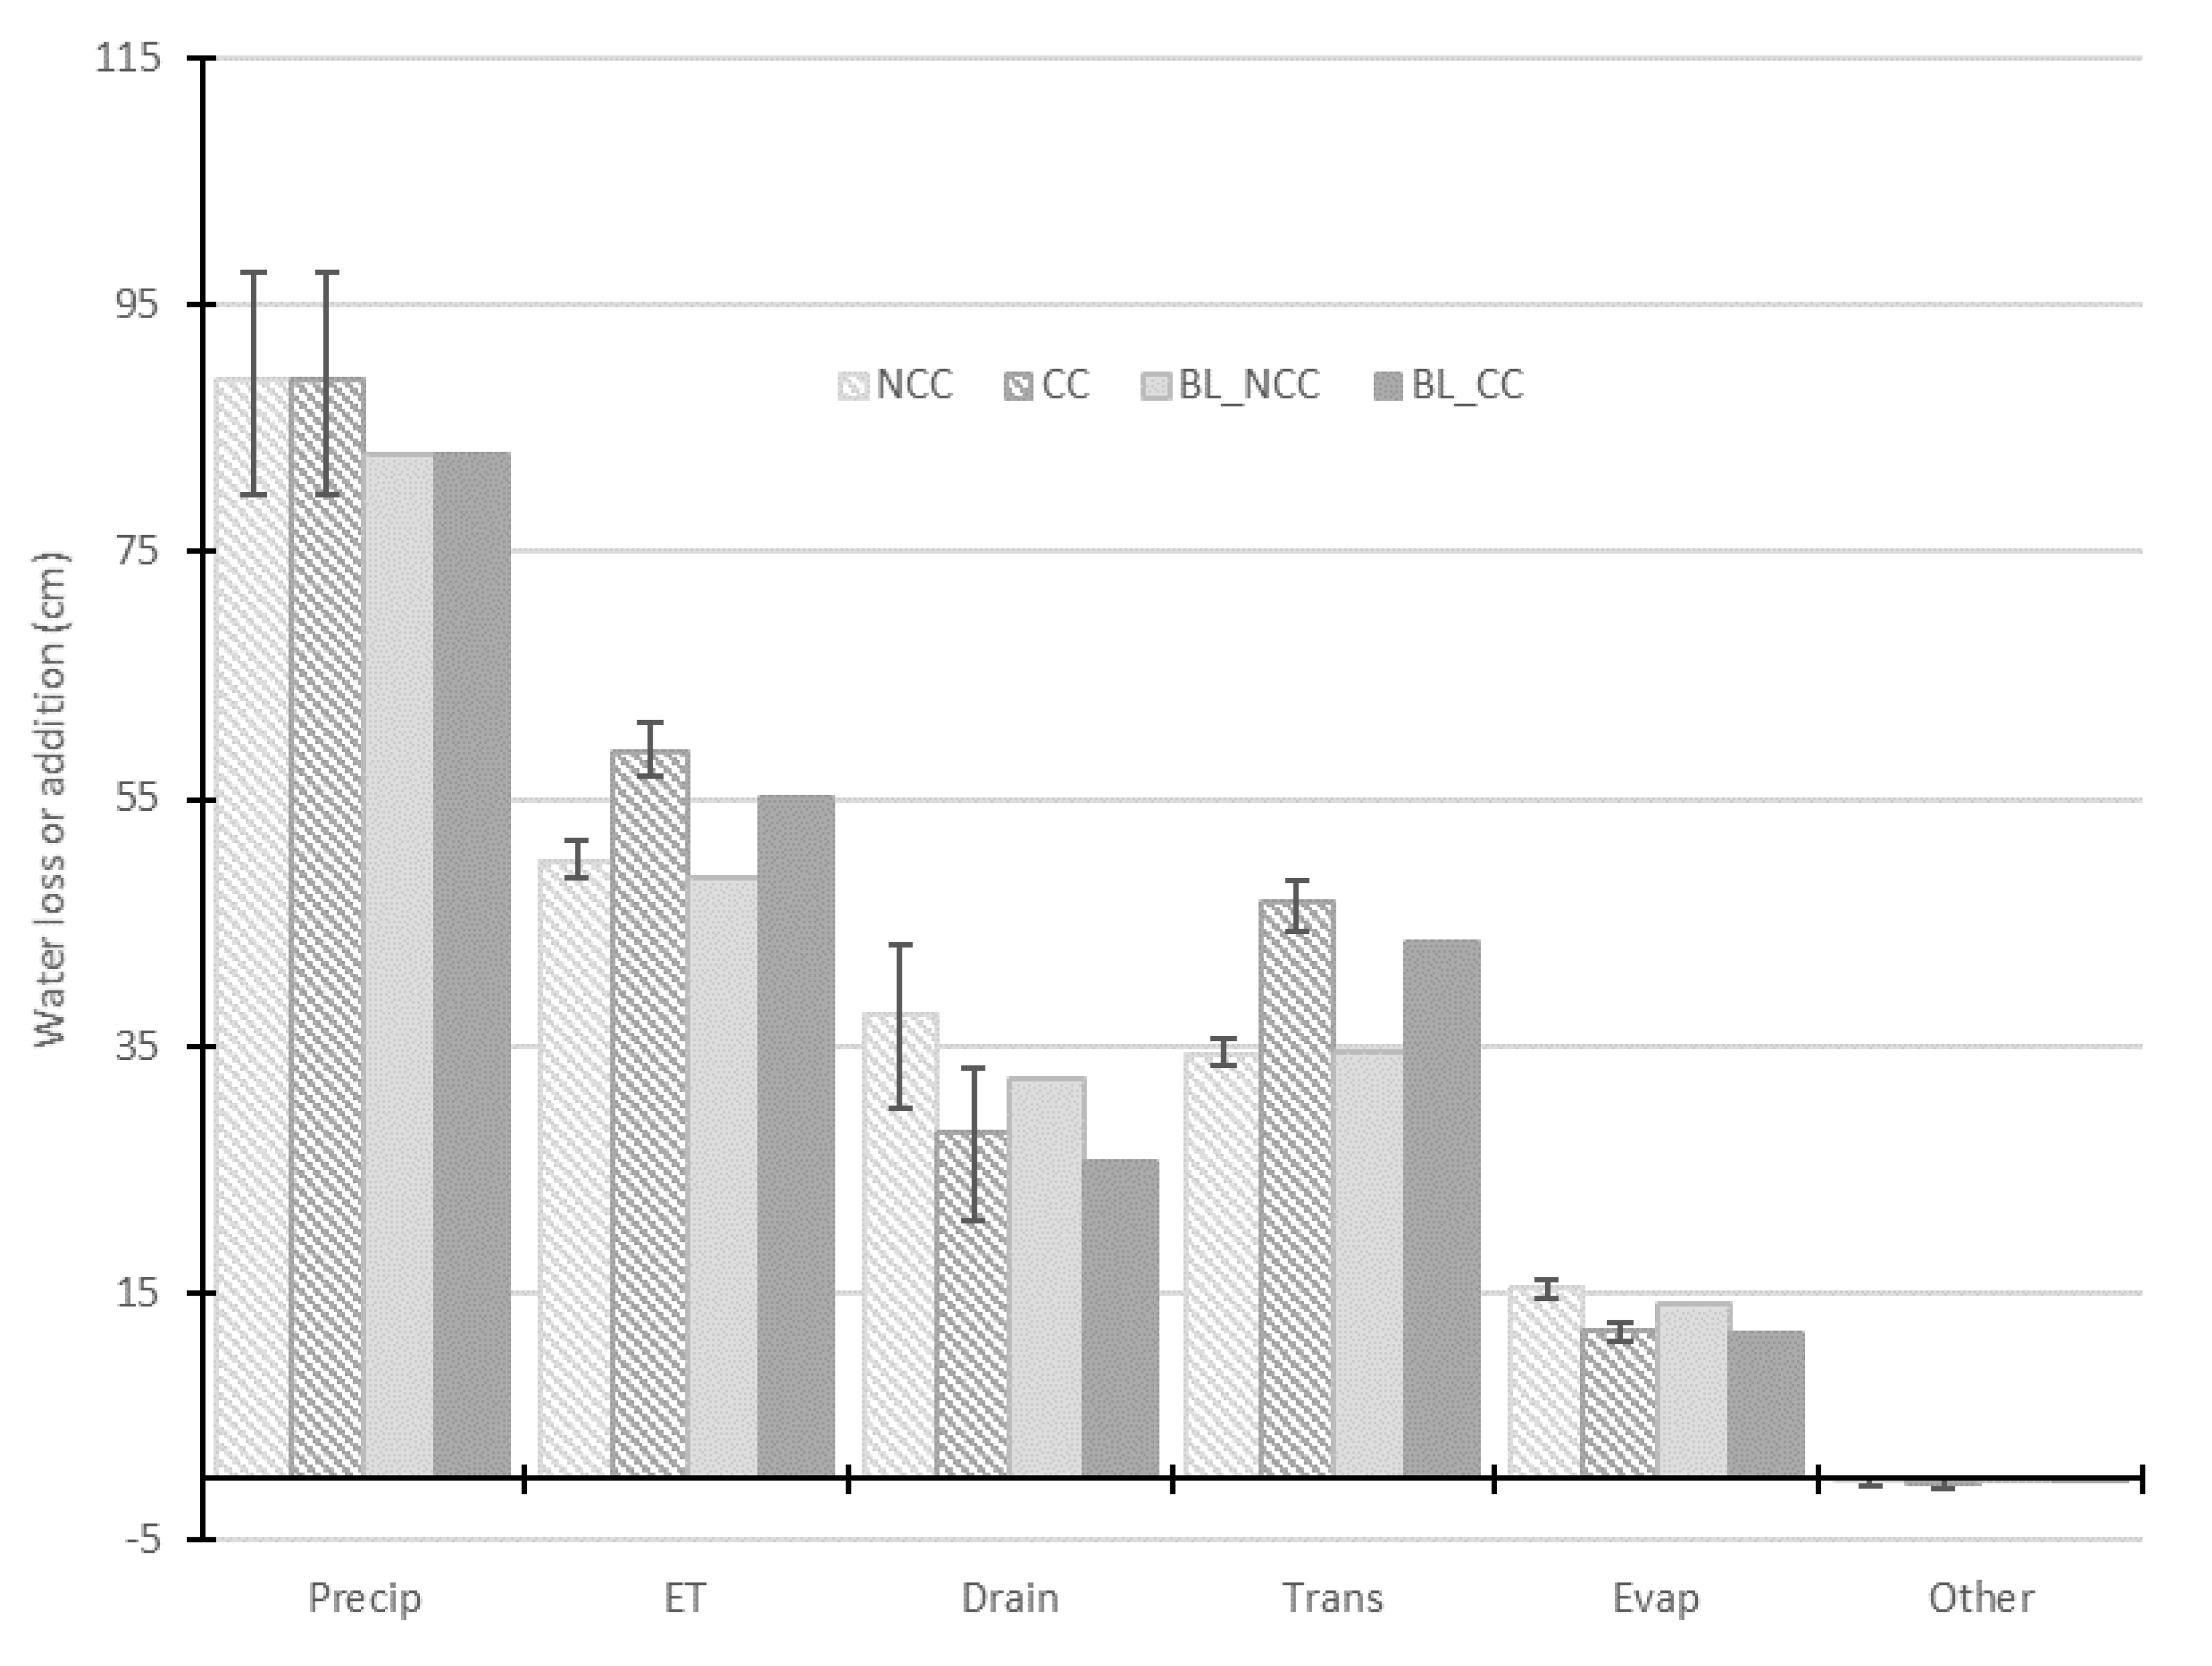
3.1. Corn and Soybean Yield, Rye Cover Crop Growth, and Evapotranspiration

The analysis begins with crop production because of its role in accurate simulation of drainage N loads. For example, N uptake by crops was the largest component of the N budget in our case. Our results are compared with Wang et al. [16], because they reported that the RZWQM simulated corn and soybean yields without winter rye in the rotation seemed reasonable for projected future climate in Iowa. For brevity and because RZWQM simulated main crop yield patterns followed Wang et al. [16], main crop yield is briefly discussed but not shown. Winter rye growth and the associated uptake of water and N resulted in reduced drainage N loads because of less crop available N and water in soil. Therefore, the effects of winter rye growth on main crop yield and annual evapotranspiration are discussed along with a brief discussion of winter rye growth and N uptake under climate change.
Using the same crop cultivars as under baseline climate conditions, average annual soybean yield under projected climate change was 3.8 Mg ha−1 for NCC. The average annual soybean yield range for the six models was from 3.7 to 4.0 Mg ha−1, all of which were higher than the 3.2 Mg ha−1 baseline soybean yield (BL_NCC). Average annual corn yield for NCC under projected climate change was 8.0 Mg ha−1. The average annual corn yield ranged from 7.5 to 9.0 Mg ha−1 for the six models, all of which were lower than the average baseline (BL_NCC) corn yield of 9.7 Mg ha−1.
The higher soybean and lower corn yields under climate change agree with Wang et al. [16]. For example, both studies show increased soybean yield and decreased corn yield under climate change, compared with baseline (NCC v BL_NCC). Wang et al. [16] showed more soybean yield increase (0.9 Mg ha−1) and less corn yield decrease (1.4 Mg ha−1) under climate change than our simulations, mostly because their climate projections resulted from RZWQM inputs with greater atmospheric CO2 (548 v 529 ppm) and less temperature increase during the growing season (e.g., average June-August temperature increase of 2.4 v. 2.9 °C, Figure 1b). Using the same average monthly temperature changes and CO2 level as Wang et al. [16], our average annual soybean and corn yield under climate change for NCC were 4.0 and 8.3 Mg ha−1, resulting in climate change differences with baseline of +0.8 and −1.4 Mg ha−1. Wang et al. [16] more thoroughly discusses RZWQM simulated soybean and corn yield changes under projected climate change in Iowa.
On average, annual crop yields under future climate with winter rye cover crop (CC) were within 0.1 Mg ha−1 of NCC (8.1 Mg ha−1 for CC corn and 3.9 Mg ha−1 for CC soybean). This suggests winter rye did not reduce corn or soybean yield on average because of water or N stress, despite greater rye growth under climate change (Table 1). Gillette et al. [34] also reported that average annual corn and soybean yields from 2002–2010 with winter rye were within 0.1 Mg ha−1 of RZWQM simulations without winter rye for the central Iowa field site.
The largest reductions in main crop yield from winter rye (CC) compared with NCC were for year 2071, where corn yield was reduced between 0.4 and 1.3 Mg ha−1 for three of the GCMs (HadGEM2-ES, MIROC5.1, and CCSM4). The reduced corn yield was because of simulated water stress during grain filling. On average, June-August future precipitation was reduced to 92% of baseline for two of the GCMs (MIROC and CCSM4; Figure 1c). The largest corn yield reduction resulted from only 3.4 cm of rainfall during August 2071 with the GCM that reduced August rainfall most substantially (85% of baseline; HadGEM2-ES; Figure 1c). August of 2071 was when most RZWQM simulated grain filling occurred.
With the corn yield reduction from water stress induced by rye growth and transpiration in 2071, simulated actual evapotranspiration (ET) is briefly discussed. Average annual actual ET for the six climate scenarios were 58.9 and 49.9 cm for CC and NCC and 55.2 and 48.7 cm for BL_CC and BL_NCC (Figure 2). The ET differences without winter rye for BL_NCC and NCC are comparable to Wang et al. [16], where ET was 44.2 cm for baseline and increased 0.8 cm for future climate. Our ET value for baseline climate without winter rye (BL_NCC) is greater than Wang et al. [16], but less than the average annual central Iowa ET of about 50–60 cm between 1971 and 2000 reported by Sanford and Selnick [64]. Our baseline ET is also similar to other studies that reported < 50 cm average annual RZWQM simulated ET from 2002 to 2009 for corn-soybean sites in central Iowa [44,65].
The winter rye treatment did not reduce crop yield most years. Although ET increased with winter rye treatments for both baseline and future climate (6.5 and 8.9 cm), both observed and RZWQM simulated soil water content in the spring before main crop planting were greater for winter rye treatments [34]. Additionally, the higher average annual ET with winter rye for both baseline and future climate was offset by less drainage (−6.8 and −9.3 cm; Figure 2), illustrating that on average the site had excess rather than deficit soil water for crop production.
Rye biomass and N uptake increased with climate change mostly due to increased temperature rather than increased atmospheric CO2 or precipitation. This was determined by changing each climate-related variable individually from baseline values (Table 1). Although the above ground rye biomass increased with the CO2-only scenario (from 2.6 to 2.9 Mg ha−1), the temperature-only scenario had greater average annual spring rye biomass at termination (4.7 Mg ha−1). Additional rye growth with the CO2-only scenario was somewhat limited, because of slightly more spring nitrogen stress than the baseline scenario with ambient CO2 (Table 1). The all-scenario (CO2, temperature, and precipitation adjusted) had 8.9 kg N ha−1 less average annual above ground rye N content than the temperature-only scenario, mostly because of greater average annual N uptake by corn and soybean and more N stress for rye (Table 1). The precipitation-only scenario had little influence on N uptake or biomass of rye but did result in increased average annual drainage N, from 18.9 for baseline to 22.3 kg N ha−1 (Table 1).
The increase in winter rye cover crop biomass with future climate change seems to be consistent with another Iowa study. While considering only temperature effects in central Iowa, Basche et al. [66] used the APSIM model to show that average annual winter rye cover crop biomass nearly doubled from 2015 temperatures to 2060 temperatures.

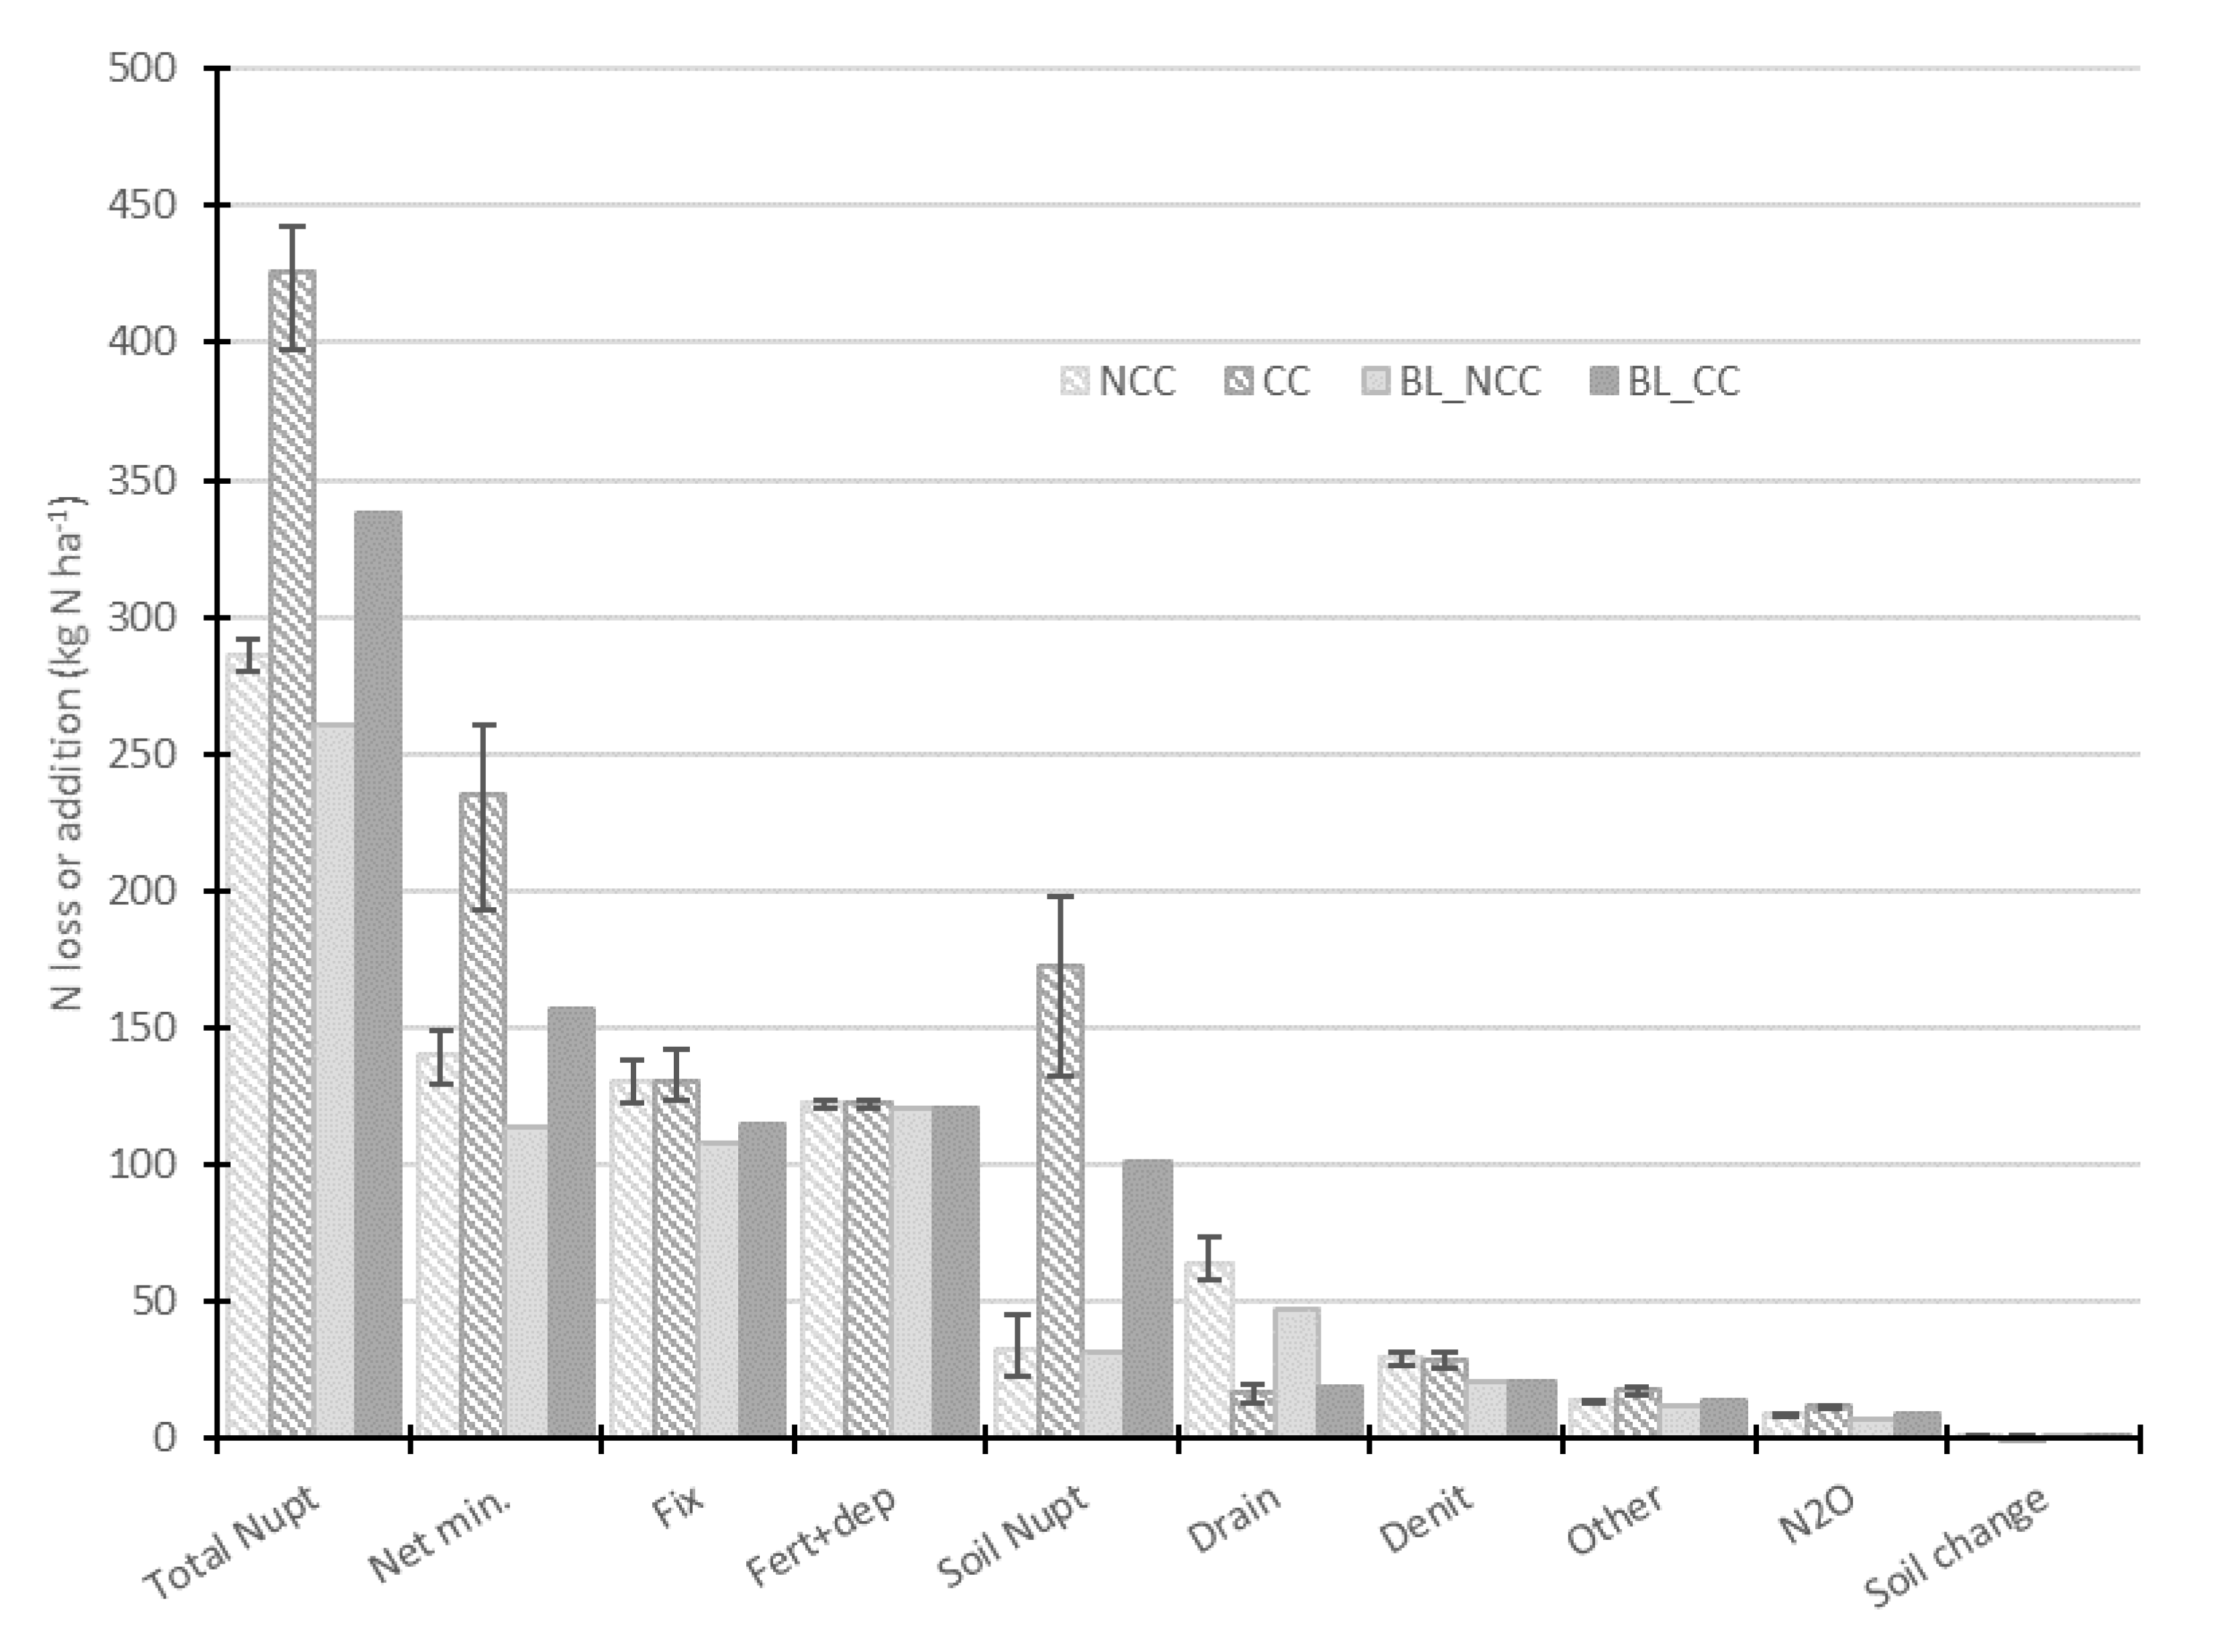
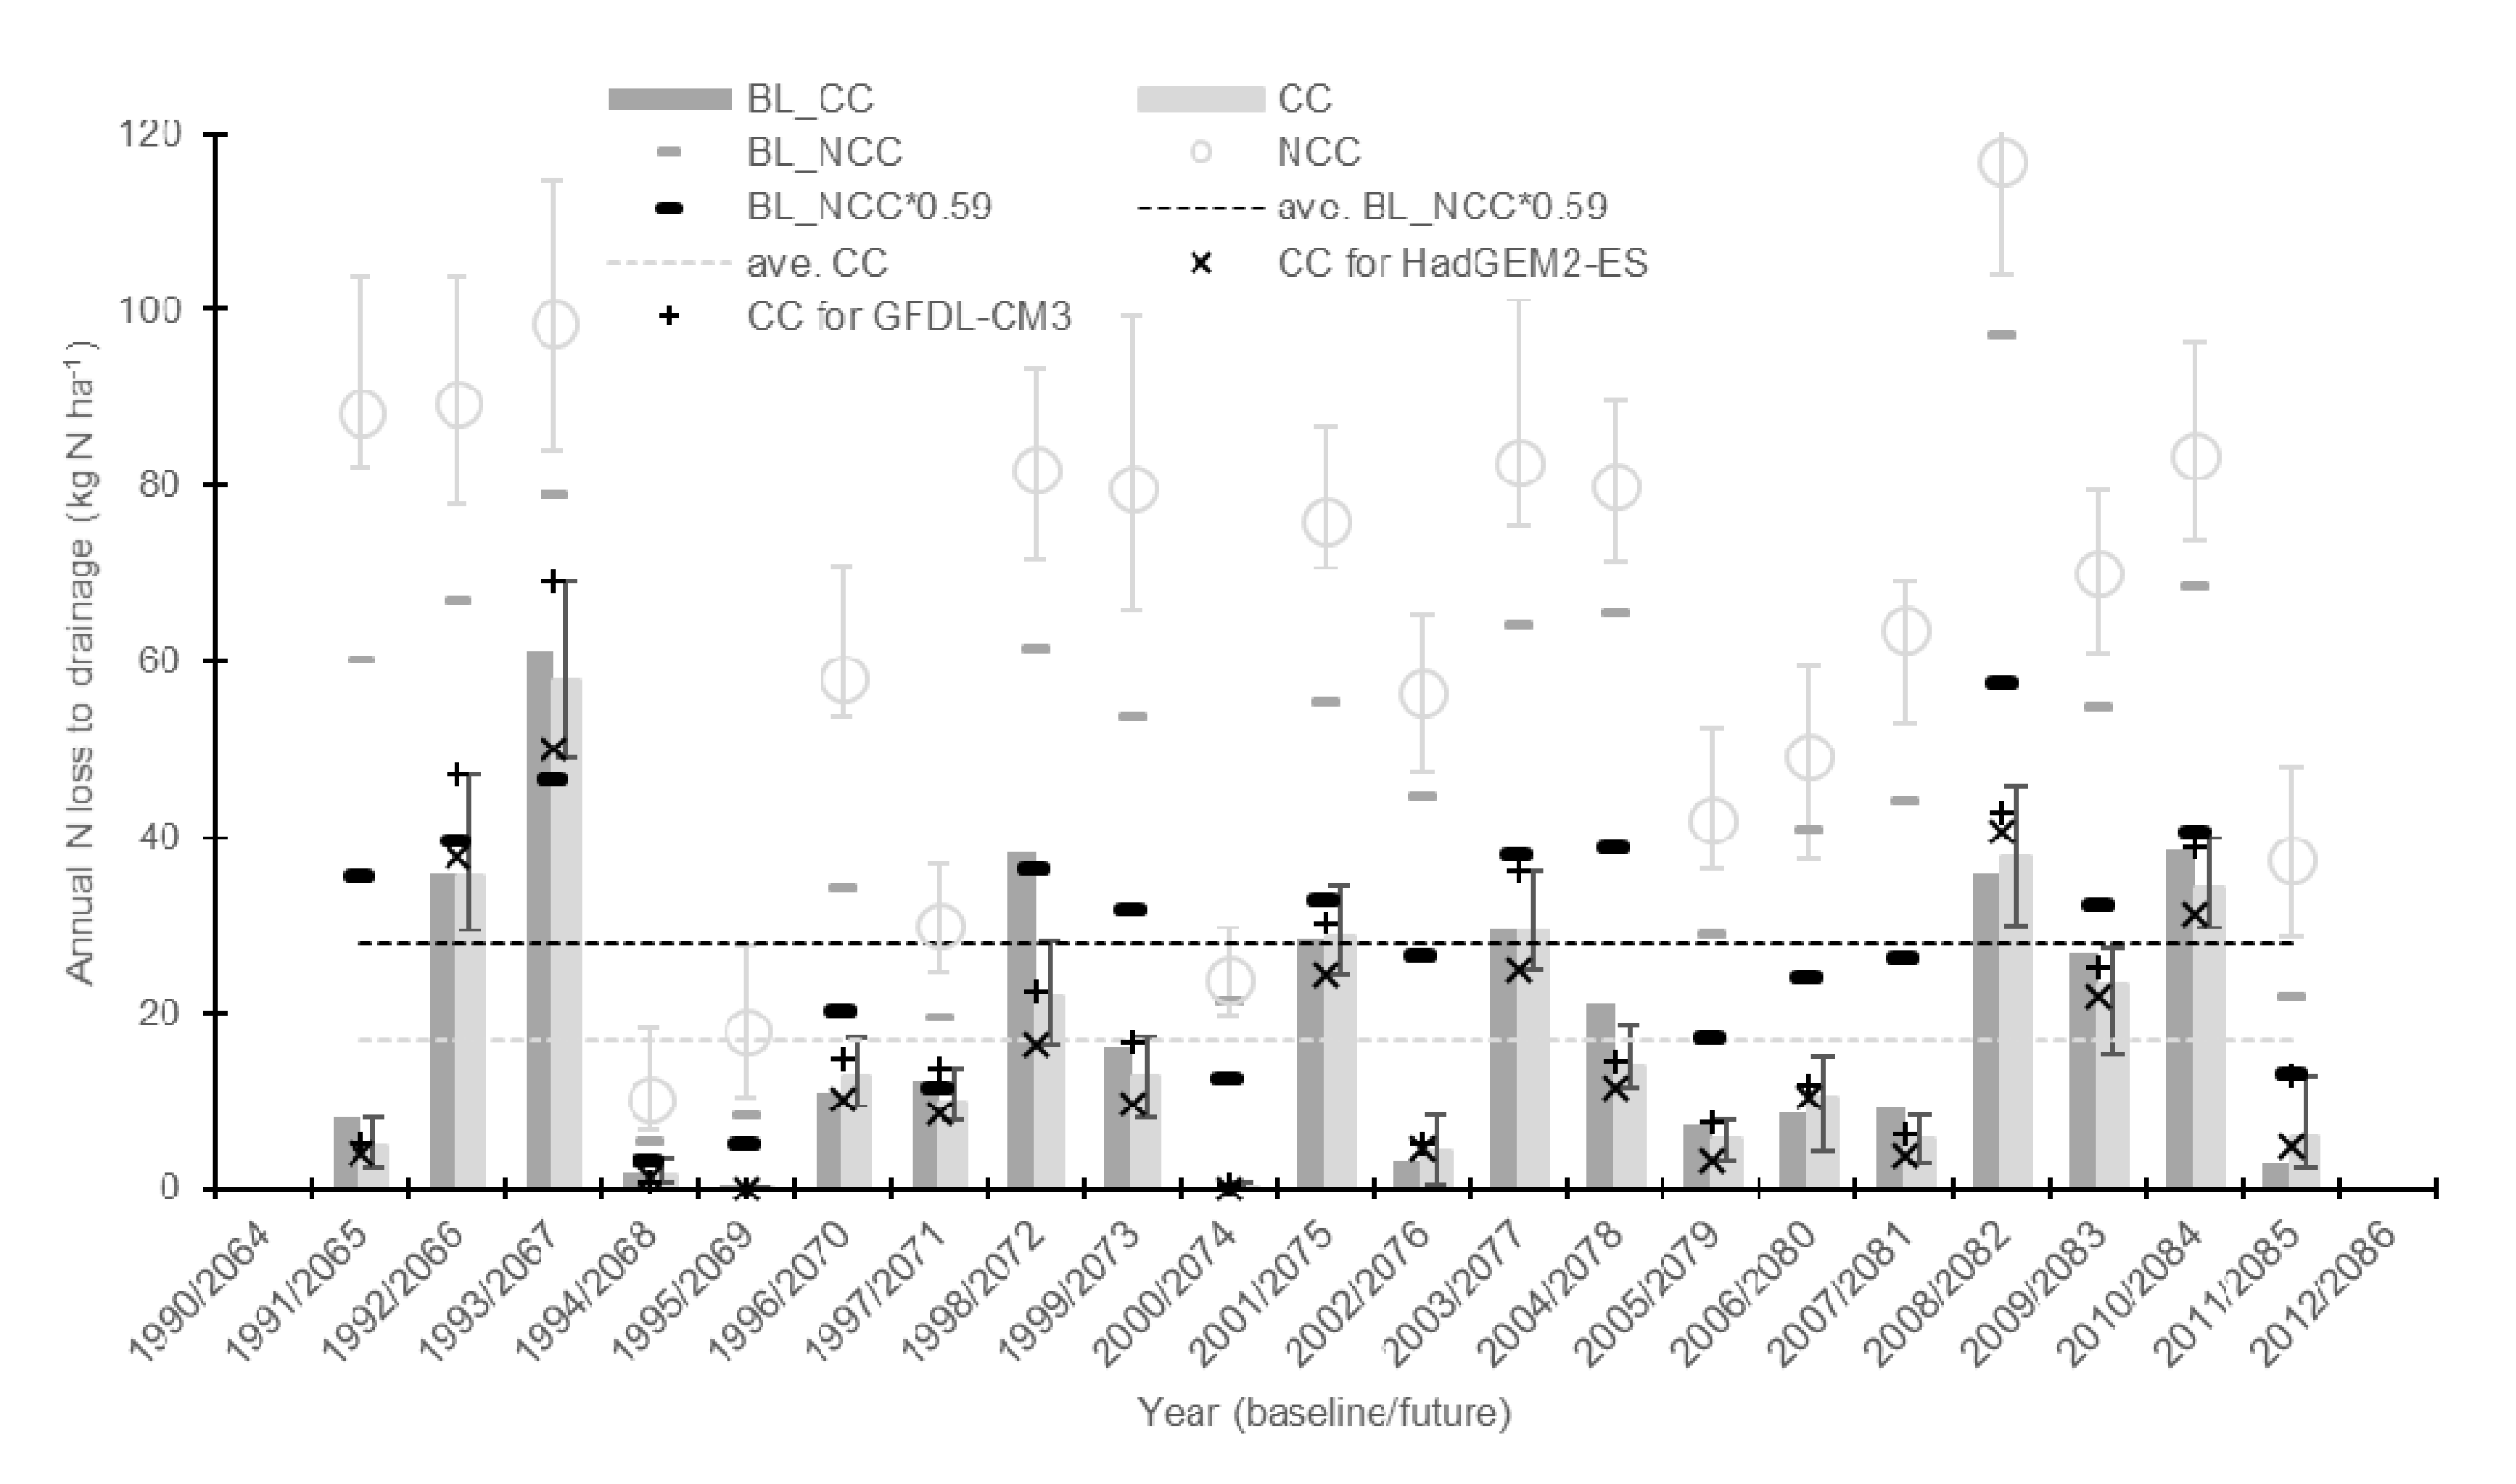
3.2. Drainage N and Other N Budget Components

The average annual drainage N loads under projected climate change with the no cover crop (NCC) and baseline climate with no cover crop (BL_NCC) were 63.6 and 47.5 kg N ha−1, or a 34% increase in N loads with climate change (Figure 3). These results are consistent with the increase of 34% reported and discussed by Wang et al. [16].
As reported by Wang et al. [16], the increase in drainage N loads under climate change was mostly because of greater net N mineralization. Net mineralization for NCC averaged 140.6 kg N ha−1 year−1, and ranged from 129.7 to 149.0 kg N ha−1 year−1 for the six models, while BL_NCC averaged 113.8 kg N ha−1 year−1 (Figure 3).
Other than net mineralization, the largest components of the simulated N budget were crop N uptake, N fixation, and fertilizer addition and atmospheric deposition (Figure 3). RZWQM simulated N uptake derived from soil organic matter was similar between baseline and projected climate change scenarios (average of 33 v 32 kg N ha−1 year−1; Figure 3), which was also reported and discussed by Wang et al. [16]. Average annual soil derived N uptake is defined as N uptake by corn and soybean from organic N mineralization (total crop N uptake-fixation-fertilizer-deposition; see [16]).
Unlike Wang et al. [16], our average annual denitrification for NCC increased 41% under climate change: 21.5 for BL_NCC to 30.0 kg N ha−1 year−1 for NCC with a range of 27.1 to 31.8 kg N ha−1 year−1 (Figure 3). This denitrification increase was because of the warmer and slightly wetter spring and early summer future climate (Figure 1b,c). These denitrification projections are consistent with Abdalla et al. [67] that concluded “denitrification is very sensitive to increasing temperature and that future global warming could lead to increased soil denitrification.” Butterbach-Bahl and Dannenmann [68] also reported that denitrification in agricultural systems generally responds positively to changes in temperature.
Average annual drainage N loads decreased when including winter rye cover crop in the rotation, from 47.5 to 18.9 kg N ha−1 year−1 for baseline (60% decrease; 1991–2011), and from 63.6 to 17.0 kg N ha−1 year−1 for future climate projections (73% decrease; Figure 3). Winter rye cover crop reduces drainage N loads more substantially under projected climate change compared with baseline because of higher projected temperature (Figure 1) and CO2 resulting in greater simulated winter rye growth and N uptake (Figure 3; Table 1). These results are consistent with a prior study [29], which discussed that winter rye cover crops were more effective at reducing drainage N loss with higher spring and fall temperatures (Figure 1) and increased cover crop growth (Table 1) and N uptake (Figure 3).
These percent drainage N load reductions with and without winter rye (60% and 73% for baseline and future climate, respectively) are similar to the results of Lee et al. [37], where winter rye cover crops was reported to reduce nitrate yield from cropland in Chesapeake Bay watersheds by 60% under baseline climate and between 67 and 69% under climate change using the SWAT model.
In comparison with the results of Lee et al. [37], our central Iowa site is projected to have colder average annual temperatures than the Chesapeake Bay watersheds under climate change (16.0 v 12.2 °C; Figure 1a,b), and have considerably greater average annual N loads to streams without cover crops (<15 kg N ha−1 v. 64 kg N ha−1; Figure 3). Further, Lee et al. provided little information concerning cash crop production under climate change and did not report subsurface drainage area [37]. However, our results using a different model and different conditions (e.g., region, climate, N losses, soils) confirm that study’s conclusion that “winter cover crops were effective in mitigating nitrate loads accelerated by future climate conditions, suggesting the role of winter cover crops in mitigating nitrate loads will likely be even more important under future climate conditions” [37]. RZWQM simulates N dynamics differently and perhaps more realistically than SWAT because of more mechanistic N mineralization and microbial immobilization routines [42]. Compared with baseline climate without winter rye (BL_NCC), increased simulation of net N mineralization was the main reason for increased RZWQM simulated drainage N loads for NCC as discussed above.
Drainage N losses for the climate change scenarios with winter rye cover crop (CC) were compared with 59% of N loss under baseline climate with no cover crop (BL_NCC*0.59). This comparison helps assess winter rye cover crop as a practice to address Iowa’s goal of 41% reduction in future drainage N loads compared to baseline conditions [9,10]. Average annual N loss for the CC scenarios across the six GCMs were lower than BL_NCC*0.59 for 20 years of the 21-year simulation (Figure 4). Disaggregating to each individual GCM showed more than 41% reduction in N loss for between 18 and 20 years. For example, GFDL-CM3 had the largest average annual drainage N losses for CC of the six GCMs and three years were higher than BL_NCC*0.59 (Figure 4).
With winter rye cover crop (CC), the average annual drainage N loads under the six GCMs were 13.5, 15.2, 15.9, 18.5, 19.0, and 20.1 kg N ha−1 for MIROC5.1, HadGEM2-ES, CCSM4, CSIRO-MK3, GISS-E2-R, and GFDL-CM3. These are all well below the target of 28.0 kg N ha−1 (a 41% reduction from the BL_NCC average annual N loss of 47.5 kg N ha−1; Figure 4). These average N loads are significantly lower than the target for all six GCMs (p-values < 0.001). Averaged over the six GCMs, the average annual drainage N loads with cover crop was 17.0 kg N ha−1. This, again, is significantly lower than the target of 28.0 kg N ha−1 (p-value < 0.001). The average N load of BL_CC was slightly higher than CC (18.9 kg N ha−1; Table 1), but still significantly lower than the target (p-value < 0.001).
Considering the average of the six GCMs, the least effective annual N loss reduction with winter cover crop (CC) compared with BL_NCC was 27% for 2067 compared to 1993 (Figure 4). The year 2067 coincided with the future simulation period’s lowest March average maximum air temperature of 4.5 °C, and lowest late April rye biomass of 1.9 Mg ha−1. Malone et al. [29] reported that maximum spring temperature was the most sensitive investigated variable associated with RZWQM-simulated effectiveness of winter rye cover crop in reducing drainage N loads.
The target N reduction final goal is for the year 2035 [8] and our simulations with the GCM climate projections centered around 2075, so we ran several scenarios with monthly temperature, precipitation, and CO2 levels between the baseline climate (BL_CC) and the “all-scenario” (Table 1). The average annual drainage N loss for these runs were higher than the “all-scenario” and lower than BL_CC losses of 16.4 and 18.9 kg N ha−1 (Table 1). This suggests that winter rye cover crop under the simulated conditions will significantly reduce drainage N loads below the target for the current climate and likely projected climate through 2075.
If fertilizer N rates are reduced in the future, then the future drainage N loads should be less than shown in Figure 4 for NCC and CC. Thus, with reduced fertilizer rates the future N loads with winter rye cover crop under projected climate change (CC) should be reduced more substantially compared to the target (BL_NCC*0.59) than currently shown in Figure 4. Note that the fertilizer rates would not change for BL_NCC because these are past baseline scenarios. Reasons for reduced N rates in the future could be because of higher soil N mineralization with projected climate change, as reported above and by Wang et al. [16], or because of more efficient systems (e.g., higher or static corn yield with reduced fertilizer rates and static soil N mineralization).

4. Conclusions

The U.S. National Academy of Engineering listed “Manage the Nitrogen Cycle” as one of 14 grand challenges for the 21st century stating: “controlling the impact of agriculture on the global cycle of nitrogen is a growing challenge for sustainable development” [69]. Sustainable intensification of agriculture (i.e., meeting the future food needs of a growing and increasingly affluent human population, while minimizing environmental impacts that include coastal hypoxic zones) is a major challenge of our time [70,71]. To meet these challenges, we must improve our understanding of the dynamics of nitrogen fate and crop production in corn-soybean rotations in the northern Mississippi River Basin under climate change, which include cover crops and subsurface tile drainage. This is especially true given that N loading from subsurface drainage in this region is one of the main contributors to hypoxia or the dead zone in the U.S. Gulf of Mexico [4,12,13], and this dead zone will likely increase in the future without strategies to reduce N loading to the Mississippi River and Gulf of Mexico [1,2,3]. To help address these challenges the state of Iowa set the goal of reducing non-point source N loads 41% [9,10].
This study is the first we are aware of that suggests that implementing winter rye cover crop in a northern Mississippi River Basin corn-soybean rotation would achieve the current goal of future drainage N load reduction under climate change without affecting cash crop production. This study also confirms the conclusions of Lee et al. [37] concerning the effectiveness of winter cover crops to mitigate N loads under projected climate change, which is one of the few published studies to include this focus. A more thorough understanding of the effectiveness of conservation practices under future climate change is essential to N reduction efforts in the Mississippi River Basin and elsewhere. Future modeling efforts should address other aspects of climate change and drainage N loads with winter cover crops, such as additional simulation time periods; RCPs; management (e.g., reduced fertilizer rates and earlier cash and cover crop harvest, termination, and planting); cash crop cultivars; types of cover crops; and soils/locations.

Author Contributions

Conceptualization, R.M., J.G. (Jurgen Garbrecht) and J.G. (Jade Gerlitz); Data curation, R.M., D.J. and T.K.; Formal analysis, R.M., J.G. (Jade Gerlitz), Q.F., M.S., A.R. and H.W.; Investigation, R.M. and J.G. (Jade Gerlitz); Methodology, R.M., J.G. (Jurgen Garbrecht), P.B. and Z.Q.; Project administration, R.M.; Resources, R.M.; Software, R.M., J.G. (Jurgen Garbrecht), P.B., J.G. (Jade Gerlitz) and L.M.; Supervision, R.M.; Validation, R.M., J.G. (Jade Gerlitz) and A.R.; Visualization, R.M. and J.G. (Jade Gerlitz); Writing-original draft, R.M., J.G. (Jurgen Garbrecht), P.B., J.G. (Jade Gerlitz) and H.W.; Writing—review & editing, R.M., P.B., J.H., D.T., J.G. (Jade Gerlitz), Q.F., M.S., A.R., L.M., Z.Q., H.W. and T.K. All authors have read and agreed to the published version of the manuscript. Please turn to the CRediT taxonomy for the term explanation.

Funding

This research received no external funding.

Conflicts of Interest

The authors declare no conflict of interest.

Appendix A

The RZWQM default atmospheric CO2 concentration of 330 ppm used by Gillette et al. (2018) was changed to 370 ppm for the current baseline climate simulations and model testing. The higher CO2 concentration input for the current model runs resulted in higher simulated soybean yield compared with field observations and Gillette et al. [34]. Therefore, simulated soybean growth was adjusted downward by reducing the soybean growth parameter LFMAX to 0.6.
With the many model runs required for the current research and model convergence issues and slow processing speed associated with the SHAW energy budget model used by Gillette et al. [34], we used the default energy budget model with RZWQM. This change resulted in less RZWQM simulated net mineralization of N. So, for accurate simulation of N dynamics, the coefficient regulating the soil organic matter rate of decay was increased to 13.5 × 10⁻¹⁰ from the value of 9.5 × 10⁻¹⁰ that was used by Gillette et al. [34]. This revised value is less than the calibrated values reported in [29] and [65] of 22 × 10−10 and 24 × 10−10.
With these model input changes, average simulated corn and soybean yield were 10.9 and 2.8 Mg ha−1 for no winter rye cover crop (NWCC) using the management, conditions, and RZWQM input described by Gillette et al. [34]. These crop yield simulations are similar to the simulated values of 10.8 and 2.9 Mg ha−1, and measured average annual observed yields of 10.7 and 2.6 Mg ha−1 for corn and soybean, respectively, reported in [34]. Note that for clarity, the abbreviations for the RZWQM testing scenarios (NWCC and WCC) are different from the baseline and climate change scenarios (BL_NCC, BL_CC, NCC, and CC). Additionally note that field data, management, and RZWQM input and testing details are presented in [34].
The model performance indicators for both winter rye cover crop (WCC) and NWCC suggest these simulations were similar to Gillette et al. [34] for targets such as drain flow volume, drainage N loads, and winter rye biomass and shoot N (Table A1). Perhaps the most notable increase in model performance was for WCC drainage N loads, where relative root mean square error (RRMSE) decreased slightly from 41% to 38%.
Table A1. Model performance indicators and average annual observed (Obs) and RZWQM (RZ) simulated results for the central Iowa field experiment with winter rye cover crop (WCC) and no winter cover crop (NWCC) for 2002–2010. A summary of the Gillette et al. [34] results are also presented. Note that Gillette et al. [34] reported selected model performance statistics concerning rye biomass and shoot N while discussing results but did not include values in table. Model performance statistics were defined by Gillette et al. and Malone et al. [29,34]: the coefficient of determination (r2), the Nash-Sutcliffe model efficiency (NSE), and relative root mean square error (RRMSE, %).
StatisticDrain Flow Volume (cm)Nitrate Loss to Drain Flow (kg N ha−1)Cover Crop Biomass
(Mg ha−1)
Cover Crop Shoot N
(kg N ha−1)
NWCCWCCNWCCWCCWCCWCC
ObsRZObsRZObsRZObsRZObsRZObsRZ
Ave36.737.935.934.449.349.420.8201.62.248.353.8
NSE0.900.890.600.350.210.73
r20.900.890.610.380.670.79
RRMSE14.314.724.937.642.324.3
Summary of Gillette et al. (2018)
Ave36.736.235.934.249.348.520.822.41.62.148.352.9
NSE0.890.890.610.220.300.76
r20.900.900.630.430.670.81
RRMSE14.414.324.741.240.122.7
Although not shown in Table A1, the N2O simulations were similar to Gillette et al. [34]. The overall corn and soybean average annual April–October N2O cumulative emissions for observed NWCC, simulated NWCC, observed WCC, and simulated WCC were 6.7, 6.2, 6.2, and 7.8 kg N ha−1. Gillette et al. [34] reported 6.0 and 7.2 kg N ha−1 were simulated for NWCC and WCC for these same years and fields. As discussed in that paper, some of the difference between observed and simulated N2O emissions was because peak daily emissions in corn years were simulated between field measurement dates.
Other unmeasured components of the simulated N budget appear reasonable. For example, the 2002 to 2009 average annual net N mineralization and denitrification were slightly higher for the current NWCC simulations compared with Gillette et al. [34] (124.0 and 18.3 kg N ha−1 compared with 116.7 and 17.3 kg N ha−1). However, these are comparable to HERMES model simulations for the same field site (132.0 and 17.7 kg N ha−1), which were discussed as reasonable for the conditions [72]. The year 2010 was not used for mineralization and denitrification values to maintain equal years for corn and soybean and to conform Gillette et al. [34].
Although N mineralization and denitrification were not measured at the field site, Ma et al. (2012) recommended RZWQM calibration and testing should include the complete N budget. Including “soft data” such as unmeasured mineralization in water quality model evaluation has been recommended [73,74,75]. Soft data are defined as information on individual processes within a nutrient budget that are not directly measured but can be estimated through the literature or expert knowledge.

References

  1. Diaz, R.J.; Rosenberg, R. Spreading dead zones and consequences for marine ecosystems. Science 2008, 321, 926–929. [Google Scholar] [CrossRef] [PubMed]
  2. Rabalais, N.N.; Díaz, R.J.; Levin, L.A.; Turner, R.E.; Gilbert, D.; Zhang, J. Dynamics and distribution of natural and human-caused hypoxia. Biogeosciences 2010, 7, 585–619. [Google Scholar] [CrossRef] [Green Version]
  3. Vaquer-Sunyer, R.; Duarte, C.M. Thresholds of hypoxia for marine biodiversity. Proc. Natl. Acad. Sci. USA 2008, 105, 15452–15457. [Google Scholar] [CrossRef] [PubMed] [Green Version]
  4. Rabalais, N.N.; Turner, R.E.; Díaz, R.J.; Justić, D. Global change and eutrophication of coastal waters. ICES J. Mar. Sci. 2009, 66, 1528–1537. [Google Scholar] [CrossRef]
  5. Mississippi River Collaborative Nutrient Reduction Strategies. Available online: https://www.msrivercollab.org/focus-areas/nutrient-reduction-strategies/ (accessed on 1 March 2020).
  6. Mississippi River/Gulf of Mexico Hypoxia Task Force Mississippi River Gulf of Mexico Watershed Nutrient Task Force New Goal Framework. Available online: https://www.epa.gov/sites/production/files/2015-07/documents/htf-goals-framework-2015.pdf (accessed on 21 November 2019).
  7. USGS Trends in Annual Water-Quality Loads to the Gulf of Mexico Through. 2018. Available online: https://nrtwq.usgs.gov/mississippi_loads/#/GULF (accessed on 3 March 2020).
  8. Mississippi River/Gulf of Mexico Hypoxia Task Force Gulf Hypoxia Action Plan 2008 for Reducing, Mitigating, and Controlling Hypoxia in the Northern Gulf of Mexico and Improving Water Quality in the Mississippi River Basin. Available online: https://www.epa.gov/ms-htf/gulf-hypoxia-action-plan-2008 (accessed on 21 November 2019).
  9. Iowa Department of Agriculture and Land Stewardship; Iowa Department of Natural Resources; Iowa State University College of Agriculture and Life Sciences. Iowa Nutrient Reduction Strategy: A Science and Technology-Based Framework to Assess and Reduce Nutrients to Iowa Waters and the Gulf of Mexico; Iowa Dep. Agric. Land Steward.; Iowa Dep. Nat. Resour.; Iowa State Univ. Coll. Agric. Life Sci.: Des Moines, IA, USA, 2017.
  10. Northey, B.; Gipp, C. Nutrient Reduction Strategy Key to Keeping Iowa a National Leader in Conservation. Available online: http://www.nutrientstrategy.iastate.edu/news/130110 (accessed on 21 November 2019).
  11. Kladivko, E.J.; Kaspar, T.C.; Jaynes, D.B.; Malone, R.W.; Singer, J.; Morin, X.K.; Searchinger, T. Cover crops in the upper midwestern United States: Potential adoption and reduction of nitrate leaching in the Mississippi River Basin. J. Soil Water Conserv. 2014, 69, 279–291. [Google Scholar] [CrossRef] [Green Version]
  12. Goolsby, D.A.; Battaglin, W.A.; Aulenbach, B.T.; Hooper, R.P. Nitrogen input to the Gulf of Mexico. J. Environ. Qual. 2001, 30, 329–336. [Google Scholar] [CrossRef]
  13. Jones, C.S.; Nielsen, J.K.; Schilling, K.E.; Weber, L.J. Iowa stream nitrate and the Gulf of Mexico. PLoS ONE 2018, 13, e0195930. [Google Scholar] [CrossRef]
  14. Dayyani, S.; Prasher, S.O.; Madani, A.; Madramootoo, C.A. Impact of climate change on the hydrology and nitrogen pollution in a tile-drained agricultural watershed in Eastern Canada. Trans. ASABE 2012, 55, 389–401. [Google Scholar] [CrossRef]
  15. Singh, R.; Helmers, M.J.; Kaleita, A.L.; Takle, E.S. Potential impact of climate change on subsurface drainage in Iowa’s subsurface drained landscapes. J. Irrig. Drain. Eng. 2009, 135, 459–466. [Google Scholar] [CrossRef]
  16. Wang, Z.; Qi, Z.; Xue, L.; Bukovsky, M.; Helmers, M.J. Modeling the impacts of climate change on nitrogen losses and crop yield in a subsurface drained field. Clim. Change 2015, 129, 323–335. [Google Scholar] [CrossRef] [Green Version]
  17. Dinnes, D.L.; Karlen, D.L.; Jaynes, D.B.; Kaspar, T.C.; Hatfield, J.L.; Colvin, T.S.; Cambardella, C.A. Nitrogen management strategies to reduce nitrate leaching in tile-drained Midwestern soils. Agron. J. 2002, 94, 153. [Google Scholar] [CrossRef]
  18. Martinez-Feria, R.A.; Dietzel, R.; Liebman, M.; Helmers, M.J.; Archontoulis, S.V. Rye cover crop effects on maize: A system-level analysis. Field Crops Res. 2016, 196, 145–159. [Google Scholar] [CrossRef]
  19. Thapa, R.; Mirsky, S.B.; Tully, K.L. Cover crops reduce nitrate leaching in agroecosystems: A global meta-analysis. J. Environ. Qual. 2018, 47, 1400–1411. [Google Scholar] [CrossRef] [PubMed]
  20. Kaspar, T.C.; Jaynes, D.B.; Parkin, T.B.; Moorman, T.B. Rye cover crop and gamagrass strip effects on NO3 concentration and load in tile drainage. J. Environ. Qual. 2007, 36, 1503–1511. [Google Scholar] [CrossRef] [Green Version]
  21. Kaspar, T.C.; Jaynes, D.B.; Parkin, T.B.; Moorman, T.B.; Singer, J. Effectiveness of oat and rye cover crops in reducing nitrate losses in drainage water. Agric. Water Manag. 2012, 110, 25–33. [Google Scholar] [CrossRef]
  22. Donat, M.G.; Lowry, A.L.; Alexander, L.V.; O’Gorman, P.A.; Maher, N. More extreme precipitation in the world’s dry and wet regions. Nat. Clim. Chang. 2016, 6, 508–513. [Google Scholar] [CrossRef]
  23. Meinshausen, M.; Smith, S.J.; Calvin, K.; Daniel, J.S.; Kainuma, M.L.T.; Lamarque, J.-F.; Matsumoto, K.; Montzka, S.A.; Raper, S.C.B.; Riahi, K.; et al. The RCP greenhouse gas concentrations and their extensions from 1765 to 2300. Clim. Chang. 2011, 109, 213–241. [Google Scholar] [CrossRef] [Green Version]
  24. Bowles, T.M.; Atallah, S.S.; Campbell, E.E.; Gaudin, A.C.M.; Wieder, W.R.; Grandy, A.S. Addressing agricultural nitrogen losses in a changing climate. Nat. Sustain. 2018, 1, 399–408. [Google Scholar] [CrossRef]
  25. Kaye, J.P.; Quemada, M. Using cover crops to mitigate and adapt to climate change. A review. Agron. Sustain. Dev. 2017, 37, 4. [Google Scholar] [CrossRef]
  26. Abdalla, M.; Hastings, A.; Cheng, K.; Yue, Q.; Chadwick, D.; Espenberg, M.; Truu, J.; Rees, R.M.; Smith, P. A critical review of the impacts of cover crops on nitrogen leaching, net greenhouse gas balance and crop productivity. Glob. Chang. Biol. 2019, 25, 2530–2543. [Google Scholar] [CrossRef] [Green Version]
  27. Basche, A.D.; Kaspar, T.C.; Archontoulis, S.V.; Jaynes, D.B.; Sauer, T.J.; Parkin, T.B.; Miguez, F.E. Soil water improvements with the long-term use of a winter rye cover crop. Agric. Water Manag. 2016, 172, 40–50. [Google Scholar] [CrossRef] [Green Version]
  28. Tribouillois, H.; Constantin, J.; Justes, E. Cover crops mitigate direct greenhouse gases balance but reduce drainage under climate change scenarios in temperate climate with dry summers. Glob. Chang. Biol. 2018, 24, 2513–2529. [Google Scholar] [CrossRef] [PubMed]
  29. Malone, R.W.; Jaynes, D.B.; Kaspar, T.C.; Thorp, K.R.; Kladivko, E.J.; Ma, L.; James, D.E.; Singer, J.; Morin, X.K.; Searchinger, T. Cover crops in the upper midwestern United States: Simulated effect on nitrate leaching with artificial drainage. J. Soil Water Conserv. 2014, 69, 292–305. [Google Scholar] [CrossRef] [Green Version]
  30. Chmielewski, F.-M.; Köhn, W. Impact of weather on yield components of winter rye over 30 years. Agric. For. Meteorol. 2000, 102, 253–261. [Google Scholar] [CrossRef]
  31. Huhtamaa, H.; Helama, S.; Holopainen, J.; Rethorn, C.; Rohr, C. Crop yield responses to temperature fluctuations in 19th century Finland: Provincial variation in relation to climate and tree-rings. Boreal Environ. Res. 2015, 20, 707–723. [Google Scholar] [CrossRef]
  32. Peltonen-Sainio, P.; Hakala, K.; Jauhiainen, L. Climate-induced overwintering challenges for wheat and rye in northern agriculture. Acta Agric. Scand. Sect. B Soil Plant Sci. 2011, 61, 75–83. [Google Scholar] [CrossRef]
  33. Dier, M.; Sickora, J.; Erbs, M.; Weigel, H.-J.; Zörb, C.; Manderscheid, R. Positive effects of free air CO2 enrichment on N remobilization and post-anthesis N uptake in winter wheat. Field Crops Res. 2019, 234, 107–118. [Google Scholar] [CrossRef]
  34. Gillette, K.L.; Malone, R.W.; Kaspar, T.C.; Ma, L.; Parkin, T.B.; Jaynes, D.B.; Fang, Q.X.; Hatfield, J.L.; Feyereisen, G.W.; Kersebaum, K.C. N loss to drain flow and N2O emissions from a corn-soybean rotation with winter rye. Sci. Total Environ. 2018, 618, 982–997. [Google Scholar] [CrossRef]
  35. Lobell, D.B.; Schlenker, W.; Costa-Roberts, J. Climate trends and global crop production since 1980. Science 2011, 333, 616–620. [Google Scholar] [CrossRef] [Green Version]
  36. Schlenker, W.; Roberts, M.J. Nonlinear temperature effects indicate severe damages to U.S. crop yields under climate change. Proc. Natl. Acad. Sci. USA 2009, 106, 15594–15598. [Google Scholar] [CrossRef] [Green Version]
  37. Lee, S.; Sadeghi, A.M.; Yeo, I.-Y.; McCarty, G.W.; Hively, W.D. Assessing the impacts of future climate conditions on the effectiveness of winter cover crops in reducing nitrate loads into the Chesapeake Bay watersheds using the SWAT model. Trans. ASABE 2017, 60, 1939–1955. [Google Scholar] [CrossRef]
  38. Mehan, S.; Aggarwal, R.; Gitau, M.W.; Flanagan, D.C.; Wallace, C.W.; Frankenberger, J.R. Assessment of hydrology and nutrient losses in a changing climate in a subsurface-drained watershed. Sci. Total Environ. 2019, 688, 1236–1251. [Google Scholar] [CrossRef] [PubMed]
  39. Islam, A.; Ahuja, L.R.; Garcia, L.A.; Ma, L.; Saseendran, A.S.; Trout, T.J. Modeling the impacts of climate change on irrigated corn production in the Central Great Plains. Agric. Water Manag. 2012, 110, 94–108. [Google Scholar] [CrossRef]
  40. Ko, J.; Ahuja, L.R.; Saseendran, S.A.; Green, T.R.; Ma, L.; Nielsen, D.C.; Walthall, C.L. Climate change impacts on dryland cropping systems in the Central Great Plains, USA. Clim. Chang. 2012, 111, 445–472. [Google Scholar] [CrossRef]
  41. Ma, L.; Ahuja, L.R.; Islam, A.; Trout, T.J.; Saseendran, S.A.; Malone, R.W. Modeling yield and biomass responses of maize cultivars to climate change under full and deficit irrigation. Agric. Water Manag. 2017, 180, 88–98. [Google Scholar] [CrossRef]
  42. Malone, R.W.; Herbstritt, S.; Ma, L.; Richard, T.L.; Cibin, R.; Gassman, P.W.; Zhang, H.H.; Karlen, D.L.; Hatfield, J.L.; Obrycki, J.F.; et al. Corn stover harvest N and energy budgets in central Iowa. Sci. Total Environ. 2019, 663, 776–792. [Google Scholar] [CrossRef]
  43. Li, L.; Malone, R.W.; Ma, L.; Kaspar, T.C.; Jaynes, D.B.; Saseendran, S.A.; Thorp, K.R.; Yu, Q.; Ahuja, L.R. Winter cover crop effects on nitrate leaching in subsurface drainage as simulated by RZWQM-DSSAT. Trans. ASABE 2008, 51, 1575–1583. [Google Scholar] [CrossRef]
  44. Qi, Z.; Helmers, M.J.; Malone, R.W.; Thorp, K.R. Simulating long-term impacts of winter rye cover crop on hydrologic cycling and nitrogen dynamics for a corn-soybean crop system. Trans. ASABE 2011, 54, 1575–1588. [Google Scholar] [CrossRef]
  45. Parkin, T.B.; Kaspar, T.C.; Jaynes, D.B.; Moorman, T.B. Rye cover crop effects on direct and indirect nitrous oxide emissions. SSSAJ 2016, 80, 1551–1559. [Google Scholar] [CrossRef]
  46. Malone, R.W.; Meek, D.W.; Hatfield, J.L.; Mann, M.E.; Jaquis, R.J.; Ma, L. Quasi-biennial corn yield cycles in Iowa. Agric. For. Meteorol. 2009, 149, 1087–1094. [Google Scholar] [CrossRef]
  47. Brekke, L.; Thrasher, B.L.; Maurer, E.P.; Pruitt, T. Downscaled CMIP3 and CMIP5 Climate Projections: Release of Downscaled CMIP5 Climate Projections, Comparison with Preceding Information, and Summary of User Needs; U.S. Dep. Interior Bur. Reclam. Tech. Serv. Cent.: Denver, CO, USA, 2013.
  48. Garbrecht, J.D.; Zhang, X.C. Soil erosion from winter wheat cropland under climate change in central Oklahoma. Appl. Eng. Agric. 2015, 439–454. [Google Scholar] [CrossRef]
  49. Coffey, R.; Butcher, J.; Benham, B.; Johnson, T. Modeling the effects of future hydroclimatic conditions on microbial water quality and management practices in two agricultural watersheds. Trans. ASABE 2020, 63, 753–770. [Google Scholar] [CrossRef]
  50. Renkenberger, J.; Montas, H.; Leisnham, P.T.; Chanse, V.; Shirmohammadi, A.; Sadeghi, A.M.; Brubaker, K.; Rockler, A.; Hutson, T.; Lansing, D. Climate change impact on critical source area identification in a Maryland watershed. Trans. ASABE 2016, 59, 1803–1819. [Google Scholar] [CrossRef]
  51. Schmidt, M.L.; Sarkar, S.; Butcher, J.B.; Johnson, T.E.; Julius, S.H. Agricultural best management practice sensitivity to changing air temperature and precipitation. Trans. ASABE 2019, 62, 1021–1033. [Google Scholar] [CrossRef]
  52. Intergovernmental Panel on Climate Change. Climate Change 2013—The Physical Science Basis; Intergovernmental Panel on Climate Change, Ed.; Cambridge University Press: Cambridge, UK, 2014. [Google Scholar]
  53. Hausfather, Z.; Peters, G.P. Emissions—The ‘business as usual’ story is misleading. Nature 2020, 577, 618–620. [Google Scholar] [CrossRef]
  54. Moss, R.H.; Edmonds, J.A.; Hibbard, K.A.; Manning, M.R.; Rose, S.K.; Van Vuuren, D.P.; Carter, T.R.; Emori, S.; Kainuma, M.; Kram, T.; et al. The next generation of scenarios for climate change research and assessment. Nature 2010, 463, 747–756. [Google Scholar] [CrossRef] [PubMed]
  55. Ahmad, I.; Ahmad, B.; Boote, K.; Hoogenboom, G. Adaptation strategies for maize production under climate change for semi-arid environments. Eur. J. Agron. 2020, 115, 126040. [Google Scholar] [CrossRef]
  56. Garbrecht, J.D.; Zhang, J.X. Generating synthetic daily precipitation realizations for seasonal precipitation forecasts. J. Hydrol. Eng. 2014, 19, 252–264. [Google Scholar] [CrossRef]
  57. Garbrecht, J.D.; Busteed, P.R. SYNTOR: A Synthetic Weather Generator; USDA: Washington, DC, USA, 2016.
  58. Ricke, K.L.; Caldeira, K. Maximum warming occurs about one decade after a carbon dioxide emission. Environ. Res. Lett. 2014, 9, 124002. [Google Scholar] [CrossRef]
  59. Zickfeld, K.; Herrington, T. The time lag between a carbon dioxide emission and maximum warming increases with the size of the emission. Environ. Res. Lett. 2015, 10. [Google Scholar] [CrossRef]
  60. Malone, R.W.; Obrycki, J.F.; Karlen, D.L.; Ma, L.; Kaspar, T.C.; Jaynes, D.B.; Parkin, T.B.; Lence, S.H.; Feyereisen, G.W.; Fang, Q.X.; et al. Harvesting fertilized rye cover crop: Simulated revenue, net energy, and drainage nitrogen loss. Agric. Environ. Lett. 2018, 3, 170041. [Google Scholar] [CrossRef] [Green Version]
  61. Craft, K.J.; Helmers, M.J.; Malone, R.W.; Pederson, C.H.; Schott, L.R. Effects of subsurface drainage systems on water and nitrogen footprints simulated with RZWQM2. Trans. ASABE 2018, 61, 245–261. [Google Scholar] [CrossRef]
  62. Shapiro, S.S.; Wilk, M.B. An analysis of variance test for normality (complete samples). Biometrika 1965, 52, 591. [Google Scholar] [CrossRef]
  63. Wilcoxon, F. Individual comparisons of grouped data by ranking methods. J. Econ. Entomol. 1946, 39, 269–270. [Google Scholar] [CrossRef]
  64. Sanford, W.E.; Selnick, D.L. Estimation of evapotranspiration across the conterminous United States using a regression with climate and land-cover data. JAWRA 2012, 49, 217–230. [Google Scholar] [CrossRef] [Green Version]
  65. Thorp, K.R.; Malone, R.W.; Jaynes, D.B. Simulating long-term effects of nitrogen fertilizer application rates on corn yield and nitrogen dynamics. Trans. ASABE 2007, 50, 1287–1303. [Google Scholar] [CrossRef] [Green Version]
  66. Basche, A.D.; Archontoulis, S.V.; Kaspar, T.C.; Jaynes, D.B.; Parkin, T.B.; Miguez, F.E. Simulating long-term impacts of cover crops and climate change on crop production and environmental outcomes in the Midwestern United States. Agric. Ecosyst. Environ. 2016, 218, 95–106. [Google Scholar] [CrossRef] [Green Version]
  67. Abdalla, M.; Jones, M.; Smith, P.; Williams, M. Nitrous oxide fluxes and denitrification sensitivity to temperature in Irish pasture soils. Soil Use Manag. 2009, 25, 376–388. [Google Scholar] [CrossRef]
  68. Butterbach-Bahl, K.; Dannenmann, M. Denitrification and associated soil N2O emissions due to agricultural activities in a changing climate. Curr. Opin. Environ. Sustain. 2011, 3, 389–395. [Google Scholar] [CrossRef]
  69. National Academy of Engineering Manage the Nitrogen Cycle. Available online: http://www.engineeringchallenges.org/challenges/nitrogen.aspx (accessed on 9 May 2020).
  70. Hunter, M.C.; Smith, R.G.; Schipanski, M.E.; Atwood, L.W.; Mortensen, D.A. Agriculture in 2050: Recalibrating Targets for Sustainable Intensification. Bioscience 2017, 67, 386–391. [Google Scholar] [CrossRef] [Green Version]
  71. Tilman, D.; Balzer, C.; Hill, J.; Befort, B.L. Global food demand and the sustainable intensification of agriculture. Proc. Natl. Acad. Sci. USA 2011, 108, 20260–20264. [Google Scholar] [CrossRef] [PubMed] [Green Version]
  72. Malone, R.W.; Kersebaum, K.C.; Kaspar, T.C.; Ma, L.; Jaynes, D.B.; Gillette, K.L. Winter rye as a cover crop reduces nitrate loss to subsurface drainage as simulated by HERMES. Agric. Water Manag. 2017, 184, 156–169. [Google Scholar] [CrossRef]
  73. Arnold, J.G.; Youssef, M.A.; Yen, H.; White, M.J.; Sheshukov, A.Y.; Sadeghi, A.M.; Moriasi, D.N.; Steiner, J.L.; Amatya, D.M.; Skaggs, R.W.; et al. Hydrological processes and model representation: Impact of soft data on calibration. Trans. ASABE 2015, 58, 1637–1660. [Google Scholar] [CrossRef]
  74. Malone, R.W.; Yagow, G.; Baffaut, C.; Gitau, M.W.; Qi, Z.; Amatya, D.M.; Parajuli, P.B.; Bonta, J.V.; Green, T.R. Parameterization guidelines and considerations for hydrologic models. Trans. ASABE 2015, 58, 1681–1703. [Google Scholar] [CrossRef] [Green Version]
  75. Moriasi, D.N.; Zeckoski, R.W.; Arnold, J.G.; Baffaut, C.; Malone, R.W.; Daggupati, P.; Guzman, J.A.; Saraswat, D.; Yuan, Y.; Wilson, B.N.; et al. Hydrologic and water quality models: Key calibration and validation topics. Trans. ASABE 2015, 58, 1609–1618. [Google Scholar] [CrossRef]
Figure 1. Monthly temperature and precipitation (a) under baseline (BL), along with temperature (b) and precipitation (c) changes under the six different general circulation models (GCMs). Wang et al. [16] average monthly changes are presented (b,c). Precipitation change is presented on a 100% scale (c), so if a GCM had a monthly change of 100% of baseline, it would equal baseline (BL) precipitation for that month. The GCM projections with the greatest average annual temperature change (b) are thick, solid, dark grey, and as the temperature changes become smaller, the lines become thinner, broken, and lighter grey. The abbreviations ave., precip., and temp. indicate average, precipitation, and temperature, respectively. Note that the top legend is for baseline conditions (a) and the bottom legend is for climate changes (b,c).
Sustainability 12 07630 g001
Figure 2. Average annual water budget (cm). BL indicates baseline conditions without projected climate change; NCC indicates no winter rye cover crop; CC indicates winter rye cover crop planted after corn and soybean harvest; ET indicates evapotranspiration; “trans” indicates transpiration; “evap” indicates evaporation; “precip” indicates precipitation; “drain” indicates artificial subsurface “tile” drainage; “other” indicates surface runoff and deep seepage. Values are the average of the two rotations (corn in odd or even years). The error bars for climate change scenarios are the overall range of the six climate models used.
Sustainability 12 07630 g002
Figure 3. Average annual mineral-N budget (kg N ha−1). BL indicates baseline conditions without projected climate change; NCC indicates no winter rye cover crop; CC indicates winter rye cover crop planted after corn and soybean harvest; “Total Nupt” is N uptake by corn, soybean, and winter rye; “Net min.” is net N mineralization; “Fix” is N fixation; “fert + dep” are sum of fertilizer and deposition from rainfall; “Soil Nupt” indicates soil derived N uptake (total crop N uptake-fertilizer added -N fixation-atmospheric deposition); “Drain” is subsurface drainage; “Denit” is denitrification; “Other” N losses include sum of runoff, deep seepage, miscellaneous N emissions other than N2O and adsorption into organic matter; “Soil change” is annual soil mineral N change. Note that the mineral-N budget balances for all treatments. For BL_NCC, as an example, 113.8 (net mineralization, or mineralization − immobilization) + 121.0 (fertilizer + deposition) + 108.0 (fixation) − 21.5 (denitrification) − 47.5 (tile drainage) − 260.6 (N uptake by crops) − 12.1 (other N losses) = 1.1 (soil change). Values are the average of the two rotations (corn in odd or even years). The error bars for climate change scenarios are the overall range of the six climate models used.
Sustainability 12 07630 g003
Figure 4. Average annual N loss to drainage. BL indicates baseline climate from 1991–2011; CC indicates cover crop scenarios; NCC indicates no cover crop scenarios. Values are averages of the two rotations (corn in odd or even years). The error bars are the range of the six GCMs. The GCMs with the lowest and highest N loss with CC are shown as × and + (HadGEM2-ES and GFDL-CM3). Baseline with no cover crop (BL_NCC) was multiplied by 0.59, to compare CC with the goal of reducing non-point source N loads to Iowa’s waterways 41% [9,10].
Sustainability 12 07630 g004
Table 1. Impact of individual climate variables on average annual rye growth and selected components of the associated N budgets. Monthly temperature and precipitation changes were the average of the six GCMs (Figure 1b,c). The all-scenario had all three climate-related variables adjusted (CO2, precip., temp.). Note that a smaller value for N stress indicates more N stress. Maximum and minimum RZWQM simulated N stress are 0 and 1.
ScenarioSpring Above Ground Rye Biomass
(Mg ha−1)
Spring Above Ground Rye N (kg N ha−1)Ave. Daily Rye N Stress in April and MayTotal Crop N Uptake
(kg N ha−1)
Net Mineral.
(kg N ha−1)
Fixation
(kg N ha−1)
Drain. N
(kg N ha−1)
Baseline2.653.80.79337.4157.0115.318.9
CO22.954.50.75374.0164.7147.519.2
Precip2.652.50.79332.5154.2116.522.3
Temp4.789.20.70397.0238.094.914.1
All4.780.30.64429.0234.8131.816.4

