Article

Optimizing Management Options through Empirical Modeling to Improve Pearl Millet Production for Semi-Arid and Arid Regions of Punjab, Pakistan

by
Asmat Ullah
1,*,
Ishfaq Ahmad
2,
Muhammad Habib ur Rahman
3,4,
Muhammad Waseem
5,*,
Muhammad Mohsin Waqas
6,
Muhammad Ashraf Bhatti
7 and
Ashfaq Ahmad
8
1
Directorate of Agronomy, Ayub Agricultural Research Institute, Faisalabad 38000, Punjab, Pakistan
2
Center for Climate Research and Development, COMSAT University, Islamabad 45550, Pakistan
3
Institute of Crop Science and Resource Conservation (INRES), Crop Science Group, University Bonn, 53113 Bonn, Germany
4
Department of Agronomy, MNS-University of Agriculture, Multan 60000, Punjab, Pakistan
5
Faculty of Agriculture and Environmental Sciences, University of Rostock, 18059 Rostock, Germany
6
Department of Agricultural Engineering, Khwaja Fareed University of Engineering and Information Technology, Rahim Yar Khan 64200, Pakistan
7
Soil and Water Testing Laboratory, Layyah 31200, Punjab, Pakistan
8
U.S.-Pakistan Centre for Advanced Studies in Agriculture and Food Security, University of Agriculture, Faisalabad 38000, Punjab, Pakistan
*
Authors to whom correspondence should be addressed.
Sustainability 2020, 12(18), 7715; https://0-doi-org.brum.beds.ac.uk/10.3390/su12187715
Submission received: 16 July 2020 / Revised: 10 September 2020 / Accepted: 11 September 2020 / Published: 18 September 2020

Abstract

:
Low planting density and deficient nitrogen application are factors that significantly decrease the yield of pearl millet in Pakistan. Optimizing their management is imperative in increasing millet production efficiency, especially with N fertilization, which can strongly affect hybrid millet response. Therefore, a field experiment was conducted at the Agronomic Research Area, University of Agriculture, Faisalabad (semi-arid) and the Agronomic Research Station, Karor Lal Eason, District Layyah (arid) over two summer seasons (2015 and 2016). The experiment consisted of three intra-row spacings (10, 15, and 20 cm) as main plots, while four nitrogen rates (0, 150, 200, and 250 kg ha−1) were randomized in subplots. The treatments were triplicated each year at both locations. The results depicted a significant change in millet crop development with a change in planting density and nitrogen rate in semi-arid and arid environments. The decrease in planting density resulted 1–2 day(s) delay in 50% flowering, milking, and maturity in semi-arid and arid region during both years of study. Higher dry matter accumulation was observed at medium planting density (15 cm intra-row spacing) and higher levels of nitrogen (250 kg ha−1) at both locations and growing seasons. The yield and attributed yield performed well with 15-cm plant spacing coupled with N application from 150–200 kg ha−1, and resulted in high nitrogen use efficiency (NUE). The results of the quadratic relationship and economic analysis linked with yield and nitrogen levels at 15-cm spacing showed 176 and 181 kg N ha−1 optimum levels (mean of years) against the economic N levels of 138 and 137 kg N ha−1 for Faisalabad and Layyah, respectively. The benefit–cost ratio (BCR) showed 31% and 45% mean excessive N at 200 and 250 kg N ha−1, in Faisalabad and Layyah, respectively. So, it is concluded that the optimum economic level of N should be sought out according to the soil and climate of an area for the production of hybrid pearl millet on a sustainable basis.

1. Introduction

Nitrogen is the major nutrient required to grow pearl millet. The crop shows variable phenological, growth, and yield responses to nitrogen applications [1,2]. Generally, it is considered that pearl millet is better adapted to poor soils with low nitrogen management [3]. However, the ideal conditions (fertile soil and irrigation) for this crop significantly increase millet’s production efficiency [4], and it responds favorably to higher fertilizer application. Moreover, higher plant density (15,000 to 20,000 pockets ha−1, three plants per pocket) and N application of 30 kg ha−1 in two splits result in a higher yield [5].
The recent trends in the consumption of pearl millet for animal and poultry feed in Pakistan have increased. It is projected that Pakistan will be the second-largest importer of pearl millet in the world after China in 2030, importing 61,000 tons of millet [6]. Therefore, it is assumed that greater inputs, particularly of N, coupled with high-yielding hybrids, are critical for efficient and economical production of pearl millet in Pakistan.
Nitrogen limitations affect the phenology of crops and reduce growth and grain yield [7]. The basal tillers of pearl millet are yield-contributing traits, and a deficiency of nitrogen can have a direct effect on them, thus decreasing the yield [8,9]. Therefore, management of nitrogen during early growth stages and prior to panicle initiation is useful to achieve higher production.
Research findings about different responses of pearl millet to fertilizer application have been reported in the literature, with optimum rates ranging from 0 to >150 kg ha−1 [10,11]. The form of N (NO3—N, NH4—N) and the mode and time of application also affect the nitrogen uptake and use efficiency. It was concluded that absorption of ammonium over nitrate may have negative effects on the growth and development of millet. Kumar and Kumar [12] quantified the nitrogen uptake at various growth phases. They concluded that pearl millet utilized a high N uptake, equal to 110 kg ha−1 at the fourth stage (vegetative), and reached the maximum uptake of 153 kg ha−1 at physiological maturity. The hybrids produce 10–15 kg of grains, utilizing one kg of nitrogen [13]. A dose of 40 kg N ha−1 was found to be economical for most of the millet-growing regions, but higher nitrogen applications are recommended in soil with adequate moisture. The high-yielding varieties and hybrids use N more efficiently than traditional cultivars [14,15]. The mechanism of utilizing higher doses of nitrogen in most cereals needs to be understood [16]. The overall optimum N utilization and use efficiency for grain pearl millet have not been reported for pearl millet production systems in Pakistan.
The soils of Pakistan are deficient in nitrogen, an important nutrient for the growth and development of crops [2,14,17]. An insufficient supply of nitrogen to crops limits the leaf area, number of leaves per plant, leaf size, and nitrogen concentration in all of the plant’s parts [18]. Because of this limitation, plants either maintain leaf size rather than maximizing leaf nitrogen or avoid maximizing leaf area. In either case, the crop dry matter and the yield potential of the crop are significantly affected.
Nitrogen use efficiency can easily identify soil and plant processes that contribute to nitrogen use [19,20]. The components of nitrogen use efficiency (NUE), such as nitrogen uptake and utilization, differ in diverse climatic conditions. Optimum growth, improved nitrogen use efficiency, and minimum nitrogen losses can be the results of effective nitrogen monitoring [21,22].
The impact of climate change is becoming harsh due to frequent extreme weather events [23,24]. It is imperative to evaluate crops for resilience against harsh climatic conditions by sustaining yields and soil fertility with efficient nutrient management [25,26,27,28,29]. Many researchers highlighted the role of nutrient management (right source of nutrient, right quantity, right placement at the right time) in improving the soil properties [30]. Studies with inconsistencies in optimum N levels should be evaluated through such analytic methods, which depict a clear picture of the N level with maximum economic return and minimum N losses in the sandy and loamy soils of Punjab, Pakistan. Therefore, experiments were conducted to study the interactions between N fertilizer rates and planting density in arid and semi-arid environments of Punjab, Pakistan.

2. Methodology

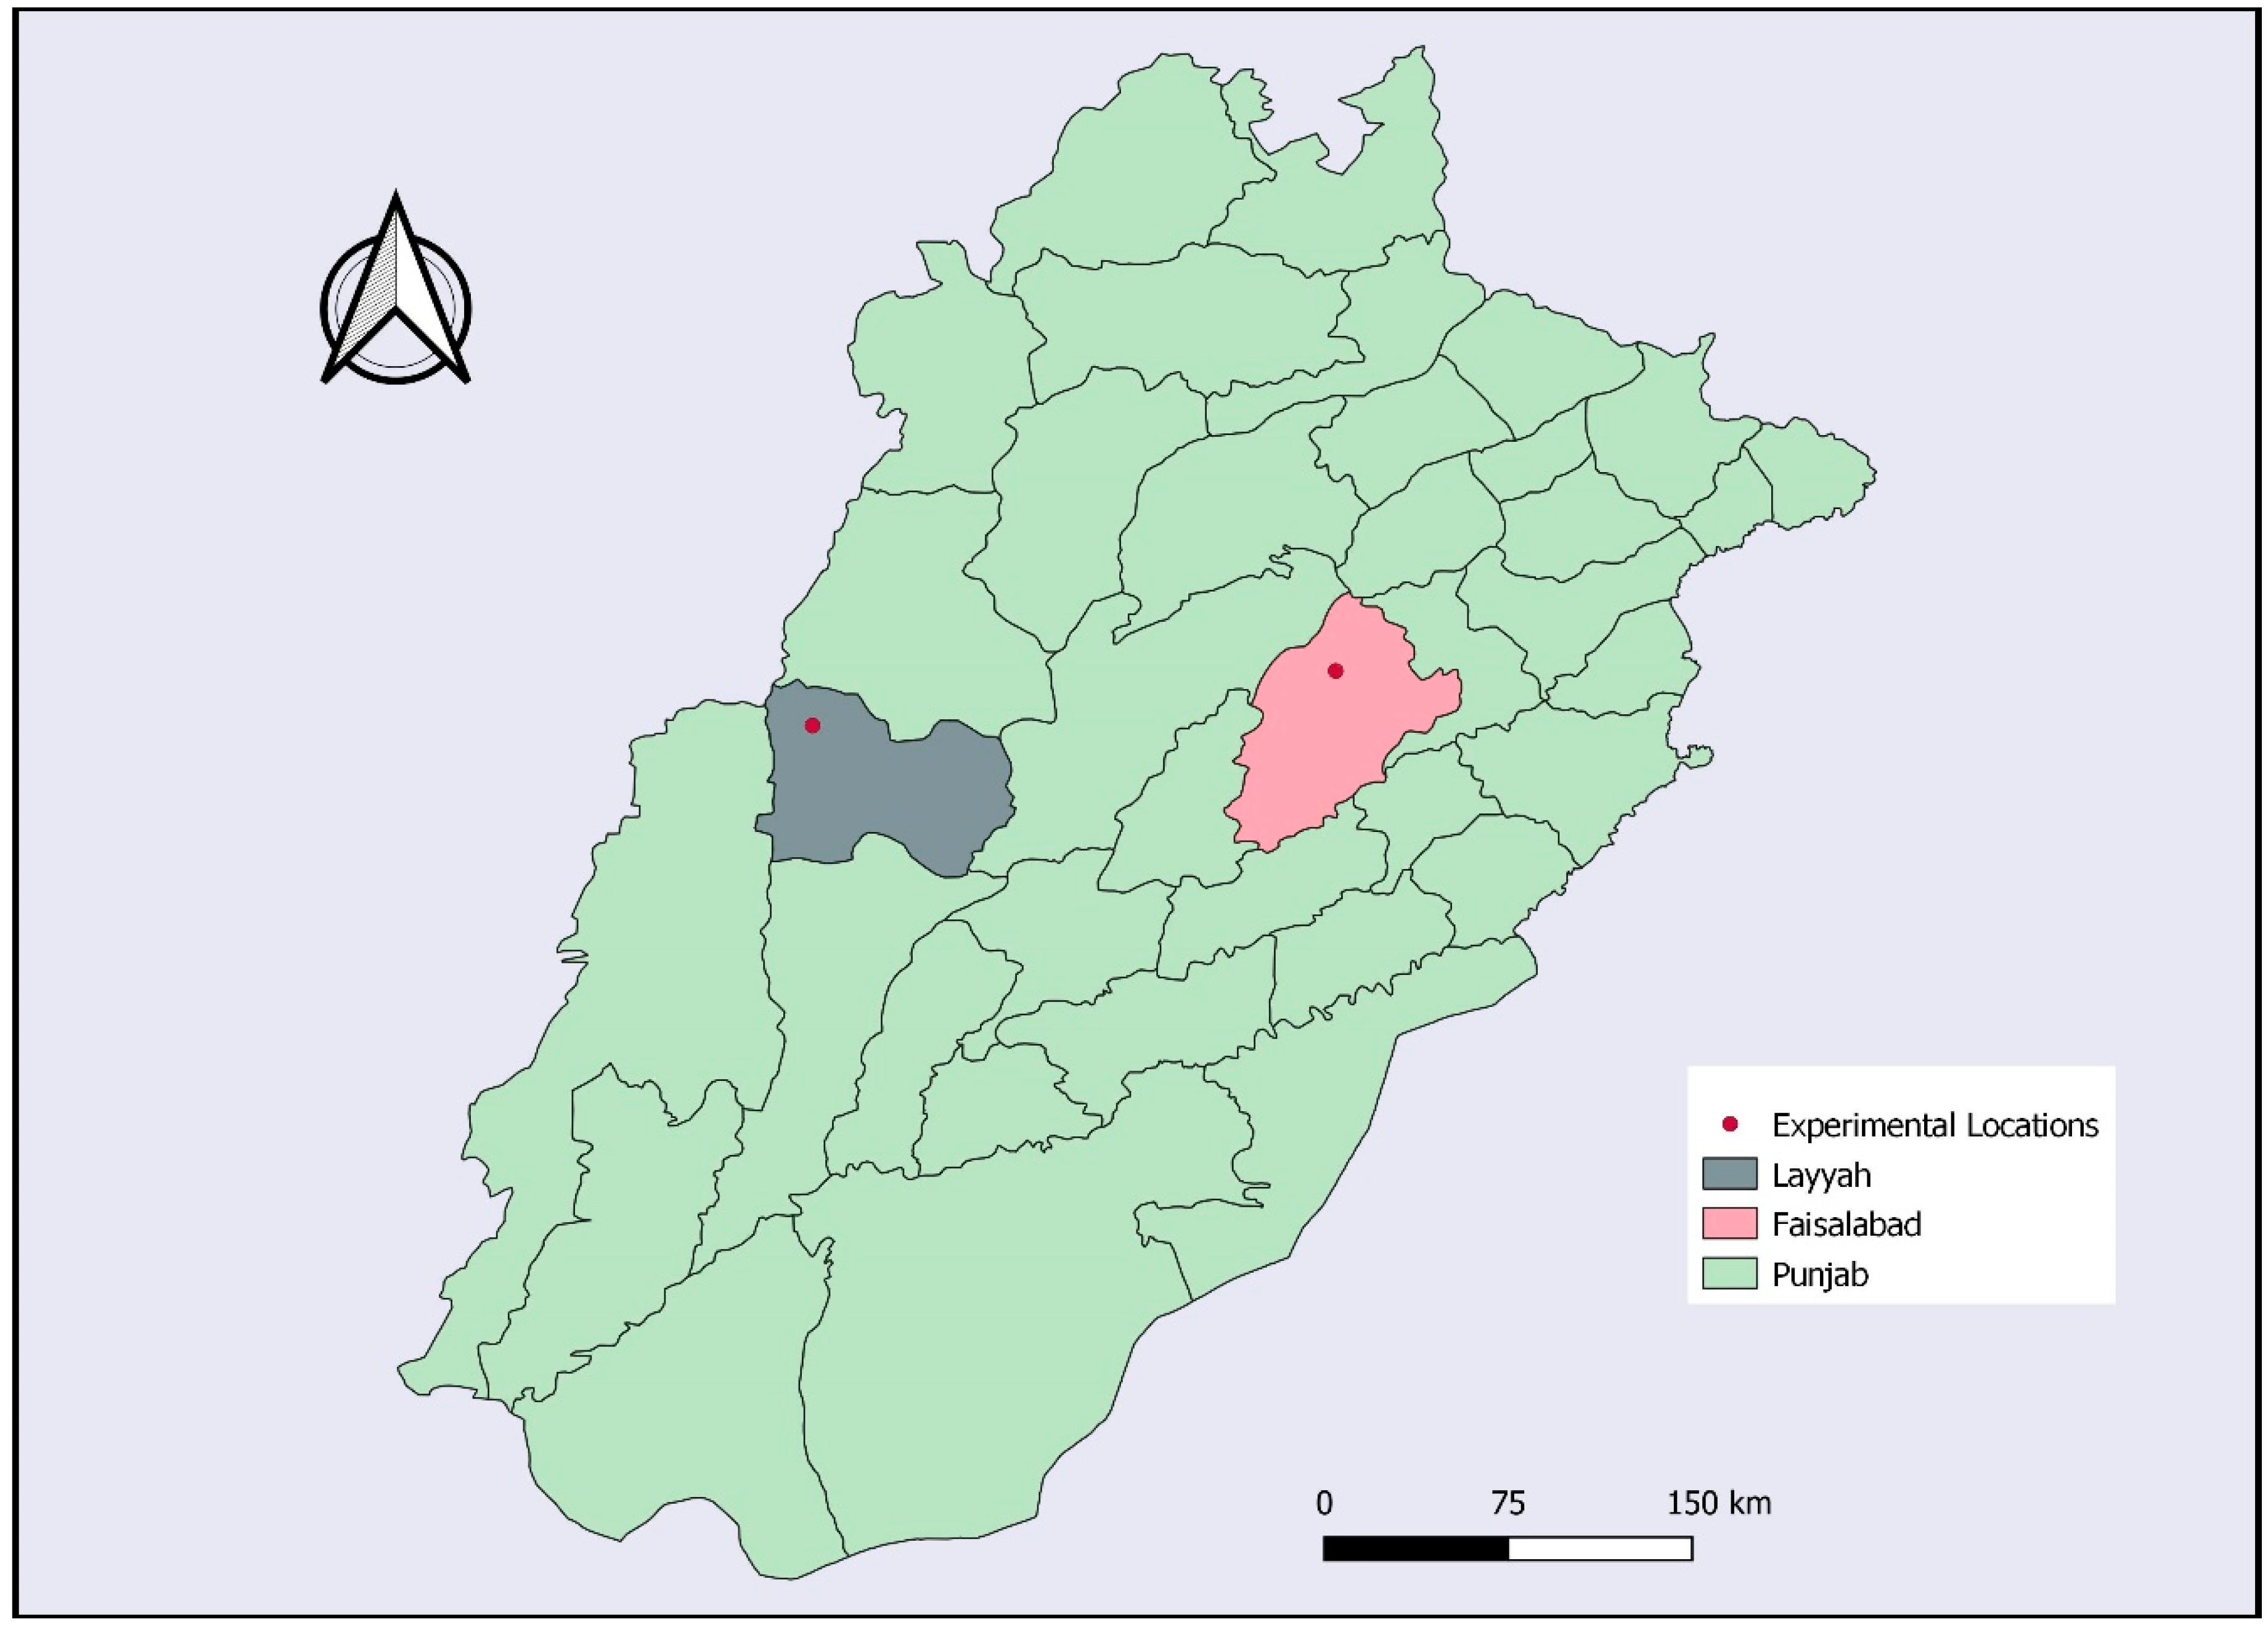
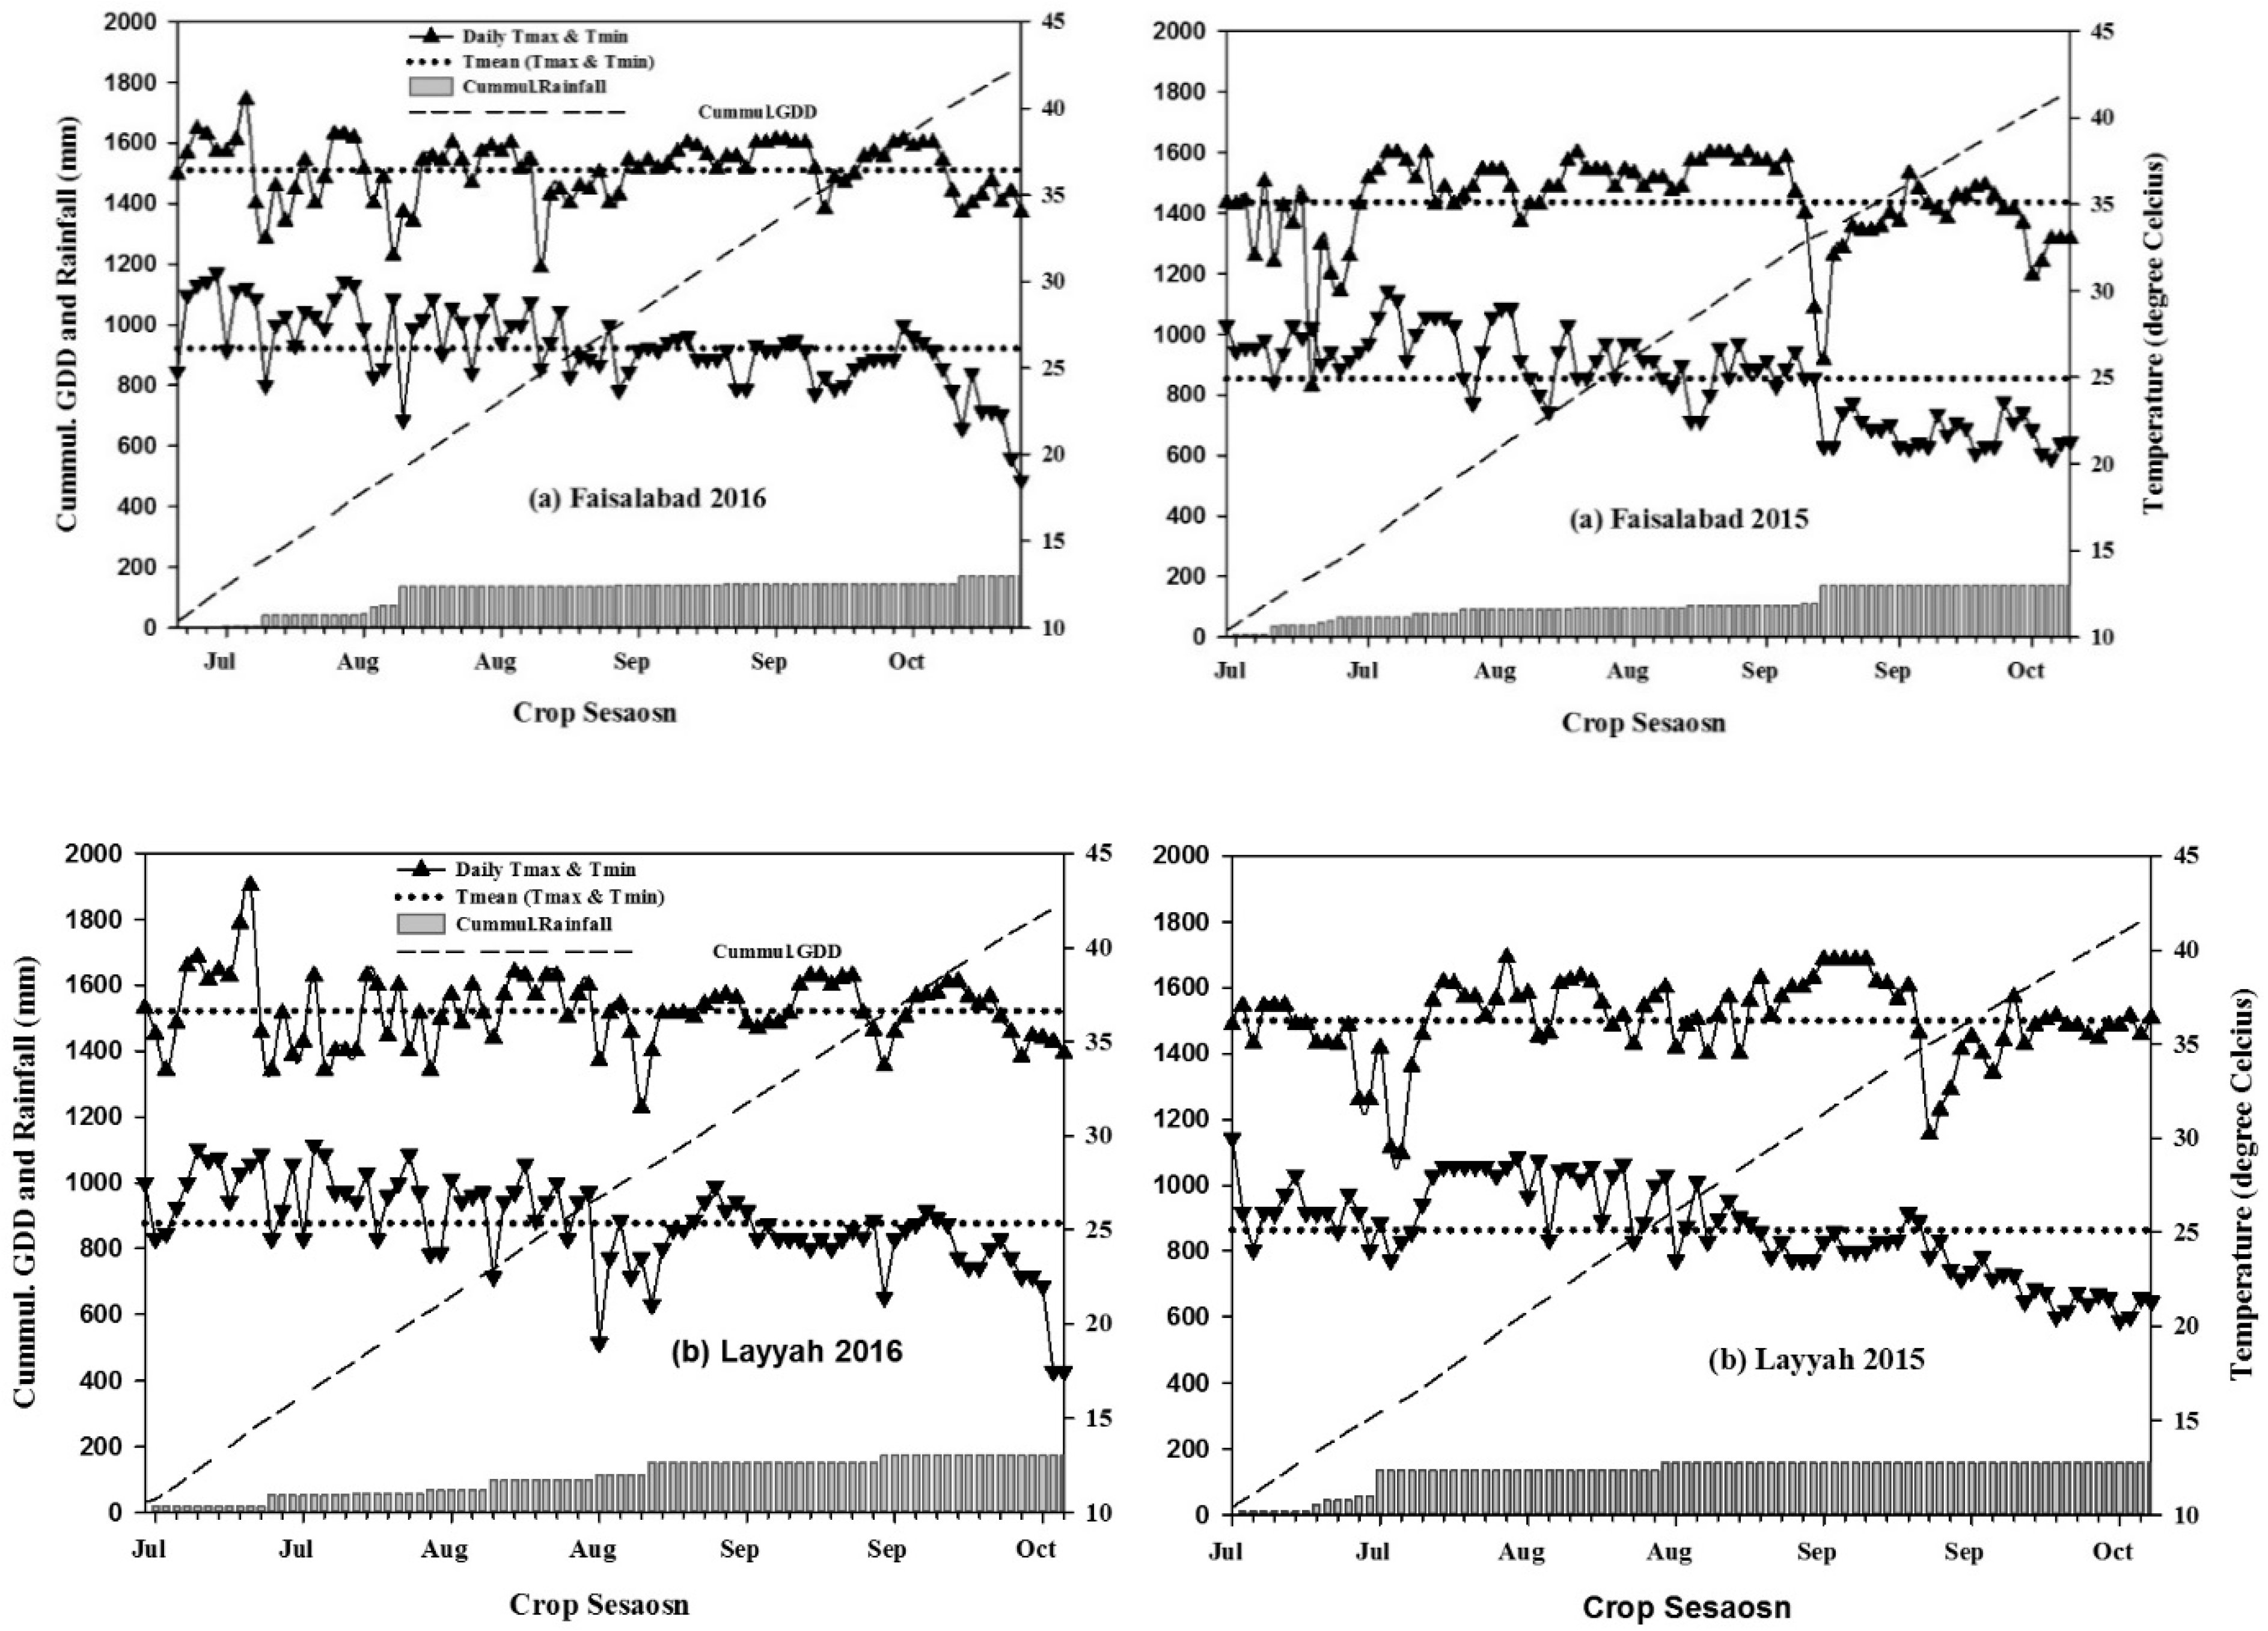
2.1. Experimental Sites and Weather

The geographical locations of arid (Layyah district, 31°13′, 70°58′ coordinates with an altitude of 158 m) and semi-arid (Faisalabad district; 31°26′, 73°04′ coordinates with an altitude of 184 m) environments were selected to conduct field experiments (Figure 1).
The climatic index was used to compare temperatures among sites, and was calculated as per standard procedure. The semi-arid location (Agronomy Research Area, University of Agriculture, Faisalabad, Punjab Pakistan) accumulated 1875 and 1940 heat units during the growing seasons of 2015 and 2016, respectively. The other experimental site (Agronomic Research Station—ARS, Karor Lal Eason, Layyah) accumulated 1916 and 1934 heat units in the years 2015 and 2016, respectively.
According to USDA classification, the soils were Lyallpur series (fine, loamy, silik, therm) for Faisalabad and Khumbi series (Sandy, mixed, hyper-thermic, typic torripsamments) for Layyah. The soil characteristics of selected sites are detailed in Table 1, while fertilizer application rates are shown in Table 2. For Faisalabad, the air temperature and rainfall data were retrieved from the Physiology section, Department of Agronomy, University of Agriculture, Faisalabad, located 1 km away from the experimental site. At ARS Karor (Layyah), the temperature and rainfall data were collected from the weather observatory of the Pakistan Meteorological Department (PMD), Islamabad, located at a 200-m distance from the experimental site (Figure 2).
Hybrid pearl millet (Poineer-86M86) was tested during the summer seasons of the years 2015 and 2016 at both locations. The pearl millet was sown in different fields at each location. The millet crop was planted after a wheat crop in Layyah, and after the harvesting of quinoa in Faisalabad.

2.2. Experimental Design and Treatments

Three plant spacings (10, 15 and 20 cm) and four nitrogen rates (0, 150, 200, 250 kg ha−1) were compared in a split-plot design with three replicates. The plant spacings were randomized in the main plot, while nitrogen rates were split in the sub-plots. The plot size of each subplot was 3.6 m × 1.8 m. The main plots were separated by a 1-m non-experimental area (N.E.A.) from the border side and subplots by a 0.75-m buffer. The interrow spacing distance was kept at 0.45 m using a single row hand drill. Good quality seeds (95% germination rate) were used at the rate of 6.25 kg ha−1. The same treatments were applied to the same plots in each summer season during 2015 and 2016 at both locations.

2.3. Soil Analysis

The soil was analyzed before the sowing of the crops. Ten representative samples from 0–15 cm and 15–30 cm depth were collected with the help of an auger using a diagonal technique. The soil samples of each depth were mixed separately to obtain a composite sample. The samples were air dried, crushed and sieved through a 2-mm stainless steel sieve. The samples were mixed thoroughly to obtain a composite sample, which was analyzed for its physico-chemical properties. Bouyoucos’ hydrometer method was used to determine the percentage of sand, silt and clay by using 1% hexametaphosphate as a dispersing agent. An international textural triangle was used to determine the textural class of the soil [31]. The soil pH was measured by taking a 250 g soil sample. The soil suspension was prepared with distilled water at a 1:1 ratio. It was shaken intermittently for an hour and soil pH was determined using a pH meter (Jenway-3510) [31,32]. Olsen’s method was applied to figure out the available phosphorus using a spectrophotometer. The Mehlich 1 (0.05 M HCL and 0.025M H2SO4) [33] method was used for the extraction of potassium. The potassium was determined using a flame photometer (PFP-7 Jenway). Mineralizable nitrogen was determined using the same approach presented by [34].

2.4. Determination of Field Capacity

The field capacity was determined by the method described by Karkanis (1983) [35]. The soil was placed in plastic rings on ceramic plates, which were connected to a high-pressure pump. The ceramic plate allows water to be extracted at the field capacity (−30 kpa). After the sample reached equilibrium at the required pressure, the samples were weighed and then oven dried at 105 °C. The oven-dried weight of the sample was observed, and the difference in the sample weight at equilibrium and after drying was calculated to determine the moisture percentage for the field capacity. It was determined that a 21% moisture content in the soil indicated the field capacity, while the permanent wilting point was observed at 9% moisture.

2.5. Crop Management

Prior to the start of the experiment (2015–2016), the field was cultivated, leveled and irrigated for the sowing of the crops. The crops were sown during the 1st week of July in the years 2015 and 2016 at both locations, when the soil attained its field capacity (21% moisture contents) after basal irrigation through flooding of 80 mm. Treated seeds were drilled in a single day within each year at both locations at a depth of 50 mm, with a row spacing of 0.45 m and plant spacing as per the planned treatments. The intra-row spacing was maintained through thinning when the seedlings attained a height of 0.15 m. Triple super phosphate of 57 kg P2O5 ha−1 was applied to supply phosphorus at the time of sowing. Urea was applied at a rate of 150 kg N ha−1 in all plots and in three splits, except for the treatments under study. The first split of nitrogen was applied at the time of sowing. The remaining 2/3 of N was side dressed into two splits (the first at tillering and the second at panicle initiation). The soil was sufficient in K; hence, K was not applied. The crops were irrigated once at tillering and then at the panicle initiation stage. The crops were harvested in the last week of September.

2.6. Observations

2.6.1. Crop Phenological Development

The days taken for panicle initiation, 50% flowering, milking and maturity were defined as millet development stages. The number of plants per plot−1 were counted in each treatment after germination. Ten plants from each plot were tagged to observe the calendar days and to attain the desired stage. The crop phenology data were recorded upon attaining the development stage. These stages were observed when 50% of the tagged plants showed visual signs of the stage.

2.6.2. Crop Growth and Yield Traits

Total dry matter (TDM): Total dry matter was recorded fortnightly in all plots through destructive sampling of the outer rows of plots [2]. The sampling was continued until the maturity of the crops was reached. Biomass production is directly proportional to the grain yield in most of the cases. However, sometimes high biomass can cause a reduction in yield due to the “hay effect”.
Lear area: The half meter-long row was harvested from each plot at ground level at twenty-day intervals from border plant rows (10.8 m2); the border rows (first half portion of a plot) were fixed for destructive sampling. The fresh weight of leaves and stems were weighed using Digital Electronic Balance. Component fractions of plants (leaf and stem) were dried in an oven (Model: WFO-600ND, EYELA windy oven, Ser. No. 66066114) at 70 ℃ for 48 h and the dry weight was taken. Leaf area was recorded using ImageJ, a computer-based application, using a 10 g sub-sample of green leaf laminae, as described in Ealson and Bloom, 2014 [36]. Leaf area index (m2m−2) was calculated as the ratio of leaf area to land area with twenty-day intervals [37].
Yield and yield components: Leaving appropriate borders (non-experimental area) around each plot, the center-row’s (second half portion) area (10.8 m2) of plots were harvested at maturity to record yield-related attributes. The harvested part was threshed manually, and final grain yield was calculated. Total biomass at harvest was obtained by adding both grain and biological yield. Plant population at harvest (m−2), plant height at maturity (cm), panicle (head) length (cm), panicle (head) weight (g), grain weight panicle−1 (head), 1000-grain weight (g) and grain yield (kg ha−1) were considered as yield attributes for pearl millet at both locations.
Agronomic assessments: Leaving appropriate borders (non-experimental area), the four rows of plants were harvested above ground level from each replicated plot at maturity. The panicles were separated and threshed. Both components (biomass and panicles) were weighed using a spring balance. Ten plants from each plot of treatments were selected for the estimation of different components (plant height, panicle length, panicle weight, grain weight panicle−1 and unit grain weight). The biomass and yield per plot were noted and then converted into kg per hectare using a mathematical unit method.

2.7. Weather Data

Standard weather data were obtained from each site using the nearest weather observatory. Daily maximum and minimum air temperature (°C), rainfall (mm) and daily sunshine hours (h) were provided by the weather station (Figure 2), while seasonal weather data for the crop period were recorded regularly from an observatory situated at a one-kilometer distance from the experimental site at Layyah (Figure 2).

2.8. Quadratic Response of Yield to Nitrogen

Regression analysis was carried out to study the response of millet grain yield to different nitrogen levels for three intra-row spacings. The quadratic equations were fitted to calculate the optimum nitrogen for different plant spacings. The relationships were plotted between observed grain yield and nitrogen levels for each plant spacing to set equations. The amount of nitrogen for the maximum grain yield (point of inflection) of millet was calculated for each intra-row spacing using the following formula by considering x as optimum nitrogen. The response of millet yield to N rates (0, 150, 200, 250 kg ha−1) at different plant spacings (10, 15, 20 cm) were described with a quadric response curve for each site, as in the following equation:
Y = a + bN + cN^2
where Y is the pearl millet yield (kg ha−1), N is the amount of fertilizer applied (kg N ha−1), and a, b and c are estimated parameters. Linear regressions were used to establish relationships among variables. A linear parallel curve analysis with grouped data was performed [38] to determine if the response to increasing nitrogen rate differed between intra-row spacings. The N rate required to reach maximum grain yield (NOptimum) was estimated using the fitted parameters of the quadratic model. The NOptimum rate was therefore calculated as described by [2]:
N o p t i m u m = b 2 ( a )
The economics of the experiments at Faisalabad and Layyah were analyzed using a simulated pearl millet grain yield. The input cost of intra-row spacings and nitrogen application levels were considered as variables for both years of study, while the rest of the inputs were considered as fixed costs. The cost of production and income from millet grain yield were calculated with each unit increase in nitrogen for three intra-row spacings. The benefit–cost ratio (BCR) was calculated to quantify the economically optimum level of nitrogen. The following formula was used:
B e n e f i t   C o s t   R a t i o   ( B C R ) = I n c o m e   ( d e r i v e d   f r o m   m i l l e t   g r a i n   y i e l d ) I n p u t   C o s t
while the amount of excessive nitrogen (%) was calculated by subtracting the economically optimum amount of nitrogen from the applied nitrogen for N200 and N250. The following formula was used, as described by [39]:
E x c e s s i v e   N   ( % ) = [ N i t r o g e n   ( a p p l i e d ) N i t r o g e n   ( o p t i m u m ) N i t r o g e n ( a p p l i e d ) ] × 100

2.9. Statistical Analysis

The variables under study were analyzed statistically as a split-plot design with three replications. The effects of different levels of plant spacing and nitrogen on measured variables were analyzed statistically by employing Fisher’s Analysis of Variance Technique and differences among treatment means were compared using the Honest Significant Difference (HSD) Test at a 5% probability level. Computer-based Statistix v10 software was used to perform the statistical analysis.

3. Results

3.1. Crop Development

3.1.1. Days to Panicle Initiation (PI)

Panicle initiation is the first indication of a reproductive phase in pearl millet crops. The results regarding days to panicle initiation are shown in Table 3. The results indicated significant differences in subplot effects under the conditions of Faisalabad and Layyah for the years 2015 and 2016, while nonsignificant effect were observed for the main factor under study (plant spacing) at both locations and crop seasons. Different nitrogen levels significantly affected the days to panicle initiation of pearl millet at Faisalabad and Layyah for the years 2015–2016. Pearl millet crops’ panicle initiation was delayed by increasing the nitrogen rate. The maximum days to panicle initiation were recorded upon application of 250 kg N ha−1 in 2015 (38) at Faisalabad and a similar trend was observed in the second year (2016) of experimentation. However, pearl millet crops took 37 days to panicle initiation in the year 2015 and 38 days in 2016 at Layyah. The interactive effect of plant spacing and nitrogen level was found to be nonsignificant at both locations and crop seasons.

3.1.2. Days to 50% Flowering

This is an important stage that determines the seed setting and grain filling in a panicle of millet. Main and subplot effects were found to be significant regarding days to flowering. Plant spacing had significant effect on the days taken to flowering for pearl millet in Faisalabad and Layyah in 2015 and 2016. The maximum number of days to flowering were observed at 20-cm plant spacing followed by 10-cm and 15-cm spacing. The delay in flowering with a 20-cm plant spacing might be due to an increase in tillers and wide intra-row spacing. However, there was no significant difference in days to flowering between 10-cm and 20-cm intra-row spacing at both locations and crop seasons. The nitrogen level significantly affected the days to flowering at Faisalabad and Layyah during crop seasons 2015 and 2016. The maximum delay in flowering (64) was observed in plots where 250 kg N ha−1 was applied in 2015 and 65 days in 2016 in Faisalabad, while the maximum delay was 62 days in 2015 and 66 days in 2016 at Layyah. This amount of nitrogen increased vegetative growth in millet and caused a delay in flowering, while flowering occurred much earlier where no nitrogen fertilizer was applied at both locations and in both years. So, an increase in nitrogen fertilizer gradually delayed the flowering of pearl millet at both location in the years 2015–2016. The results are depicted in Table 3. The interactive effects of intra-row spacing and nitrogen level were found to be nonsignificant in Faisalabad and Layyah during both years of study.

3.1.3. Days to Milking Stage

Milking stage is an important indication of grain formation. Significant effects of plant spacing were found on days to milking stage in Faisalabad and Layyah (Table 3). The plant spacing of 20 cm took more days to milking in 2015 (70) and 2016 (67) in Faisalabad, while 69 and 68 days were recorded in Layyah in 2015 and 2016, respectively. Nitrogen level had a highly significant effect regarding days to milking stage in pearl millet at both locations and crop seasons. An increase in nitrogen resulted in a delay in the milking stage of pearl millet. Maximum days to milking were recorded when 250 kg N ha−1 was applied in Faisalabad (73, 70) and Layyah (71, 70) during crop seasons 2015 and 2016, respectively. The interaction of intra-row spacing and nitrogen application were found to be nonsignificant during both years of study and at both locations.

3.1.4. Days to Maturity

Days to maturity indicate the life cycle of a crop in a season. The life cycle of millet can be affected by different stress conditions and limitations of agronomic factors. In this study, days to maturity were significantly affected by plant spacing and highly significant effects were found due to nitrogen applications on millet crops in Faisalabad and Layyah during experimental seasons 2015 and 2016. The days to maturity were high at 15 cm spacing followed by 10 cm and 15 cm intra-row spacings in 2015 and 2016 in Faisalabad and Layyah. Maximum days to maturity were observed in 2015 (95) and 2016 (92) in Faisalabad, while in the case of Layyah, significantly higher days to maturity were found in 2015 (93) and 2016 (96). The results are shown in Table 3. The interactive effects of intra-row spacing and nitrogen rate were found to be nonsignificant at both locations during crop seasons 2015 and 2016.

3.2. Crop Growth

3.2.1. Total Dry Matter Accumulation (kg ha−1)

Total dry matter accumulation was significantly affected by intra-row spacing and nitrogen application. The maximum amount of dry matter accumulated when millet was sown with an intra-row spacing of 15 cm in Faisalabad in 2015 (18,580 kg ha−1) and 2016 (18,907 kg ha−1) and in Layyah during crop seasons 2015 (18,879 kg ha−1) and 2016 (18,679 kg ha−1). The minimum amount of biomass was obtained at a plant spacing of 20 cm at both locations and in both years (2015–2016) of study, as shown in Table 3. Nitrogen level, as a subfactor, significantly affected the total dry matter accumulation during the 2015−16 crop season at both locations. Maximum biomass production was recorded at a nitrogen application of 250 kg ha−1, followed by 150 and 200 kg N ha−1 at Faisalabad in years 2015–2016, while all levels of nitrogen (150, 200, 250 kg ha−1) statistically increased the biomass of pearl millet. However, application of 250 kg N ha−1 gave higher biomass in year 2015 (19613 kg ha−1) and 2016 (19,558 kg ha−1) at Layyah. The treatment without application of nitrogen to pearl millet crop responded least in dry matter accumulation at both locations and years. So, the increase in nitrogen rate caused more dry matter accumulation in pearl millet. The interactions of intra-row spacing and nitrogen level showed nonsignificant effects at Faisalabad and Layyah in both years of study. The results of total dry matter accumulation are shown in Table 3.

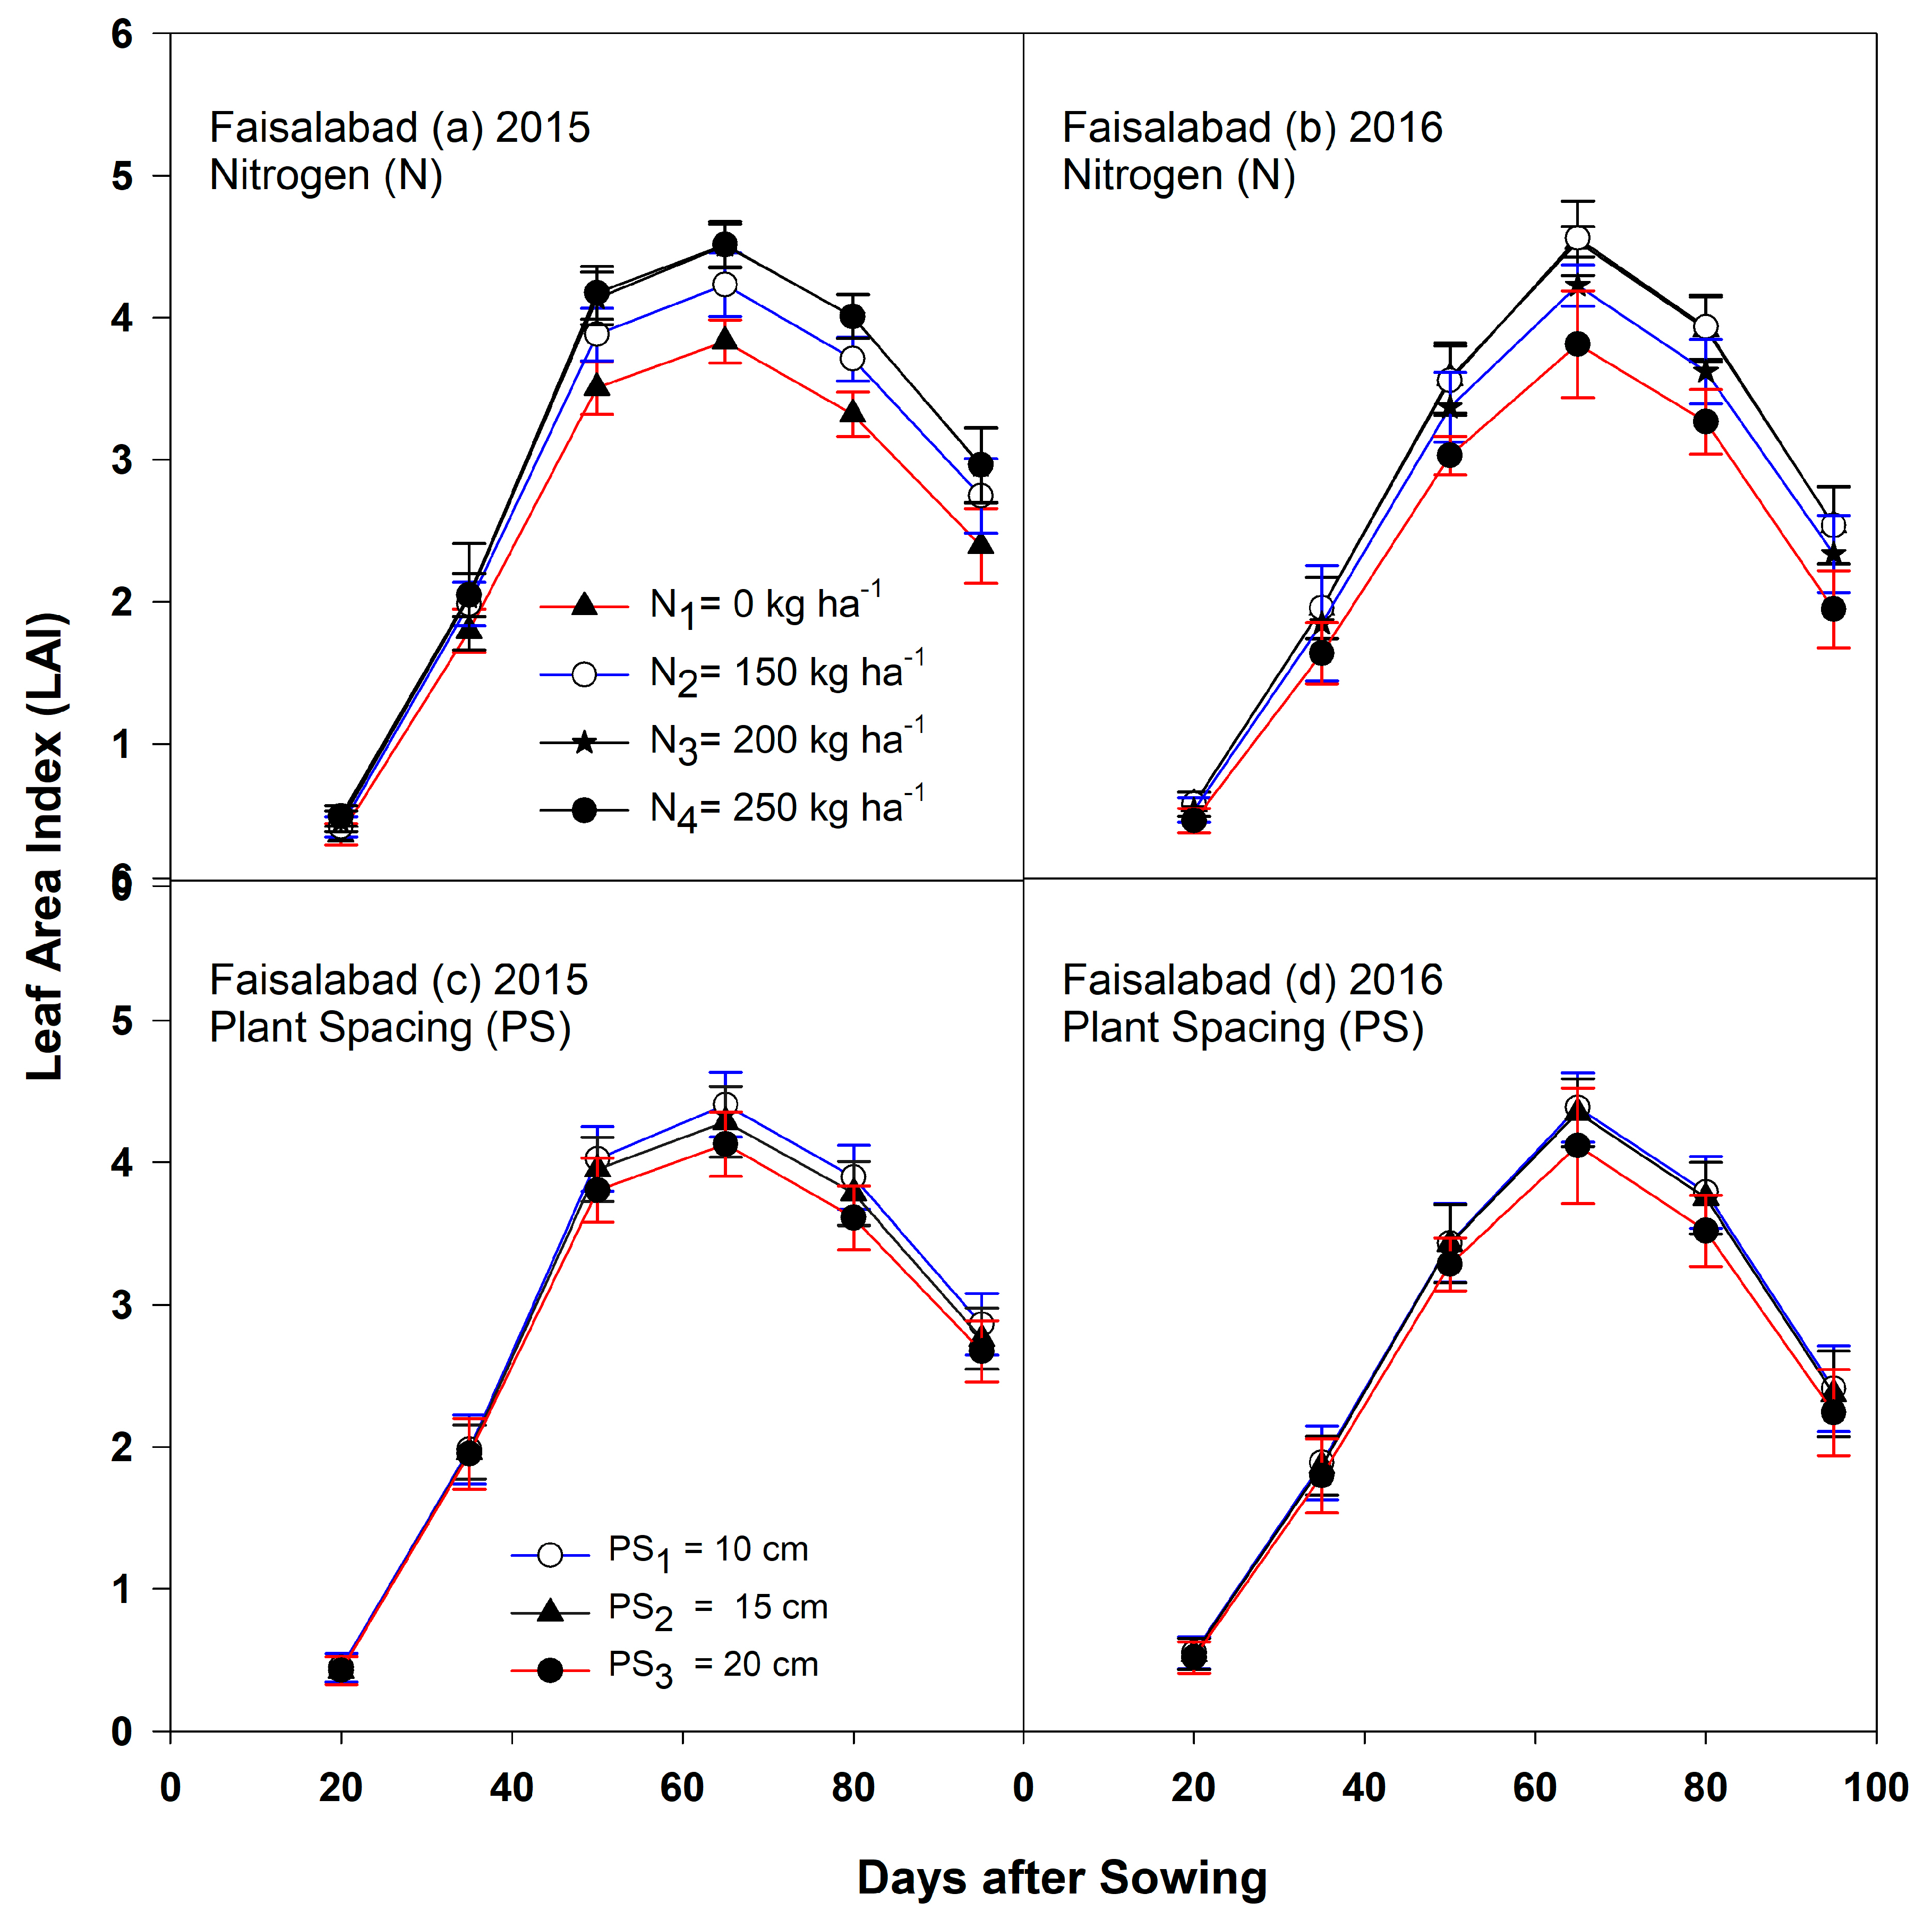
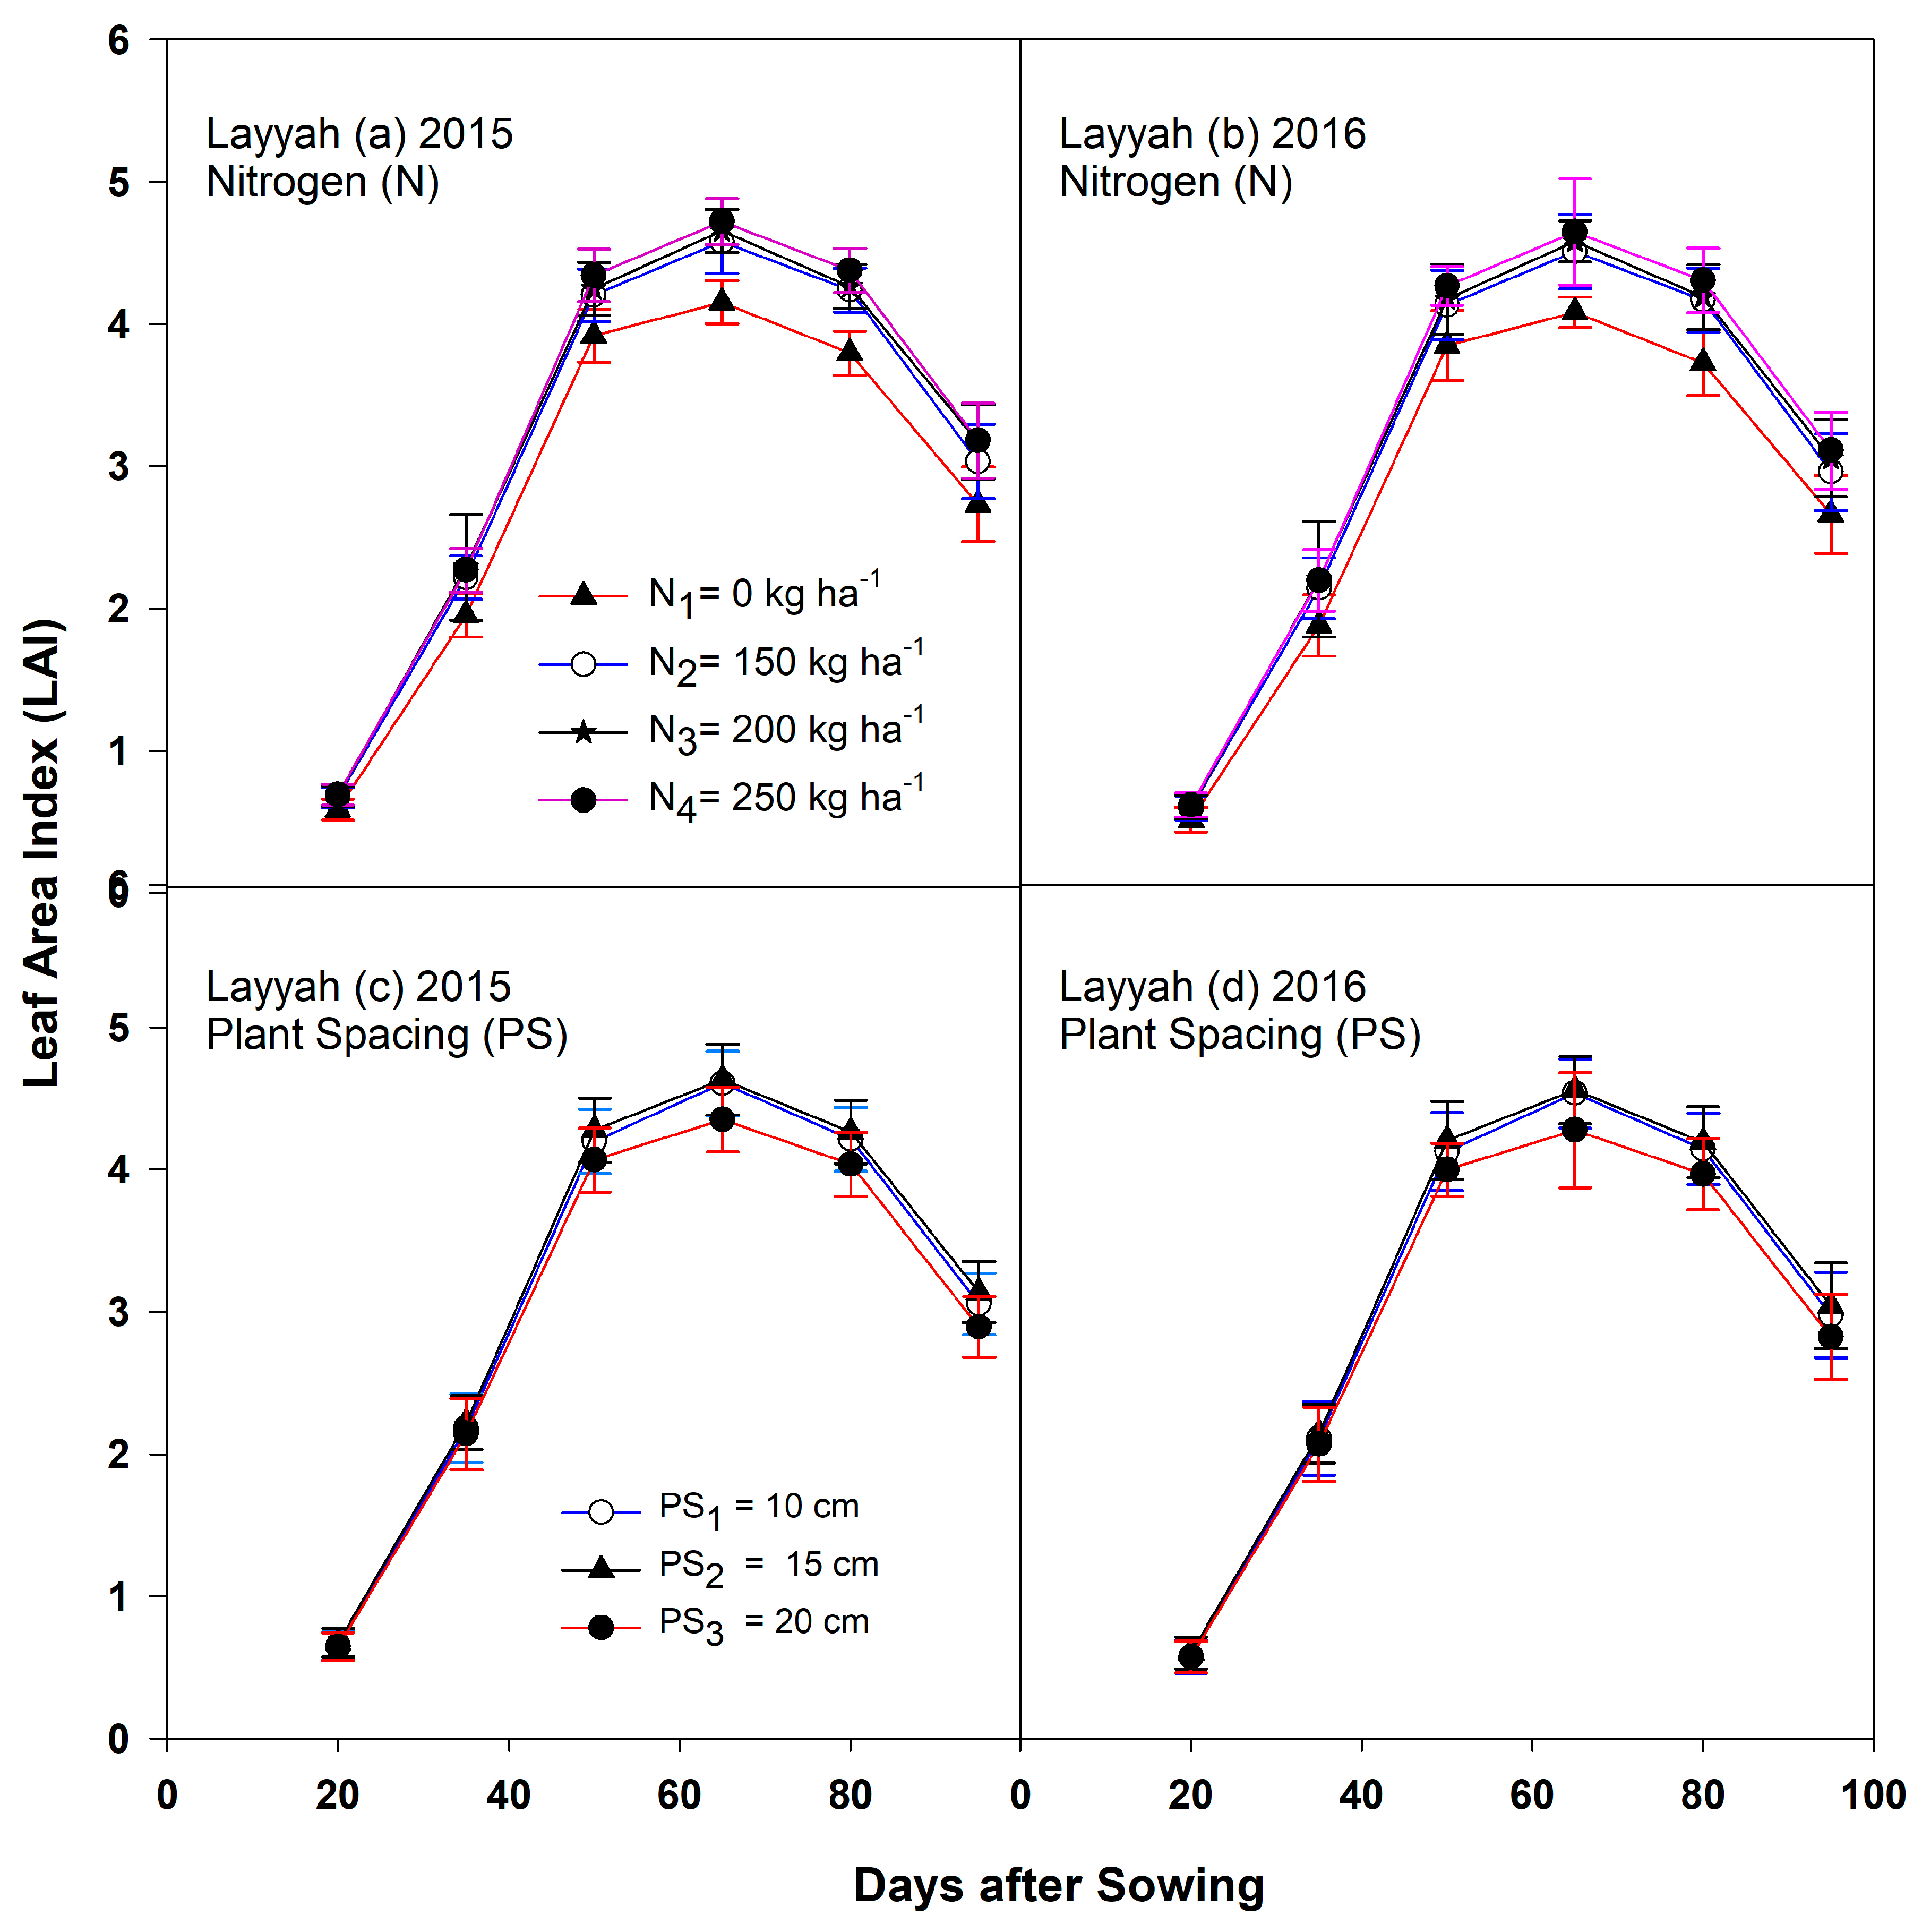
3.2.2. Leaf Area Index

Leaf area index is the outcome of leaf area over land area. It is directly linked with the biomass production of crops. Plant spacing and nitrogen level significantly affected the leaf area index under arid and semi-arid environments. The maximum leaf area index was observed at plant spacings of 15 cm, while the minimum was observed at 20 cm (Figure 3 and Figure 4). Highly significant effects were found due to the application of different nitrogen rates on pearl millet crops. The application of 250 kg N ha−1 gave a maximum leaf area index in year 2015 and 2016 at Faisalabad and Layyah. These effects are significantly on par with 200 kg N ha−1 at both locations and years. Contrary to main effects, the interactive effects of intra-row spacing and nitrogen rate did not significantly affect the leaf area index at both locations during crop seasons 2015 and 2016.

3.3. Yield and Yield Components

3.3.1. Number of Panicles (m−2) at Harvest

Plant spacing and nitrogen rate significantly affected the number of panicles (m−2) in Faisalabad and Layyah during 2015 and 2016. A high number of panicles were recorded at a plant spacing of 15 cm at both locations for both years of study. The maximum number of panicles (m−2) were attained when 150 kg N ha−1 was applied in Faisalabad and Layyah in 2015 (37, 36.8) and 2016 (37.7, 37.4), respectively, which were statistically on par with 200 and 250 kg N ha−1 (Table 4). The treatment without the application of nitrogen performed the worst in terms of the number of panicles produced (m−2) due to a smaller number of plants/tillers at both locations and years. The interactive effects of intra-row spacing and nitrogen level were found nonsignificant at both locations and crop seasons (2015 and 2016).

3.3.2. Plant Height (cm)

Plant height is the distance of the main photosynthetic tissue (excluding inflorescence) or the maximum stature a plant attains during its life cycle. It largely depends upon the nutrients applied to a crop. Plant spacing significantly affected the plant height. The maximum plant height was observed at a 15-cm intra-row spacing of millet at both locations in 2015 and 2016. However, the results showed that a lower plant height (200.51 cm) was observed in 2015 at Faisalabad and in 2016 at Layyah (200.27 cm). Similarly, the application of different nitrogen rates to millet crops significantly affected the plant height of millet in Faisalabad and Layyah during crop seasons 2015 and 2016. The plants’ stature was quite short when no nitrogen was applied at both locations and years. However, the recorded data showed that millet plants attained maximum height at a nitrogen applicate rate of 150 and 200 kg ha−1 at both locations and crop seasons. The results depict that an increase in nitrogen application beyond 200 kg ha−1 did not respond to an increase in plant height (Table 4).

3.3.3. Panicle Length (cm)

Millet panicle length determines the number of grains per panicle and, consequently, the millet yield. However, in case of this study, different three-plant spacings of millet did not significantly affect the panicle length in Faisalabad and Layyah in crop seasons 2015 and 2016. The application of nitrogen at different rates to millet significantly affected the panicle length at both locations and seasons. A greater panicle length was achieved with the application of nitrogen at a rate of 150 and 200 kg N ha−1. The increase in nitrogen beyond 200 kg ha−1 caused a decrease in the length of panicles due to the increase in the biomass of millet. The results are presented in Table 4. The interactive effect of intra-row spacing and nitrogen level did not affect panicle length significantly at both locations and years of study.

3.3.4. Panicle Weight (g)

This is the unit weight of panicles, including kernels and their parts, and directly contributes towards the grain yield of millet. A high panicle weight was obtained when millet crops were sown with 15-cm plant spacings in Faisalabad and Layyah in both years of study. The sub-plot effects of nitrogen rate significantly affected panicle weight with maximum weight (47.2 g) in 2015 and 47.4 g in 2016 at Faisalabad. While higher significant panicle weight was obtained from pearl millet in 2015 (47.1 g) and 2016 (50 g) at Layyah. These values were found statistically at par with 150 kg N ha−1 application at both locations and years. The minimum panicle weight was observed without application of nitrogen in pearl millet crop at both location and crop seasons. The interactive effects of intra-row spacing and nitrogen level did not affect significantly at Faisalabad and Layyah during crop season 2015 and 2016 (Table 4).

3.3.5. Kernel Weight per Panicle (g)

Kernel weight was significantly affected by intra-row spacing and nitrogen rate at both locations and crops seasons. High kernel weight per panicle was observed when millet crop was planted at 15 cm intra-row spacing in year 2015 (36 g) and 2016 (39.2 g) at Faisalabad. Similarly, 15 cm plant spacing gave high kernel weight (38.3 g) in year 2015 and 38.7 g in year 2016 at Layyah. The sub-plot effect of nitrogen application was found to be highly significant in Faisalabad and Layyah during crop seasons 2015 and 2016. The application of 200 kg N ha−1 gave a maximum kernel weight per panicle in 2015 (35.5 g) and 2016 (38.7 g) in Faisalabad, while 38 g and 38.2 g were obtained in 2015 and 2016, respectively, in Layyah. The interactive effect of plant spacing, and nitrogen application did not significantly affect kernel weight per panicle in the millet crops. These results are presented in Table 4.

3.3.6. Thousand-Grain Weight (g)

Thousand-grain weight is an important component of the grain yield of millet. This important parameter was significantly affected by plant spacing and nitrogen level. The plant spacing of 15 cm gave the highest 1000-grain weight in the year 2015 (9.3 g) in Faisalabad, while the same trend (10 g) was observed in the second year (2016) and second location in both years. Highly significant effects were found on 1000-grain weight for all nitrogen treatments. The application of 200 kg N ha−1 gave the highest 1000-grain weight (8.0 g, 9.4 g, 9.4 g, 8.9 g) in Faisalabad and Layyah in crop seasons 2015 and 2016, respectively (Table 4). The interactions of plant spacing and nitrogen level were not found to be significant in Faisalabad and Layyah during crop seasons 2015 and 2016.

3.3.7. Grain Yield (kg ha−1)

Grain yield is the economic return of a crop and the outcome of yield attributes. It is a major concern of farmers and the community, who want to increase the grain yield year on year. It was significantly affected by the intra-row spacing and nitrogen rate in Faisalabad and Layyah during both years of study. The maximum grain yield was threshed from the millet plots, where the crops were planted at 15-cm plant spacings in 2015 (2953 kg ha−1) and 2016 (3058 kg ha−1) in Faisalabad, while, in Layyah, the highest grain yield was obtained in 2015 (3113 kg ha−1) and 2016 (3063 kg ha−1), which is relatively more than Faisalabad. The grain yield obtained in Layyah during crop season 2015 (3113 kg ha−1) was statistically on par with the grain yield obtained from 10-cm plant spacings (2765 kg ha−1). The grain yield of millet responded significantly to the application of nitrogen at both locations and crop seasons. The maximum grain yield was obtained (3096, 3192 kg ha−1) in 2015 and 2016, respectively, in Faisalabad, while a similar trend was recorded in Layyah, with maximum yields of 3249 and 3194 kg ha−1 in 2015 and 2016, respectively (Table 4). The minimum grain yield was recorded in the treatment without the application of nitrogen. The treatment without the application of nitrogen gave an almost 50% lower grain yield compared to other treatments.

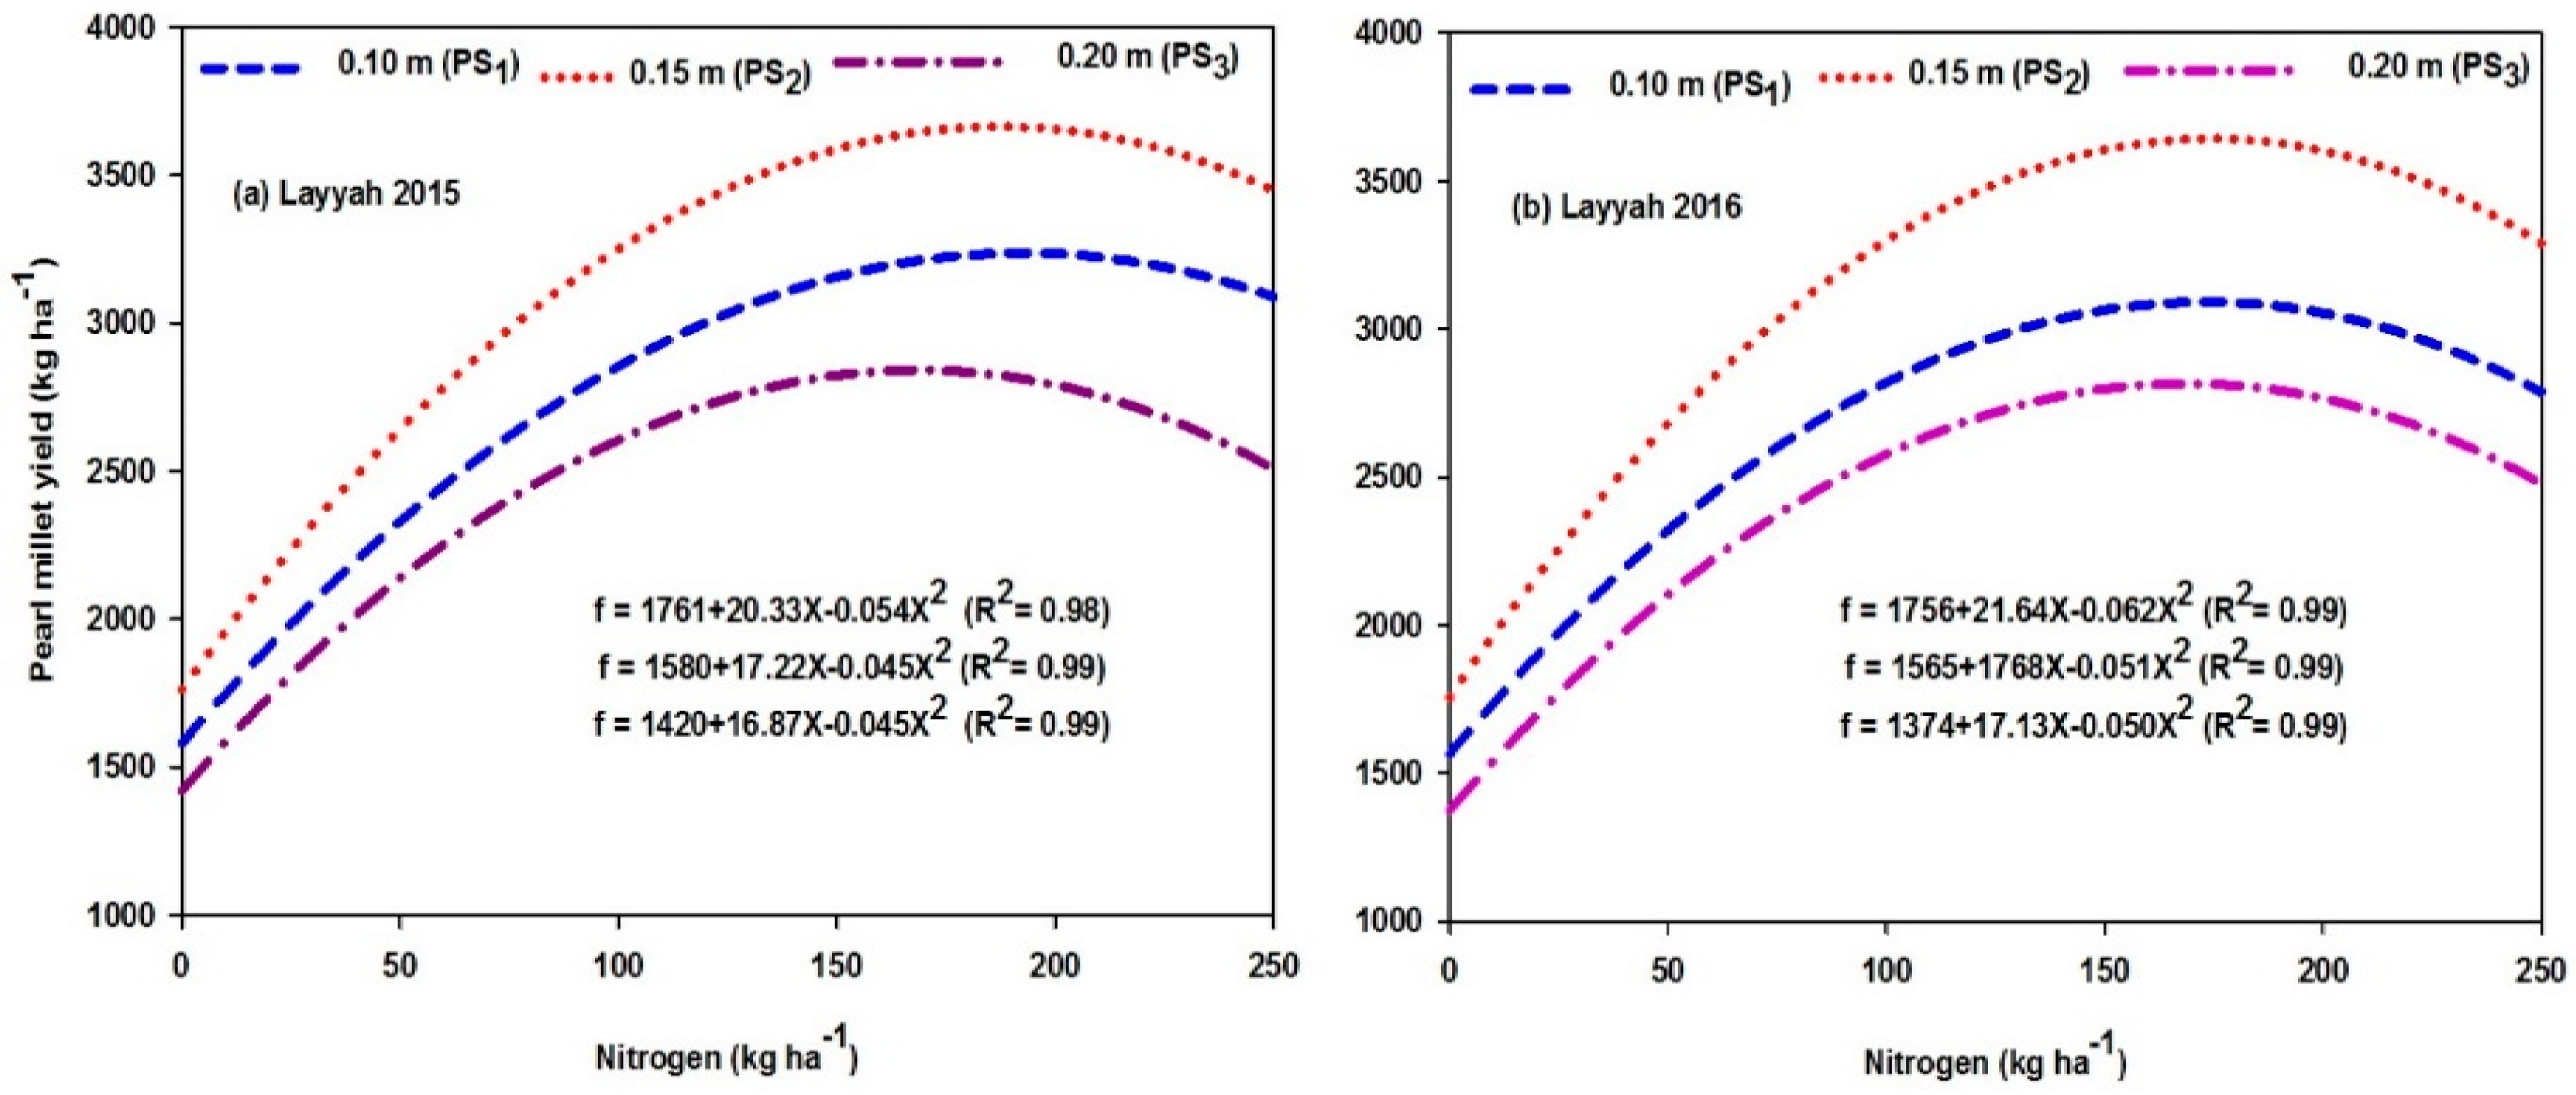
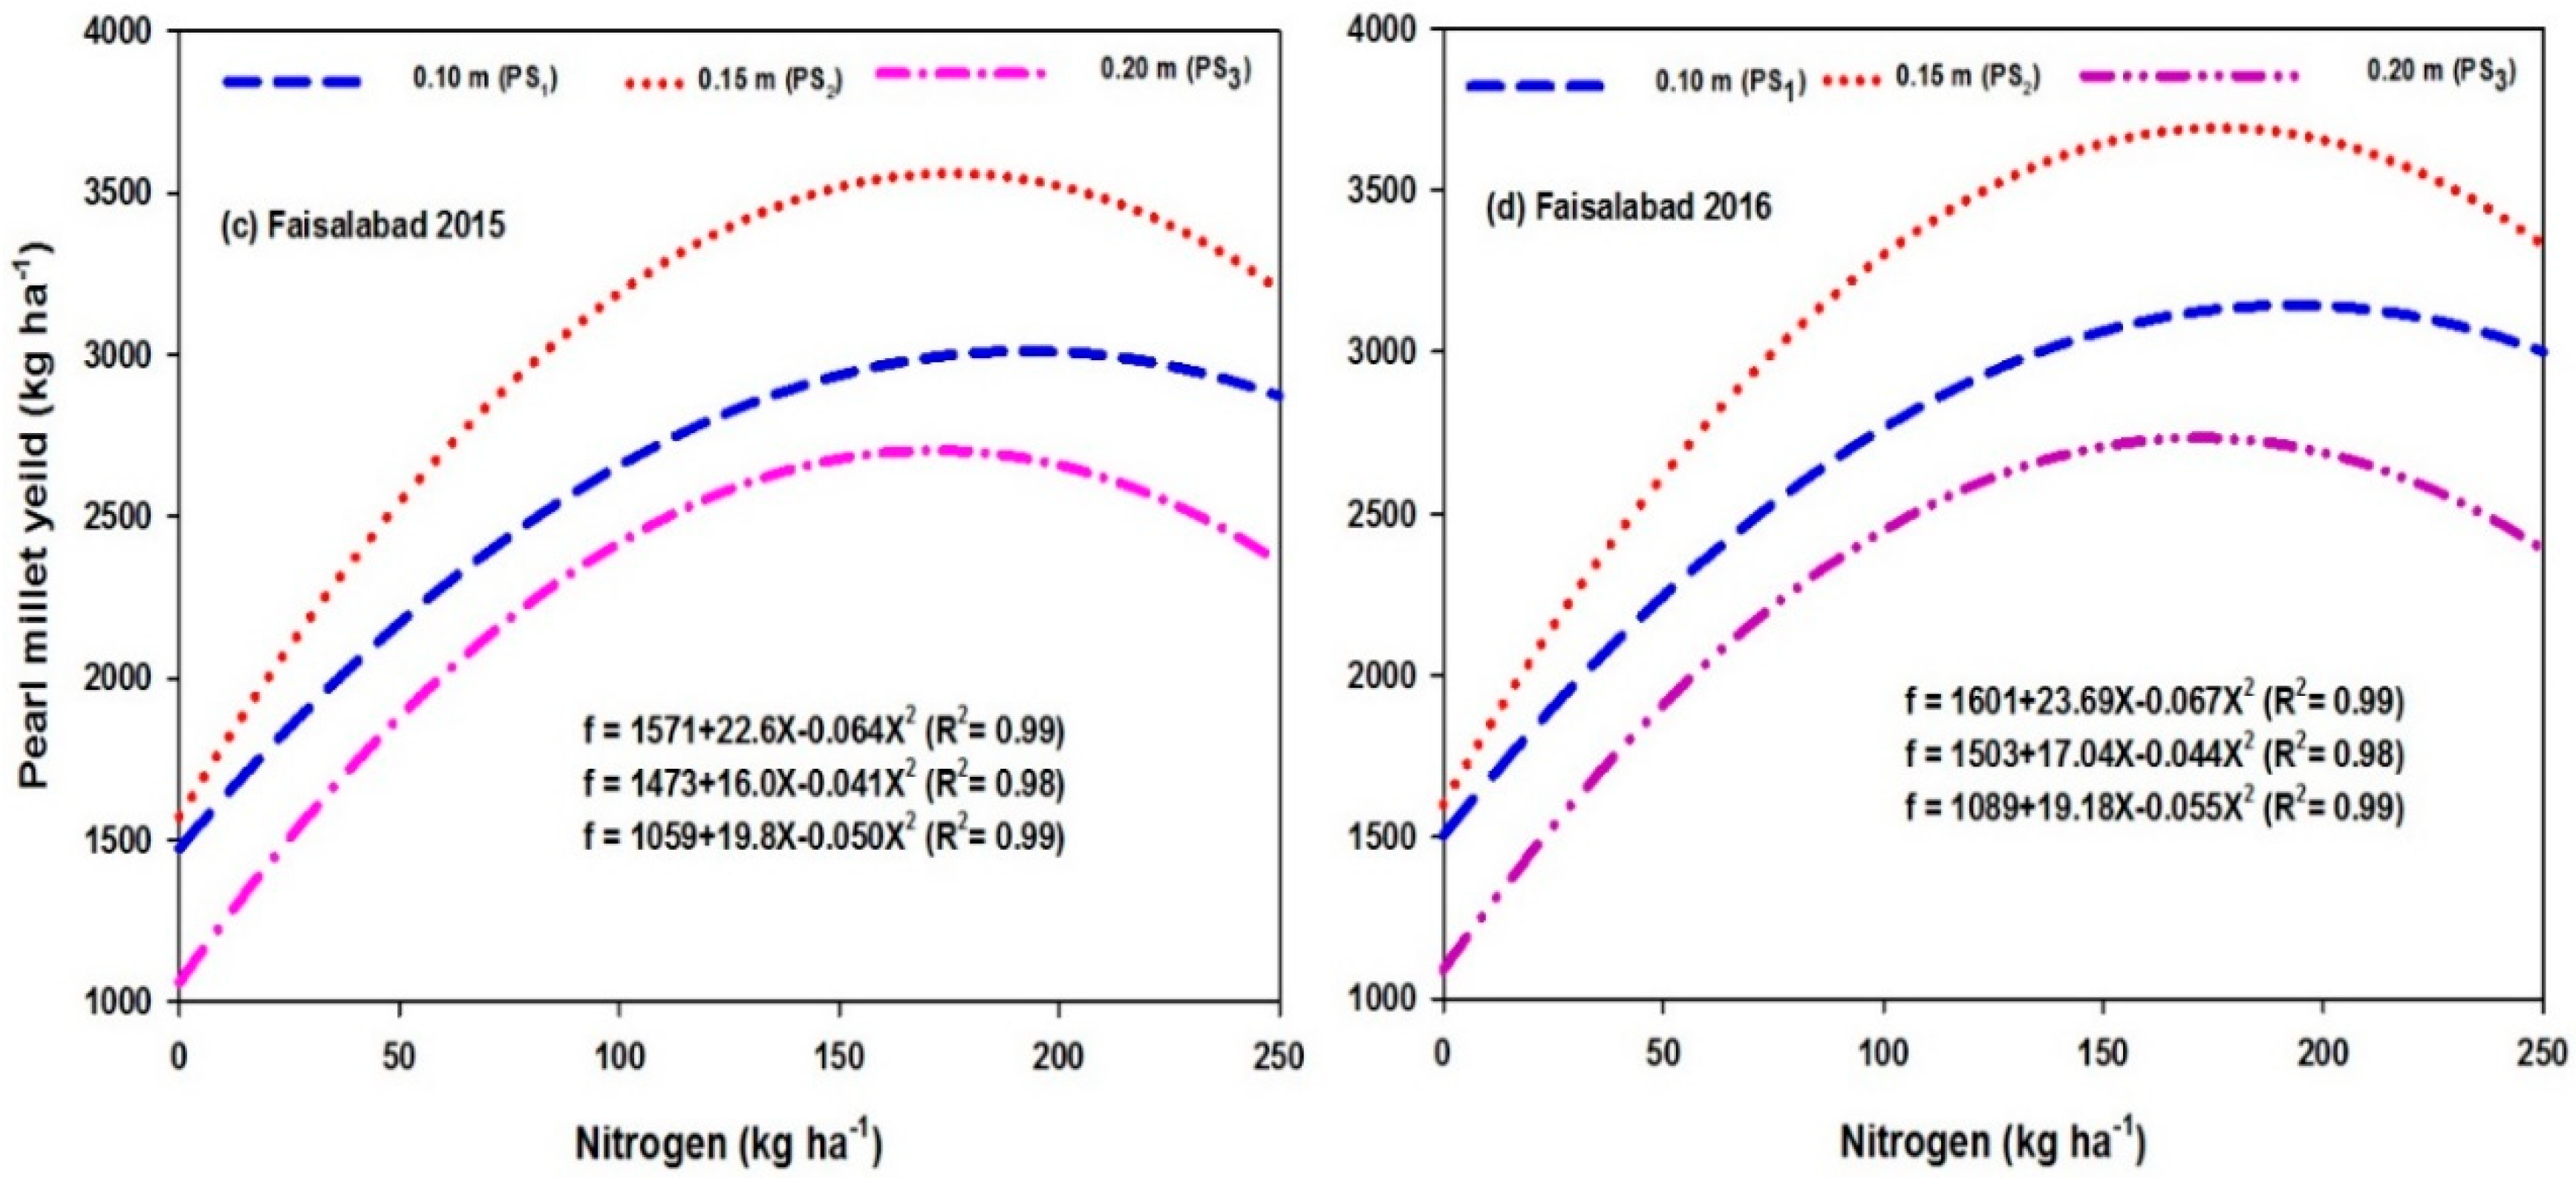
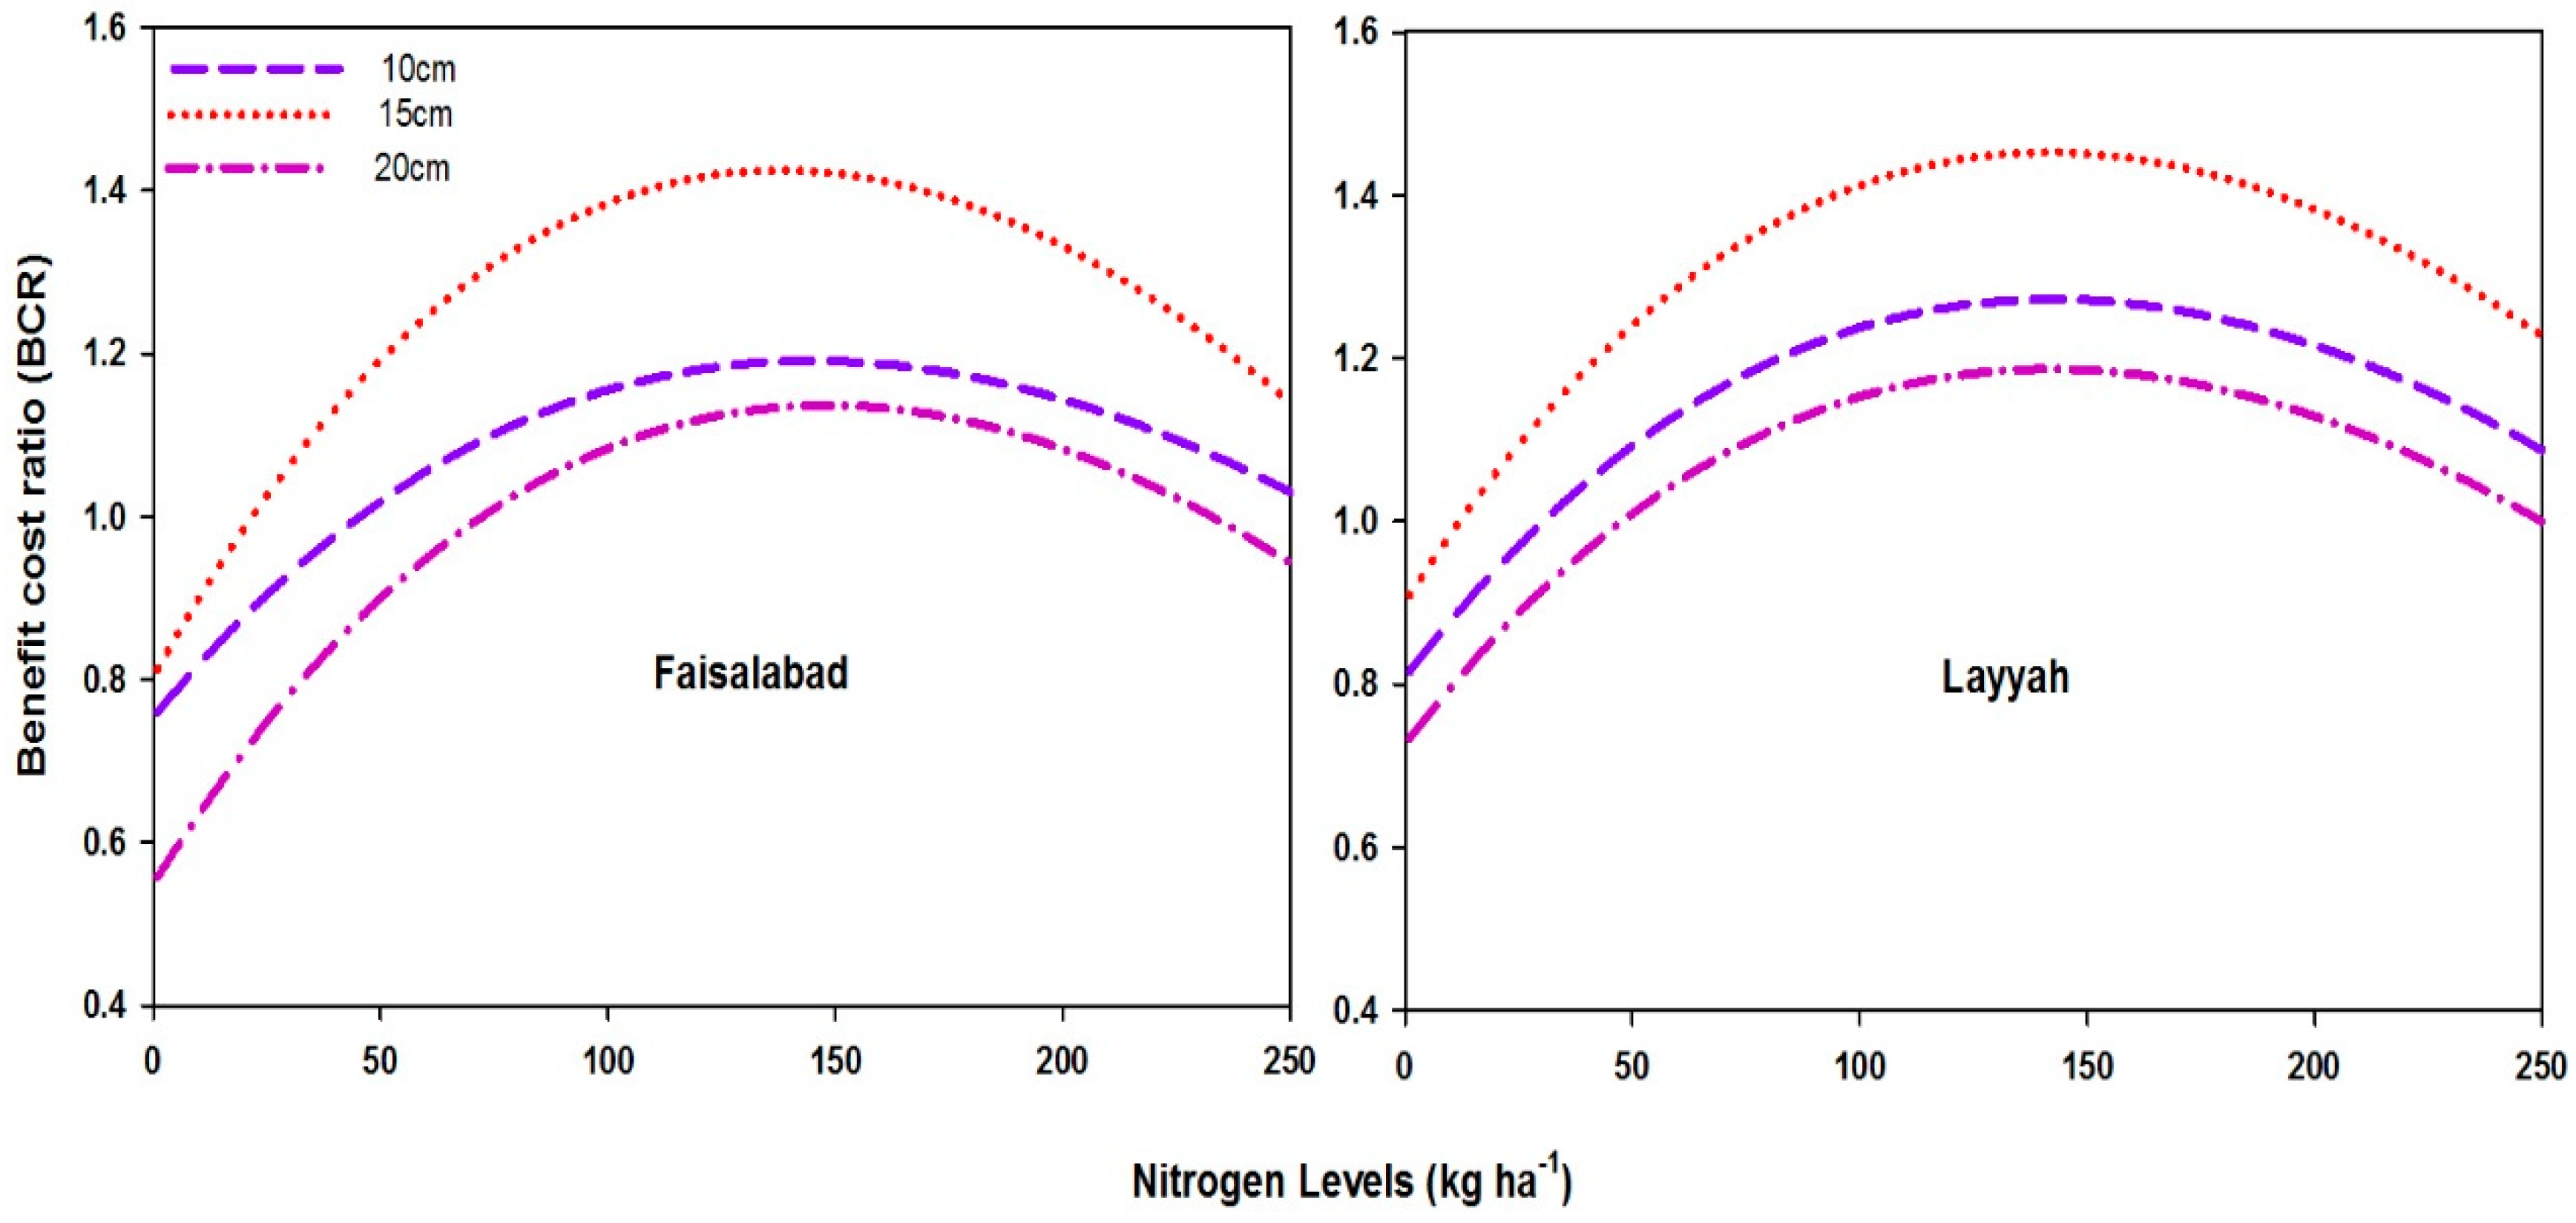
3.4. Nitrogen Response Curve

The regression analysis showed significantly strong relationship between millet grain yield and nitrogen application rate at Faisalabad and Layyah during both years of study (2015–2016). Based on these yield–nitrogen response curves (Figure 5 and Figure 6), the optimum nitrogen levels for the maximum yield of millet for both crop seasons were calculated as shown in Table 5 for Faisalabad and Table 6 for Layyah. The requirement of the nitrogen level was observed to be different for different intra-row spacings at both locations. The results elucidated that continuous application of nitrogen may not be economical for millet farming communities. The optimum nitrogen levels of 176 and 177 kg ha−1 were calculated for the Faisalabad location in 2015 and 2016, respectively, at a plant spacing of 15 cm. These optimum levels of nitrogen led to maximum yields of 3566 kg ha−1 and 3695 kg ha−1 in 2015 and 2016, respectively. The economics of these optimum nitrogen application did not allow us to apply such high amounts of N and resulted in savings of 31% and 45% of excessive N at 200 kg ha−1 and 250 kg ha−1 N rates, respectively, during 2015 and 2016 at the Faisalabad location. However, increasing or reducing the plant spacing resulted in more nitrogen requirements for millet with a reduced millet yield in Faisalabad in 2015 and 2016.
Similarly, in the case of the second location of the experiment (Layyah), maximum yields of millet (3674, 3644 kg ha−1) were recorded at optimum nitrogen levels of 188 kg ha−1 and 174 kg ha−1 during 2015 and 2016, respectively, at a plant spacing of 15 cm. The difference in yields and nitrogen during both years is nonsignificant. However, the economically optimum nitrogen levels were found to be 29% and 33% less over N200 and 43% and 47% less over N250 when recorded from quadratic relationships in 2015 and 2016, respectively. The amount of excessive nitrogen at N200 and N250 in the Layyah district for each year was nonsignificant at 10 cm and 20 cm (Table 5 and Table 6). The unit increase in yield due to the application of each kilogram of N is depicted in Figure 7, which clearly shows that the optimum nitrogen level, determined through curve fitting, showed the maximum benefit–cost ratio (BCR) at both locations during 2015 and 2016.

4. Discussion

The focus of the research on grain pearl millet remains on developing dwarf hybrids [40]. The nutrient availability to pearl millet crops significantly increases/decreases the millet yield. The limiting condition of nutrients, particularly nitrogen (N), reduce the performance of hybrid millets [41]. However, the increase in the N rate is not always associated with an increase in millet grain production [40]. Therefore, an experiment to optimize the N rate to improve millet grain production was conducted in Faisalabad (semi-arid) and Layyah (arid) over two years (2015 and 2016). There is significant effect of nitrogen rate on the phenology of pearl millet. An increase in the nitrogen rate causes the delay of panicle initiation, flowering, milking and maturity of crops. Bationo et al. (1992) [42] found no significant effects of different nitrogen levels on the phenology of millet. Contrary to this, significant effects of nitrogen application were found on crop development by [43].
Several studies showed significant effects of increasing N application on plant height, panicle length, panicle weight and grain yield of millet. Maximum plant height, panicle length, panicle weight, grain weight per panicle and millet grain production were found when 150 kg N ha−1 was applied to millet. The significance of yield components is statistically on par at an N application level of 200 kg ha−1. The trend of our results is supported by [44]. The increase in the plant height and panicle length in response to increasing nitrogen applications, might be due to the role of N in stimulating cell division and elongation, in addition to millet development. This might be attributed to the minimal nitrogen losses and efficient N use. Our results are quite similar to those reported by [45].
The different rate of N showed significant differences (p < 0.001) in the yield attributes of millet. Our data showed a significant effect of N rates on panicle weight, grain weight per panicle and 1000-grain weight at both locations and crop seasons. The treatment without the application of N caused the lowest yield attributes. These results might be due to the increase in photosynthetic processes and carbohydrate accumulation in the grain due to the increasing nitrogen rate, and vice versa. The role of nitrogen in increasing the number of tillers also cannot be neglected. These findings are in agreement with [12].
The millet grain production per ha was significantly affected by the increase in the rate of nitrogen, which is statistically similar to the findings of [46,47]. All the available evidences emphasized the magnitude of this finding. NUE is an important component to assess the efficiency of the amount of nitrogen applied to any crop. Significant differences in plant spacing and nitrogen application were found using NUE. Maximum NUE was found when pearl millet was planted at 15-cm spacings. Various denoted results depicted that high quantities of nitrogen (50%) are not assimilated in rice, wheat [48] and pearl millet during unfavorable weather conditions. In such conditions, the recovery efficiency of nitrogen is much lower in rice (31 ± 18%), wheat 18 ± 11%) and pearl millet (30 ± 12%) than the global cereal N use efficiency (33%) [49].
Poorly managed inputs (resources) include imbalanced, excessive and improper fertilizer application. These aspects are the main constraints for the availability of nutrients. Among all nutrients, N use in field crops [50] is comparatively high, but the response of the yield to high applications of nitrogen is substantially low for pearl millet as well [9]. However, from an economic and environmental point of view, nitrogen use efficiency has high significance [51]. NUE can be improved by balancing the use of N application under optimized management options (tillage, planting time, planting density, planting method and adequate irrigation) [52]. In addition to optimized management options, the selection of proper planting material (seed, fertilizer) and the suitability of weather conditions significantly contribute to the improvement of NUE, up to as much as 50% in cereals [40].
The data presented in the Table 3 show significant effects of nitrogen level on nitrogen use efficiency, but nonsignificant effects of planting density on NUE in both seasons and locations. Pearl millet with a nitrogen application of 150 kg N ha−1 showed a high nitrogen efficiency (17, 16.6 kg grains kg−1 of N, 17.4, 15.8 kg grains kg−1 of N in Faisalabad and Layyah in year 2015 and 2016, respectively). However, in Layyah, these results were statistically on par with the application of 200 kg N ha−1. Increasing nitrogen rates resulted in decreased nitrogen use efficiency. The interaction between plant spacing and nitrogen rate had a nonsignificant effect on the millet crops.

5. Conclusions

This study concludes that decreases in planting density caused a delayed in 50% flowering, milking, and maturity by 1–2 days in the semi-arid as well as the arid environment. A higher dry matter accumulation was recorded at a medium planting density (15 cm intra-row spacing) and a higher level of nitrogen (250 kg ha−1) at both locations. The yield and yield attributed performed well at 15 cm plant spacing coupled with N application from 150–200 kg ha−1 and resulted in a high NUE. The results of the quadratic relationship and economic analysis linked with yield and nitrogen levels showed 176 kg N ha−1 and 181 kg N ha−1 optimum levels (means of both years) compared to economic N levels of 138 kg N ha−1 and 137 kg N ha−1 for Faisalabad and Layyah, respectively. The economic analysis showed 31% and 45% mean excessive N at 200 and 250 kg N ha−1, respectively, for Faisalabad and Layyah. Overall, the results reveal that it is imperative to achieve the sustainable production of grain millet by optimizing efficient economic levels of N according to the soil type and climatic conditions of different regions in Punjab, Pakistan.

Author Contributions

Conceptualization, A.U. and A.A.; methodology, A.U.; data curation, A.U. and I.A.; writing—original draft preparation, A.U.; writing—reviewing and editing, M.W. and M.M.W.; supervision, A.A.; graphical presentation, A.U. and M.H.u.R.; soil analysis and tabulation, M.H.u.R., M.A.B.; site map development and figure drawing, I.A., A.U. and M.H.u.R. All authors have read and agreed to the published version of the manuscript.

Funding

This work was not funded by any national or foreign agency.

Acknowledgments

The first author acknowledges the critical review of this manuscript by Axel Garcia, University of Minnesota, USA. Thanks to M.S. Cresser, University of York, Heslington, York, UK, for his valuable suggestions to improve this article. Thanks also go to the field staff of the Agronomic Research Station, Karor (Layyah) and Faisalabad for their support in the execution of the experiments. I acknowledge the Higher Education Commission, Islamabad, for the financial support they provided to help me visit the USA as a visiting Research Scientist and the Institute for Sustainable Food Systems (ISFS), University of Florida, USA, for hosting me and helping to improve my technical skills. All authors acknowledge and are incredibly thankful to the University of Rostock, Germany, for paying processing charges for this manuscript.

Conflicts of Interest

The authors declare no conflict of interest.

References

  1. Ausiku, A.P.; Annandale, J.G.; Steyn, J.M.; Sanewe, A.J. Improving Pearl Millet (Pennisetum glaucum) Productivity through Adaptive Management of Water and Nitrogen. Water 2020, 12, 422. [Google Scholar] [CrossRef] [Green Version]
  2. Ahmad, I.; Wajid, S.A.; Ahmad, A.; Cheema, M.J.M.; Judge, J. Optimizing irrigation and nitrogen requirements for maize through empirical modeling in semi-arid environment. Environ. Sci. Pollut. Res. 2019, 26, 1227–1237. [Google Scholar] [CrossRef] [PubMed]
  3. Payne, W.A. Optimizing crop water use in sparse stands of pearl millet. Agron. J. 2000, 92, 808–814. [Google Scholar] [CrossRef]
  4. Singh, R.K.; Chakraborty, D.; Garg, R.N.; Sharma, P.K.; Sharma, U.C. Effect of different water regimes and nitrogen application on growth, yield, water use and nitrogen uptake by pearl millet (Pennisetum glaucum). Indian J. Agric. Sci. 2010, 80, 213–216. [Google Scholar]
  5. Bationo, A.; Christianson, C.B.; Baethgen, W.E. Plant density and nitrogen fertilizer effects on pearl millet production in Niger. Agron. J. 1990, 82, 290–295. [Google Scholar] [CrossRef]
  6. Nedumaran, S.; Abinaya, P.; Bantilan, M.C.S. Sorghum and Millets Futures in Asia under Changing Socio-Economic and Climate Scenarios. 2013. Available online: http://oar.icrisat.org/6427/ (accessed on 16 May 2020).
  7. Sutaliya, R. Performance of Pearl Millet Advance Hybrids to Different Levels of Nitrogen under Dry Land Conditions. Int. J. Curr. Microbiol. Appl. Sci. 2019, 8, 2245–2248. [Google Scholar] [CrossRef]
  8. Ullah, A.; Ahmad, I.; Ahmad, A.; Khaliq, T.; Saeed, U.; Habib-ur-Rahman, M.; Hussain, J.; Ullah, S.; Hoogenboom, G. Assessing climate change impacts on pearl millet under arid and semi-arid environments using CSM-CERES-Millet model. Environ. Sci. Pollut. Res. 2019, 26, 6745–6757. [Google Scholar] [CrossRef]
  9. Kadam, S.B.; Pawar, S.B.; Jakkawad, S.R. Response of pearl millet (Pennisetum glaucum L.) to levels and scheduling of nitrogen under Maharashtra condition. J. Pharm. Phytochem. 2019, 8, 2922–2925. [Google Scholar]
  10. Dawi, T.B.; Yoila, A.I.; Kayode, D.C.; Lucky, A.U.; Shero, I.A.; Alhaji, Y.A.; Abdu, N.; Tawa, A.T.; Raymond, B.P.; Marinus, U.E. Optimizing fertilizer use within the context of integrated soil fertility management in Nigeria. In Fertil. Use Optimization Sub-Saharan Africa; Wortmann, C.S., Sones, K., Eds.; CAB International: Wallingford, UK, 2017; pp. 117–127. [Google Scholar]
  11. Jukanti, A.K.; Gowda, C.L.L.; Rai, K.N.; Manga, V.K.; Bhatt, R.K. Crops that feed the world 11. Pearl Millet (Pennisetum glaucum L.): An important source of food security, nutrition and health in the arid and semi-arid tropics. Food Secur. 2016, 8, 307–329. [Google Scholar] [CrossRef]
  12. Kumar, P.; Kumar, A. Impact Assessment of Manure and Nitrogen Level on Phenology, Yield Attributes, Yield and Energy Use Efficiency in Pearlmillet. Curr. J. Appl. Sci. Technol. 2017, 24, 1–7. [Google Scholar]
  13. Bhagat, S.B.; Nikas, S.B.; Dahiphale, A.V.; Dhekale, J.S.; Mardane, R.D. Effect of nitrogen levels and intercropping on yield and economics of finger millet (Eleusine coracana G.). Pharma. Innov. 2018, 7, 651–654. [Google Scholar]
  14. Ullah, A.; Ahmad, A.; Khaliq, T.; Akhtar, J. Recognizing production options for pearl millet in Pakistan under changing climate scenarios. J. Integr. Agric. 2017, 16, 762–773. [Google Scholar] [CrossRef] [Green Version]
  15. De Assis, R.L.; de Freitas, R.S.; Mason, S.C. Pearl millet production practices in Brazil: A review. Exp. Agric. 2018, 54, 699–718. [Google Scholar] [CrossRef]
  16. Muurinen, S. Nitrogen Dynamics and Nitrogen Use Efficiency of Spring Cereals under Finnish Growing Conditions; Helsingin Yliopisto: Helsinki, Fineland, 2007. [Google Scholar]
  17. Choudhary, S.; Chopra, N.K.; Chopra, N.K.; Singh, M.; Kumar, R.; Kushwaha, M. Influence of Nitrogen Levels and Weed Management Practices on Yield and Quality of Forage Pearl Millet (Pennisetum glaucum L.). Indian J. Anim. Nutr. 2017, 34, 64–69. [Google Scholar] [CrossRef]
  18. Kumawat, S.M.; Khinchi, V.; Meena, R.K.; Rakesh, S. Growth characters, fodder yield, quality and economics of pearl millet (Pennisetum americanum L.) genotype as influenced by nitrogen levels. Int. J. Pure Appl. Biosci. 2017, 5, 449–453. [Google Scholar]
  19. Thakor, K.P.; Usadadia, V.P.; Savani, N.G.; Arvadia, L.K.; Patel, P.B. Effect of irrigation schedule and nitrogen management on productivity, profitability of summer pearl millet grown under clay soils of south Gujarat. Int. J. Agric. Innov. Res. 2018, 6, 10–11. [Google Scholar]
  20. Bamboriya, S.D.; Bana, R.S.; Pooniya, V.; Rana, K.S.; Singh, Y.V. Planting density and nitrogen management effects on productivity, quality and water-use efficiency of rainfed pearlmillet (Pennisetum glaucum) under conservation agriculture. Indian J. Agron. 2017, 62, 363–366. [Google Scholar]
  21. Yoneyama, K.; Xie, X.; Kusumoto, D.; Sekimoto, H.; Sugimoto, Y.; Takeuchi, Y.; Yoneyama, K. Nitrogen deficiency as well as phosphorus deficiency in sorghum promotes the production and exudation of 5-deoxystrigol, the host recognition signal for arbuscular mycorrhizal fungi and root parasites. Planta 2007, 227, 125–132. [Google Scholar] [CrossRef]
  22. Ahmad, I.; Wajid, S.A.; Ahmad, A.; Cheema, M.J.M.; Judge, J. Assessing the Impact of Thermo-temporal Changes on the Productivity of Spring Maize under Semi-arid Environment. Int. J. Agric. Biol. 2018, 20, 2203–2210. [Google Scholar]
  23. IPCC. Climate Change: Impacts, adaptation and vulnerability: Contribution of Working Group II to the Fourth Assessment Report of the Intergovernmental Panel; Cambridge University Press: New York, NY, USA, 2007; ISBN 9780521880107. [Google Scholar]
  24. Rahman, M.H.; Ahmad, A.; Wang, X.; Wajid, A.; Nasim, W.; Hussain, M.; Ahmad, B.; Ahmad, I.; Ali, Z.; Ishaque, W. Multi-model projections of future climate and climate change impacts uncertainty assessment for cotton production in Pakistan. Agric. For. Meteorol. 2018, 253, 94–113. [Google Scholar] [CrossRef]
  25. Ahmad, I.; Ahmad, B.; Boote, K.; Hoogenboom, G. Adaptation strategies for maize production under climate change for semi-arid environments. Eur. J. Agron. 2020, 115, 126040. [Google Scholar] [CrossRef]
  26. Vanli, Ö.; Ustundag, B.B.; Ahmad, I.; Hernandez-Ochoa, I.M.; Hoogenboom, G. Using crop modeling to evaluate the impacts of climate change on wheat in southeastern turkey. Environ. Sci. Pollut. Res. 2019, 26, 29397–29408. [Google Scholar] [CrossRef] [PubMed]
  27. Ahmed, I.; ur Rahman, M.H.; Ahmed, S.; Hussain, J.; Ullah, A.; Judge, J. Assessing the impact of climate variability on maize using simulation modeling under semi-arid environment of Punjab, Pakistan. Environ. Sci. Pollut. Res. 2018, 25, 28413–28430. [Google Scholar] [CrossRef]
  28. Waqas, M.M.; Awan, U.K.; Cheema, M.J.M.; Ahmad, I.; Ahmad, M.; Ali, S.; Shah, S.H.H.; Bakhsh, A.; Iqbal, M. Estimation of canal water deficit using satellite remote sensing and GIS: A case study in lower chenab canal system. J. Indian Soc. Remote Sens. 2019, 47, 1153–1162. [Google Scholar] [CrossRef]
  29. Khan, S.A.; Mulvaney, R.L.; Ellsworth, T.R.; Boast, C.W. The myth of nitrogen fertilization for soil carbon sequestration. J. Environ. Qual. 2007, 36, 1821–1832. [Google Scholar] [CrossRef] [PubMed] [Green Version]
  30. Moodie, C.D.; Smith, H.W.; McCreery, R.A. Laboratory Manual for Soil Fertility. Soil Sci. 1951, 71, 400. [Google Scholar] [CrossRef]
  31. Nelson, D.W.; Sommers, L.E. Total carbon, organic carbon, and organic matter 1. In Methods of Soil Analysis: Part 2 Chemical and Microbiological Properties; American Society of Agronomy: Madison, WI, USA, 1982; pp. 539–579. [Google Scholar]
  32. Richards, L.A. Diagnosis and Improvement of Saline and Alkaline Soils. Soil Sci. 1947, 64, 432. [Google Scholar] [CrossRef]
  33. Mehlich, A. Determination of P, Ca, Mg, K, Na, and NH4; North Carolina Soil Test Division: Raleigh, NC, USA, 1953; pp. 23–89. [Google Scholar]
  34. Cabrera, M.L.; Kissel, D.E. Potentially mineralizable nitrogen in disturbed and undisturbed soil samples. Soil Sci. Soc. Am. J. 1988, 52, 1010–1015. [Google Scholar] [CrossRef]
  35. Karkanis, P.G. Determining field capacity and wilting point using soil saturation by capillary rise. Can. Agric. Eng. 1983, 25, 19–21. [Google Scholar]
  36. Ealson, H.M.; Bloom, A.J. Easy leaf area: Automated digital image analysis for rapid and accurate measurement of leaf area. Appl. Plant Sci. 2014, 2, 140003. [Google Scholar]
  37. Watson, D.J. Comparative physiological studies on the growth of field crops. 1. Variation in net assimilation rate and leaf area between species and varieties, and within between years. Ann. Bot. 1947, 11, 41–76. [Google Scholar] [CrossRef]
  38. Manly, B.F.J.; Jamieson, C.D. Functional Response and Parallel Curve Analysis. Oikos 1999, 85, 523. [Google Scholar] [CrossRef]
  39. Saeed, U.; Wajid, S.A.; Khaliq, T.; Zahir, Z.A. Optimizing irrigation and nitrogen for wheat through empirical modeling under semi-arid environment. Environ. Sci. Pollut. Res. 2017, 24, 11663–11676. [Google Scholar] [CrossRef] [PubMed]
  40. Rai, K.N.; Kulkarni, V.N.; Thakur, R.P.; Haussmann, B.I.G.; Mgonja, M.A. Pearl Millet Hybrid Parents Research: Approaches and Achievements. In Hybrid Parents Research at ICRISAT; International Crops Research Institute for the Semi-Arid Tropics: Patancheru, India, 2006; Volume 39. [Google Scholar]
  41. Kathju, S.; Burman, U.; Garg, B.K. Influence of nitrogen fertilization on water relations, photosynthesis, carbohydrate and nitrogen metabolism of diverse pearl millet genotypes under arid conditions. J. Agric. Sci. 2001, 137, 307–318. [Google Scholar] [CrossRef]
  42. Bationo, A.; Christianson, C.B.; Baethgen, W.E.; Mokwunye, A.U. A farm-level evaluation of nitrogen and phosphorus fertilizer use and planting density for pearl millet production in Niger. Fertil. Res. 1992, 31, 175–184. [Google Scholar] [CrossRef] [Green Version]
  43. Ayub, M.; Nadeem, M.A.; Tahir, M.; Ibrahim, M.; Aslam, M.N. Effect of nitrogen application and harvesting intervals on forage yield and quality of pearl millet (Pennisetum americanum L.). Pak. J. Life Soc. Sci 2009, 7, 185–189. [Google Scholar]
  44. Montemurro, F.; Convertini, G.; Ferri, D. Nitrogen application in winter wheat grown in Mediterranean conditions: Effects on nitrogen uptake, utilization efficiency, and soil nitrogen deficit. J. Plant. Nutr. 2007, 30, 1681–1703. [Google Scholar] [CrossRef]
  45. Ayub, M.; Nadeem, M.A.; Tanveer, A.; Tahir, M.; Khan, R.M.A. Interactive effect of different nitrogen levels and seeding rates on fodder yield and quality of pearl millet. Pak. J. Agric. Sci 2007, 44, 592–596. [Google Scholar]
  46. Patel, S.A.; Chaudhary, P.P.; Chaudhary, N.; Chaudhary, H.L. Effect of wheat residue management and fertilizer levels on growth, yield attributes and yield of summer pearl millet [Pennisetum glaucum (L.) R. Br.] under north Gujarat condition. J. Pharm. Phytochem. 2018, 7, 1292–1295. [Google Scholar]
  47. Khinchi, V.; Kumawat, S.M.; Dotaniya, C.K.; Rakesh, S. Effect of Nitrogen and Zinc Levels on Yield and Economics of Fodder Pearl Millet (Pennisetum americanum L.). Int. J. Pure Appl. Biosci 2017, 5, 426–430. [Google Scholar]
  48. Khairwal, I.S.; Rai, K.N.; Diwakar, B.; Sharma, Y.K.; Rajpurohit, B.S.; Nirwan, B.; Bhattacharjee, R. Pearl Millet Crop Management and Seed Production Manual; ICRISAT: Jodhpur, India, 2007. [Google Scholar]
  49. Ullah, A.; Salehnia, N.; Kolsoumi, S.; Ahmad, A.; Khaliq, T. Prediction of effective climate change indicators using statistical downscaling approach and impact assessment on pearl millet (Pennisetum glaucum L.) yield through Genetic Algorithm in Punjab, Pakistan. Ecol. Indic. 2018, 90, 569–576. [Google Scholar] [CrossRef]
  50. Dwivedi, B.S.; Singh, V.K.; Meena, M.C.; Dey, A.; Datta, S.P. Integrated nutrient management for enhancing nitrogen use efficiency. Indian J. Fertil. 2016, 12, 62–71. [Google Scholar]
  51. Wopereis, M.; Tamélokpo, A.; Ezui, K.; Gnakpénou, D.; Fofana, B.; Breman, H. Mineral fertilizer management of maize on farmer fields differing in organic inputs in the West African savanna. Field Crops Res. 2006, 96, 355–362. [Google Scholar] [CrossRef]
  52. Singh, S.P.; Maruthi Sankar, G.R.; Nema, A.K.; Singh, P.K.; Srinivasa Rao, C.; Mishra, P.K. Effect of moisture conservation, sowing methods and nitrogen levels on sustainable profitability of pearl millet under arid inceptisols. Ind. J. Soil Cons. 2016, 44, 206–215. [Google Scholar]
Figure 1. Geographical location of study area (Faisalabad and Layyah), Punjab, Pakistan.
Sustainability 12 07715 g001
Figure 2. Daily average temperature (°C), crop season mean temperature (dots), cumulative pearl millet growing degree days, GDD (dotted line) and cumulative rainfall (in bars) from seeding to harvest at the sites of semi-arid (Faisalabad) (a) and arid environments (Layyah) (b) for the years 2015–2016.
Sustainability 12 07715 g002
Figure 3. Time series leaf area index (LAI) of millet affected by plant spacing and nitrogen rate in Faisalabad in crop seasons 2015 and 2016.
Sustainability 12 07715 g003
Figure 4. Time series leaf area index (LAI) of millet affected by plant spacing and nitrogen rate in Layyah in crop seasons 2015 and 2016.
Sustainability 12 07715 g004
Figure 5. Pearl millet grain yield response to different intra-row plant spacings (PS) and nitrogen rates in Layyah during 2015 and 2016.
Sustainability 12 07715 g005
Figure 6. Pearl millet grain yield response to different intra-row plant spacings (PS) and nitrogen rates in Faisalabad during 2015 and 2016.
Sustainability 12 07715 g006
Figure 7. Benefit–cost ratio (BCR) for unit increase in nitrogen from 1 to 250 kg ha−1 at three plant spacings (10, 15, 20 cm) in Faisalabad and Layyah during crop seasons 2015 and 2016.
Sustainability 12 07715 g007
Table 1. Soil characteristics of experimental sites: (a) Faisalabad, (b) Layyah.
SandSiltClaySOC *EC **pHBD **TextureN ***P ****K *****
SiteYearDepth%%%%dSm−11:1Mg m−3 g kg−1ppmppm
Faisalabad20150–15 cm51.026.023.00.591.528.21.40Sandy clay loam0.457.9130.7
16–30 cm50.028.522.50.361.458.21.45Sandy clay loam0.405.6116.4
31–45 cm50.528.522.00.251.308.11.45Sandy clay loam0.305.4110.3
20160–15 cm52.027.021.00.651.458.11.42Sandy clay loam0.438.1135.5
16–30 cm51.527.021.50.381.348.01.46Sandy clay loam0.405.4110.0
31–45 cm50.528.021.50.251.297.91.46Sandy clay loam0.354.5105.5
Layyah20150–15 cm53.532.515.00.501.368.31.50Sandy loam0.406.4122.0
16–30 cm52.531.516.00.391.108.51.52Sandy loam0.376.0119.0
31–45 cm52.531.516.00.251.058.61.55Sandy loam0.345.7108.0
20160–15 cm54.031.015.00.451.358.31.47Sandy loam0.426.0130.0
16–30 cm53.531.015.50.351.078.51.50Sandy loam0.405.0115.0
31–45 cm52.531.516.00.261.058.61.52Sandy loam0.334.7115.0
* Soil organic carbon, ** bulk density, *** nitrogen, **** phosphorus, ***** potassium.
Table 2. Nutrient sources and amount of application rates of N, P and K.
DescriptionNutrients in Source
(kg 100 kg−1)
Nutrients in Soil
(kg ha−1)
Application Rate
(kg ha−1)
SiteYearTreatmentsN+ (Urea)P2O5 (TSP) ***K+ (SOP) ****× NPKN kgP kg** K kg
Faisalabad2015N1: 0 kg ha−12322.5-9.2015.8261.40.0041.20.0
N2: 150 kg ha−12322.5-9.2015.8261.4108.841.20.0
N3: 200 kg ha−12322.5-9.2015.8261.4158.841.20.0
N4: 250 kg ha−12322.5-9.2015.8261.4208.841.20.0
2016N1: 0 kg ha−12322.5-10.2816.2271.00.0040.80.0
N2: 150 kg ha−12322.5-10.2816.2271.0109.240.80.0
N3: 200 kg ha−12322.5-10.2816.2271.0159.240.80.0
N4: 250 kg ha−12322.5-10.2816.2271.0209.240.80.0
Layyah2015N1: 0 kg ha−12322.5-8.3512.8244.00.0044.20.0
N2: 150 kg ha−12322.5-8.3512.8244.0105.844.20.0
N3: 200 kg ha−12322.5-8.3512.8244.0155.844.20.0
N4: 250 kg ha−12322.5-8.3512.8244.0205.844.20.0
2016N1: 0 kg ha−12322.5-7.3712.0260.00.0045.00.0
N2: 150 kg ha−12322.5-7.3712.0260.0105.045.00.0
N3: 200 kg ha−12322.5-7.3712.0260.0155.045.00.0
N4: 250 kg ha−12322.5-7.3712.0260.0205.045.00.0
× N mineralized from soil organic matter; ** soil was calcareous in nature with sufficient K availability; *** triple super phosphate; **** sulfate of potash.
Table 3. Effect of intra-row spacing and nitrogen level on phenology and growth of millet under arid and semi-arid regions.
TreatmentsDays to Panicle InitiationDays to 50% FloweringDays to Milking Days to MaturityTotal Dry Matter
(kg ha−1)
Nitrogen Use Efficiency
201520162016201520152016201520162015201620152016
Faisalabad (Semi-arid)
Plant Spacing (A)
10 cm 353460 B60 B69 B66 B87 B85 B16680 B17015 B13.9514.20
15 cm353460 B61 A68 B 66 B87 B85 B18580 A18907 A16.2316.24
20 cm353461 A61 A70 A67 A88 A87 A14533 C14860 C13.6813.96
HSD (5%)--0.420.981.110.720.721.021241.01233.73.944.11
Significance NSNS**********NSNS
Nitrogen level (B)
0 kg ha−131 C30 C54 D55 D63 C62 D73 D71 D10071.6 C10409 C--
150 kg ha−135 B35 B60 C61 C70 C66 C90 C88 C18236.8 B18564 B17.0 A17.4 A
200 kg ha−137 A36 B62 B63 B72 A68 B93 B90 B18558.7 B18885 B14.6 B15.0 B
250 kg ha−138 A38 A64 A65 A73 A70 A95 A92 A19524.2 A19851 A12.2 C12.0 C
HSD (5%)1.531.311.501.431.431.481.381.45887.4883.72.32.2
Significance ************************
Interaction (A × B)NSNSNSNSNSNSNSNSNSNSNSNS
Layyah (Arid)
Plant Spacing (A)
10 cm 343558 B61 B68 B67 B85 B87 B16856 B16696 B14.2612.91
15 cm343558 B61 B68 B67 B85 B87 B18879 A18679 A15.4615.20
20 cm343560 A62 A69 A68 A86 A88 A15173 B14954 C12.8212.65
HSD (5%)--0.4214E-160.940.720.420.421756.1865.72.94.3
Significance NSNS**********NSNS
Nitrogen level (B)
0 kg ha−130 A31 C53 C56 D65 D62 C71 D72 D11150 B10305 B--
150 kg ha−134 B35 B59 B61 C68 C67 B88 C89 C18396 A18460 A16.6 A15.8 A
200 kg ha−136 A36 B61 A63 B70 B69 A90 B92 B18718 A18781 A14.3 A14.0 A
250 kg ha−137 A38 A62 A66 A71 A70 A93 A95 A19613 A19558 A11.8 B11.0 B
HSD (5%)1.541.311.521.531.531.431.521.521484.71304.52.62.1
Significance **********************
Interaction (A × B)NSNSNSNSNSNSNSNSNSNSNSNS
* Significant, ** highly significant, NS = not significant.
Table 4. Effect of plant spacing and nitrogen level on yield and yield attributes of pearl millet under semi-arid and arid regions.
TreatmentsPlant Population (m−2)Plant Height (cm)Panicle Length (cm)Panicle Weight (g)Grain Weight Panicle−1 (g)1000-Grains Weight (g)Grain Yield
(kg ha−1)
20152016201620152015201620152016201520162015201620152016
Faisalabad (Semi-arid)
Plant Spacing (A)
10 cm 28.5 B29.0 B187 B192 B303243.1 B43.3 B30.6 B33.3 B8.0 B8.7 B2573 B2678 B
15 cm45.8 A46.2 A200 A205 A303347.3 A47.4 A36.0 A39.2 A9.32A10.0 A2953 A3058 A
20 cm26.7 B26.9 B175 C180 C283039.0 C39.4 C25.0 C28.3 C6.8 C7.5 C2189 C2219 C
HSD (5%)4.464.725.245.245.203.654.252.452.2303.440.500.54343.5349.19
Significance ********NSNS****************
Nitrogen level (B)
0 kg ha−123.9 B24.7 B138 C143 C26 B28 B34.3 C34.5 C20.6 C23.8 C7.1 C7.7 C1370 C1400 C
150 kg ha−137.0 A37.7 A209 A214 A31 A33 A47.2 A47.4 A35.1 AB38.4 AB8.6 A9.3 A3023 A3120 A
200 kg ha−137.8 A38.2 A206 A211 A31 A34 A47.3 AB47.5 A35.5 A38.7 A8.7 A9.4 A3096 A3192 A
250 kg ha−135.9 A35.7 A196 B201 B29.6 AB32.1 A43.8 B44.0 B30.9 B34.2 B7.8 B8.4 B2698 B2717 B
HSD (5%)4.434.244.074.074.293.073.552.934.324.490.620.60402.3402.7
Significance **************************
Interaction (A × B)NSNSNSNSNSNSNSNSNSNSNSNSNSNS
Layyah (Arid)
Plant Spacing (A)
10 cm 28.1 B28.9 B189 B186 B30.430.4 42.7 AB46.1 B33.2 B33.3 B08.5 B8.2 B2765 AB2618 B
15 cm45.4 A45.6 A214 A200 A31.131.1 46.9 A50.2 A38.3 A38.7 A10.2 A9.5 A3113.9 A3063 A
20 cm26.5 B26.6 B183 B175 C28.43 28.4 39.1 B42.1 C28.8 C28.6 C07.6 C7.0 C2386.6 C2310 C
HSD (5%)6.804.4119.545.243.973.974.303.462.714.600.540.54417.4306.3
Significance ********NSNS****************
Nitrogen level (B)
0 kg ha−124.1 B24.5 B142 B138 C26.5 B26.5 B33.3 C37.1 C22.8 C23.6 C7.8 C7.3 C1589 C1568 C
150 kg ha−136.8 A37.4 A212 A209 A31.6 A31.6 A47.1 A50.0 A38.0 A38.2 A9.4 A8.8 A3176 A3122 A
200 kg ha−137.0 A37.8 A216 A206 A32.0 A32.0 A46.4 A50.6 A37.1 A38.5 A9.4 A8.9 A3249 A3194 A
250 kg ha−135.5 A35.2 A210 A195 B29.8 AB29.8 AB40.8 B46.6 B32.8 B34.0 B8.54 B8.02 B2729.3 B2742.1 B
HSD (5%)4.944.918.434.073.473.475.563.044.574.380.590.60446.3377.8
Significance *************************
Interaction (A × B)NSNSNSNSNSNSNSNSNSNSNSNSNSNS
* Significant, ** highly significant, NS = not significant.
Table 5. Optimum nitrogen rates for maximum millet grain yield, economical millet grain yield, and excessive nitrogen of millet at different intra-row spacings in Faisalabad during 2015 and 2016.
Plant SpacingOptimum N (kg ha−1)Maximum Yield (kg ha−1) Economically Optimum N (kg ha−1)Excessive N at N200 (%) Excessive N at N250 (%)
2015201620152016201520162015201620152016
10 cm1951943034315314514527.527.54242
15 cm1761773566369513813831314545
20 cm1981743019276115713921.530.53744
Mean1901823206320314714127304144
Assuming prices of N = 0.79 USD per kg and millet grain = 0.23 USD per kg.
Table 6. Optimum nitrogen rates for maximum millet grain yield, economical millet grain yield, and excessive nitrogen of millet at different intra-row spacings in Layyah during 2015 and 2016.
Plant SpacingOptimum N (kg ha−1)Maximum Yield (kg ha−1) Economically Optimum N (kg ha−1)Excessive N at N200 (%)Excessive N at N250 (%)
2015201620152016201520162015201620152016
10 cm191173322730971421312934.54348
15 cm1881743674364414113329.533.54447
20 cm1871713001284114213229344347
Mean1881723300319414113229344347
Assuming prices of N = 0.79 USD kg−1 and millet grain = 0.23 USD kg−1.

