Article

Learning Analytics Using Social Network Analysis and Bayesian Network Analysis in Sustainable Computer-Based Formative Assessment System

1
Department of Adolescent Coaching Counseling, Hanyang Cyber University, Seoul 04763, Korea
2
Division of Police Administration, Dongguk University, Seoul 04620, Korea
*
Authors to whom correspondence should be addressed.
Sustainability 2020, 12(19), 7950; https://0-doi-org.brum.beds.ac.uk/10.3390/su12197950
Submission received: 4 September 2020 / Revised: 18 September 2020 / Accepted: 23 September 2020 / Published: 25 September 2020

Abstract

:
The sustainable computer-based evaluation system (SCE) is a scenario-based formative evaluation system, in which students are assigned a task during a course. The tasks include the diversity conditions in real-world scenarios. The goals of this system are learning to think as a professional in a certain discipline. While the substantive, psychological, instructional, and task developmental aspects of the assessment have been investigated, few analytic methods have been proposed that allow us to provide feedback to learners in a formative way. The purpose of this paper is to introduce a framework of a learning analytic method including (1) an assessment design through evidence-centered design (ECD), (2) a data mining method using social network analysis, and (3) an analytic method using a Bayesian network. This analytic framework can analyze the learners’ performances based on a computational psychometric framework. The tasks were designed to measure 21st century learning skills. The 250 samples of data collected from the system were analyzed. The results from the social network analysis provide the learning path during a course. In addition, the 21st century learning skills of each learner were inferred from the Bayesian network over multiple time points. Therefore, the learning analytics proposed in this study can offer the student learning progression as well as effective feedback for learning.

1. Introduction

Formative assessment systems provide information for teachers and students about whether specific learning goals are being met and what is needed to reach these goals [1,2]. Before the COVID-19 pandemic, the diagnosis and feedback on student learning had been conducted by teachers and instructors in classrooms. Teachers did formative assessments on student learning by interacting with one another in person. Therefore, the additional technology tools for formatively assessing student learning progress were not necessary. However, due to the COVID-19 pandemic, school closures and suspension of exams have been widespread in educational institutions. This crisis renders many conventional means of formative assessment useless [3]. Teachers are not able to meet students in person; therefore, they need alternative strategies to assess student learning. Consequently, online formative assessments that can be implemented via mailing/e-mailing, messaging platforms, and online educational platform tools are increasingly of interest [4,5,6]. Meanwhile, no matter what means are used, formative assessment requires meticulous planning and designing for students, teachers, and parents to support student learning. In addition, an analytic method is necessary to analyze data collected from the formative assessment system for providing information about student learning progress, learning diagnosis, and feedback. Most of all, the analytic method should offer information about which parts or steps are difficult for a student to learn as well as how well the student is doing during a course. While online formative assessment systems have been increasingly proposed and implemented, few analytic methods have been proposed to analyze data collected from the system.
The sustainable computer-based evaluation system (SCE) is an integral learning system linking learning to evaluation in diverse disciplines. In this computer-based evaluation system, learners are assigned to a realistic scenario task dealing with different situations in a certain discipline. Specifically, instructors publish the tasks related to their disciplines on the system. Then, a student can access the tasks. The tasks are basically designed based on a real-world situation in a particular discipline. Therefore, the goal of this evaluation system is to provide the opportunities to think and act as a professional by answering the appropriate responses to a scenario task.
Similar to traditional simulation-based learning systems, this computer-based evaluation system can provide a learning environment in which students can learn to think like professionals in a certain discipline [7]. The task was designed to include a real-world situation. A learner must think like a professional to solve the task. The evaluation system allows us to collect the data on the sequential thinking process of each student. By analyzing the sequential data collected from the evaluation system, the learning pattern of each learner can be investigated and compared with the expected learning pattern. Therefore, the results of analyzing data from the system provide (1) a student’s previous, current, and future learning status and (2) individualized diagnostic information.
The tasks developed used an evidence-centered design (ECD) framework [8,9,10]. ECD is a general assessment design framework in which tasks can be designed to reflect the targeted aspects that the task should measure. The National Research Council (NRC, 2001) recommends that this assessment must be thoughtfully designed by coherently linking the targeted knowledge, skills, and abilities (KSA) [11]. NRC (2001) proposed the assessment triangle, which emphasizes the connections between theory, task design, and analytic methods. The coherent connections support assessment to be valid and reliable. From a similar view, ECD addresses linking substantive theory, task design, and analytic methods for inferring what should be measured for each student. The ECD assessment design framework provides guidance for explicitly incorporating substantive theory about the targeted KSA into the development of tasks. ECD allows assessment developers to generate the task by addressing the following three questions: (1) What complex of knowledge, skills, or other attributes should be assessed? (2) What behaviors or performances should reveal those constructs, and what are the connections? (3) What tasks or situations should elicit these behaviors? These questions are answered in five models in the conceptual assessment framework. The conceptual assessment framework (CAF) provides technical specifications for operational elements, which explain how the information gathered and organized in domain modeling can coherently serve as evidential arguments while carrying out the assessment. The CAF specifies five models: (1) the student models, (2) the task models, (3) the evidence models, (4) the assembly model, and (5) the presentation model. Figure 1 presents the five models.
The five models consist of the construct model, evidence model, task model, assembly model, and presentation model [8]. The construct model addresses the question of what complex of knowledge, skills, or other attributes should be assessed. In the student model, aspects of knowledge, skills, or abilities and their configuration are supposed to be specifically addressed. Since various structures and different levels of complexity in the student model can be constructed, this raises an issue of determining which set of the student model variables is minimally sufficient to differentiate student performances in terms of the purpose of an assessment. With regard to this, psychological perspectives can offer the rationales involved in constructing the student model variables because different psychological perspectives suggest different notions of knowledge, acquisition, and learning processes. The evidence model addresses the questions of what behaviors or performances should reveal those constructs and how they are connected. The evidence model defines how evidence from observables can be identified, accumulated, and linked to the student model variables. This explains the nexus of observables and expectations defined in the student model. The evidence model contains two components: evidence rules and statistical model. The evidence rules specify the rules to identify evidence from the work products that a student produced from a particular task. The measurement model explains how evidence is accumulated and synthesized across tasks in terms of student model variables. Various psychometric models such as classical test theory, item response theory models, and cognitive diagnostic models are involved in this part depending on the purpose of an assessment; therefore, one of the issues here is to choose a suitable psychometric model for the purpose of an assessment. The task model addresses the question of what tasks or situations should elicit these behaviors. The task model provides a set of specifications for the situations, environments, and contexts to elicit student performances to obtain evidence needed for the evidence model. The task model contains the presentation material, work products, and task model variables. The presentation material describes the material which is presented to the student. The work products are student performances and responses to tasks. The task model variables are specifications of aspects/features of tasks which are more likely to evoke the desired evidence. They can be varied depending on the targeted KSAs and degrees of difficulty. The assembly model addresses the question of how much we need to measure. The assembly model describes how the three models above work together to form a balanced assessment properly reflecting what is needed to be measured. Lastly, the presentation model addresses the question of how the assessment looks. The presentation model describes how a task is provided to students. There are many different means for delivering an assessment such as paper and pencil format, computer- and web-based format, and simulation- and game-based format. The requirements for presenting assessments differ depending on the format.
Therefore, the ECD model is a structured assessment design framework in which the substantive theory is explicitly reflected in the design of an assessment applying the suitable analytic methods. Moreover, in the aspects of generating a task, ECD helps assessment developers generate all tasks (1) to obtain evidence about the targeted knowledge, skills, and abilities, (2) to provide scoring rubric systems, and (3) to summarize evidence collected from the tasks based on the scoring rubric [12].
As discussed above, designing and analyzing assessments requires coordination among substantive theory, task design strategy, and analytic modeling considerations. Conceptually, a scenario task in the computer-based evaluation system can be designed based on the idea of epistemic frames grounded in 21st century skills [13,14,15]. Educational fields are of increasing interest to researchers studying 21st century learning skills [16,17,18,19]. More specifically, this system was basically designed to allow learners to develop domain-specific expertise by dealing with different situations under realistic constraints. The evaluation system helps learners understand what it is like to think and act like a professional by engaging in the task. For example, the process is as follows: (1) A learner enters the evaluation system and reads the scenario task, and then responds by addressing the scenario task. (2) The responses to the task from the student can be assessed as to whether they display 21st century learning skills. (3) Lastly, the sequential process answers of each student can be compared to the expected learning path. This information is to be used as individual diagnostic feedback.
The tasks in the evaluation system were developed to evaluate the five elements grounded in 21st century learning skills. In this study, the tasks were designed to reflect skills used by a data analyst. The five elements including skills, knowledge, identity, values, and epistemology were defined as follows [20]:
Skills (S) (dealing with data): being able to communicate clearly; being able to think and act as a professional data analyst in a particular situation.
Knowledge (K) (terms of statistics): knowing basic knowledge in data analysis for dealing with different research questions and data characteristics.
Identity (I) (as a data analyst, as a professional): having a way of seeing oneself as commensurate with how members of the data analyst community see themselves.
Values (V) (working for data and society, like a professional): being willing to listen to, and take seriously, the ideas of others.
Epistemology (E) (solving an issue and a problem in dealing with data): being able to justify actions as legitimate ways within the data analyst community.
Once the tasks are developed and implemented in the computer-based evaluation system, a student is able to select a task and respond to it. The responses to a task are stored in log file data. The log file data are sequential, dependent, and complex. Using the data-mining method through social network analysis, evidence is identified from the log file data. The evidence was accumulated through a Bayesian network analysis to generate and estimate a student learning path. As a similar research, von Davier (2017, 2019) proposed a framework of computational psychometrics, which is a theoretical psychometric framework as a blend of data-driven AI-based computational models, stochastic theory, and theory-driven psychometrics. This theoretical psychometric framework involves the (1) test development and psychometric modeling based on the application of ECD and (2) data analysis based on data mining and machine learning algorithms. The computational psychometric framework has been applied to game- and simulation-based assessment and real-time learning system [21,22].

2. Research Objectives

The purpose of this study is to introduce a framework of the learning analytic method using social network analysis and a Bayesian network for the complex data collected from the sustainable evaluation system. Since the complex data are sequential and dependent, first, the evidence related to 21st century skills were tagged from log file data based on scoring rubrics. Next, the tagged data were computed for drawing a graphical representation of each learning path and calculating the weighted density of the social network analysis to capture students’ learning structure over time. These visual methods offer the possibility of capturing evidence for identifying meaningful learning patterns. The final information was used as evidence to evaluate the performances of a student and to provide feedback about their 21st century skills using a Bayesian network.

3. Materials and Methods

3.1. Materials and Subjects

Figure 2 presents the high-level abstraction of the learning analytic procedure framework in this computer-based evaluation system. Basically, there are four layers including (1) a testing system: a student is able to select a task and respond to it; (2) a data-mining system: evidence is identified from the log file data and tagged to the corresponding elements of 21st century skills; (3) a data analysis system: evidence is accumulated to make inference about a student learning progression; and lastly, (4) a delivery system: diagnostic feedback is delivered to instructors and students based on the results of the data analysis system.
Next, Figure 3 shows the example of the task system in the computer-based evaluation system. An instructor can generate the tasks and store them here; afterwards, they can select some of the tasks for creating a testing.
When students enter the system, they can see the task generated by an instructor. The students respond to the task and their responses are stored as log file data. Then, the log file data are tagged by the elements of 21st century skills, which is a data-mining procedure. In the data mining, the evidence of 21st century skills in each student response is identified. Lastly, the evidence is compiled and summarized in order to infer about a student’s learning status in terms of 21st century skills in the data analysis system.
The real data study was conducted using log file data collected from three hundred students. All students took the tasks during an introductory statistics class and were evaluated as to whether they possess the required abilities including skill, knowledge, identity, values, and epistemology of a data analyst. Table 1 shows the descriptive statistics of the subjects.

3.2. Method

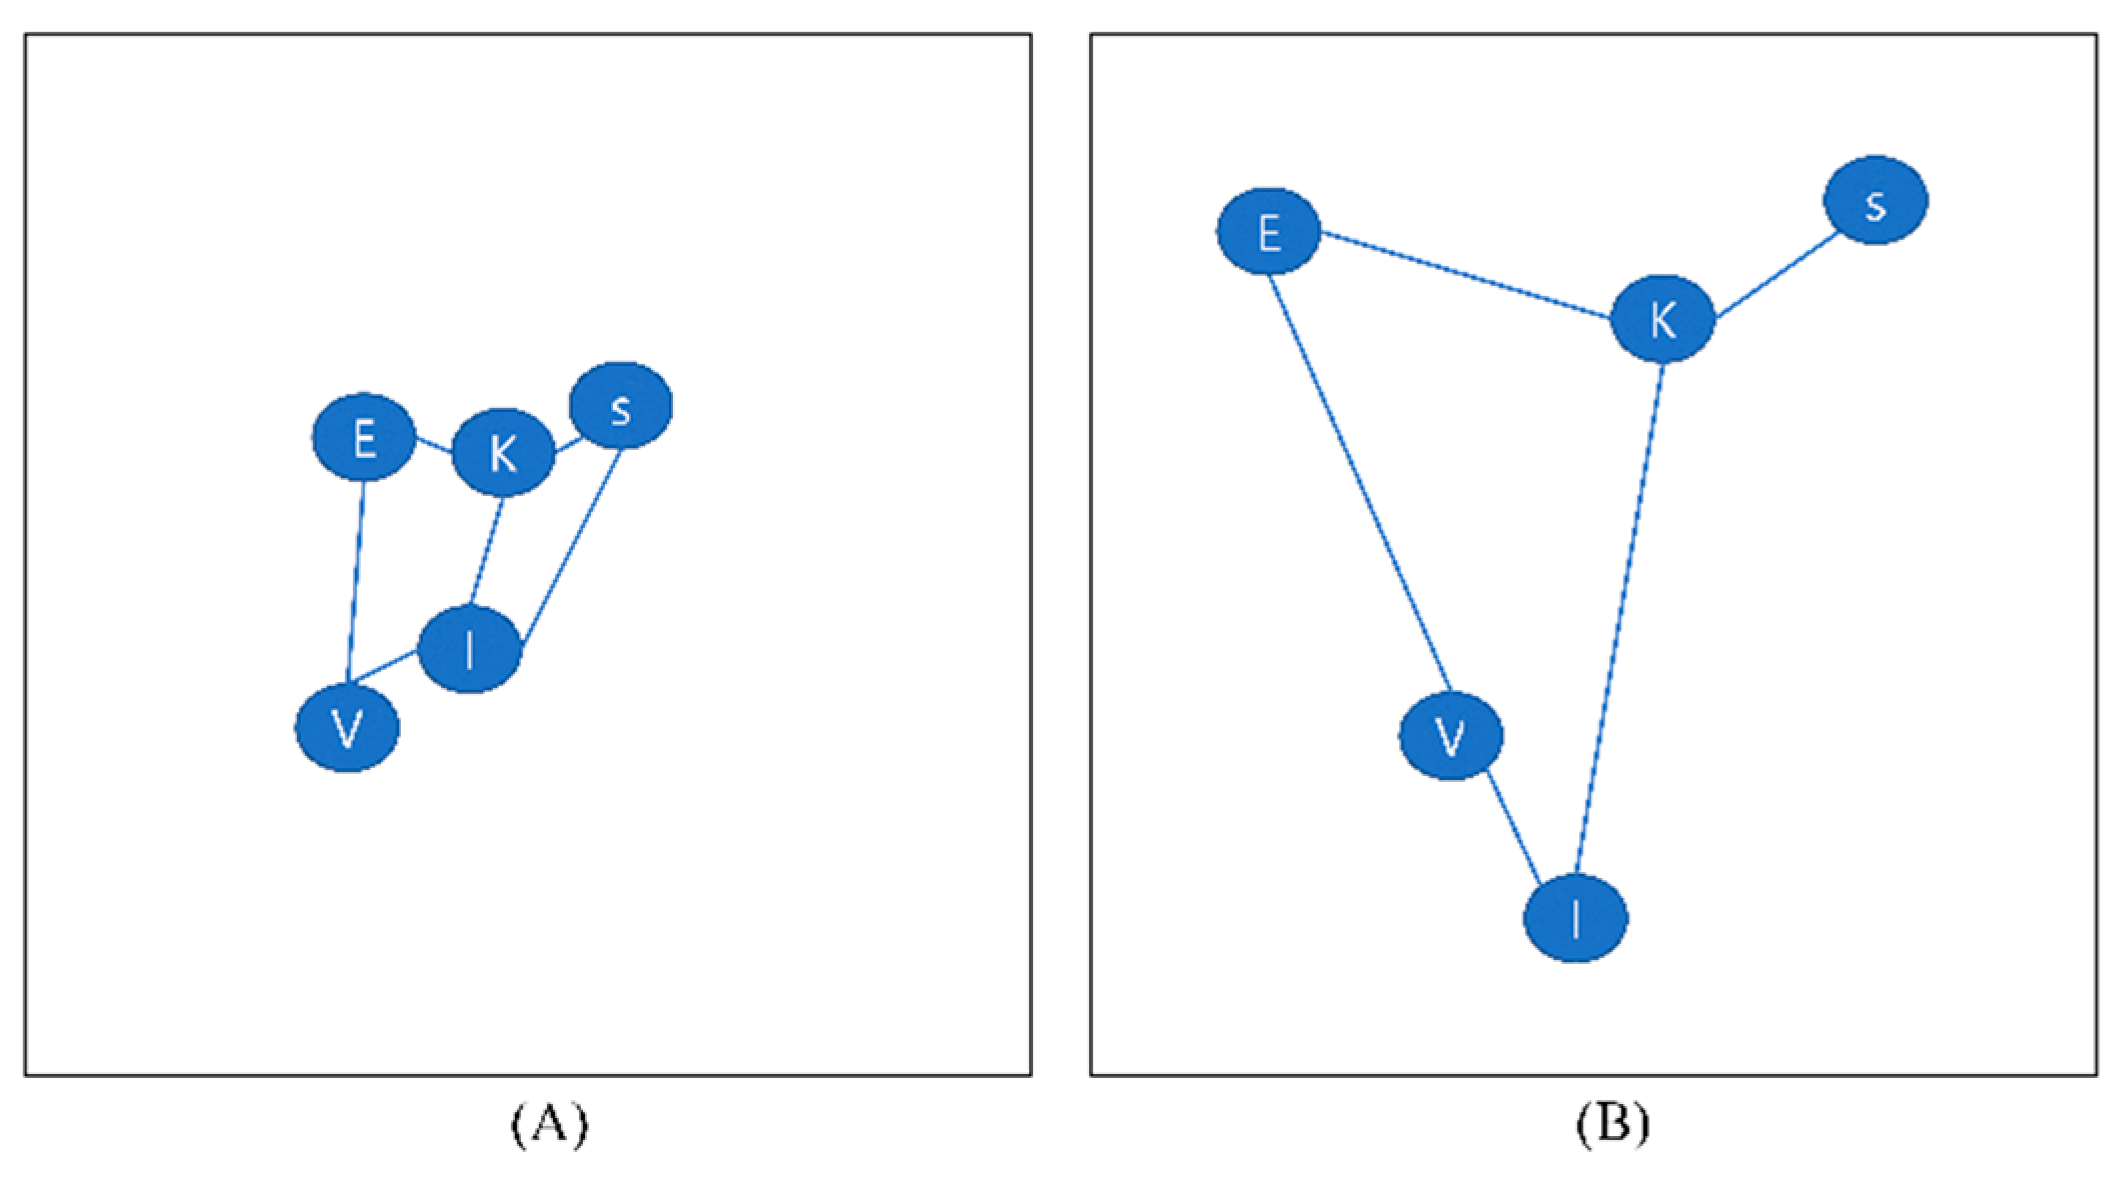
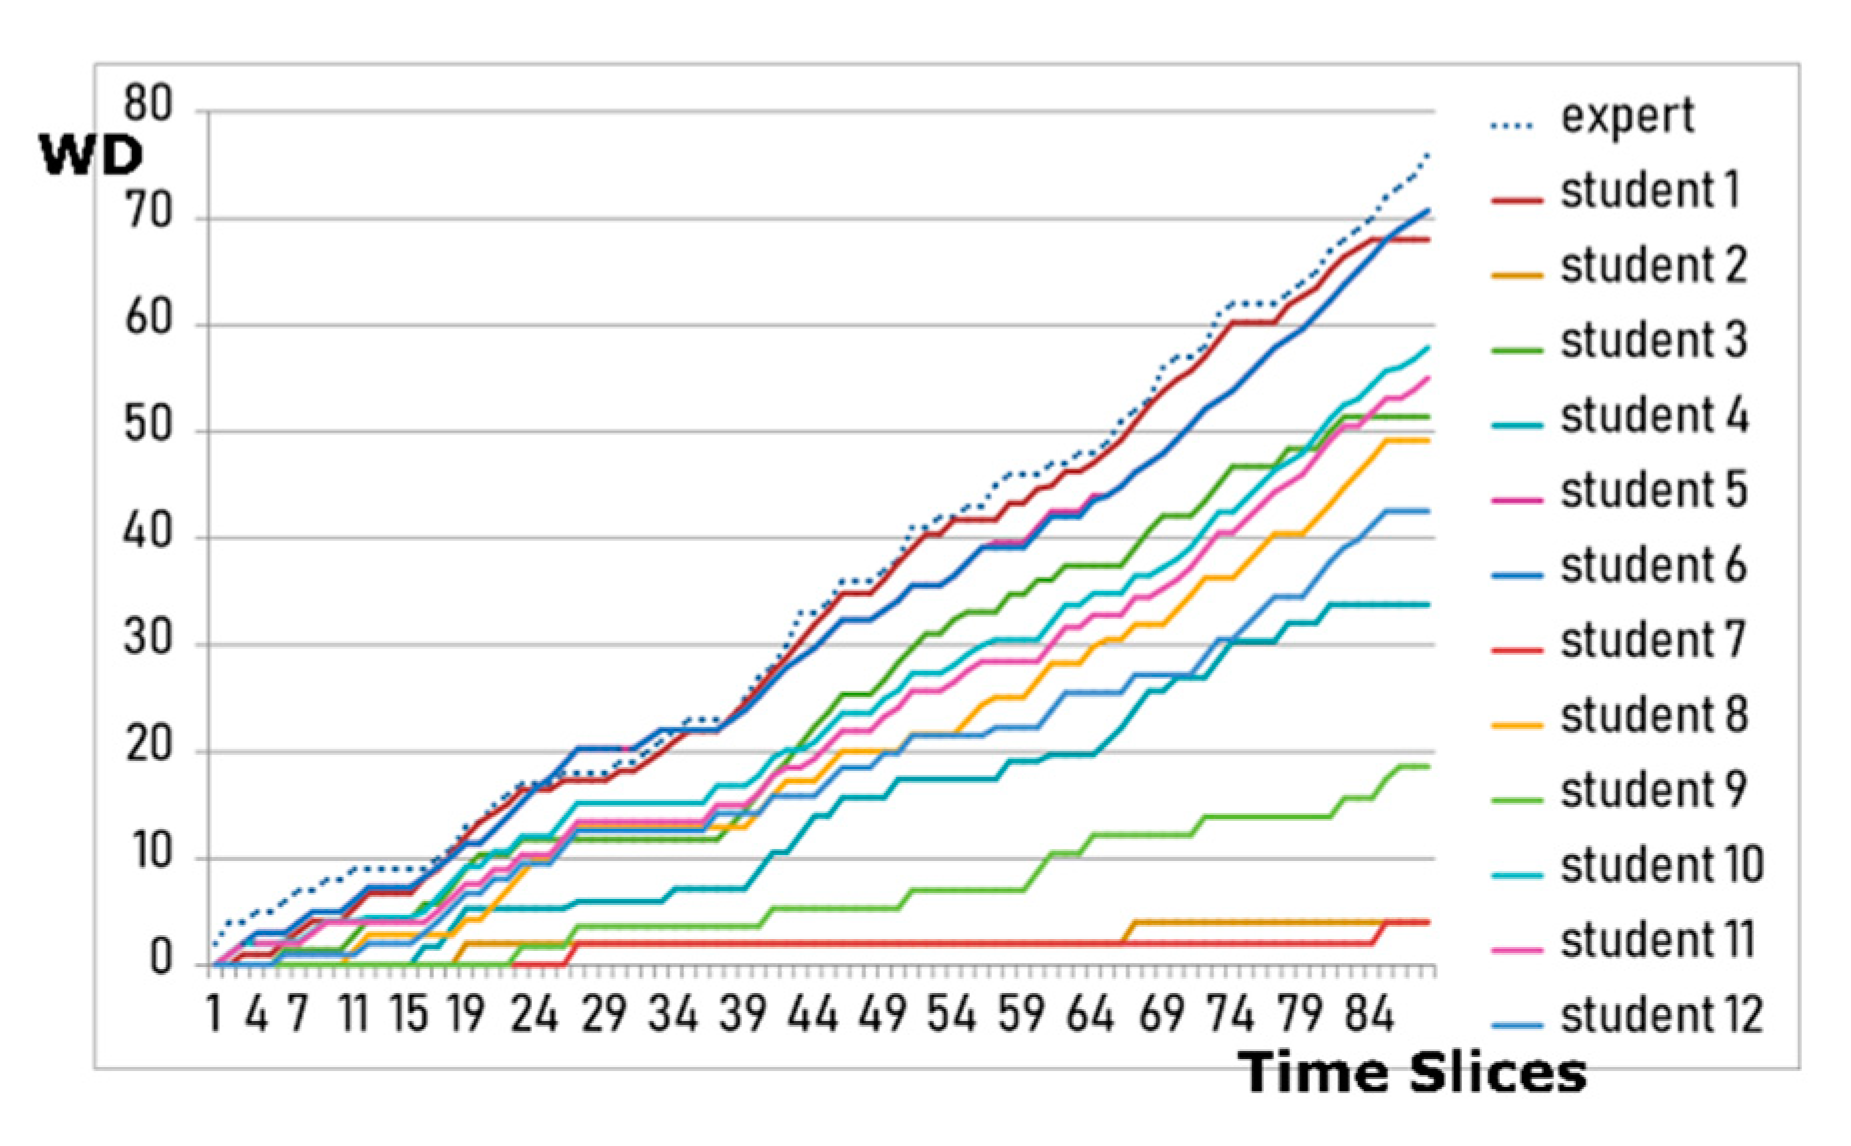
3.2.1. Learning Analytics Using Social Network Analysis

This study used social network analysis (SNA), which was originally used to represent relationships among individuals. The network, consisting of nodes (representing individuals) and edges (representing relationships), is depicted in different types of graphs and diagrams [23]. In this study, the nodes represent the key elements (i.e., skill, knowledge, identity, value, and epidemiology) and edges indicate the relationship between the nodes. Once the graphical representations were drawn, the representations of the elements, including the structure, nodes, direction, and distance, were compared with each other. In this study, the sequential responses were collected, and data mining was conducted. The refined data were analyzed by social network using R (www.r-project.org). The Network Package of R [24] was used for creating and plotting the network.
Data types for social network analysis need to be a sequential matrix. For this, the first method is to create adjacency matrices using the data. The adjacency matrices are assembled, containing indicator codes reflecting the co-occurrence of all pairs of epistemic frame elements within any given interaction. With the adjacency matrices, the node graph can be drawn. The analysis of social network analysis is as follows below.
Evidence tag: the observable evidence for a student related to the skill, knowledge, identity, value, and epidemiology elements are recorded as a “1”. Dichotomous (i.e., yes-no/1-0) codes are used to indicate whether evidence was present or absent. A sequence of observations for a single learner involving responses to a scenario task was recorded in a data file, and then the adjacency matrices were computed based on the basic sequence observables. The data file of each learner’s basic sequence observation might look like the Table 2.
Adjacency matrix for computing conditional probability: from the basic sequence data file, an adjacency matrix can be computed. The adjacency matrix is a statistical representation of the relational nodes (the key elements evaluated). The adjacency matrices are entries of “1” whenever two elements of skill, knowledge, identity, value, and epidemiology are used by a learner concurrently within the same time. Since skill and knowledge are used by a learner concurrently at time slice 1 in Table 2, the adjacency matrix looks like Table 3.
Next, adjacency matrices are accumulated across different time slices by simply summing each matrix across the time slices. The graphical representation of social network analysis can be drawn based on the adjacency matrices.
Computing the weighted density: since adjacency matrices can be computed by each slice, their data can be compiled across different slices by simply summing the individual entries in the adjacency matrices. Accordingly, summary measures can also be computed in this way, including the relative centrality of each node in the network and the overall density of the network using the social network analysis method. In this study, we computed the weighted density (WD) of the network for any given cumulative adjacency matrix, which is computed as follows:
W D t ( N ) = 1 2 f = 1 F f = 1 F a f f , t 2  
where a f f , t 2 is the squared entry in the cumulative adjacency matrix for nodes f and f’ at slice t.
The overall weighted network density thus represents the average pair-wise association between nodes in the network. With WD values, a student learning trajectory can be computed and compared with others.

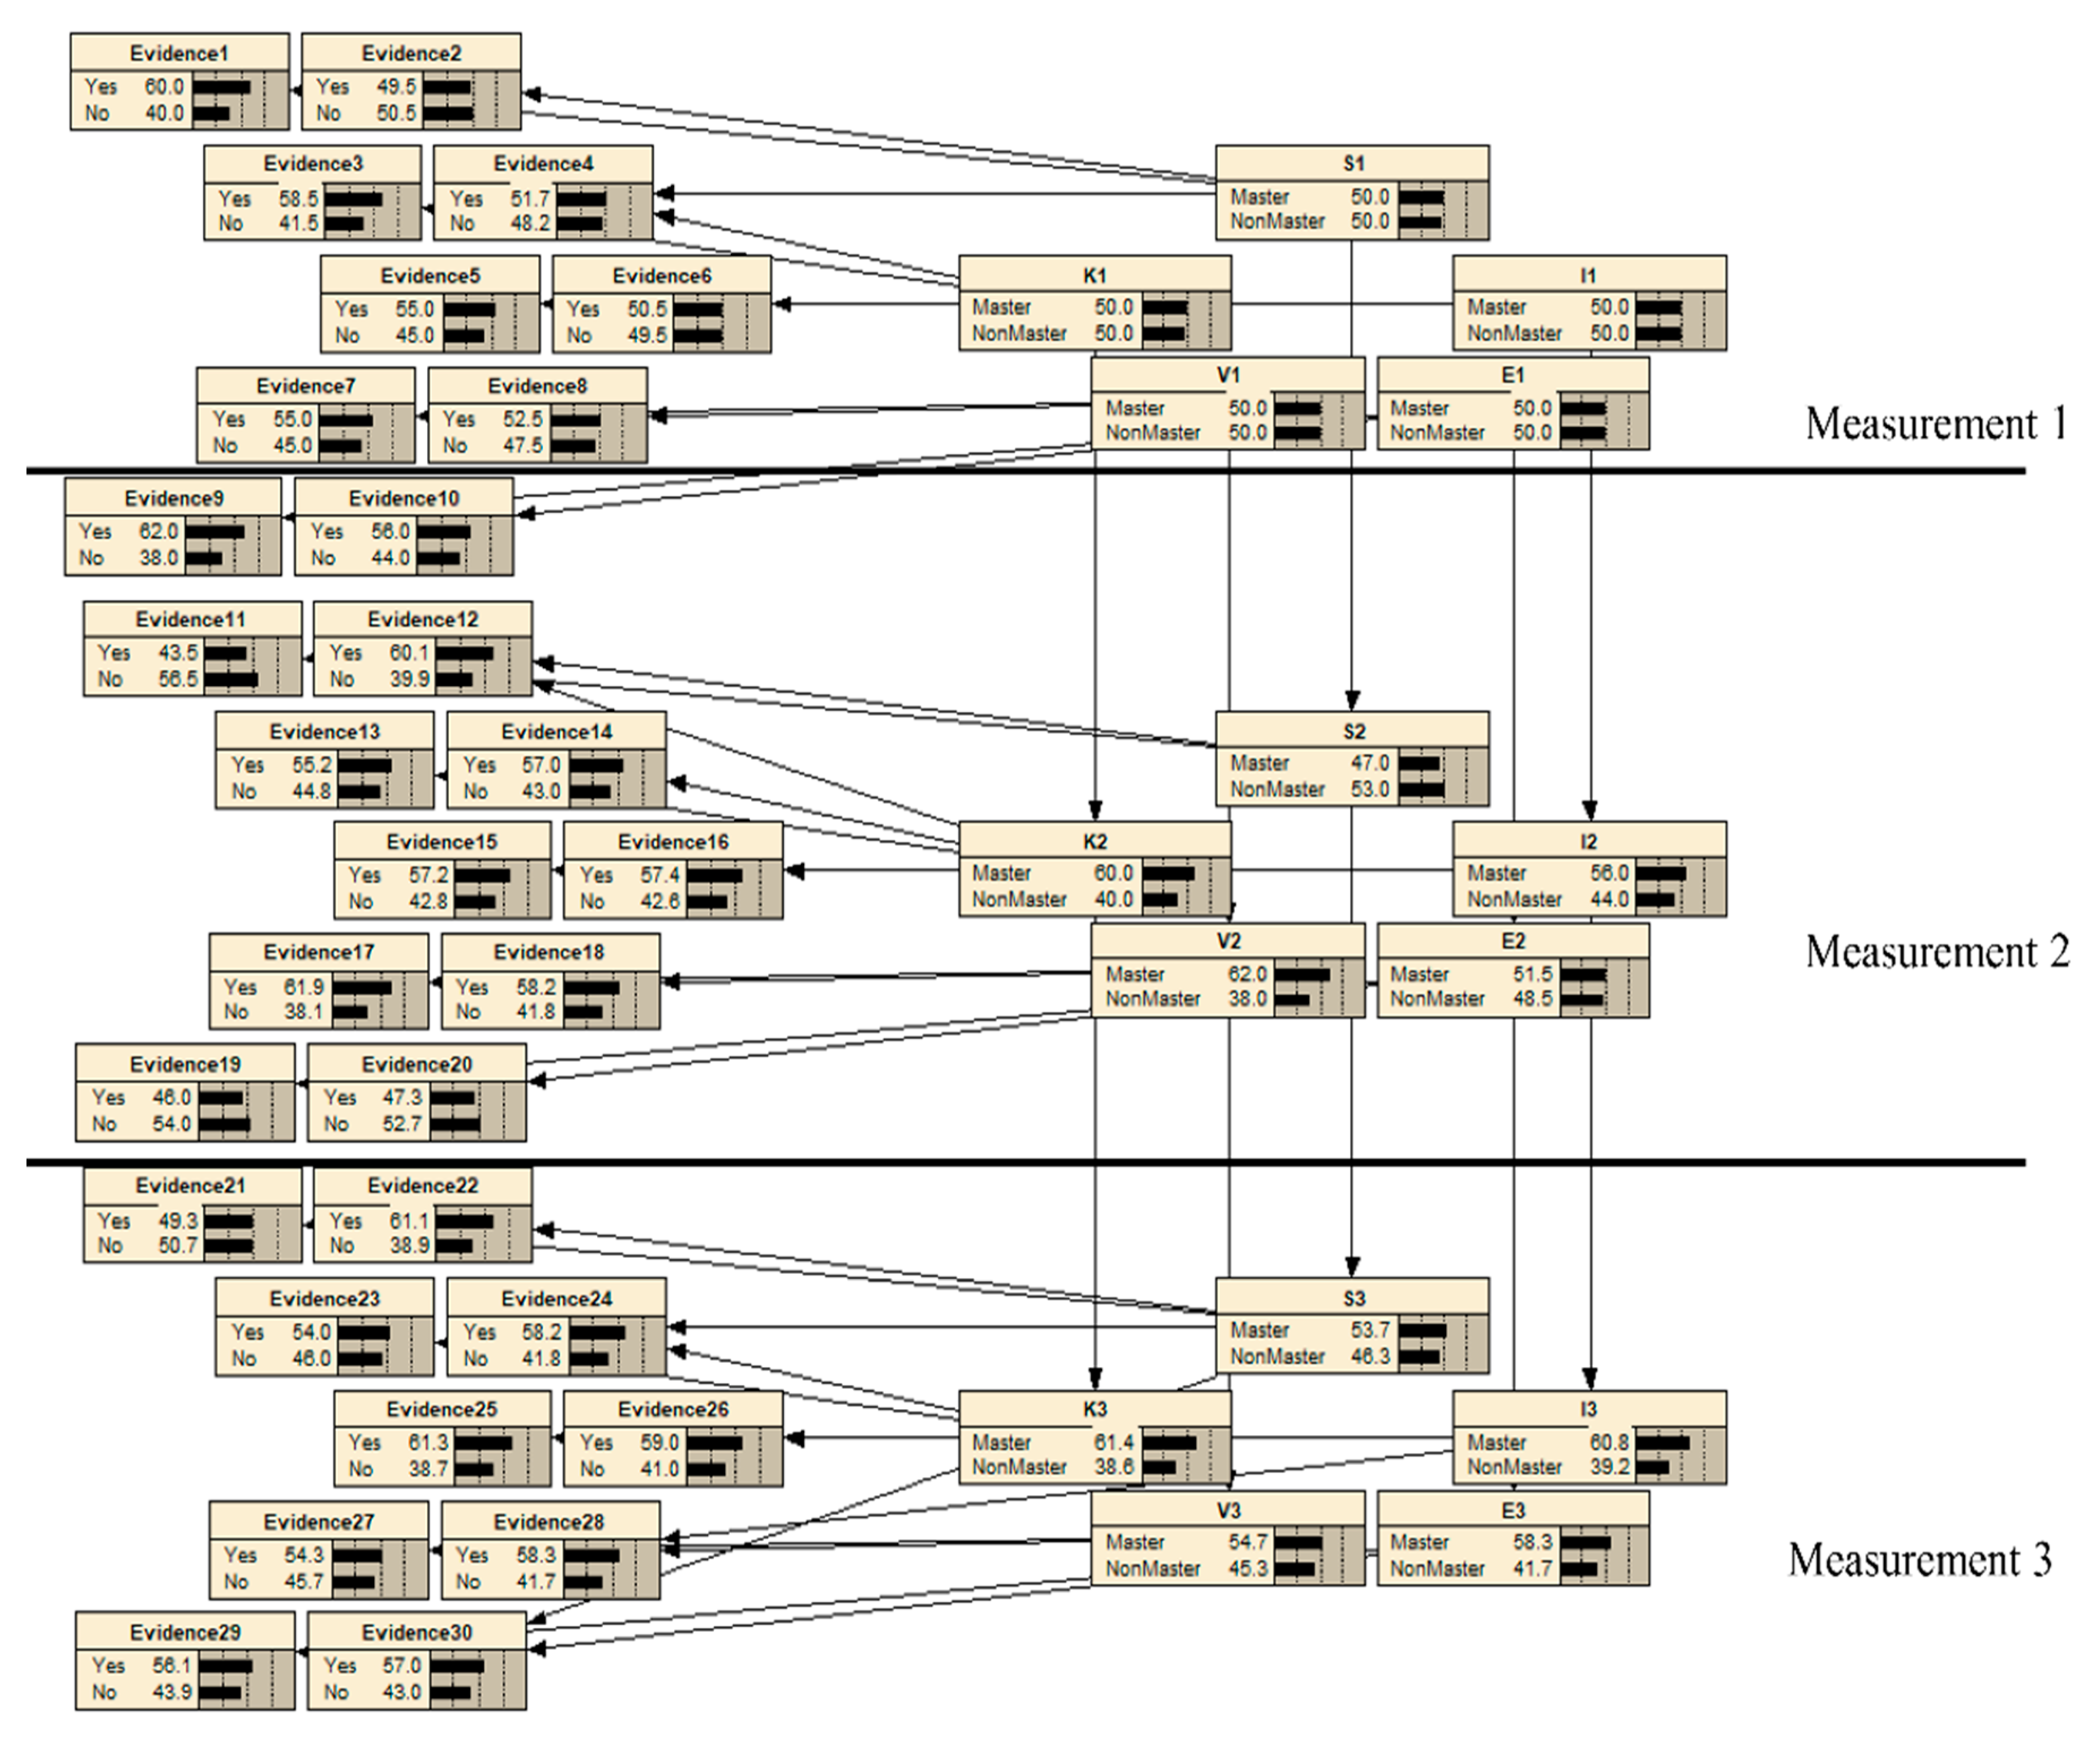
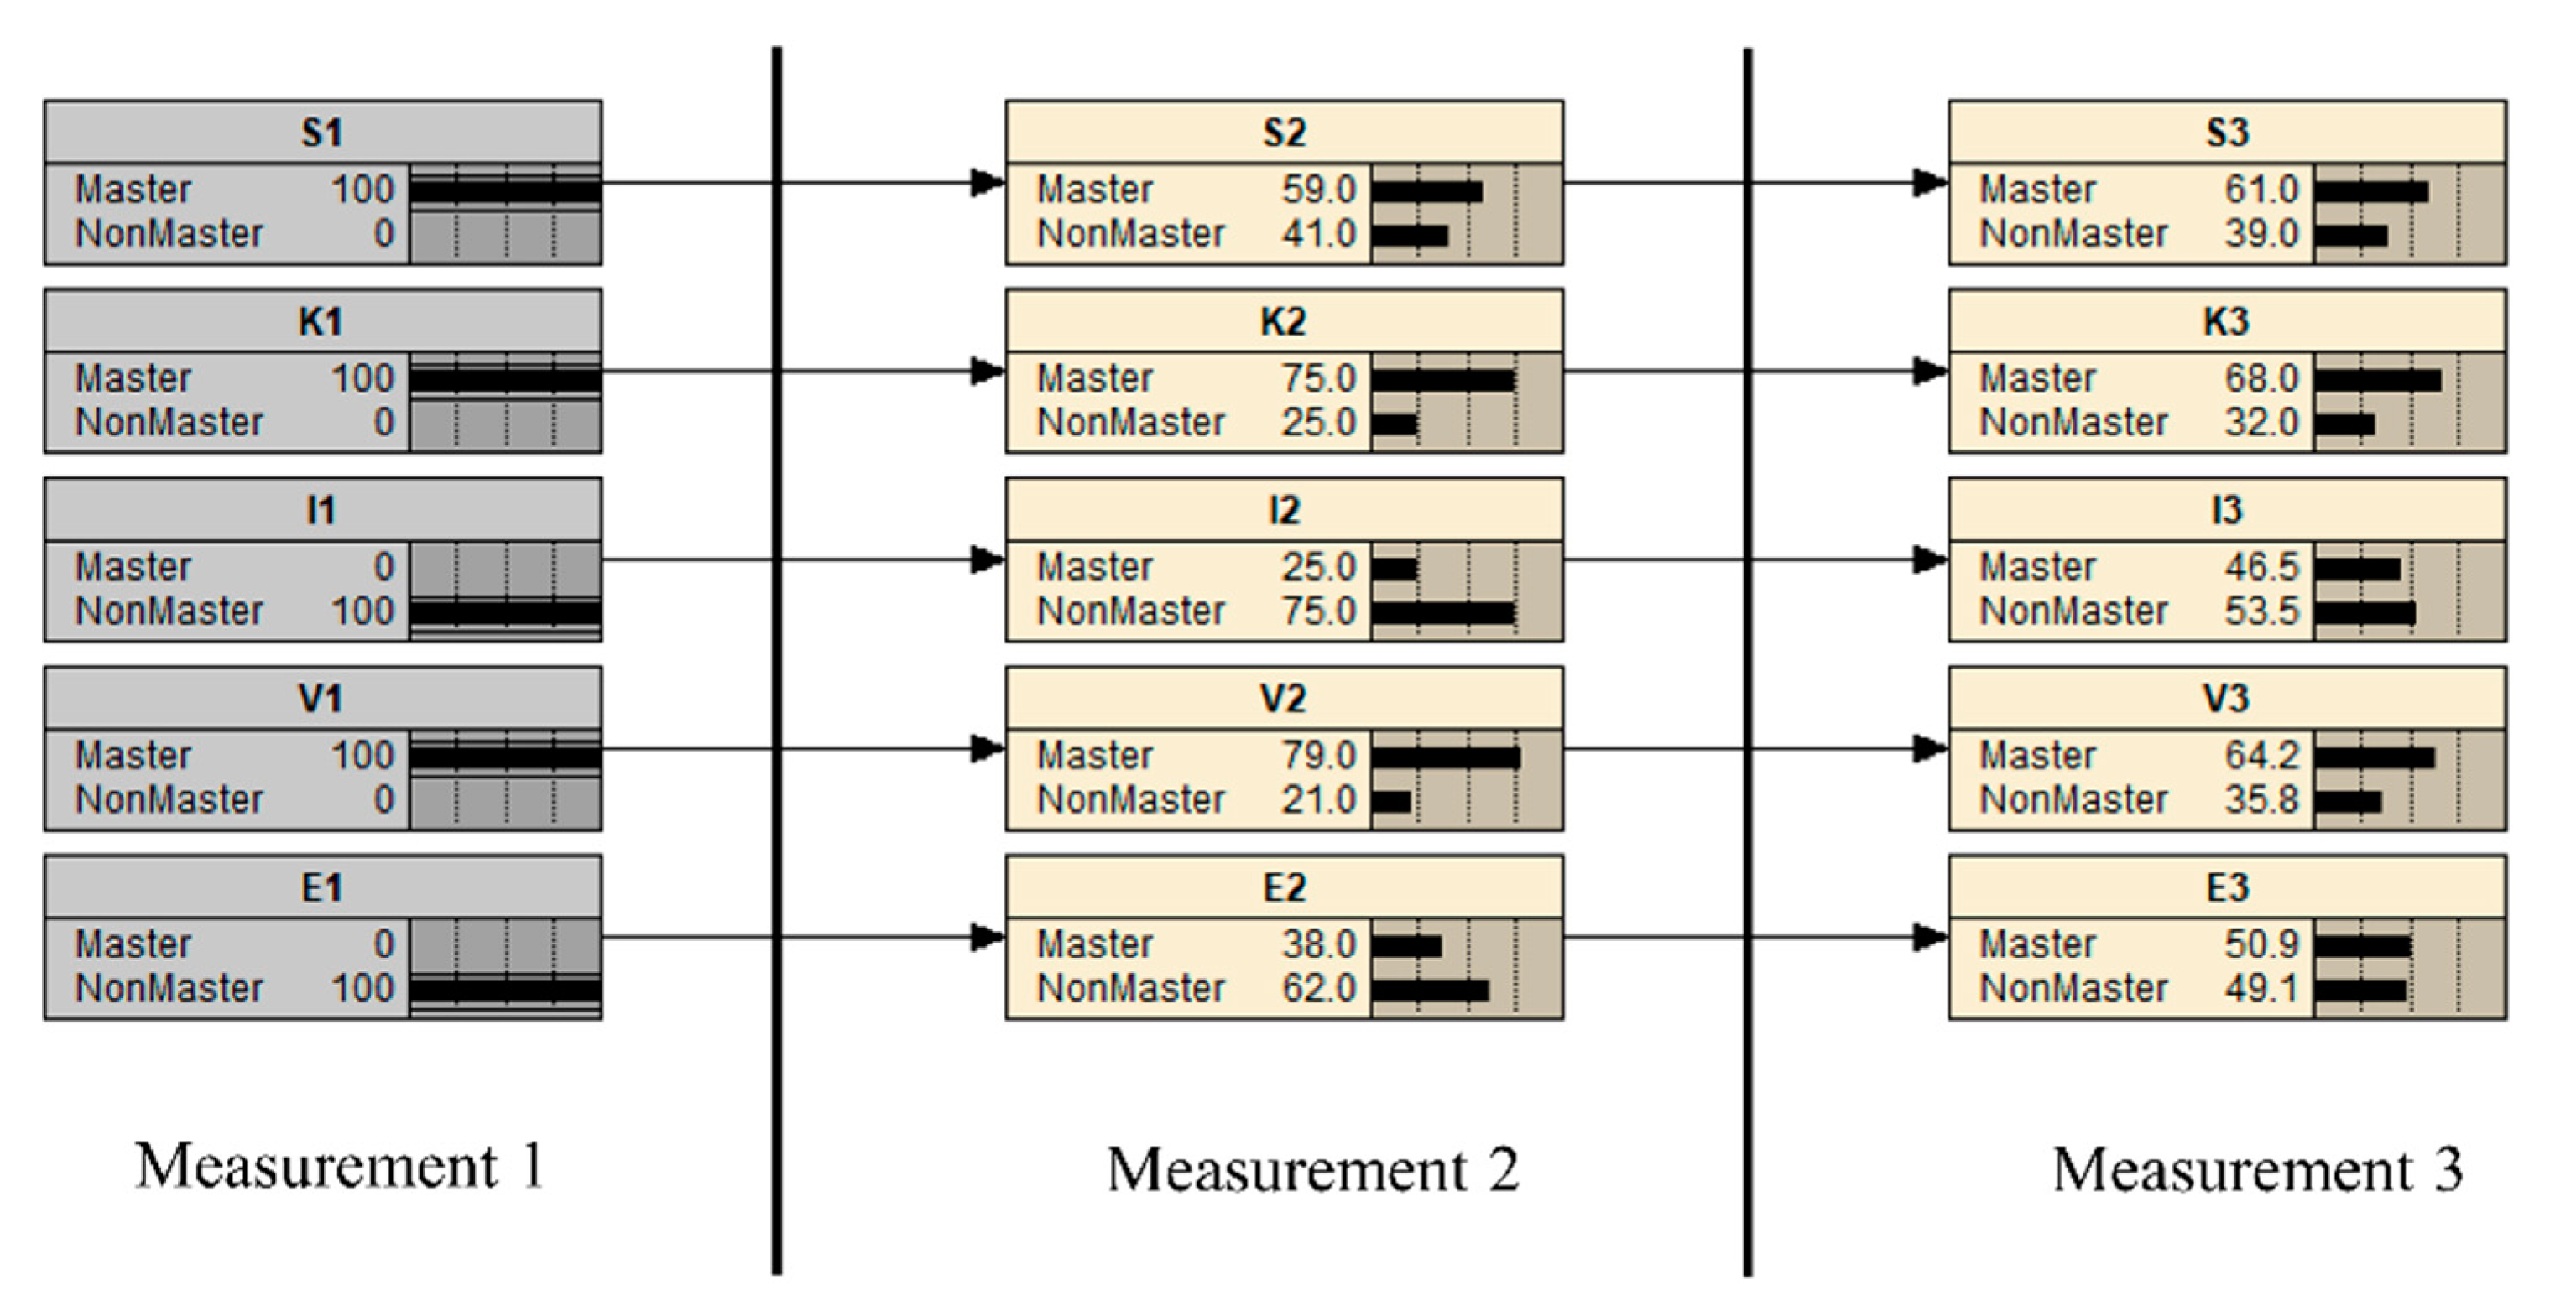
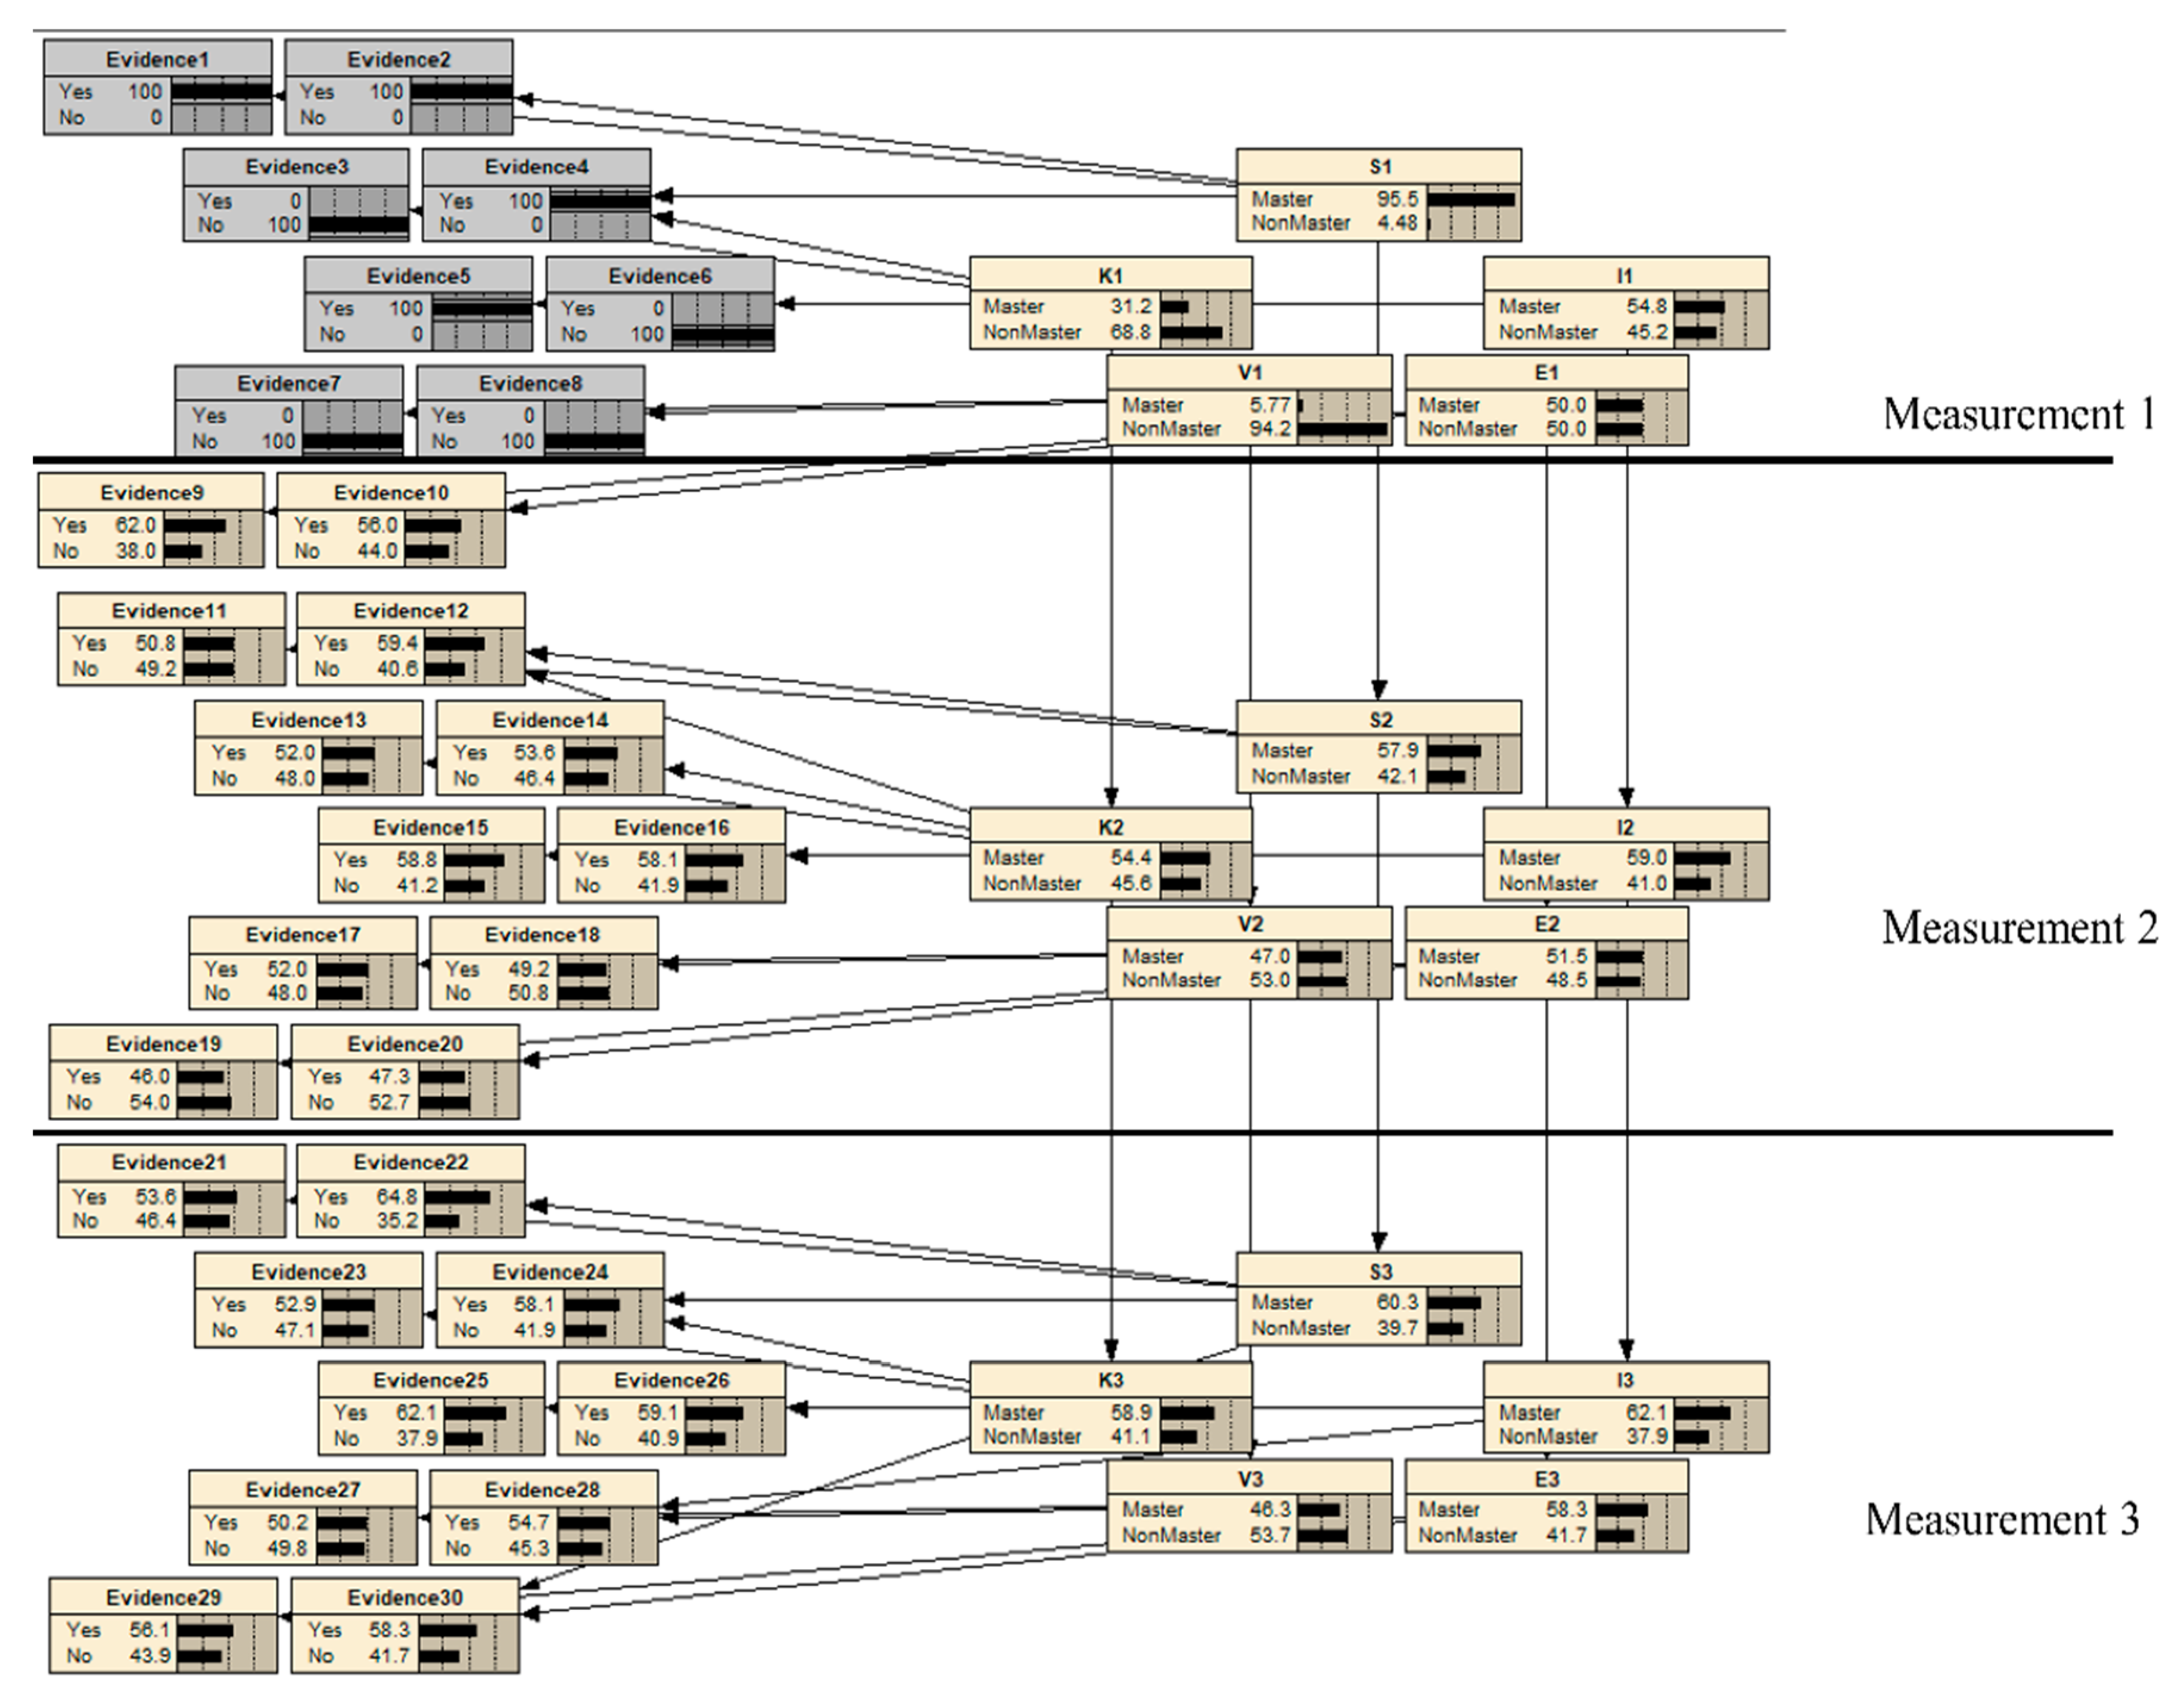
3.2.2. Bayesian Network

A Bayesian network (BN) is a probability-based statistical modeling framework [25,26,27,28,29,30], which consists of a graphic model and a probability model. With two models, a BN can model a probabilistic causal relationship between random variables in a graphical manner. A BN consists of two main concepts in a graph model: (1) a set of nodes (A) representing unobservable or observable variables and (2) a set of edges (E) representing relations between the variables. A graph is a pair (A,E). A state of a node is a value, so A is associated with a finite set of possible values {ai,1, ai,2,⋯ai,n−1, ai,n}. An edge in E between two nodes indicates the relationship and causal dependency between two random variables.
In a probability model, a BN consists of three probability distributions: marginal probability, conditional probability, and joint probability. A node, from which the edge starts, is assumed to be a cause, called a child node. The other node, to which the edge connects, is a consequence, and called a parent node denoted by (pa(Ai)). The formal notation of the conditional probability distribution associated with each variable given all of its parents’ variables is as follows:
P ( A i = a i | p a ( A i ) )
The formal notation of a joint distribution associated with a BN is as follows:
P ( X 1 = x 1 , X 2 = x 2 , , X P = x P ) = p = 1 P P ( X p = x p | p a ( X p ) )
Lastly, if there are no parents (i.e., pa(A) is empty), then the conditional probability is regarded as a marginal probability.
To understand the concepts, consider an example of an acyclic directed graph with three variables in Figure 4.
Acyclic directed graphs are represented by a joint probability distribution over three variables, A, B, and C, which can be decomposed into a product of conditional probability distributions. The conditional dependences of the variables correspond to the acyclic directed graphs. The factorization is as follows:
P(A,B,C) = P(C|A,B) P(B|A) P(A)
P(C|A,B) is a conditional distribution of variable C, given the variable of A and B. P(B|A) is a conditional distribution, given the variable A. P(A) is a marginal distribution. These probability distributions correspond to the directed graphical model (Figure 4). For example, P(C|A,B) is the probability distribution of variable C that is conditionally on its parents of variable A and B in the directed graph.
Once the joint distribution of variables are expressed in terms of the recursive representation, states of any variables can be updated by new information through Bayes’ rule. For example, suppose that there are two variables A and B. The variable A is given the variable B. Therefore, the factorized form is P(A|B) P(B). When A = x is observed, P(B|x) can be calculated by Bayes’ rule:
P ( B | A = x ) P ( B ) P ( A = x | B )
There are two procedures including the prior distribution, P(B), and the posterior distribution, P(B|A = x). The prior distribution is expressing the initial belief about B before any observations have been made. The posterior distribution is updating the belief about B based on the observation A = x. Therefore, the equation in Bayes’ rule consists of the posterior distribution, P(B|A = x), which is proportional to the likelihood, P(A = x|B), multiplied by the prior distribution, P(B).
This study used a BN to infer about student learning progression of 21st century skills in a data analytic discipline. The BN can estimate and update the learning status by observations through the responses to the tasks.

4. Results

4.1. Social Network Analysis

Figure 4 shows the graphs derived from the analysis of the social network. Two examples of the students’ learning paths are shown across the sequential data in Figure 5. From the networks, the performances of the students can be compared. Furthermore, it can evaluate how close a student’s learning path approximates the representation of the expert’s one. Five types of nodes can be found in the network, representing the key elements (i.e., skill, knowledge, identity, value, and epistemology). The closer nodes are to each other, the stronger the relationships represented in the network. Therefore, the locations and distances of the nodes can serve as evidence for evaluating each student’s learning. In addition, by computing the distances of the nodes between the expected representation of an expert and a particular learner, how close a learner responds to the correct answer can be evaluated.
For the summary statistics, the social network analysis provides weighted densities (WDs) for each learner. Figure 6 displays the changes of WD values across the steps solving the task for some example students. With this information, a student’s learning trajectory can be computed. The similarities and dissimilarities of the students’ learning trajectories are compared and evaluated to provide effective feedback for enhancing their learning.

4.2. Bayesian Network

The same students are repeatedly assessed at more than one point during a lesson under a formative assessment system. This study assessed students with three measurement time points. Figure 7 presents a BN for modeling 21st century learning skills in three measurement time points. The BN consists of ten tasks at each measurement time point and five nodes corresponding to skill, knowledge, identity, value, and epistemology. The five nodes are the proficiency variables representing students’ mastery states in skill, knowledge, identity, value, and epistemology. Then, tasks were assigned to measure the mastery or non-mastery of the five elements in 21st century skills.
The task variable has two values for the presence and absence of evidence. The proficiency variable and task variables have their own probability tables. For the proficiency variable, equal probabilities are considered able to take the values of mastery and non-mastery when there is no information regarding students’ proficiency and any information regarding the task has not been observed. For the task variables, hypothesized conditional probabilities reflecting task characteristics associated with the states of the proficiency variable are considered.
To understand how a student mastery status changes, Figure 8 displays only five nodes for the five elements (skill, knowledge, identity, value, and epistemology) across different measurement time points. For example, one could consider a situation where the student status at the first measurement occasion is known. This information is propagated through the network by Bayes’ theorem. The posterior distribution of the nodes of five elements in the next two measurement time points given the student’s states at the first measurement occasion can be updated by using the transition function. Figure 8 shows the posterior distributions at the next two measurement time points given that a student status about skill, knowledge, identity, value, and epistemology is [master, master, non-master, non-master, and non-master].
Once a student’s responses to ten tasks at the first measurement time point have been observed, this information is propagated through the network via Bayes’ theorem to yield the posterior probability distribution of the student’s status about skill, knowledge, identity, value, and epistemology. Figure 9 shows the BNs when data are available at the first measurement time point.

5. Discussion

Simulation-based assessments, learning systems, and intelligent tutoring systems increasingly have captured attention in education with some potential benefits [31]. The evaluation systems have students advance through steps leading up to the solution of a problem, while being provided feedback and hints to progress through these steps as well as the final answer [32,33,34,35]. Therefore, evaluation systems can gather information about student performances on intermediate steps as well as the final answer, so that they can measure not only what a student knows, but also how a student solves problems and what strategies the student uses to complete a task. This provides information about which parts or steps are difficult for a student to learn, as well as how well the student is doing during a course. An analytic method is necessary in order to obtain such evidence.
This study introduced a framework of an analytic method for analyzing the data collected from a sustainable computer-based evaluation system. In the system, an instructor can generate tasks in any kind of discipline. Further, the system can record individual behaviors while interacting with the system as much as possible. These data sources can offer the possibility of capturing evidence for identifying a meaningful problem-solving process and learning patterns [36,37]. This analytic framework is based on computational psychometrics. The analytic framework including a social network analysis [38,39] and Bayesian network analysis allows us to analyze the complex data collected from the computer-based evaluation system. The graphical method was able to capture students’ learning structure over time. Moreover, the weighted density can provide student learning trajectories. These analytic methods offer the possibility of capturing evidence for identifying meaningful learning patterns. Furthermore, Bayes nets have been useful in analytics as they allow one to infer about student learning progression.
The current study has several limitations. First, the application study was conducted in a data analytic area. Future research could be conducted in similar studies in diverse disciplines. Second, this study did not assess the effectiveness of diagnostic feedback from the evaluation system. In this study, once students completed the tasks, they were provided with feedback from the results of the testing. However, the influence of the feedback on the students’ learning was not investigated. In a future study, it would be important to verify the validity, stability, and effectiveness of the evaluation system by studying the effectiveness of the feedback.
Although this study has several limitations, it proposes a novel analytic method framework, which offers (1) inferring about student learning progression and (2) interpreting the difference between expected and observed student progress mapped to conceptually defined learning progression. Social network analysis and Bayes nets can be useful tools for these purposes.

Author Contributions

Conceptualization, supervision, methodology, data analysis, writing: Y.C. writing, editing: Y.I.C. All authors have read and agreed to the published version of the manuscript.

Funding

This work was supported by the Ministry of Education of the Republic of Korea and the National Research Foundation of Korea (NRF-2019S1A5A2A03052192).

Acknowledgments

The authors wish to express thanks to Binna Lee for data collection and James Hesson for editorial services.

Conflicts of Interest

No potential conflict of interest relevant to this article was reported.

References

  1. Bennett, R.E. Formative assessment: A critical review. Assess. Educ. Princ. Policy Pract. 2011, 18, 5–25. [Google Scholar] [CrossRef]
  2. Black, P.; Wiliam, D. Assessment and Classroom Learning. Assess. Educ. Princ. Policy Pract. 1998, 5, 7–74. [Google Scholar] [CrossRef]
  3. Khan, R.A.; Jawaid, M. Technology Enhanced Assessment (TEA) in COVID 19 Pandemic. Pak. J. Med. Sci. 2020, 36, 108. [Google Scholar] [CrossRef] [PubMed]
  4. Nagandla, K.; Sulaiha, S.; Nalliah, S. Online formative assessments: Exploring their educational value. J. Adv. Med. Educ. Prof. 2018, 6, 51–57. [Google Scholar]
  5. Kusairi, S.; Noviandari, L.; Parno, P.; Pratiwi, H.Y. Analysis of Students’ Understanding of Motion in Straight Line Concepts: Modeling Instruction with Formative E-Assessment. Int. J. Instr. 2019, 12, 353–364. [Google Scholar] [CrossRef]
  6. McCallum, S.; Milner, M.M. The effectiveness of formative assessment: Student views and staff reflections. Assess. Eval. High. Educ. 2020, 1–16. [Google Scholar] [CrossRef]
  7. Shaffer, D.W.; Hatfield, D.; Svarovsky, G.N.; Nash, P.; Nulty, A.; Bagley, E.; Frank, K.; Rupp, A.A.; Mislevy, R. Epistemic Network Analysis: A Prototype for 21st-Century Assessment of Learning. Int. J. Learn. Media 2009, 1, 33–53. [Google Scholar] [CrossRef] [Green Version]
  8. Mislevy, R.J.; Almond, R.G.; Lukas, J.F. A brief introduction to evidence-centered design. ETS Res. Rep. Ser. 2003, 2003, i-29. [Google Scholar] [CrossRef]
  9. Mislevy, R.J. Evidence and inference in educational assessment. Psychometrika 1994, 59, 439–483. [Google Scholar] [CrossRef]
  10. Mislevy, R.J. Probability-based inference in cognitive diagnosis. ETS Res. Rep. Ser. 1994, 1994, i-31. [Google Scholar] [CrossRef]
  11. Pellegrino, J.W.; Chudowsky, N.; Glaser, R. Knowing What Students Know: The Science and Design of Educational Assessment; National Academy Press: Washington, DC, USA, 2001. [Google Scholar]
  12. Mislevy, R.J. The Concept of Validity: Revisions, New Directions and Applications; Information Age Publishing: Charlotte, NC, USA, 2009. [Google Scholar]
  13. Rupp, A.A.; Templin, J.L. Unique Characteristics of Diagnostic Classification Models: A Comprehensive Review of the Current State-of-the-Art. Meas. Interdiscip. Res. Perspect. 2008, 6, 219–262. [Google Scholar] [CrossRef]
  14. Qian, M.; Clark, K.R. Game-based Learning and 21st century skills: A review of recent research. Comput. Hum. Behav. 2016, 63, 50–58. [Google Scholar] [CrossRef]
  15. Taub, M.; Azevedo, R. Using Sequence Mining to Analyze Metacognitive Monitoring and Scientific Inquiry Based on Levels of Efficiency and Emotions during Game-Based Learning. J. Educ. Data Min. 2018, 10, 1–26. [Google Scholar]
  16. Hwa, S.P. Pedagogical change in mathematics learning: Harnessing the power of digital game-based learning. J. Educ. Technol. Soc. 2018, 21, 259–276. [Google Scholar]
  17. Van Laar, E.; Van Deursen, A.J.; Van Dijk, J.A.; De Haan, J. The relation between 21st-century skills and digital skills: A systematic literature review. Comput. Hum. Behav. 2017, 72, 577–588. [Google Scholar] [CrossRef]
  18. Rios, J.A.; Ling, G.; Pugh, R.; Becker, D.; Bacall, A. Identifying Critical 21st-Century Skills for Workplace Success: A Content Analysis of Job Advertisements. Educ. Res. 2020, 49, 80–89. [Google Scholar] [CrossRef] [Green Version]
  19. Howard, P. Twenty-First Century Learning as a Radical Re-Thinking of Education in the Service of Life. Educ. Sci. 2018, 8, 189. [Google Scholar] [CrossRef] [Green Version]
  20. Howard, P.; O’Brien, C.; Kay, B.; O’Rourke, K. Leading Educational Change in the 21st Century: Creating Living Schools through Shared Vision and Transformative Governance. Sustainability 2019, 11, 4109. [Google Scholar] [CrossRef] [Green Version]
  21. Polyak, S.T.; Von Davier, A.A.; Peterschmidt, K. Computational Psychometrics for the Measurement of Collaborative Problem Solving Skills. Front. Psychol. 2017, 8, 2029. [Google Scholar] [CrossRef] [Green Version]
  22. Von Davier, A.A.; Deonovic, B.; Yudelson, M.; Polyak, S.T.; Woo, A. Computational Psychometrics Approach to Holistic Learning and Assessment Systems. Front. Educ. 2019, 4, 69. [Google Scholar] [CrossRef] [Green Version]
  23. Branden, K.V.D. Sustainable Education: Exploiting Students’ Energy for Learning as a Renewable Resource. Sustainability 2015, 7, 5471–5487. [Google Scholar] [CrossRef] [Green Version]
  24. Carter, T.B.; Hunter, D.; Hancock, M. The Network Package. R Package. 2008. Available online: http://statnet.org (accessed on 10 May 2020).
  25. Almond, R.G.; Dibello, L.V.; Moulder, B.; Zapata-Rivera, D. Modeling Diagnostic Assessments with Bayesian Networks. J. Educ. Meas. 2007, 44, 341–359. [Google Scholar] [CrossRef]
  26. Almond, R.G.; Mislevy, R.J.; Steinberg, L.S.; Yan, D.; Williamson, D.M. Bayesian Networks in Educational Assessment; Springer: New York, NY, USA, 2015. [Google Scholar]
  27. Almond, R.G.; Mulder, J.; Hemat, L.A.; Yan, D. Bayesian Network Models for Local Dependence Among Observable Outcome Variables. J. Educ. Behav. Stat. 2009, 34, 491–521. [Google Scholar] [CrossRef] [Green Version]
  28. Almond, R.; Yan, D.; Hemat, L. Parameter Recovery Studies With a Diagnostic Bayesian Network Model. Behaviormetrika 2008, 35, 159–185. [Google Scholar] [CrossRef]
  29. Jensen, F.V.; Olesen, K.G.; Andersen, S.K. An algebra of bayesian belief universes for knowledge-based systems. Networks 1990, 20, 637–659. [Google Scholar] [CrossRef]
  30. Murphy, K.P. Dynamic Bayesian Neyworks: Representation, Inference and Learning. Ph.D. Thesis, University of California, Berkeley, CA, USA, 2002. [Google Scholar]
  31. Reye, J. A Belief Net Backbone for Student Modelling. In Intelligent Tutoring Systems; Ikeda, M., Ashley, K.D., Chan, T.W., Eds.; Springer: Berlin/Heidelberg, Germany, 1996; pp. 596–604. [Google Scholar]
  32. Chang, K.; Beck, J.; Mostow, J.; Corbett, A. A Bayes Net Toolkit for Student Modeling. In Intelligent Tutoring Systems; Ikeda, M., Ashley, K.D., Chan, T.W., Eds.; Springer: Berlin/Heidelberg, Germany, 2006; pp. 104–113. [Google Scholar]
  33. Briggs, D.C.; Alonzo, A.C. The Psychometric Modeling of Ordered Multiple-Choice Item Responses for Diagnostic Assessment with a Learning Progression. In Proceedings of the Learning Progressions in Science, Iowa City, IA, USA, 24–26 June 2012; pp. 293–316. [Google Scholar]
  34. Corcoran, T.; Mosher, F.; Rogat, A. Learning Progressions in Science: An. Evidence-Based Approach to Reform; Consortium for Policy Research in Education: Philadelphia, PA, USA, 2009; pp. 1–88. [Google Scholar]
  35. Corrigan, S.; Loper, S.; Barber, J.; Brown, N.; Kulikowich, J. The juncture of supply and demand for information: How and when can learning progressions meet the information demands of curriculum developers? In Proceedings of the Learning Progressions in Science, Iowa City, IA, USA, 24–26 June 2009. [Google Scholar]
  36. Yoon, S.; Goh, S.E.; Yang, Z. Toward a Learning Progress Iowa City ion of Complex Systems Understanding. Complicity: Int. J. Complex. Educ. 2019, 16, 1–19. [Google Scholar] [CrossRef]
  37. Attali, Y.; Arieli-Attali, M. Validating Classifications From Learning Progressions: Framework and Implementation. ETS Res. Rep. Ser. 2019, 2019, 1–20. [Google Scholar] [CrossRef] [Green Version]
  38. Rupp, A.; Choi, Y.; Gushta, M.; Mislevy, R.; Thies, M.C.; Bagley, E.; Nash, P.; Hatfield, D.; Svarovsky, G.; Shaffer, D.W. Modeling learning progressions in epistemic games with epistemic network analysis: Principles for data analysis and generation. In Proceedings of the Learning Progressions in Science Conference, Iowa City, IA, USA, 24–26 June 2009. [Google Scholar]
  39. Rupp, A.A.; Sweet, S.; Choi, Y. Modeling learning trajectories with epistemic network analysis: A simulation-based investigation of a novel analytic method for epistemic games. In Proceedings of the Educational Data Mining Conference, Pittsburgh, PA, USA, 11–13 June 2010. [Google Scholar]
Figure 1. A schematic representation of the models in the evidence-centered design (ECD) framework [8].
Sustainability 12 07950 g001
Figure 2. A procedure of learning analytics.
Sustainability 12 07950 g002
Figure 3. An example of a sustainable computer-based evaluation system: Task Window.
Sustainability 12 07950 g003
Figure 4. An acyclic directed graph.
Sustainability 12 07950 g004
Figure 5. Two examples of the graph in social network analysis. (A) is one of the students and (B) is the other student.
Sustainability 12 07950 g005
Figure 6. Some examples of student learning trajectories using weighted density (WD) values.
Sustainability 12 07950 g006
Figure 7. An initial representation of Dynamic Bayesian Network (DBN) for modeling Leaning Progressions for multiple measurement.
Sustainability 12 07950 g007
Figure 8. A DBN representation of the four latent variables without tasks.
Sustainability 12 07950 g008
Figure 9. A representation of a Bayesian network (BN) when the student has the particular response pattern given 10 tasks at the first measurement occasion.
Sustainability 12 07950 g009
Table 1. Descriptive statistics of subjects.
PercentCount
Educational Level1year43.2%108
2year25.6%64
3year14.0%35
4year17.2%43
Age2024.0%6
3026.8%67
4028.0%70
5042.8%107
GenderMale35.2%88
Female65.8%162
Job StatusFull-time25.6%64
Part-time39.2%98
No36.2%88
Table 2. Basic sequence of observations for a learner in a scenario task.
SliceSKIVE
111100
201010
310101
411011
N11012
Table 3. An example of an adjacency matrix.
SliceSKIVE
S01100
K10100
I11000
V00010
E00000

