Article

Multidimensional Analysis of the Spatiotemporal Variations in Ecological, Production and Living Spaces of Inner Mongolia and an Identification of Driving Forces

1
School of Environment, Northeast Normal University, Changchun 130024, China
2
State Environmental Protection Key Laboratory of Wetland Ecology and Vegetation Restoration, Northeast Normal University, Changchun 130024, China
3
Laboratory for Vegetation Ecology, Ministry of Education, Changchun 130024, China
*
Author to whom correspondence should be addressed.
Sustainability 2020, 12(19), 7964; https://0-doi-org.brum.beds.ac.uk/10.3390/su12197964
Submission received: 29 July 2020 / Revised: 12 September 2020 / Accepted: 21 September 2020 / Published: 25 September 2020

Abstract

:
There is increasing focus on the difficult challenge of realizing coordinated development of production, living and ecological spaces within the regional development process. An ecological–production–living space evaluation index system was established in this study based on the concept of ecological, production and living spaces (EPLSs), the relationship between land use function and land use type and the national standard of land use classification. The aim of this study was to reveal the driving forces and patterns of variation in EPLSs in Inner Mongolia from 1990 to 2015. The results indicated that Inner Mongolia is mainly dominated by ecological space, followed by production space. Production and living spaces are mainly distributed to the south of the Greater Hinggan–Yinshan–Helan mountain ranges. Spatial changes in EPLSs were accelerated with prominent regional differences, with declining ecological area and increasing living and production spaces. Regional urbanization and industrialization were identified as the driving forces for change in EPLS in Inner Mongolia. It is hoped that the findings of this study can provide rational guidance for management of land use and coordinated development of EPLSs within Inner Mongolia.

1. Introduction

There has been a gradual increase in tension between people and land as spatial structure has become increasingly unbalanced, production space has become inefficient and living spaces and the ecological environment have gradually deteriorated. Land is the basis of human civilization, and at a macro scale, there are three general categories of residential space [1]. Since having undergone reform and joining the global community, China has achieved widely recognized industrialization and urbanization achievements. However, this progress has also resulted in a series of sustainable development challenges. There have been increasing conflicts and contradictions between production, living and ecological spaces. The 18th National Congress of the Communist Party of China proposed the concept of construction of three categories of living spaces, namely ecological, production and living spaces (EPLSs), defined as ecological space that is left unspoiled, space reserved for intensive and efficient production, and living space that is sufficient in size and conducive to human well-being, respectively.
The concept of these three categories of living spaces has become increasingly prevalent in related academic research and practice since being proposed (Figure 1). Although this concept is rarely used internationally, there have been related studies on regional or urban functional space, including the Linear City Theory proposed by Arturo Soria, a Spanish engineer and urban planner [2,3], the Garden City Theory proposed by Ebenezer Howard in the United Kingdom [4] and the Organic Decentralization Theory proposed by Eliel Saarinen, a Finnish–American architect [5]. Global urban development began to face new challenges after the mid-20th century, during which the construction of large cities expanded significantly and urban problems have become more prominent. Consequently, there has been increasing research on urban growth borders, regulation of green belts and other related fields. At the same time, there has been an increasing focus on ecological and environmental problems encountered during the process of urban development and the realization that protection of the ecological environmental plays an important role in urban construction and development. In summary, while studies on urban functional spaces and multifunctional land use outside of China have rarely used the three living spaces categorization to define regional or urban functional spaces, these studies have many similarities with studies in China that have utilized the three living spaces categorization. Studies on living spaces in China started relatively late compared to international studies, and within the context of a planned economy, there was an excessive emphasis in China on production space, whereas other spatial functions in the region were largely ignored. Subsequent to China rejoining the global community, reform of the economic system resulted in increasing attention on ecological functions. Thus, relevant studies based on the recognition of three categories of living spaces have become popular within geography. Chinese scholars have since conducted a lot of research related to ecological, production and living spaces (EPLSs), and have achieved considerable research insights.
Research on EPLS has mainly focused on two aspects. The first is research on the connotation and definition of EPLS. Although the increasing focus on land use/land cover change (LUCC) research has resulted in varying interpretations of EPLS among different scholars, they have all proposed theoretical frameworks based on the spatial structure and the function of land use. While there has been a large amount of empirical research, there remains no unified definition and classification standard for EPLS [6]. The second aspect of EPLS research relates to the evolution and drivers of EPLS. While there have been many studies on the spatial patterns of EPLS, the majority of these studied the evolution and drivers of EPLS vertically, with insufficient attention focused on the core elements during the EPLS development process. There is clearly a need for research to characterize the evolution and drivers of EPLSs [7].
Ecological, production and living spaces are not isolated and are clearly closely related and influence each other. Production space is a fundamental driving force which provides economic support for living and ecological spaces. Efficient use of production space optimizes industrial structure, promotes social and economic development and ultimately facilitates quality of life and the maintenance of ecological space for humans as well as for other organisms [8,9,10]. The ultimate goal of coordinated and optimized development of EPLSs is to maintain the well-being of residents, and the realization of this goal is mainly reflected in living space. Ecological space is the foundation of EPLS, and the support of living space and production space for the realization of their own functions is the key to coordinating the relationship between human development and land, and even to realizing regional sustainable development [11]. The ecological space provides ecosystem goods and services, for example, natural water purification, and ensures stable development of the region. At the same time, the quality of the ecological space is directly affected by living and production spaces [12].
EPLS is a paradigm under which people can protect and utilize nature to realize their own development and reflects the ability of humans to transform nature and their own development level. The division of space within EPLS is intuitive and easy to identify. The identification and description of the internal drivers of spatial development is of great significance. An imbalance within EPLS is an important driver of environmental pollution, frequent disasters, over exploitation of energy resources and degradation of ecosystem functions. The bottom-up implementation of a spatial development strategy is needed to maintain the coordinated development of EPLS, with measures adjusted for local conditions and based on science and the coordination of the contradiction between protection and development.
EPLS in China currently faces many challenges. The ecological space has undergone continual erosion, resulting in an imbalance between ecological and urban spaces. The extensive use and poor management of production space has resulted in serious environmental pollution. There is currently an imbalance in the supply structure of living space, and development remains insufficient and unbalanced. The current study focused on the Inner Mongolia Autonomous Region that is characterized by a fragile and sensitive ecological environment. A classification system was established for EPLS in Inner Mongolia based on land use data for 1990 to 2015. Spatiotemporal variations in EPLS were analyzed and driving forces of the evolution of EPLS were identified. It is hoped that the results of the present study can provide a reference for rational utilization of land and coordinated development of EPLSs to facilitate sustainable development within Inner Mongolia.

2. Materials and Methods
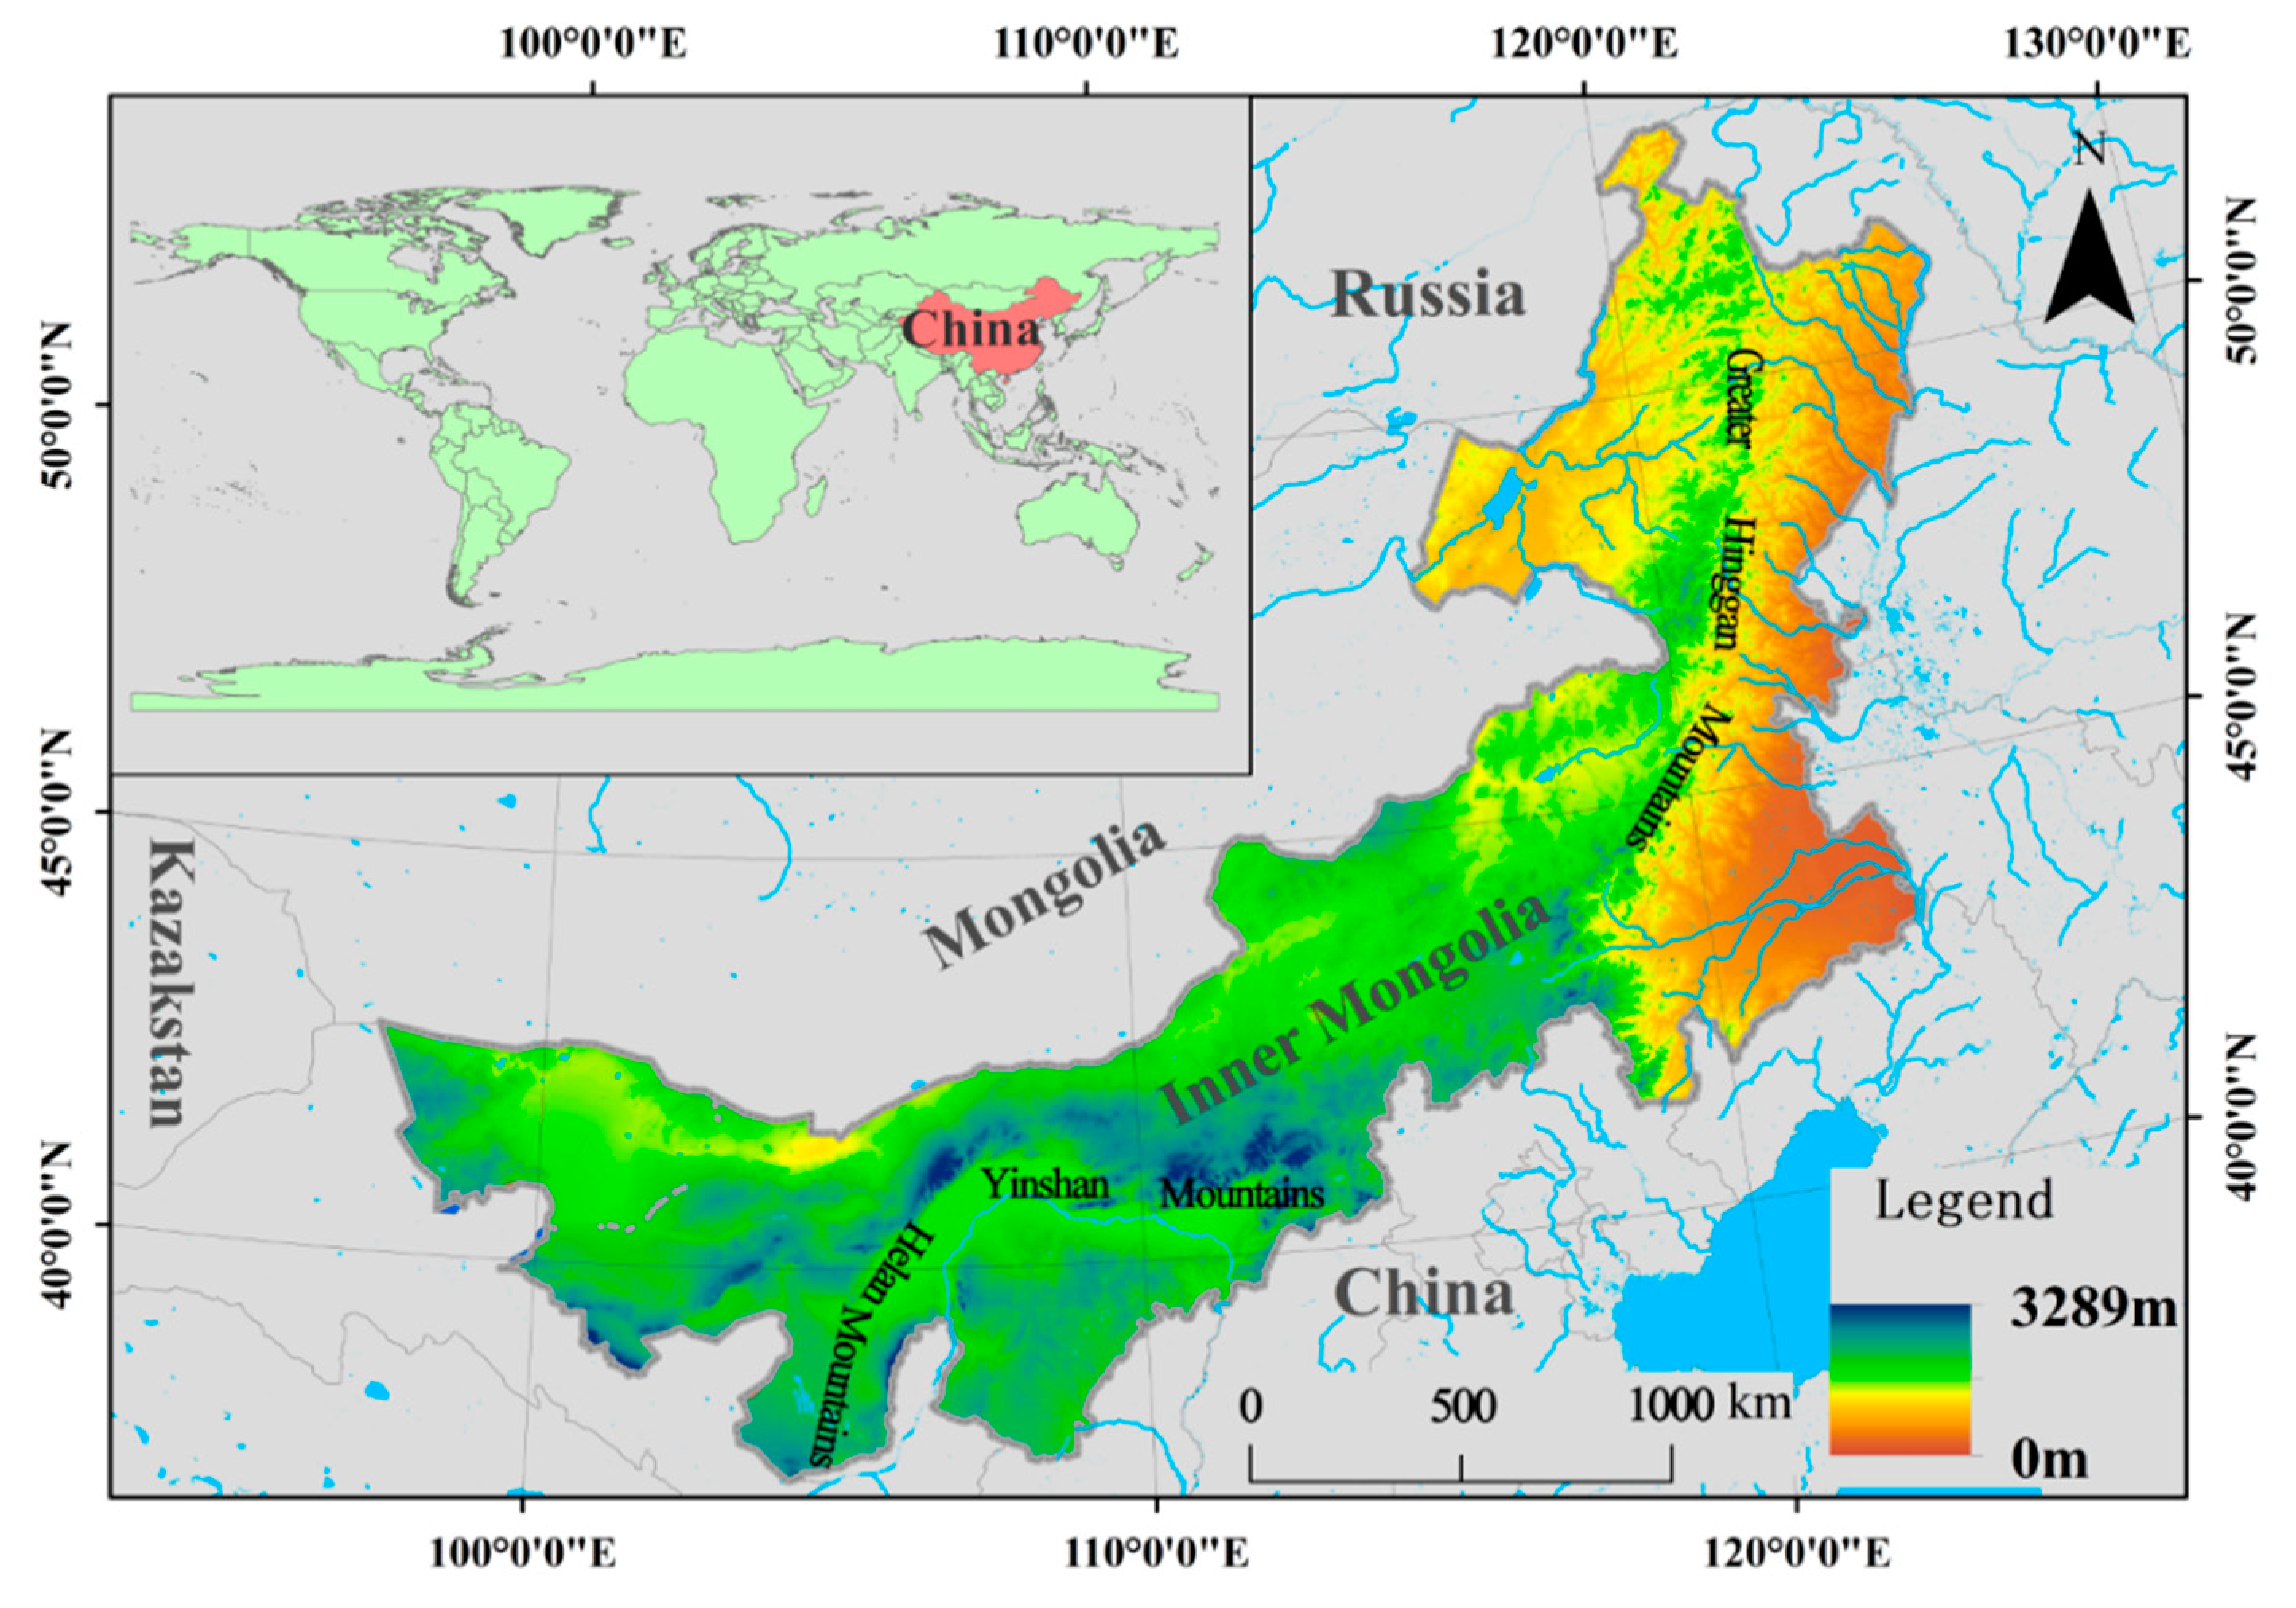
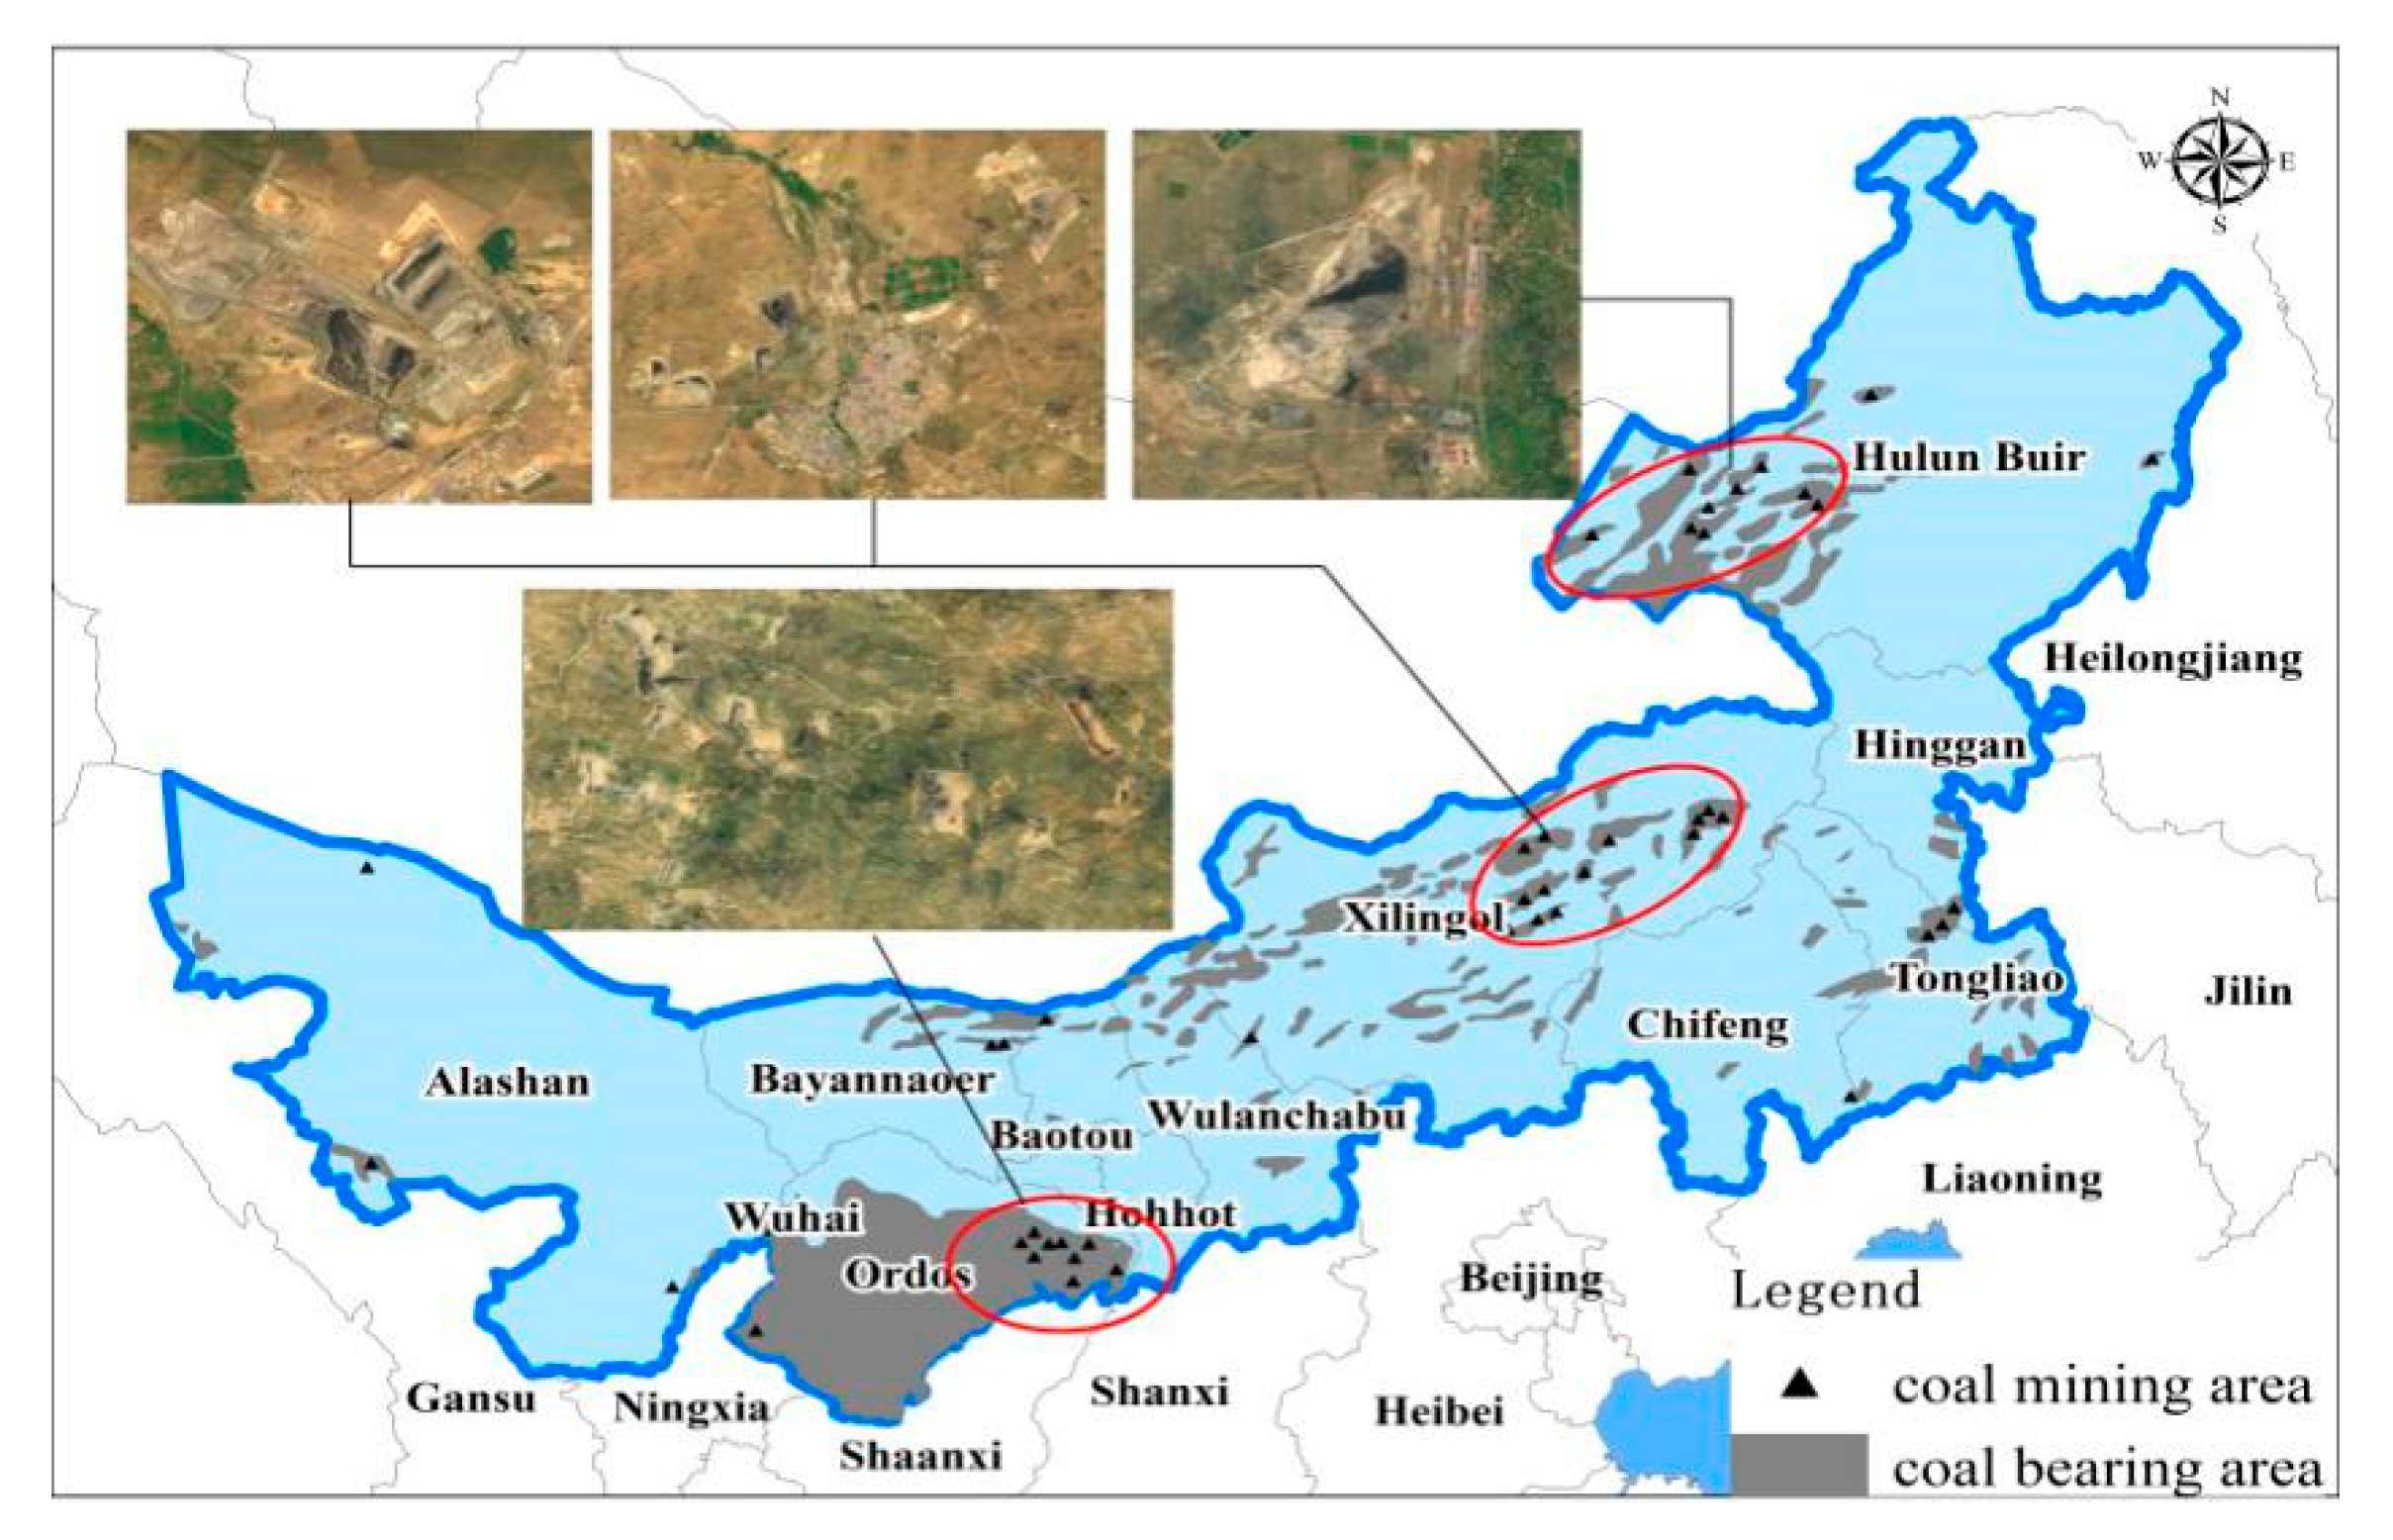
2.1. Study Area

Inner Mongolia is located on the northern border of China, with Mongolia and Russia to the northwest (Figure 2). Inner Mongolia has been described as the “the environmental Great Wall” of northern China and acts as an important environmental barrier in the Beijing Tianjin Tang region. This region is known as the “Magic Bowl” due to its abundant aboveground and belowground resources and is a strategic area for national energy security and environmental security strategies. Thus, the need to balance large-scale exploitation of mineral resources with the protection of the prairie environment is essential. As a result, a sharp contrast exists between development and environmental protection in Inner Mongolia. Since the overall regional development of the region remains low, there is a need to strengthen regional infrastructure, particularly transportation infrastructure. The economy of Inner Mongolia, which has developed rapidly in recent years, relies heavily on abundant natural resources, and there has been a significant improvement of infrastructure. However, continual economic development in the region may result in the capacity of the environment to support the range and degree of exploitation being exceeded, resulting in environmental problems such as water pollution, resource depletion, dust storms and environmental destruction. The contradiction between the needs of the people and the carrying capacity of the land in the region is becoming increasingly acute. Within this context, there is an increasing focus on traditional regional development modes in the region with a gradual shifting of focus to the concept of sustainable development. This development falls in line with the global recognition of reasonable protection and the orderly development and utilization of limited resources to ensure human survival and sustainable development.

2.2. Data Sources and Methodology

2.2.1. Data Sources

Land use data for 1990, 1995, 2000, 2005, 2010 and 2015 were obtained from the Data Center for Resources and Environmental Sciences, Chinese Academy of Sciences (RESDC) (http://www.resdc.cn), with a 1 km spatial resolution. The land use data were originally derived from Landsat Thematic Mapper/Enhanced Thematic Mapper (TM/ETM) remote sensing images. The land use data were generated through image processing, human-machine interaction interpretation, dynamic extraction and verification through field investigation. The land use data include six first-class types of cultivated land, woodland, grassland, water area, urban and rural industrial and mining residential land and unused land, as well as 25 secondary types of land [13,14]. This land use dataset provides data support for the study of land use in China and is therefore highly suitable for use in the present study. Secondary types of land use were reclassified into 22 categories in the present study [15,16,17], following which the distribution, spatiotemporal evolution and driving forces of changes to EPLS in Inner Mongolia were examined. Socioeconomic data for the region were downloaded from the National Bureau of Statistics (http://www.stats.gov.cn/).

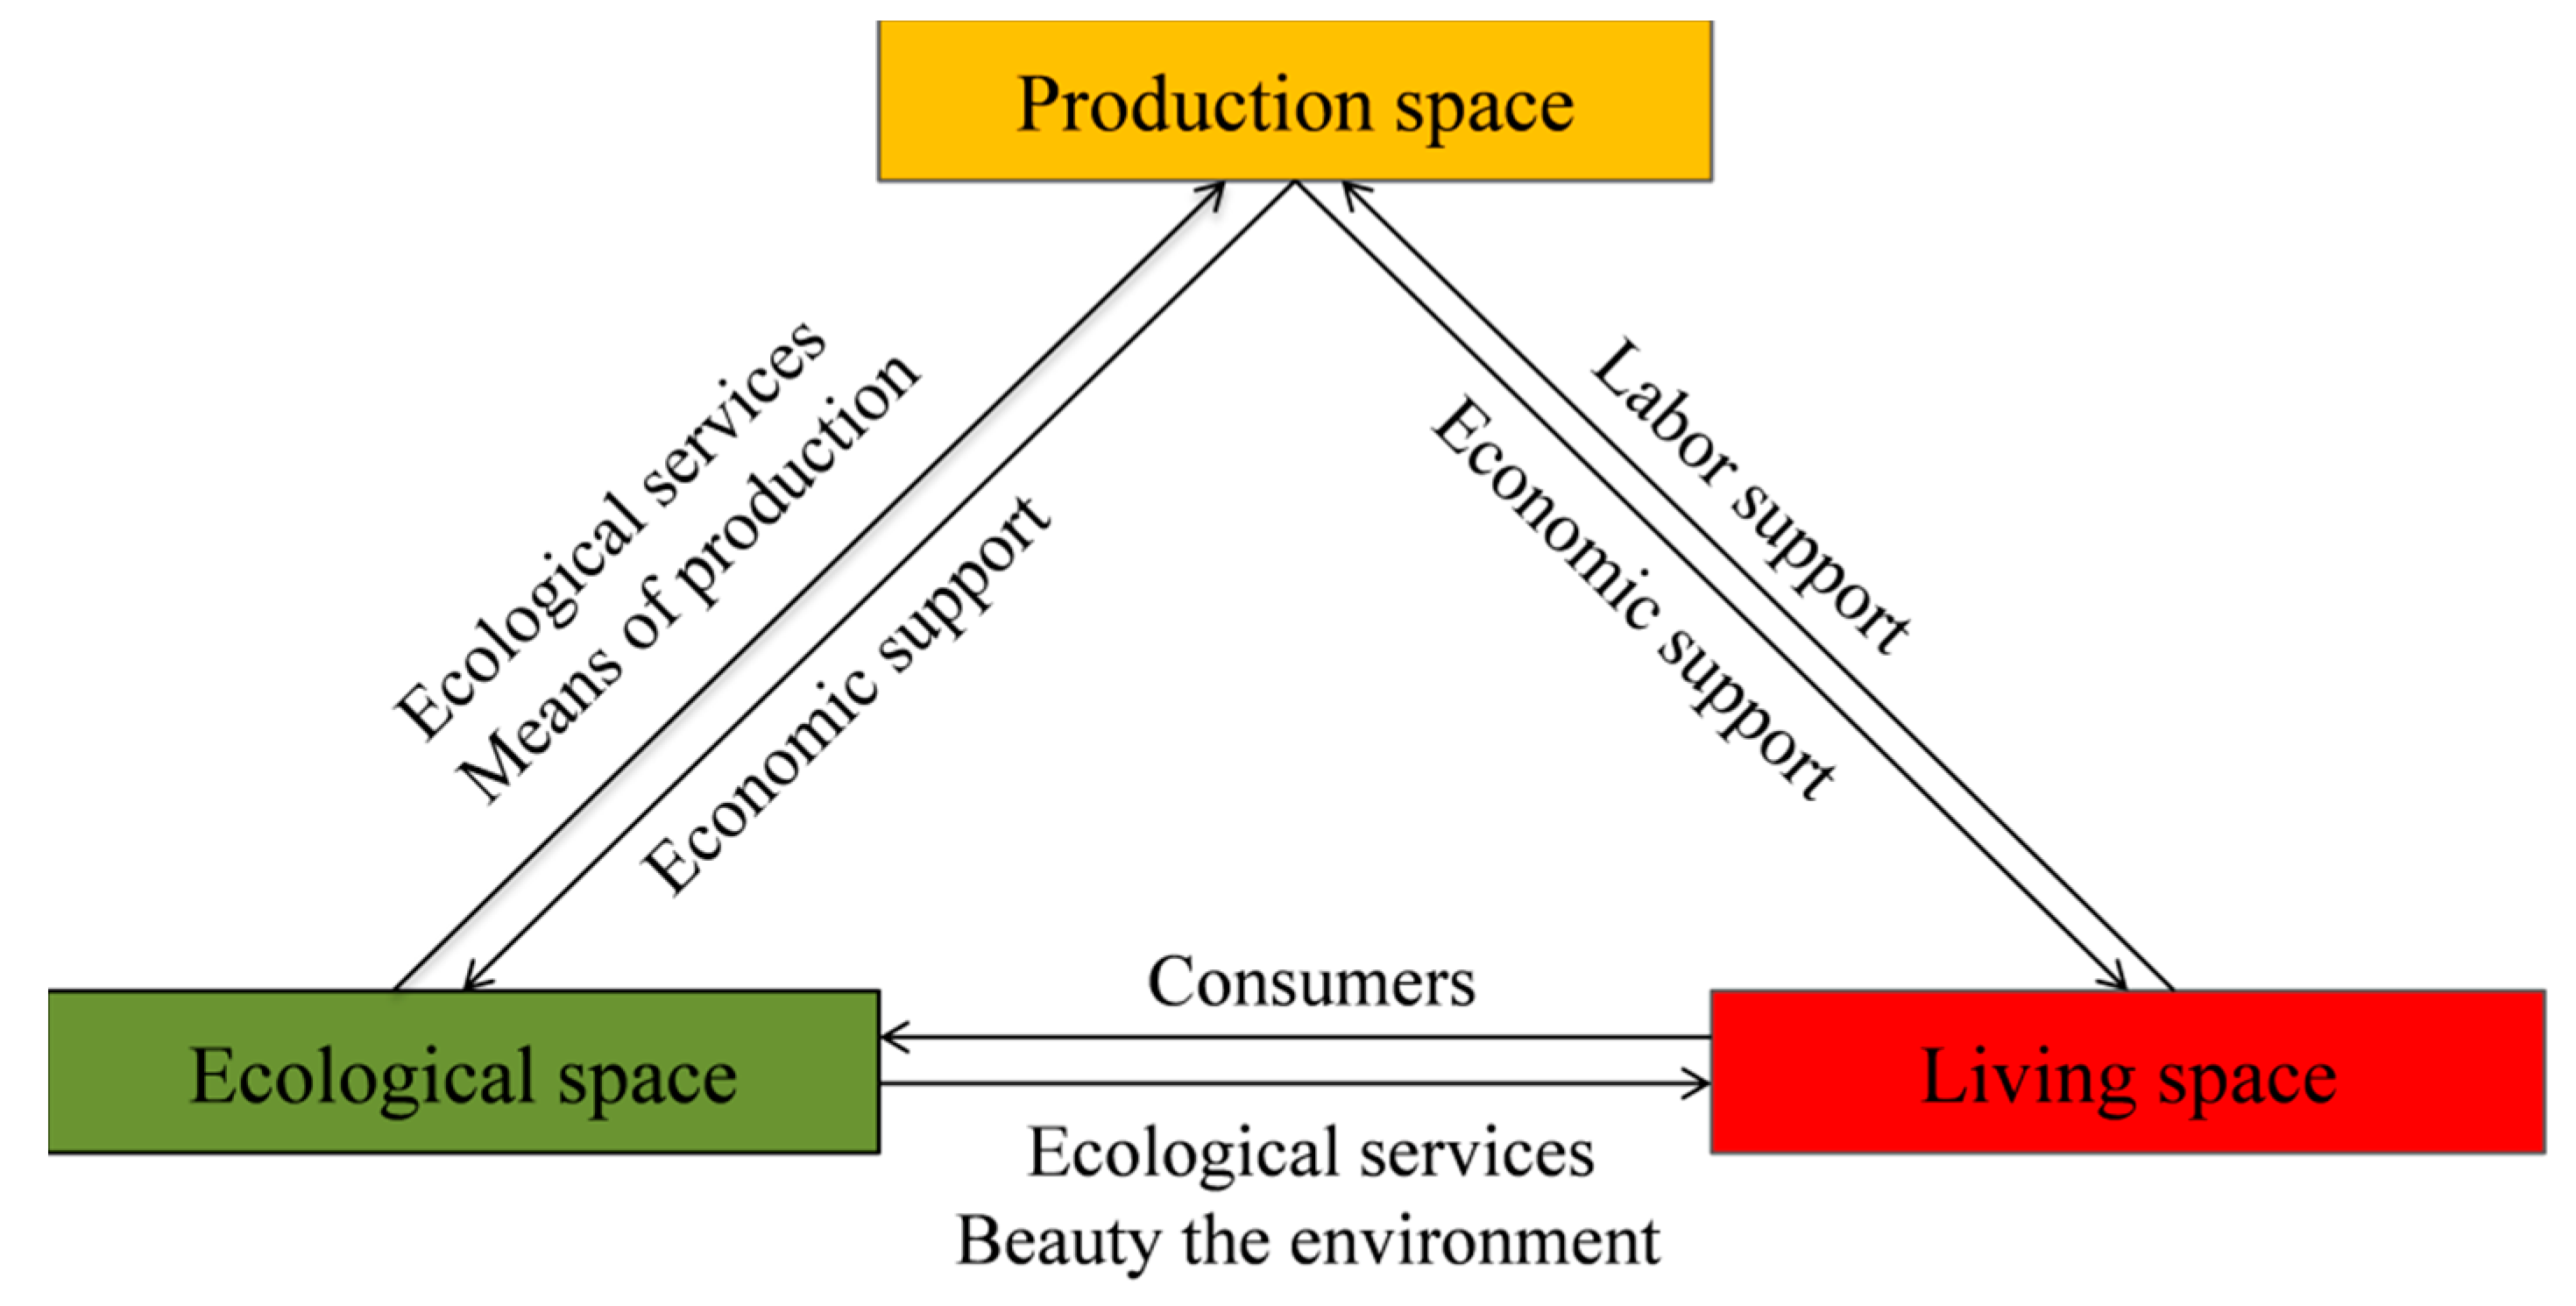
2.2.2. Classification of Ecological, Production and Living Spaces (EPLSs) Based on Land Use Types

While a single land use type is characterized by multifunctional features, differences between primary and secondary functions exist [18]. Therefore, the present study established a land function classification system of EPLS based on the national standard of land use classification and related studies [7,19,20], following which the EPLS scoring criteria were formulated based on an expert evaluating method (Table 1). Taking the ecological space as an example, the specific evaluation principle adopted assigned 5, 3, 1 and 0 points to a strong, moderate, weak and non-existent ecological functions, respectively. The same scoring principal was applied to living and production spaces.

2.2.3. Barycenter Migration Model

Barycenter is a physical concept which represents the point of spatial balance of a region for some aspects of geography. The Barycenter coordinate is an important index describing the spatial distribution of geographical objects [21] and is used to clearly and objectively reflect the spatiotemporal trend in changes to regional geographical objects. The Barycenter Migration Model is an important research tool for studying the spatial distribution of geographical objects and is widely used in the study of urban evolution and changes in land use [22,23]. The current study attempted to identify spatial changes in EPLS by understanding the distribution center of EPLS for each study period. The Barycenter coordinates are generally represented by longitude and latitude and are given by:
X t = i = 1 m ( C t i X i ) / i = 1 m C t i  
Y t = i = 1 m ( C t i Y i ) / i = 1 m C t i
In Equations (1) and (2), X t and Y t are the longitude and latitude of the center of a certain type of space in the t-th year, respectively, C t i , X i   and   Y i are the area, longitude and latitude of the i-th patch in the t-th year, respectively and m   is the total number of patches of a certain type of space.
The measurement of the interannual distance moved by the Barycenter of the EPLS is calculated as follows [24]:
D t t = C [ ( X t X t ) 2 + ( Y t Y t ) 2 ] 1 2
In Equation (3), D represents the Barycenter migration distance of land use from time t to t , ( X t , Y t ) and ( X t ,   Y t ) are the geographical coordinates of the Barycenter at these times and C is a constant equal to 111.111 and is the coefficient of converting the geographical coordinate unit into the plane distance (km).

2.2.4. Quantitative Analysis of Driving Forces

The spatial change in EPLS can act as a comprehensive indicator of regional coordinated development and is affected by both natural and human drivers [2,25,26]. However, over time scales of several decades or even hundreds of years, the impact of natural factors is mainly embodied in cumulative and background effects, whereas the impact of human factors as the main driver of land use change is relatively easy to detect [27]. Among the many human activities, socioeconomic development and population growth are particularly important drivers of land use change. Therefore, indices such as urbanization, gross domestic product (GDP), population density and local fiscal revenue were chosen in the present study to investigate drivers of EPLS change. A multiple linear regression model was used to establish the relationship between each league in Inner Mongolia and human factors as follows:
y = a + b 1 x 1 + b 2 x 2 + b 3 x 3 + b n x n
In Equation (4), y is the area of EPLS in each league, x represents human factors and b is the regression coefficient.

3. Results

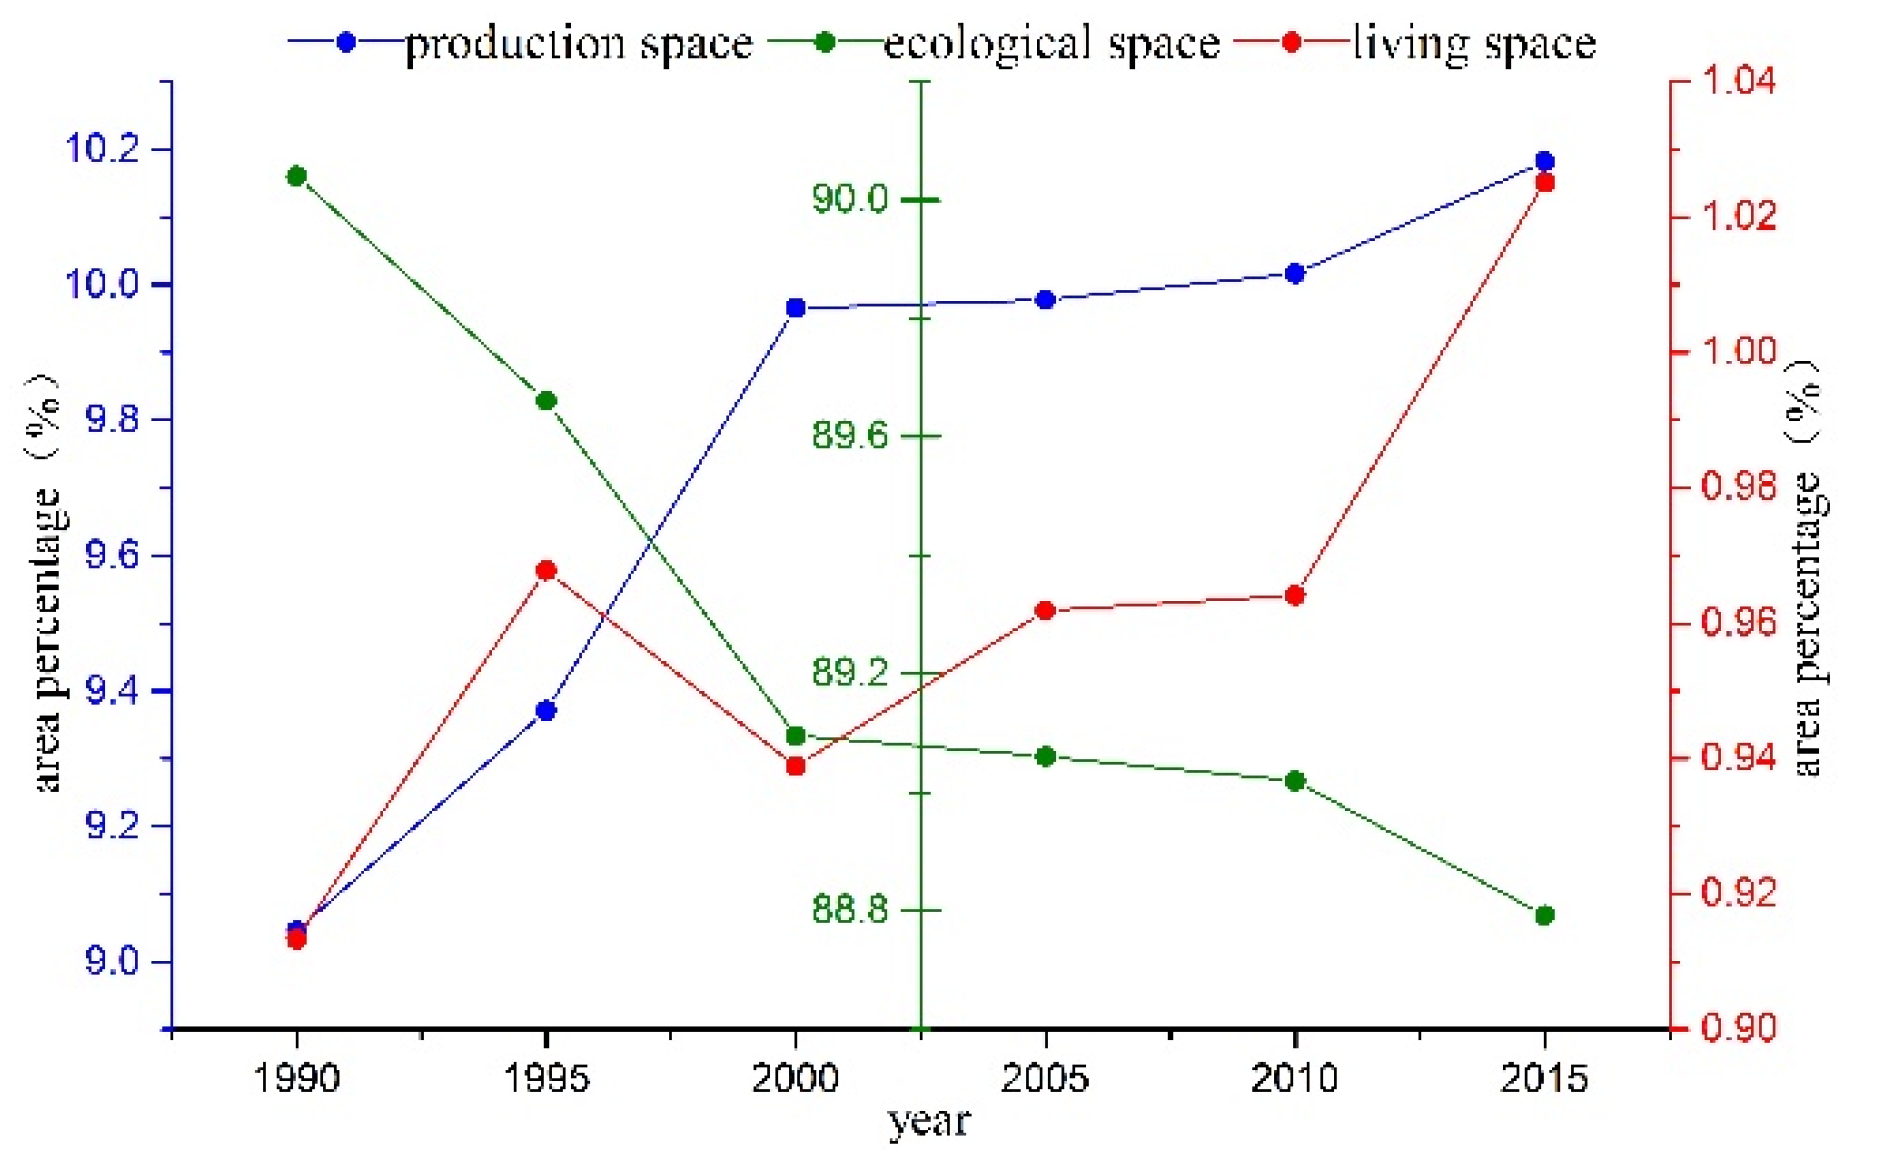
3.1. Characteristics of EPLS in Inner Mongolia from 1990 to 2015

Figure 3 shows the spatial distribution of ecological, living and production spaces of Inner Mongolia for six different periods from 1990 to 2015. Grassland is the dominant land use type in Inner Mongolia due to the prevailing climate, topography and other natural conditions. The proportions of production, ecological and living spaces in Inner Mongolia in 2015 were approximately 10.18%, 88.79% and 1.03%, respectively and ecological space was the priority. The ecological space of Inner Mongolia is mainly distributed in the grassland and hilly areas to the north of the Greater Hinggan–Yinshan–Helan mountains, with a spatial distribution roughly inverse to that of living and production spaces. The production space of Inner Mongolia is mainly distributed to the south of the Greater Hinggan–Yinshan–Helan mountains, with that of the Hulunbeier Caoyuan and Alxa Desert area being relatively small and basically consistent with the boundary zone of animal husbandry and agriculture in Inner Mongolia. The main reason for the relatively small production space in Inner Mongolia is due to its location to the north of the three mountains in an area in which soil, precipitation and temperature conditions are not suitable for large-scale production activities. The living spaces of the Hubaoe urban agglomeration in the central part of the Inner Mongolia, Chifeng and Tongliao areas in the east are relatively concentrated.

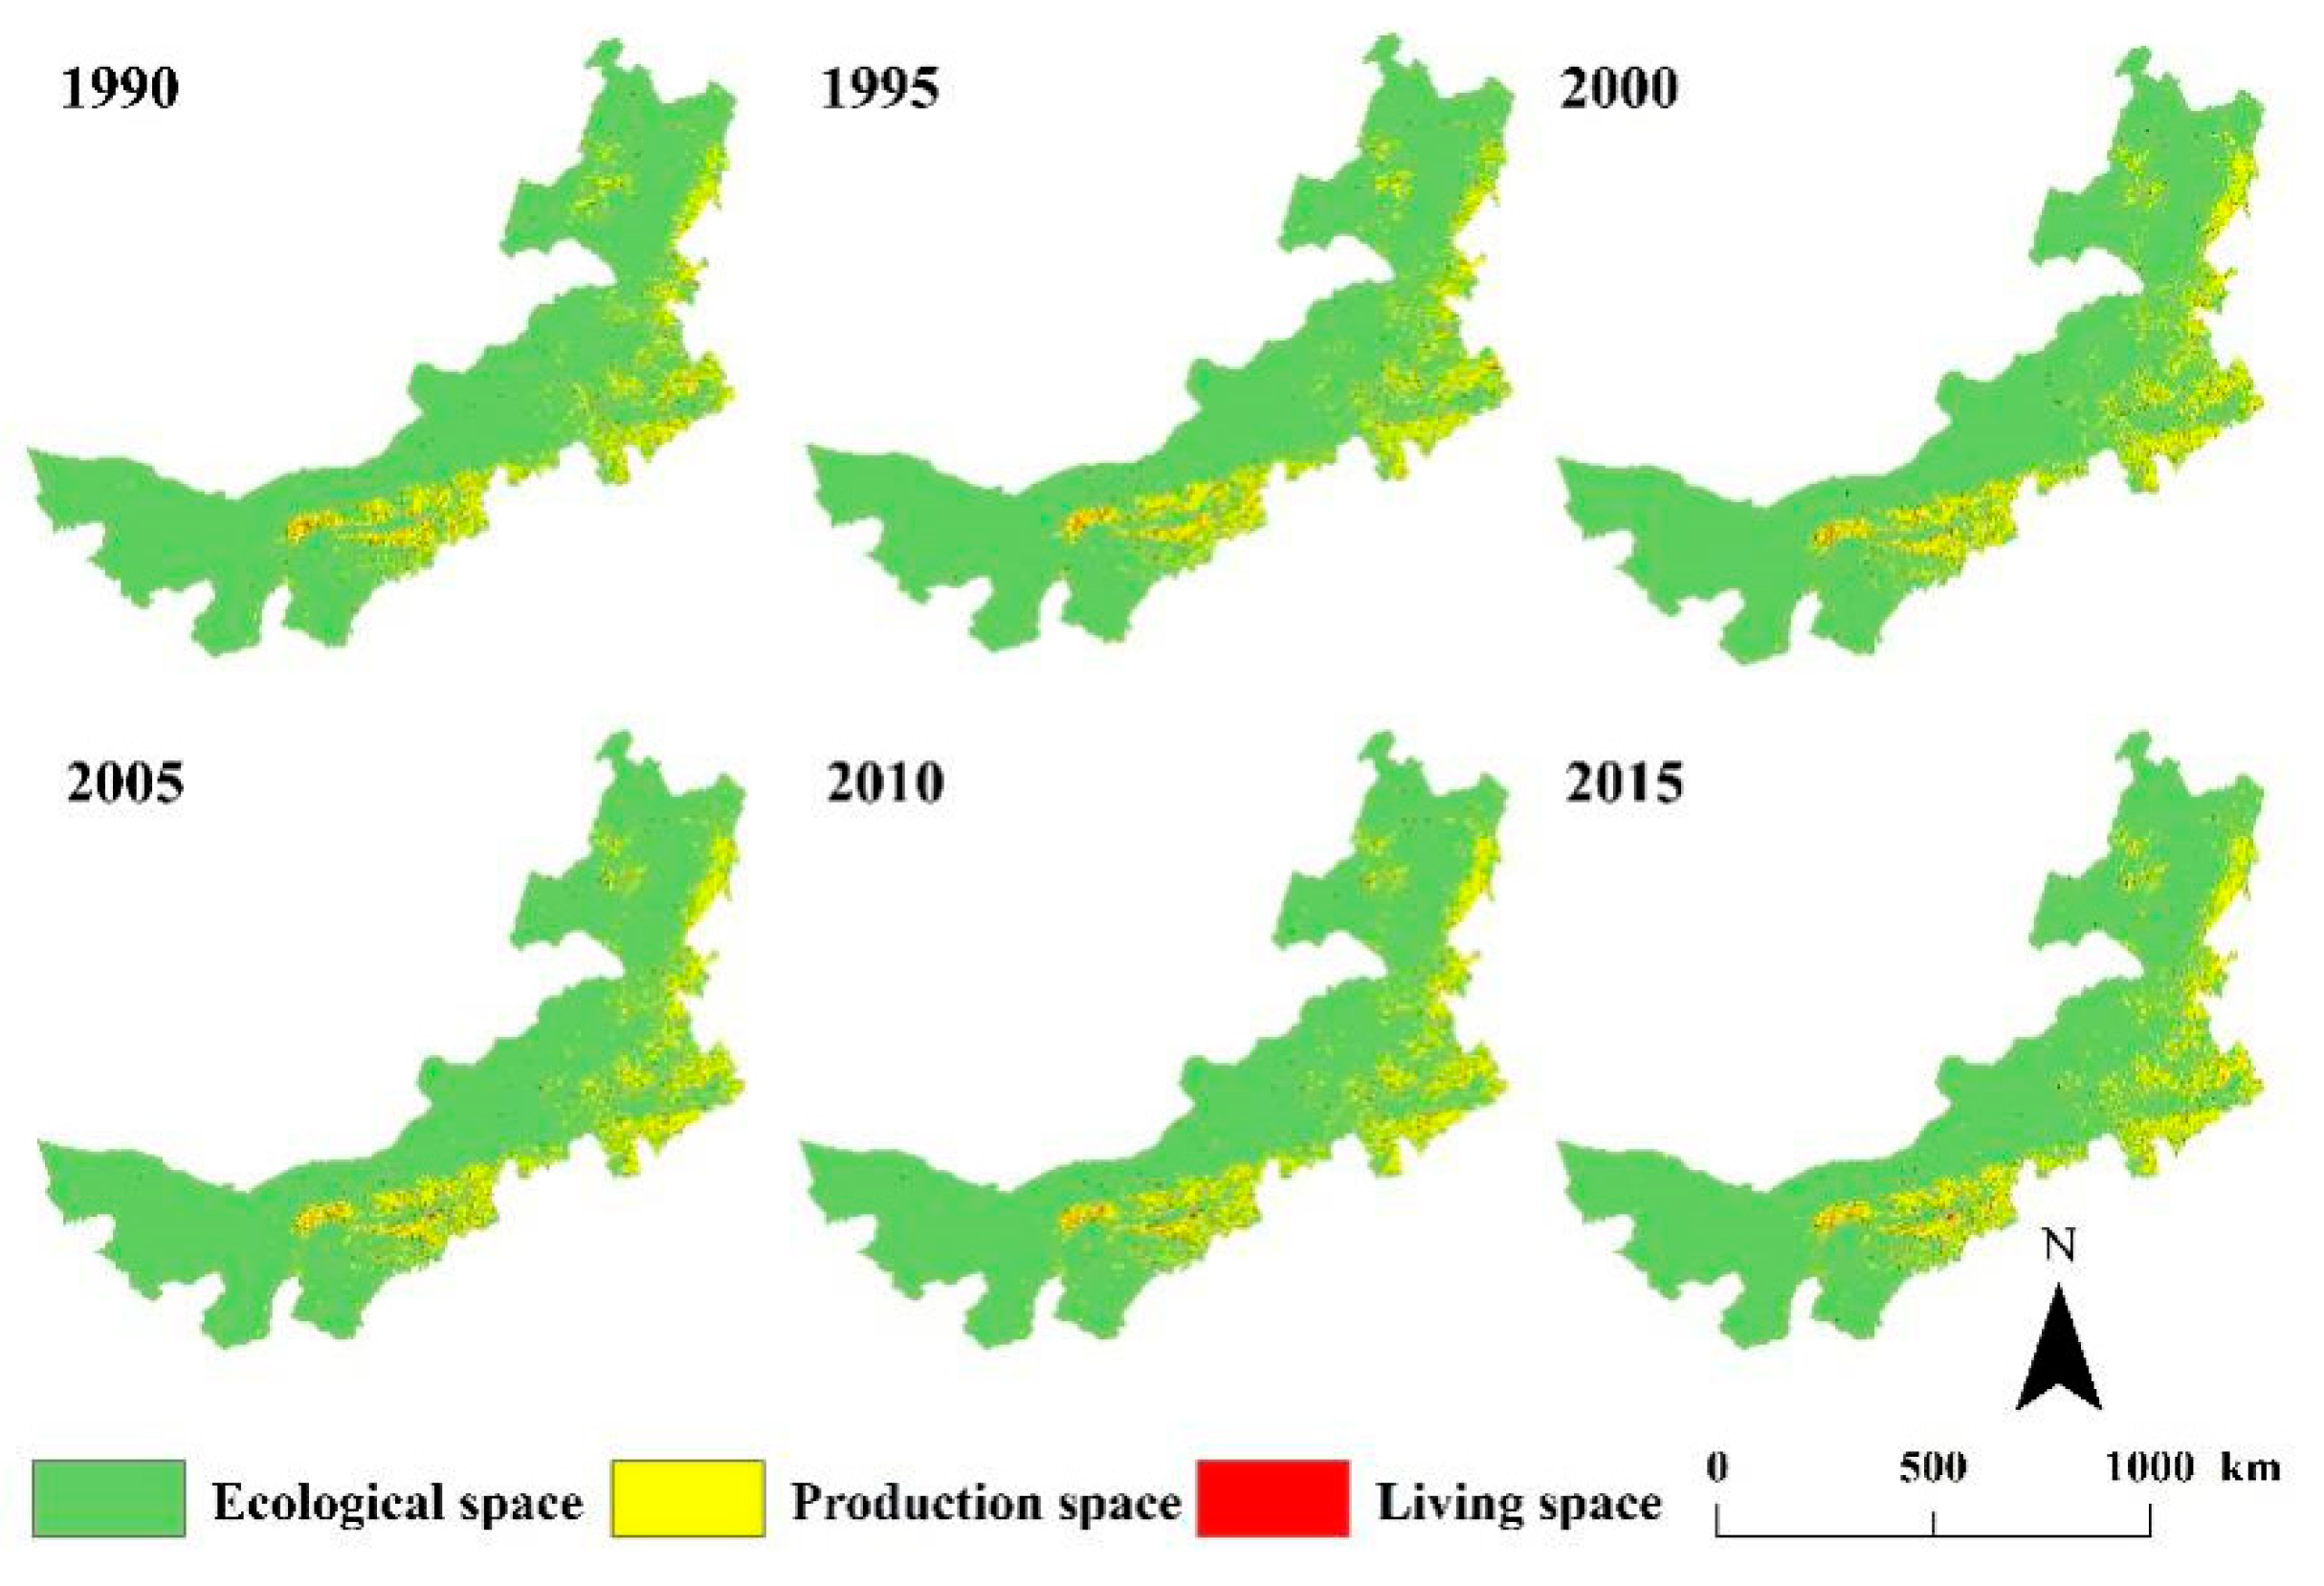
3.2. Spatial Patterns of EPLS in Inner Mongolia from 1990 to 2015

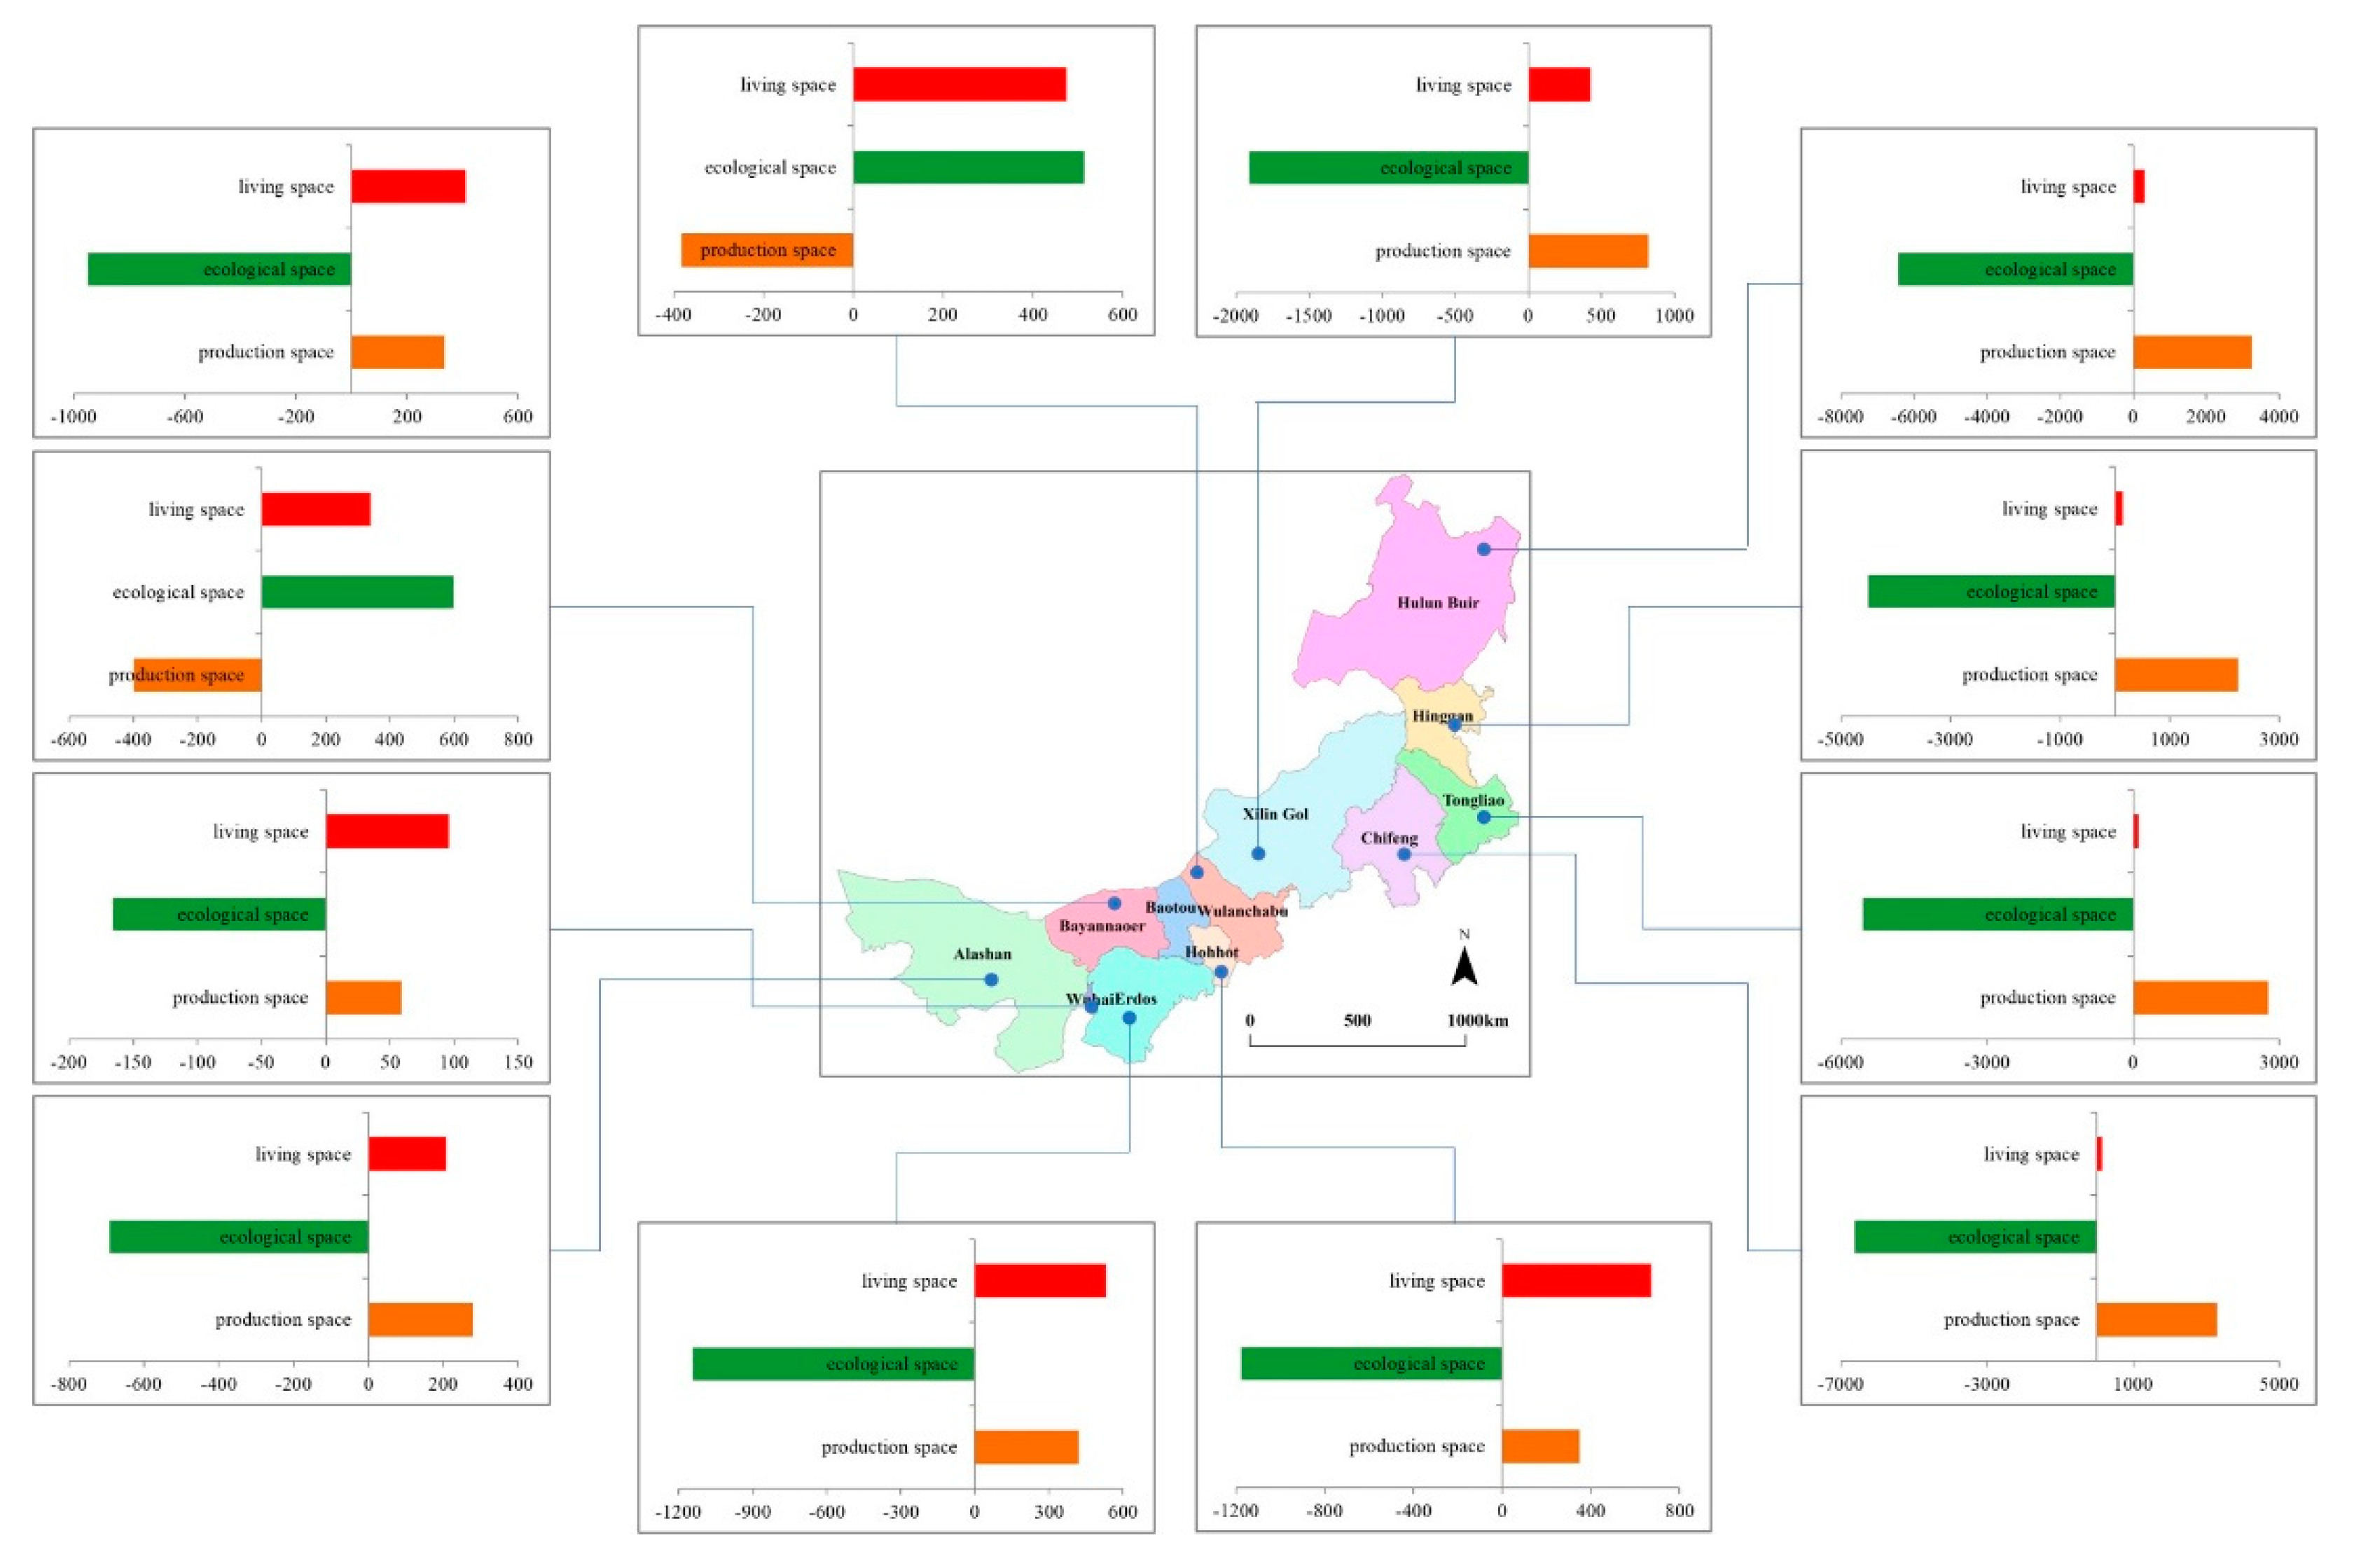
3.2.1. Changes to Spatial Extent of EPLS

Figure 4 shows the changes in coverage of production, living and ecological spaces in Inner Mongolia from 1990 to 2015. It is evident that there was a dramatic decline in ecological spaces in Inner Mongolia from 103.14 × 10⁴ km2 in 1990 to 101.74 × 10⁴ km2 in 2015, declining by 1.36% over the study period, whereas living and production spaces increased by 12.27% and 12.59% over the study period, respectively.
Figure 5 shows the spatial changes in EPLS for the 12 leagues of Inner Mongolia over the period 1990 to 2015, in which there are obvious regional differences. Among the 12 league cities in Inner Mongolia, only Ulanqab and Bayannur showed increases to the extent of ecological space, whereas decreasing trends were evident in the remainder. Among them, the cities of Chifeng and Hulunbeier showed the largest declines, reaching 6636 and 6436 km2, respectively. Hohhot, Ordos and Ulanqab showed the greatest increases in ecological space at 672, 531 and 474 km2, respectively, whereas the city of Wuhai had the smallest increase at 96 km2. Production space in Bayannur and Ulanqab decreased by 400 and 383 km2 respectively, whereas increases were evident in the city of Hulunbeier, the league of Hinggan and the cities of Tongliao and Chifeng of 3297, 2247, 2766 and 3297 km2, respectively. In general, living spaces in the central and western regions increased, ecological spaces decreased and production spaces in the eastern region increased.

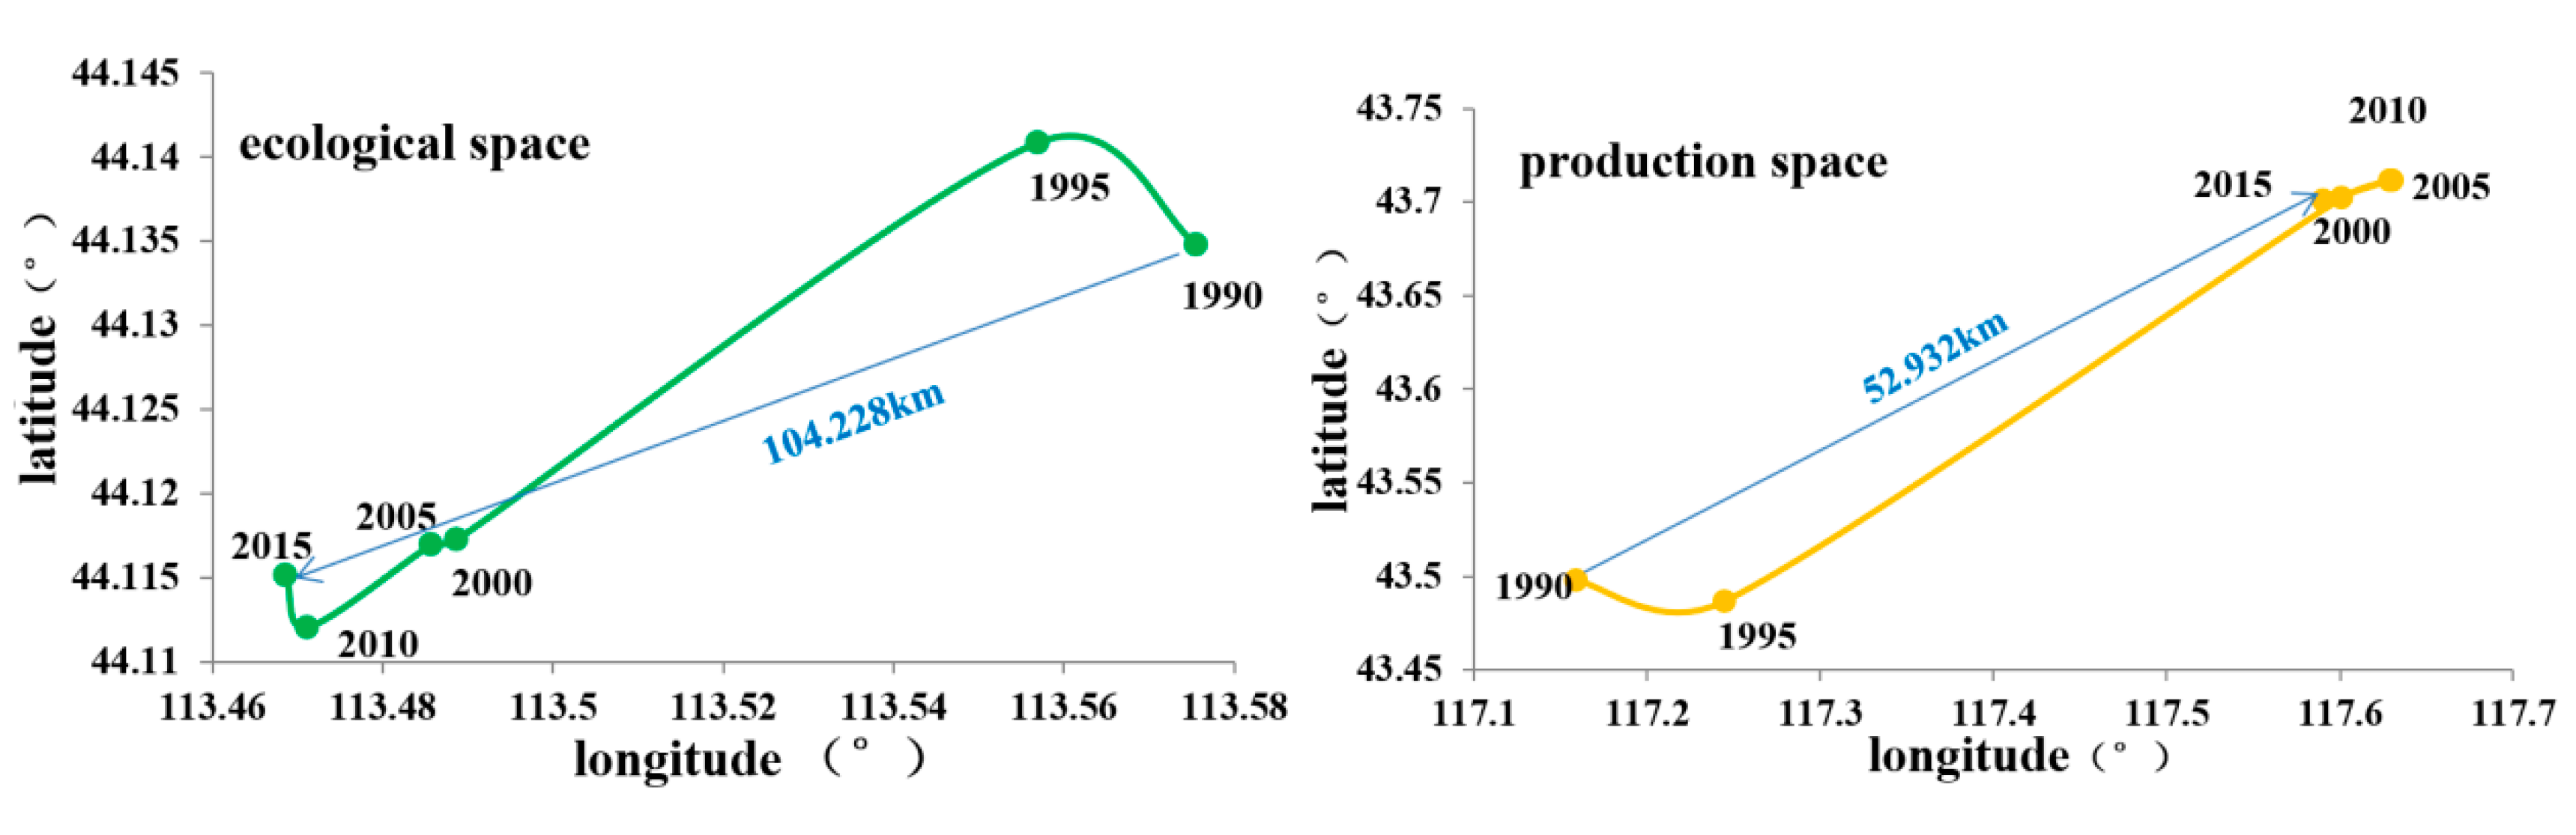
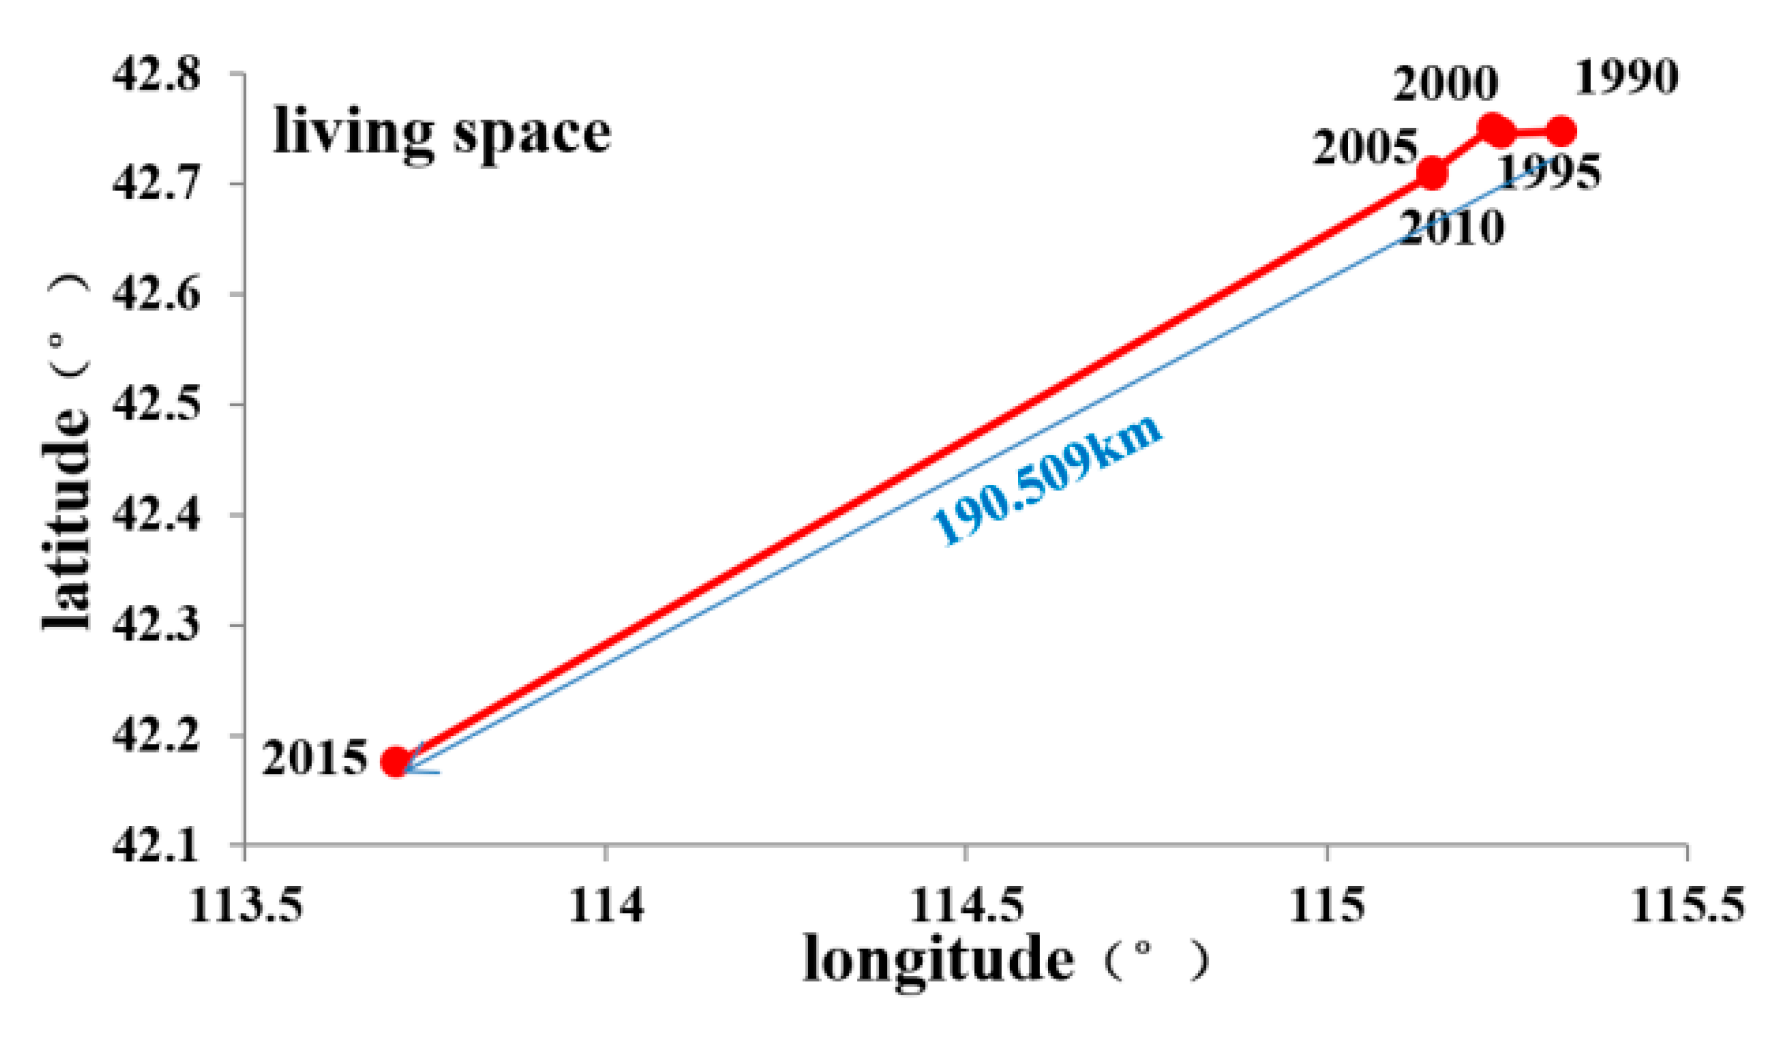
3.2.2. Shifts in the Spatial Center of Gravity of EPLS in Inner Mongolia

The center-of-gravity transfer trajectory of EPLS in Inner Mongolia from 1990 to 2015 was calculated using the center transfer formula, with the results shown in Figure 6. It is evident that the center of gravity of EPLS in Inner Mongolia changed from 1990 to 2015. The center of gravity of living space showed the greatest migration, whereas that of production space showed the smallest. The trajectory of the center of gravity of ecological space in Inner Mongolia showed an “S” shape from 1990 to 2015, and the center of gravity of ecological space moved 104.228 km to the southwest, with the migration not obvious from 1990 to 2010, but accelerating subsequently. Over the same period, the center of gravity of production space in Inner Mongolia moved 52.932 km to the northeast, whereas that of living space moved 190.509 km to the southwest.

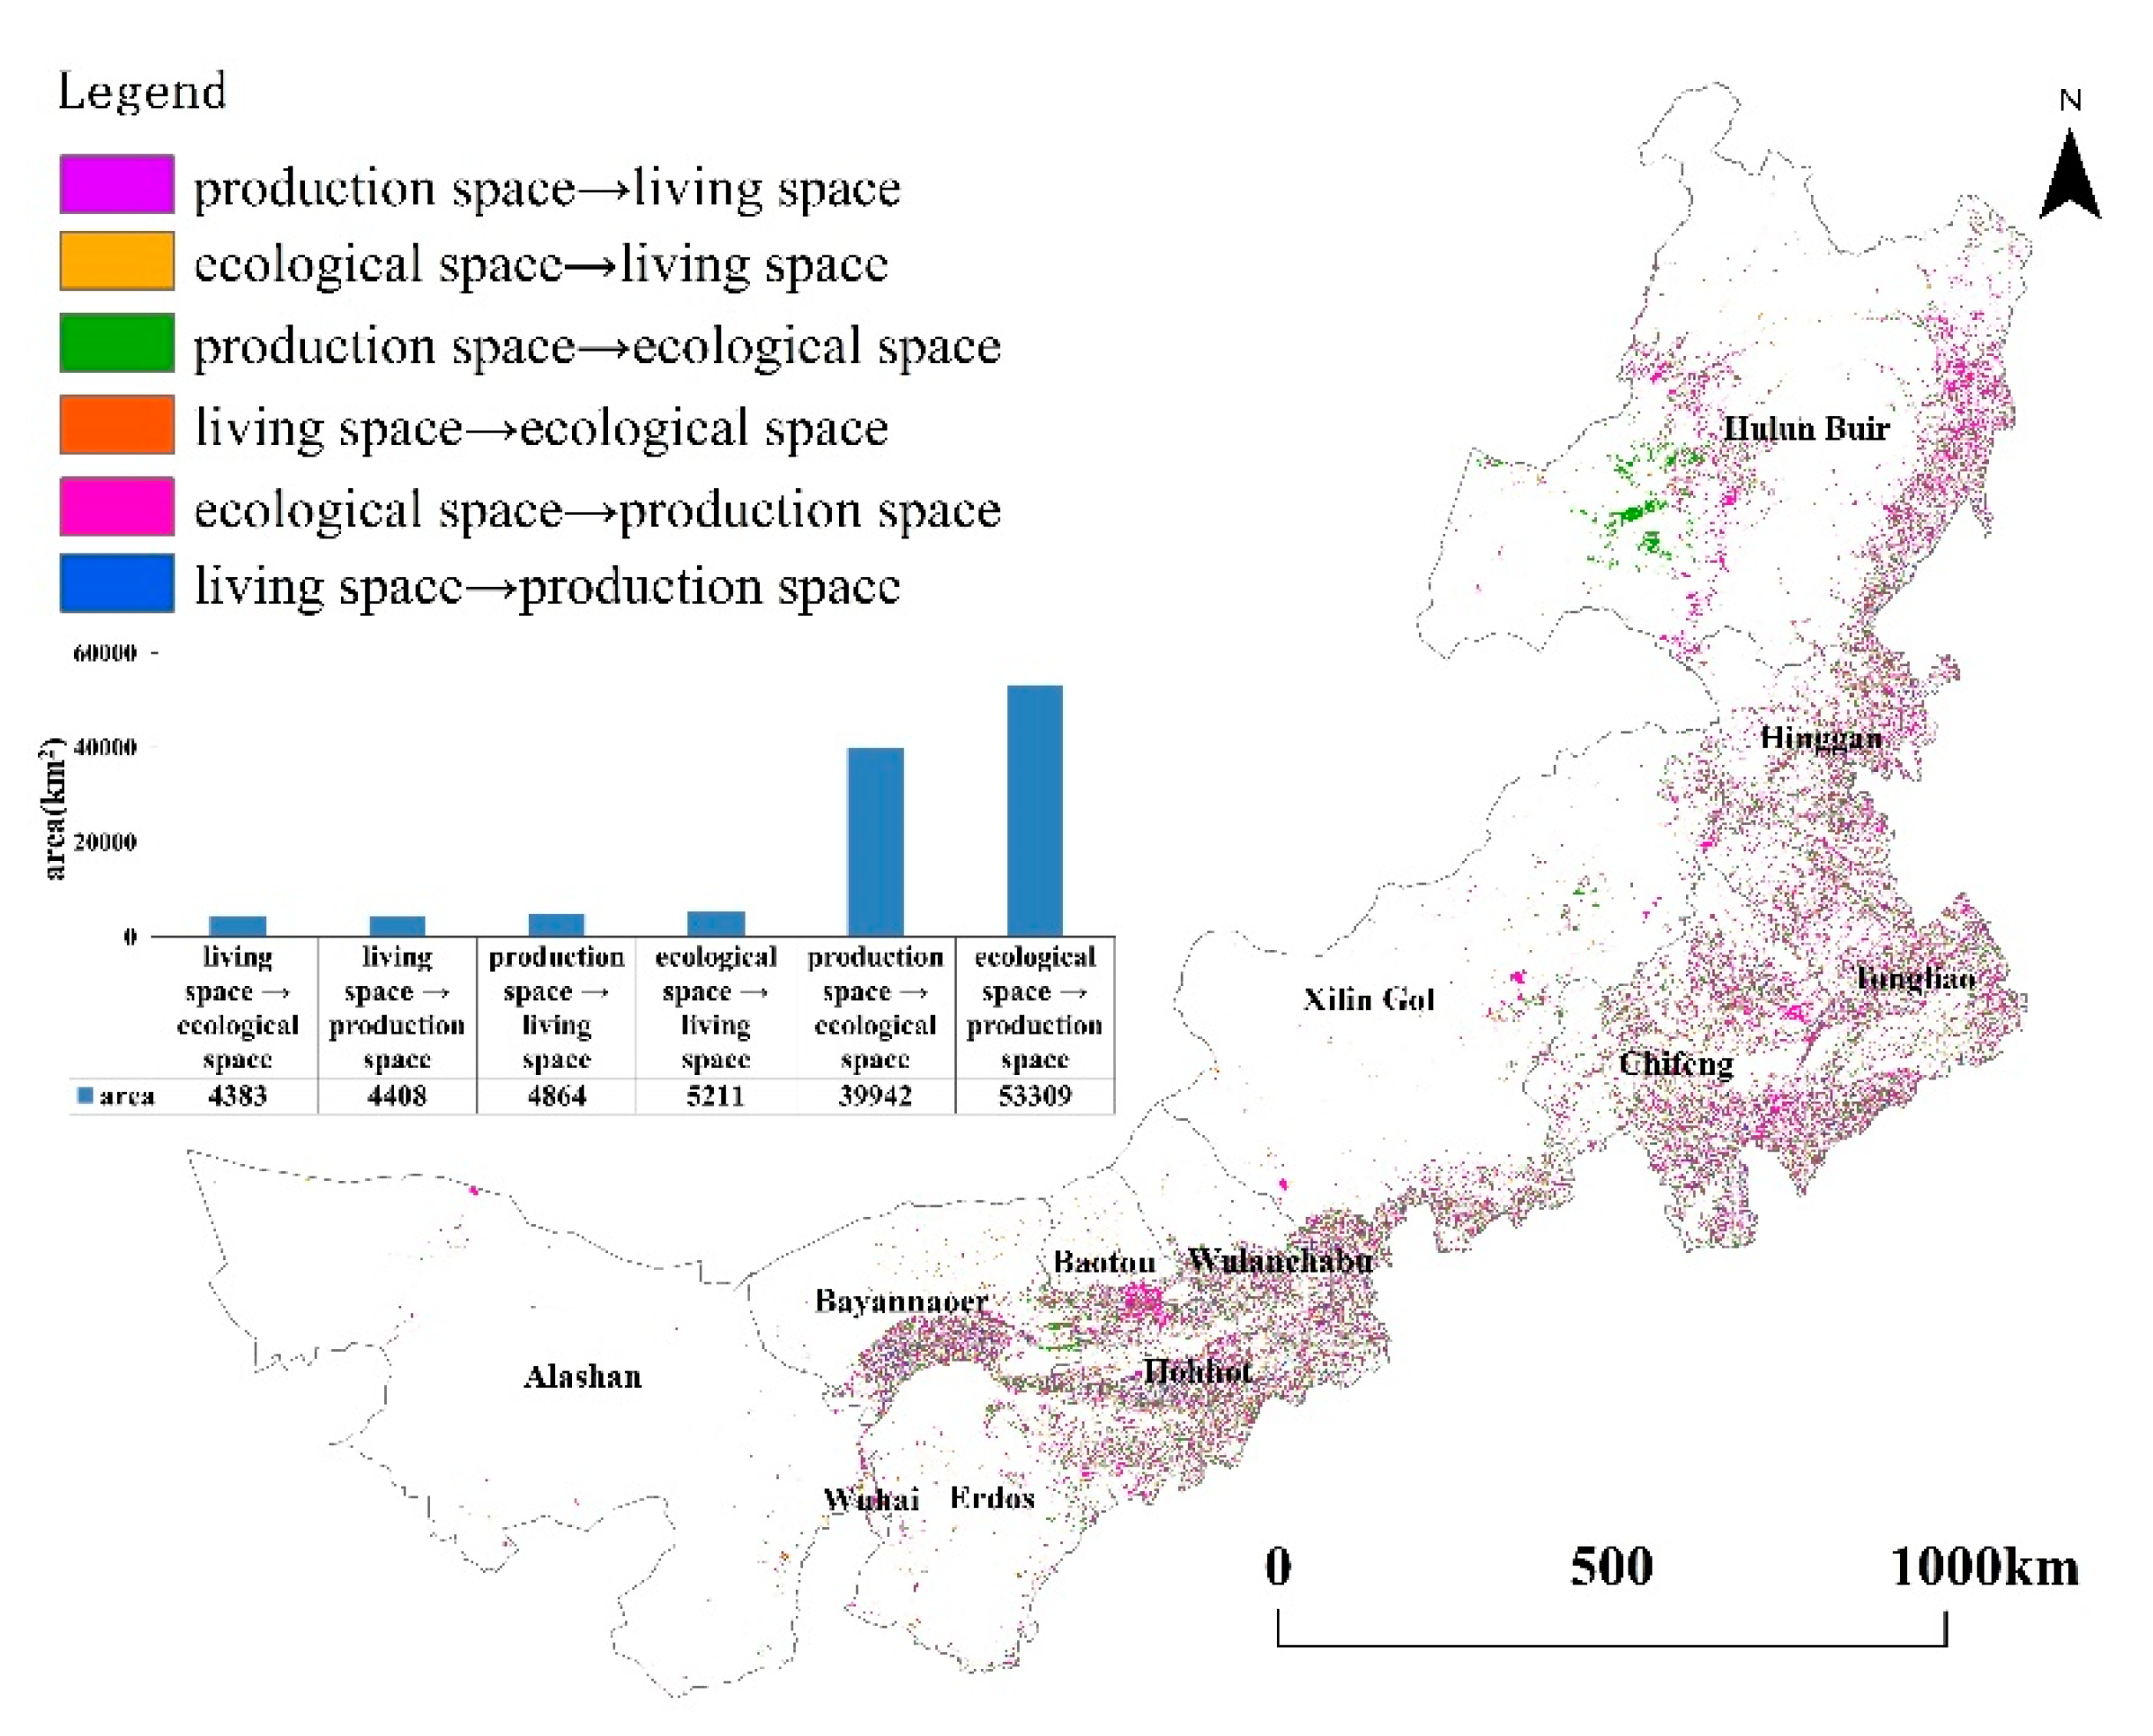
3.2.3. Characteristics of Mutual Transformation of EPLS in Inner Mongolia

Figure 7 shows that the interaction between ecological space and production space was the most obvious, with a clear, consistent relationship between ecological space and production space, which was concentrated in the cities of Hulunbuir and Chifeng, indicating poor stability of ecological and living spaces in this region. In general, changes to EPLS in Inner Mongolia from 1990 to 2015 were mainly concentrated in the area south of the Xingan Ling–Yinshan–Helan mountains, where the main production mode was agriculture. In other words, the relative stability of the EPLS area was consistent with that of areas in which animal husbandry is practiced. There were obvious impacts of agricultural-based production methods on changes to EPLS.
Several features were noted within the spatial patterns of EPLS in Inner Mongolia. The changes in EPLS indicate that there have been rapid increases in production and living spaces, whereas ecological spaces have continuously decreased. Within structural EPLS change, living spaces have always been focused within towns, with a strong path dependence characteristic, whereas production spaces are mainly distributed bordering living spaces, and even appear to be an expansion of the “enclave”-type space in which living and production spaces are nested and distributed within an ecological space, with the ecological space constantly fragmented by living and production spaces, and the degree of fragmentation becoming increasingly severe.

3.3. Driving forces of EPLS in Inner Mongolia

3.3.1. Identification of Influencing Factors

The present study used per capita gross domestic product (GDP), urbanization, number of urban employees, disposable income of urban residents, disposable income of farmers and herdsmen, highway mileage, proportions of GDP contributed by secondary and tertiary industries, population density, local fiscal revenue, local fiscal expenditure and urban fixed-asset investment as indicators, and multivariate stepwise regression analysis was used to study the factors influencing EPLS in Inner Mongolia.
Regression analysis of the change in living space indicated that urbanization, number of urban employees, proportions of GDP contributed by secondary and tertiary industries, population density and local fiscal expenditure had direct and significant (p ≤ 0.001) impacts on the area of living space (Table 2). Among these indices, population density, proportions of GDP contributed by secondary and tertiary industries and urbanization level had a large positive correlation with living space. Urbanization level and the increase in urban population density resulted in an increase in demand for living space, and the proportions of GDP contributed by secondary and tertiary industries and the level of local fiscal expenditure increased, thereby providing an employment and economic basis for increased urbanization.
Urbanization, number of urban employees, highway mileage and the proportions of GDP contributed by secondary and tertiary industries had significant (p ≤ 0.001) correlations with production space (Table 3). Urbanization and highway mileage provided an economic basis and a superior location for the expansion of production space. The increase in urban employment and the proportions of GDP contributed by secondary and tertiary industries promoted the expansion of production spaces.

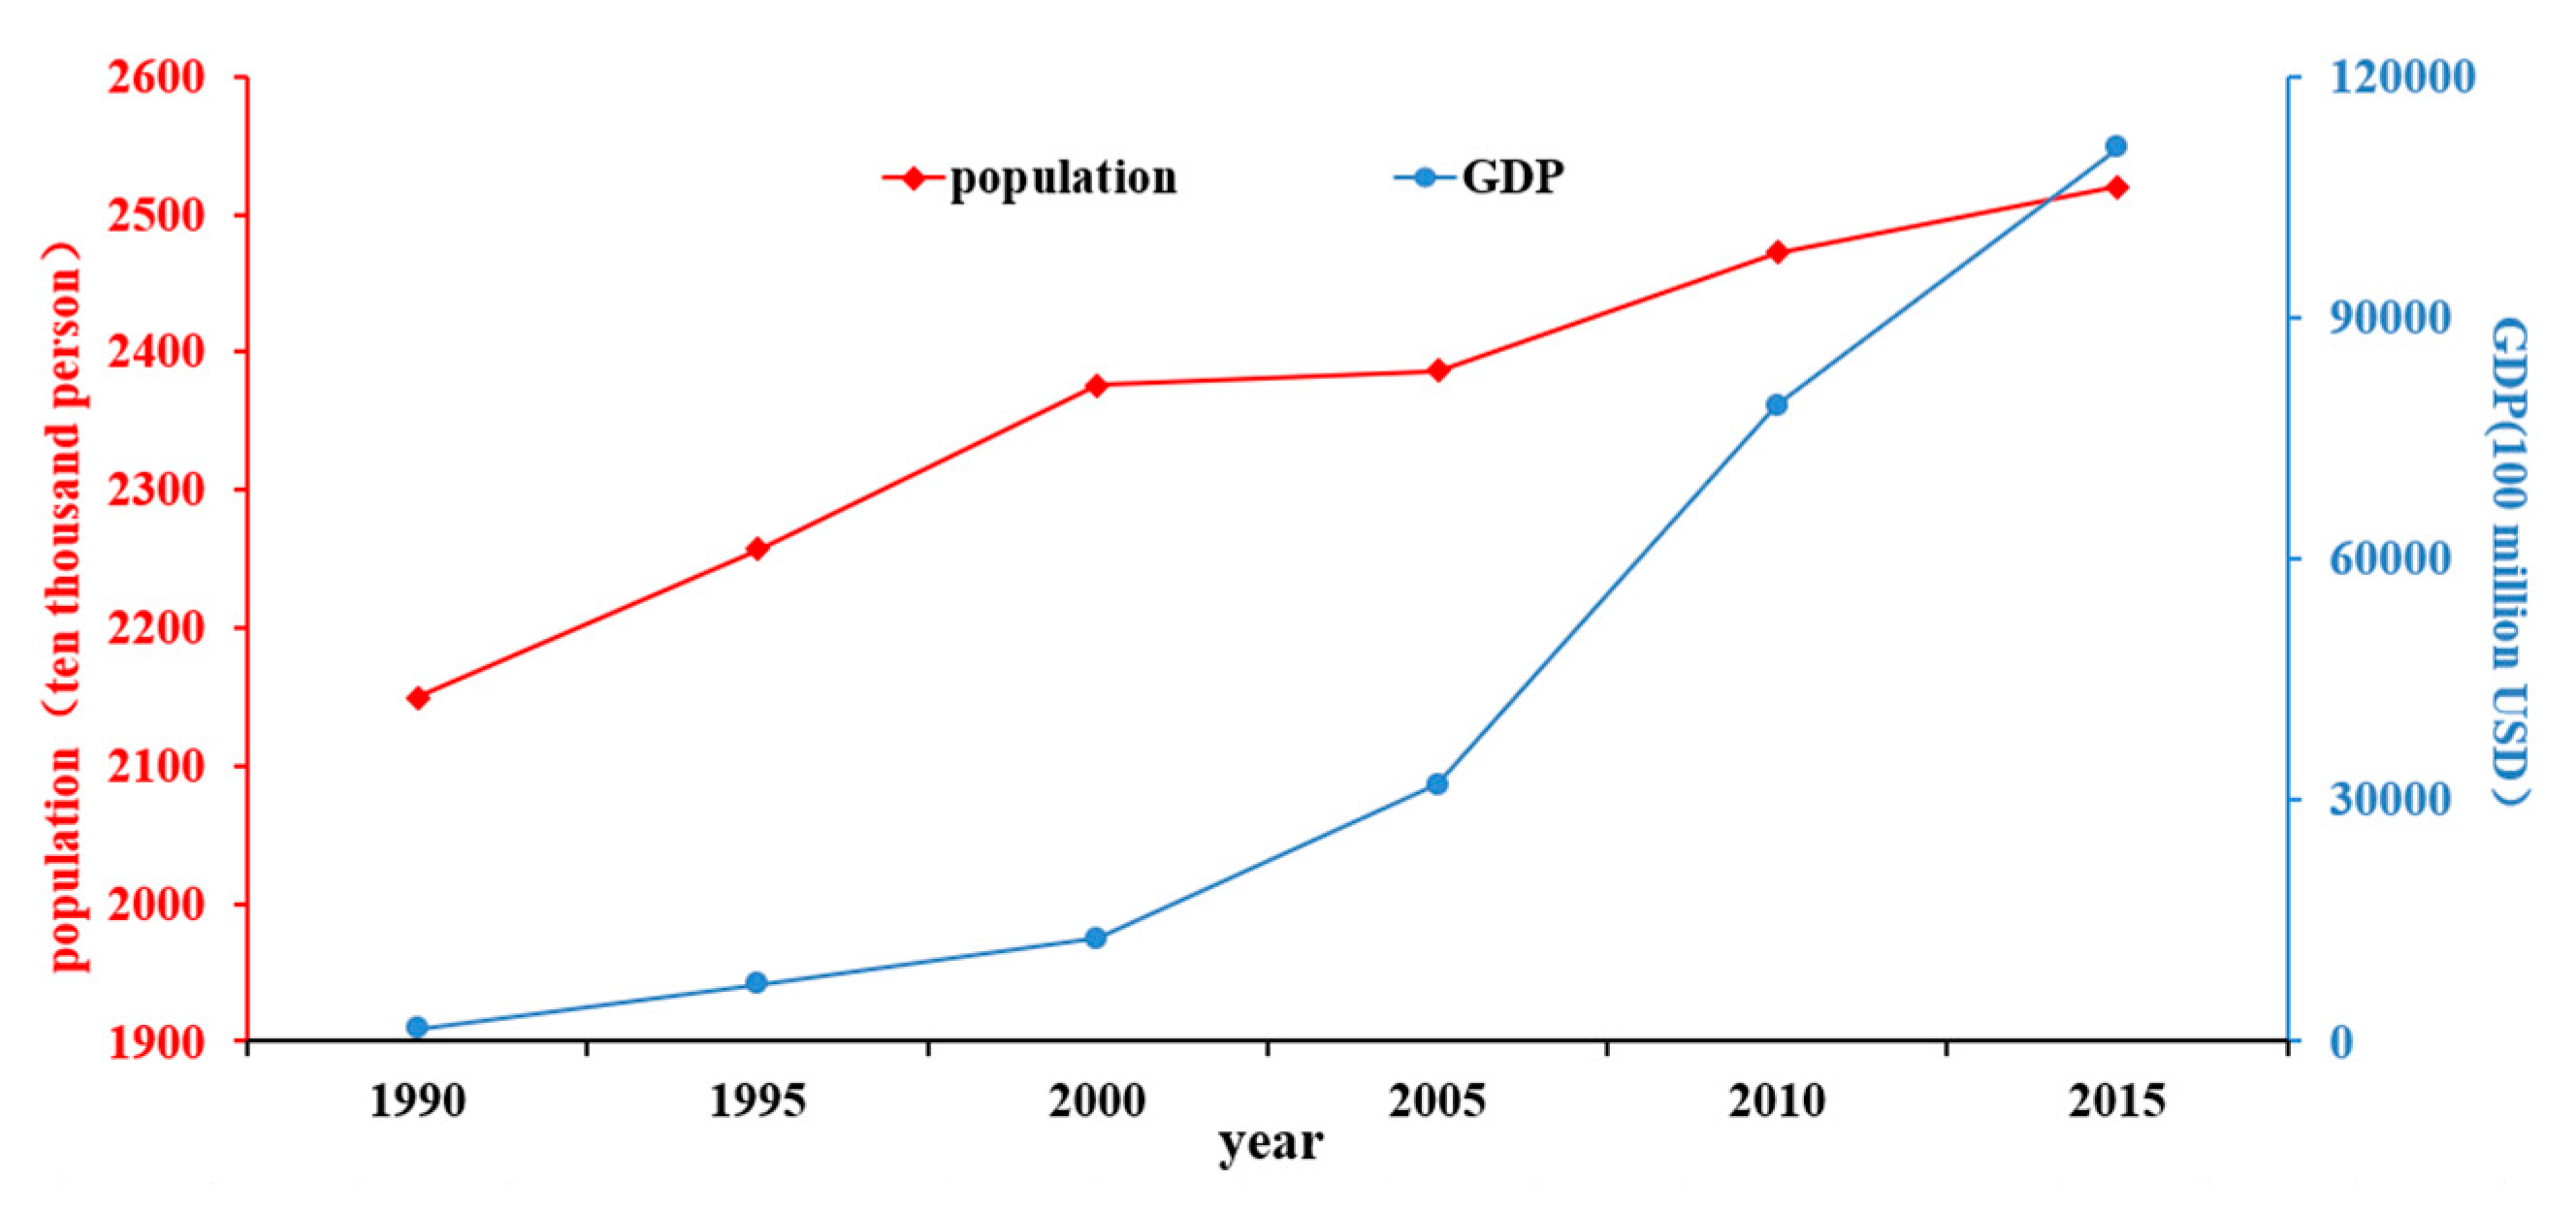
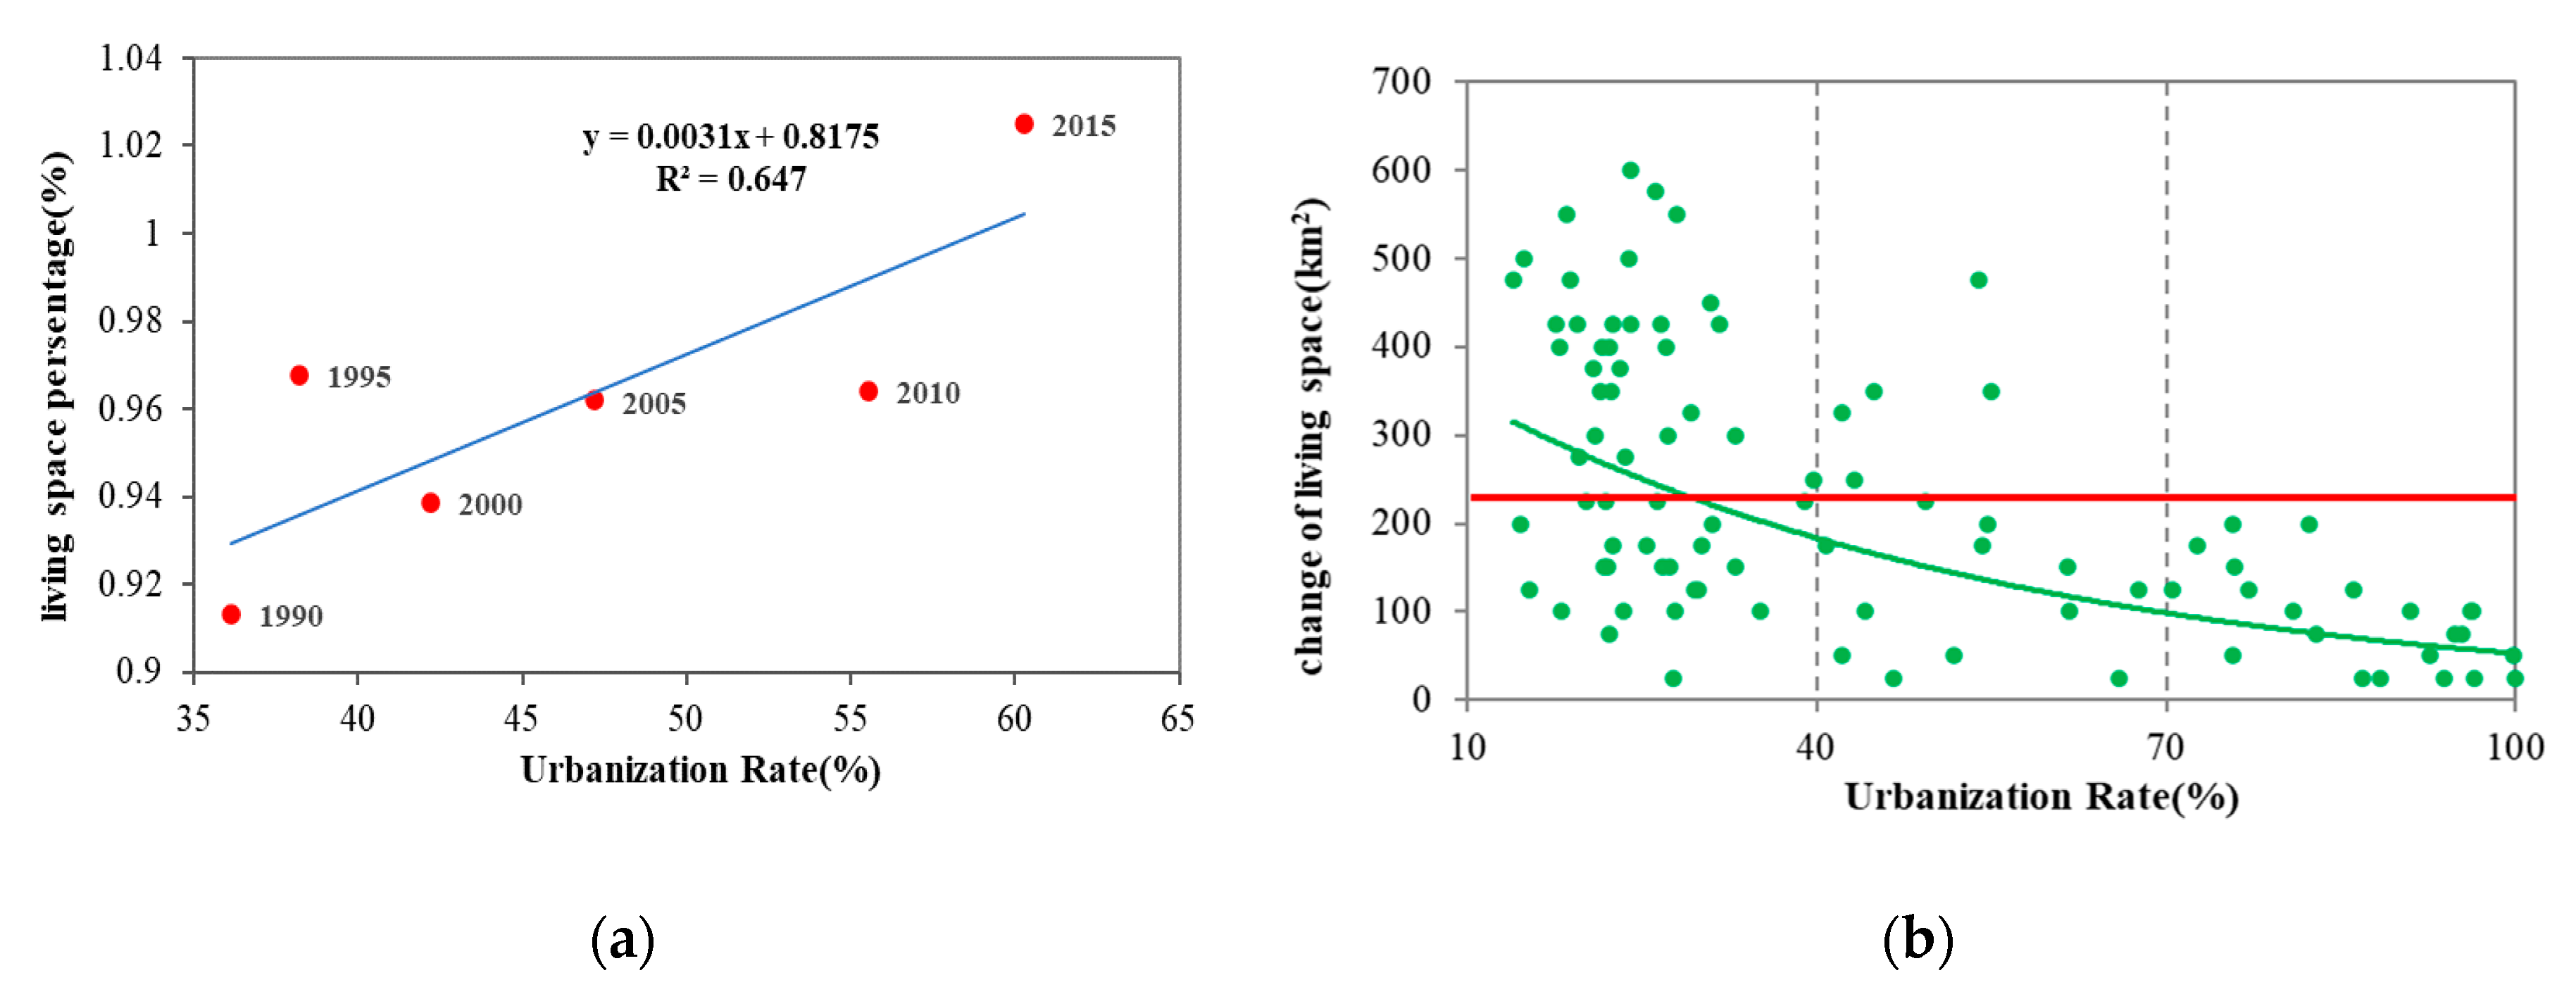
3.3.2. The Impact of Socioeconomic Development on Changes in EPLS

Changes to regional EPLS are the result of natural and human factors [28]. Studies have shown that urbanization and industrialization are the basic driving forces of spatial change in regional EPLS, which is also significant in Inner Mongolia [29]. Since the implementation of the Western Development Strategy in 2000, the government has issued a large number of policies for facilitating the enlargement of the scale of urban construction and infrastructure development to promote urbanization and industrialization of Inner Mongolia. The GDP of Inner Mongolia has increased from 219.92 billion United States Dollars (USD) in 2000 to 2262.59 billion USD in 2015, with an annual average growth rate of 18.09%, exceeding the national average growth in GDP during the same period. The level of urbanization in Inner Mongolia increased rapidly from 32.08% in 1990 to 48.73% in 2015 (Figure 8), and large numbers of people began to migrate into urban areas, resulting in the continuous expansion of the urban population. Subsequently, rapid regional industrialization and urbanization resulted in increasing encroachment of industrial and mining production spaces and urban living spaces into ecological spaces, leading to increasing tension between development and protection of the ecological environment.
The rapid growth of the population in Inner Mongolia has resulted in increasing demand for production and living spaces. The area of ecological space in Inner Mongolia decreased to 14,028 km2 from 1990 to 2015, whereas production and living spaces increased to 13,049 and 1284 km2, respectively.
Correlations between urbanization and changes in living space in 103 counties in Inner Mongolia were analyzed to identify the relationship between them. The results showed a high correlation (R2 = 0.647) between the rate of urbanization and the proportion of living space, with living space expanding with increasing urbanization (Figure 9a). However, there were obvious differences in the changes in living space among counties with different levels of urbanization. Figure 9b illustrates that changes in living space in counties with high urbanization levels were relatively insignificant, whereas those in counties with low urbanization levels were relatively obvious. At the same time, the urbanization rates of half of the counties in Inner Mongolia were below 40%, and changes in living space in more than one-third of the counties exceeded the average change. These results indicate that urbanization is an important factor driving changes in living space in Inner Mongolia.

3.3.3. The Impact of Government Policies on Changes in EPLS

Government policies have an important impact on regional changes in EPLS. Obvious changes to EPLS occurred in Inner Mongolia after 2000. Since the beginning of the 21st century, rapid socioeconomic development and increased urbanization rates in Inner Mongolia have resulted in rapid population growth, and the urbanization rate had risen to 60.3% by 2015. In addition, a series of policies related to the development and utilization of land space have been issued in Inner Mongolia since 2000, such as the “Western Development” and “Returning Farmland to Forest” policies. After the implementation of these policies, the government of Inner Mongolia implemented certain measures to promote urban construction, land management, infrastructure construction and other aspects to facilitate rapid urbanization and industrialization. Rational evidence-based land space development has become the focus of national sustainable development, which requires that regional development should not only consider the spatial layout of industry, but also comprehensively consider the coordination of population, resources and the ecological environment. The report of the 18th National Congress of China in 2012 emphasized that production spaces should be intensive and efficient, living space should promote human well-being and ecological spaces should be as little impacted as possible [30]. The 13th Five-Year Plan of China in 2016 advocated the coordinated development of construction, agricultural and ecological spaces from the perspective of main functional areas [31]. Territorial Planning, issued in 2017, determined the scale and structure of land space development and utilization, which promoted the rational and efficient development of the functional spatial layout of EPLS. Overall, quantitative and structural changes to EPLS in Inner Mongolia require not only bottom-up development, but also top-down policy incentives to promote sustainable development in the region.

3.3.4. The Impact of Mining of Mineral Resources on Changes in EPLS

Inner Mongolia is rich in coal resources, with an estimated 7323 × 109 tons of confirmed coal reserves, thereby ranking first and second in China in terms of short-term and long-term coal reserves, respectively. Areas with coal resources in Inner Mongolia are generally placed into two categories, namely the low metamorphic bituminous coal area in Ordos and the lignite area in the eastern part of Inner Mongolia (Figure 10). Surface coal mining involves the extraction of coal from a shallow coal seam through open-pit mining. Large-scale surface coal mining has typically resulted in many negative ecological effects. Many studies have concluded that the process of mining compromises large areas of the ecological environment [32,33]. For example, the area of surface open-pit mining in Xilingol increased from 670.8 hm2 in 2005 to 6722.19 hm2 in 2015 [34]. At the same time, the exploitation of mineral resources has provided the economic foundation for increasing the level of urbanization, and there are many examples of rejuvenation of cities due to exploitation of coal, such as occurred in the city of Bayanhua [35,36]. In summary, the development and utilization of coal resources plays an important role in regional changes to EPLS, with ecological spaces reduced and living and production spaces expanded.

4. Conclusions

The present study revealed the spatial and temporal evolution of EPLS in Inner Mongolia and the driving forces responsible based on the land use data for the period 1990–2015. The following main conclusions were made:
(1)
The pattern of EPLS change remained basically the same during 1990–2015, with obvious regional differences. Inner Mongolia remains predominantly ecological space which is distributed to the north of the Greater Hinggan–Yinshan–Helan mountain ranges, whereas production and living spaces are distributed to the south of the mountain ranges.
(2)
Over the past 25 years, there has been a decline in ecological space in Inner Mongolia, whereas living and production spaces have expanded. Living spaces are concentrated in central cities with obvious path dependence. The distribution and expansion of production spaces are concentrated around living spaces. Living spaces have increased whereas ecological spaces have decreased in the central and western regions, and production spaces have increased in the eastern region.
(3)
Production space showed the largest Barycenter migration distance of 190.509 km from 1990 to 2015, with the center moving southwest. Ecological space showed the second-largest Barycenter migration distance.
(4)
Change to EPLS in Inner Mongolia is affected by topography, climate, economic development, population growth and policies, and areas with higher economic development and population growth have undergone greater changes in EPLS.
EPLS is essentially the result of the evolution and differentiation of the relationship between mankind and land and is formed and developed under the influence of various factors such as global climate change and urbanization. Therefore, future research should refine the classification system and scoring standards of EPLS and comprehensively analyze and identify driving forces of change to EPLS relating to nature, the social economy and polices so as to provide references for land space planning and sustainable development of Inner Mongolia.

Author Contributions

All authors contributed significantly to this manuscript. J.Z. and Z.T. were responsible for the original idea and the theoretical aspects of the paper. A.S. and L.N. were responsible for the data collection and pre-processing, Z.D. drafted the manuscript. All authors have read and agreed to the published version of the manuscript.

Funding

This study was supported by the International (Regional) Cooperation and Exchange Programs of National Natural Science Foundation of China (41961144019), the Consulting Research Project of Chinese Academy of Engineering (2019-JL-3-1), and the National Key R&D Program of China (2019YFD1002201).

Acknowledgments

The authors would like to thank the Data Center for Resources and Environmental Sciences, Chinese Academy of Sciences (RESDS, http://www.resdc.cn) for providing the land use dataset.

Conflicts of Interest

The authors declare no conflict of interest.

References

  1. Shi, Z.Q.; Deng, W.; Zhang, S.Y. Spatial pattern and spatio-temporal change of territory space in Hengduan Mountains region in recent 25 years. Geogr. Res. 2018, 37, 607–621. [Google Scholar]
  2. Huang, J.C.; Lin, H.X.; Qi, X.X. A literature review on optimization of spatial development pattern based on ecological-production-living space. Prog. Geogr. 2017, 36, 378–391. [Google Scholar]
  3. Collins, G.R. Linear planning throughout the world. J. Soc. Archit. Historians 1959, 18, 74–93. [Google Scholar] [CrossRef]
  4. Howard, G. Civitas by Design Building Better Bommunities, from the Garden City to the New Urbanism; The Penguin Press: London, UK, 2010. [Google Scholar]
  5. Zhu, N.; Ren, Y.Y. Western architectural context and rational thinking. Archit. Cult. 2016, 10, 112–113. [Google Scholar]
  6. Li, G.D.; Fang, C.L. Quantitative function identification and analysis of urban ecological-production-living spaces. Acta Geogr. Sin. 2016, 71, 49–65. [Google Scholar]
  7. Zhang, H.Q.; Xu, E.Q.; Zhu, H.Y. An ecological-living-industrial land classification system and its spatial distribution in China. Resour. Sci. 2015, 37, 1332–1338. [Google Scholar]
  8. Smeraldo, S.; Bosso, L.; Fraissinet, M.; Bordignon, L.; Brunelli, M.; Ancillotto, L.; Russo, D. Modelling risks posed by wind turbines and power lines to soaring birds: The black stork (Ciconia nigra) in Italy as a case study. Biodivers. Conserv. 2020, 29, 1959–1976. [Google Scholar] [CrossRef]
  9. Alkishe, A.; Cobos, M.E.; Peterson, A.T.; Samy, A. Recognizing sources of uncertainty in disease vector ecological niche models: An example with the tick Rhipicephalus sanguineus sensu lato. Perspect. Ecol. Conserv. 2020, 18, 91–102. [Google Scholar] [CrossRef]
  10. Johnson, E.; Escobar, L.E.; Zambrana-Torrelio, C. An Ecological Framework for Modeling the Geography of Disease Transmission. Trends Ecol. Evol. 2019, 34, 655–668. [Google Scholar] [CrossRef] [Green Version]
  11. Kates, R.W.; Clark, W.C.; Corell, R. Sustainability science. Science 2001, 292, 641–642. [Google Scholar] [CrossRef]
  12. Zhu, Y.Y.; Yu, B.; Zeng, J.X.; Han, Y. Spatial optimization from three spaces of production, living and ecology in national restricted zones–a case study of Wufeng county in Hubei province. Econ. Geogr. 2015, 35, 26–32. [Google Scholar]
  13. Ancillotto, L.; Bosso, L.; Salinas-Ramos, V.; Russo, D. The importance of ponds for the conservation of bats in urban landscapes. Landsc. Urban Plan. 2019, 190, 103607. [Google Scholar] [CrossRef]
  14. Li, G.; Jiang, C.; Du, J.; Jia, Y.; Bai, J. Spatial differentiation characteristics of internal ecological land structure in rural settlements and its response to natural and socio-economic conditions in the Central Plains, China. Sci. Total Environ. 2020, 709, 135932. [Google Scholar] [CrossRef] [PubMed]
  15. Chen, J.; Shi, P.J. Discussion on functional land use classification system. J. Beijing Norm. Univ. Nat. Sci. 2005, 41, 536–540. [Google Scholar]
  16. Liu, J.Y.; Zhang, Z.X.; Zhang, S.W.; Yan, C.Z.; Wu, S.X.; Li, R.D.; Kuang, W.H.; Shi, W.J.; Huang, L.; Ning, J.; et al. Innovation and development of remote sensing-based land use change studies based on Shupeng Chen’s academic thoughts. J. Geo-Inf. Sci. 2020, 22, 680–687. [Google Scholar]
  17. Liu, J.Y.; Kuang, W.H.; Zhang, Z.X. Spatiotemporal characteristics, patterns and causes of land use changes in China since the late 1980s. Acta Geogr. Sin. 2014, 69, 3–14. [Google Scholar]
  18. Nelson, E.; Mendoza, G.; Regetz, J. Modeling multiple ecosystem services, biodiversity conservation, commodity production, and tradeoffs at landscape scales. Front. Ecol. Environ. 2009, 7, 4–11. [Google Scholar]
  19. Li, K.; Mao, D.H.; Li, J.; Jiang, Z.L. On the evolution of spatial-temporal patterns of production-living-ecological space in Xiangjiang river Basin. J. Nat. Sci. Hunan Norm. Univ. 2020, 43, 9–19. [Google Scholar]
  20. Huang, T.N.; Zhang, Y.L. Transformation of land use function and response of eco-environment based on “production-life-ecology space”: A case study of resource-rich area in western Guangxi. Acta Ecol. Sin. 2021, 40, 1–12. [Google Scholar]
  21. Wang, M.J. Analysis the change of urban internal spatial structure based on the shift of city gravity in Dalian city. Territ. Nat. Resour. Study 2015, 4, 1–3. [Google Scholar]
  22. Zhou, L.M.; Wang, S.H. Remote sensing monitoring and evaluation of spatial and temporal changes of ecological environment in Hangjin Banner, Inner Mongolia, China. Chin. J. Appl. Ecol. 2020, 31, 1999–2006. [Google Scholar]
  23. Dong, T.X.; Qin, Q.M.; Wang, J.H. Expansion modes of urban land-use in Mianyang City in the last 30 years. Geogra. Res. 2011, 30, 667–675. [Google Scholar]
  24. Lian, X.M. Analysis on the space evolvement track of population gravity center, employment gravity center and economic gravity center. Popul. J. 2007, 3, 23–28. [Google Scholar]
  25. Liu, S.; Li, X.; Chen, D.; Duan, Y.; Ji, H.; Zhang, L.; Chai, Q.; Hu, X. Understanding Land use/Land cover dynamics and impacts of human activities in the Mekong Delta over the last 40 years. Glob. Ecol. Conserv. 2020, 22, e00991. [Google Scholar] [CrossRef]
  26. Sannigrahi, S.; Zhang, Q.; Joshi, P.; Sutton, P.C.; Keesstra, S.; Roy, P.; Pilla, F.; Basu, B.; Wang, Y.; Jha, S.; et al. Examining effects of climate change and land use dynamic on biophysical and economic values of ecosystem services of a natural reserve region. J. Clean. Prod. 2020, 257, 120424. [Google Scholar] [CrossRef]
  27. Xu, G.C.; Kang, M.Y.; Li, Y.F. Analysis of land use change and its driving forces in Xiling’ol League. Resour. Sci. 2011, 33, 690–697. [Google Scholar]
  28. Hao, J.; Xu, G.Y.; Luo, L.; Zhang, Z.; Yang, H.L.; Li, H.Y. Quantifying the relative contribution of natural and human factors to vegetation coverage variation in coastal wetlands in China. Catena 2020, 188, 104429. [Google Scholar] [CrossRef]
  29. Zhang, C.G.; Fang, C.L. Driving mechanism analysis of ecological-economic-social capacity interactions in oasis systems of arid lands. J. Nat. Resour. 2002, 17, 181–187. [Google Scholar]
  30. Fan, J. High-quality development of national territory space governance and regional economic layout during 14th Five-Year plan in China. Bull. Chin. Acad. Sci. 2020, 7, 796–805. [Google Scholar]
  31. Xia, H.; Zhang, W.; He, L.; Ma, M.; Peng, H.; Li, L.; Ke, Q.; Hang, P.; Wang, X. Assessment on China’s urbanization after the implementation of main functional areas planning. J. Environ. Manag. 2020, 264, 110381. [Google Scholar] [CrossRef]
  32. Ma, Q.; He, C.; Fang, X. A rapid method for quantifying landscape-scale vegetation disturbances by surface coal mining in arid and semiarid regions. Landsc. Ecol. 2018, 33, 2061–2070. [Google Scholar] [CrossRef]
  33. Rong, A.; Bi, Q.G.; Dong, Z.H. Change of grassland vegetation and driving factors based on MODIS/NDVI in Xilingol, China. Resour. Sci. 2019, 41, 1374–1386. [Google Scholar]
  34. Guan, C.Z.; Zhang, B.L.; Zhao, J.L.; Li, J.N. Analysis on land use disturbances of surface coal mining in Xilinhot. Environ. Monit. Forewarning 2017, 9, 14–18. [Google Scholar]
  35. Rong, A. Research on the land a spatial development suitability in Xilingol, Inner Mongolia. Ph.D. Thesis, Northeast Normal University, Changchun, China, 2017; pp. 116–125. [Google Scholar]
  36. Jing, P.Q.; Wang, Q.X. Coal resource exploitation and blessing and curse with regional economic development: A positive analyse based on Shanxi Province. China Ind. Econ. 2008, 7, 80–90. [Google Scholar]
Figure 1. Conceptual diagram representing the relationships between ecological, production and living spaces (EPLSs).
Sustainability 12 07964 g001
Figure 2. Map showing mountain ranges, elevation and location of Inner Mongolia.
Sustainability 12 07964 g002
Figure 3. Spatial distributions of production, living and ecological spaces in Inner Mongolia from 1990 to 2015.
Sustainability 12 07964 g003
Figure 4. Percentage changes to the areas of production, living and ecological spaces in Inner Mongolia from 1990 to 2015.
Sustainability 12 07964 g004
Figure 5. Spatial changes to ecological, production and living spaces (EPLSs) in Inner Mongolia from 1990 to 2015. The unit in the bar charts is km2.
Sustainability 12 07964 g005
Figure 6. Migrations of production, living and ecological space in Inner Mongolia from 1990 to 2015 as calculated using the Barycenter migration model. Blue arrows indicate the moving distances.
Sustainability 12 07964 g006aSustainability 12 07964 g006b
Figure 7. Transformation in ecological, production and living spaces (EPLSs) in Inner Mongolia from 1990 to 2015.
Sustainability 12 07964 g007
Figure 8. Changes in the gross domestic product (GDP) and population in Inner Mongolia during the period 1990–2015.
Sustainability 12 07964 g008
Figure 9. Relationship between urbanization rate and living space. (a) and the changes in living space (b) for 103 counties in Inner Mongolia. The red line indicates the average value of changes in living space in Inner Mongolia.
Sustainability 12 07964 g009
Figure 10. Map showing the distribution of coal bearing areas and coal mining areas in Inner Mongolia.
Sustainability 12 07964 g010
Table 1. Ecological–production–living space (EPLS) land classification system of Inner Mongolia.
Class IClass IIProductionLivingEcological
IDNameIDName
1Cropland11Paddy field503
12Dry land503
2Woodland21Woodland005
22Shrubbery land003
23Sparse woodland003
24Other woodland003
3Grassland31High-coverage grassland305
32Medium-coverage grassland305
33Low-coverage grassland105
4Water41Rivers and canals303
42Lakes005
43Reservoirs and ponds303
46Beach land005
5Construction land51City and town areas150
52Residential quarters in rural areas150
53Industrial and mining land, land used for transportation330
6Unused land61Sandy land005
62Exposed rock and shingle land005
63Saline-alkali land005
64Marshland005
65Bare land005
66Exposed rock and shingle land005
Table 2. Coefficients of the living space regression model.
VariableCoefficientStd. ErrorT-StatisticProb.
Urbanization (%)57.37959.1124−6.29690.0000
Number of urban employees (person)0.00380.00113.34040.0028
Proportions of GDP contributed by secondary and tertiary industries (%)69.382128.27472.45390.0221
Population density (person km−2)1780.7140596.53182.98510.0066
Local fiscal expenditure (ten thousand Yuan)0.00070.00023.09700.0051
Table 3. Coefficients of the production regression model.
VariableCoefficientStd. ErrorT-StatisticProb.
Urbanization (%)0.00430.00142.97090.0068
Number of urban employees (person)0.01450.0043.62020.0014
Highway mileage (km)0.3830.16192.36620.0268
Proportions of GDP contributed by secondary and tertiary industries (%)349.637119.4852−2.92620.0076

