Sound Absorption Properties of Natural Fibers: A Review
by
 , , ,
, , ,
Tao Yang
1,* ,
,
Lizhu Hu
2, 
Xiaoman Xiong
3,
Michal Petrů
1,
Muhammad Tayyab Noman
1 ,
,
Rajesh Mishra
3 and
Jiří Militký
3 1
Institute for Nanomaterials, Advanced Technologies and Innovation, Technical University of Liberec, 461 17 Liberec, Czech Republic
2
Jiangxi Center for Modern Apparel Engineering and Technology, Jiangxi Institute of Fashion Technology, Nanchang 330200, China
3
Department of Material Engineering, Faculty of Textile Engineering, Technical University of Liberec, 461 17 Liberec, Czech Republic
*
Author to whom correspondence should be addressed.
Sustainability 2020, 12(20), 8477; https://0-doi-org.brum.beds.ac.uk/10.3390/su12208477
Submission received: 9 September 2020
/
Revised: 9 October 2020
/
Accepted: 11 October 2020
/
Published: 14 October 2020
(This article belongs to the Special Issue Sustainable Acoustic Materials)
Abstract
:In recent years, in an attempt to substitute the conventional synthetic sound absorption material, natural fibers and their sound absorption properties have been increasingly studied. This is due to the fact that conventional synthetic fiber has potential health risks for human beings and significant environmental impact. In this review, existing and newly emerging natural fiber sound absorbers are summarized and highlighted in three categories: raw material, fiber assembly and composite. The sound absorption mechanism, several widely used prediction models and the popular acoustic characterization methods are presented. The comparison of sound absorption properties between some natural sound absorbers and glass fiber is conducted in two groups, i.e., thin material and thick material. It is found that many natural fibers have comparable sound absorption performance, some of them can be the ideal alternatives to glass fiber, such as kapok fiber, pineapple-leaf fiber and hemp fiber. Last, the conclusion part of this review gives an outlook regarding the promotion of the commercial use of natural fiber by means of theoretical study, efficient and environmentally friendly pretreatment and Life Cycle Assessment.
1. Introduction
In the progress of urbanization and transport growth, noise pollution was ignored as an annoying but harmless nuisance. Nowadays, the general population has realized that noise not only has a significant effect on work efficiency and living standards but can also cause a series of health problems, such as hearing loss, sleep disturbances, tiredness, cardiovascular and psycho-physiologic problems, etc. [1,2]. Therefore, it is important and essential to control the noise from the living environments. Using fibrous sound absorption materials to absorb sound wave energy is an important approach to minimize the effects from noise pollution [3]. Furthermore, sound absorption materials can improve acoustic comfort (e.g., speech intelligibility) by controlling reverberation time in working places, concert halls, exhibition halls, opera houses, etc. [4].
Fibrous material plays a vital role in the building industry as a dual insulator (sound and thermal). Some conventional fibrous insulators, such as glass fiber and mineral wool, are extensivity applied in sound absorption applications due to their large specific surface area, high acoustical performance and economical price [5]. In 2005, glass fiber and mineral wool dominated the market of insulator materials in Europe, which account for 60% of the market [6]. While organic foamy materials (i.e., polystyrene and polyurethane) and other materials, respectively, account for 27% and 13% of the market. Although glass fiber and mineral wool have significant superiorities on acoustic and thermal insulation performances, it cannot be ignored that some potential human health problems occur due to skin irritation and lay-down in the lung alveoli caused by inhaling fibers and particles [7]. In addition, conventional synthetic materials have a higher environmental impact than natural fibers [8]. For instance, synthetic fiber is usually made from high-temperature manufacturing processes, and the source of synthetic fiber is often taken from petrochemical sources, thus producing a significant amount of carbon footprints [9]. Additionally, synthetic material consumes more energy and has higher global warming potential from cradle to site installation based on Life Cycle Assessment [10]. Hence, it is meaningful to seek environmentally friendly and harmless materials to substitute conventional sound absorbers.
Most of the natural fibers are the potentially ideal alternatives to conventional sound absorbers because of their low toxicity and their being harmless to human beings. Natural fibers have been known as green materials by virtue of biodegradability, excellent sustainability, abundance and renewable. Apart from that, the manufacturing of natural fibrous sound absorbers involves a significantly lower carbon footprint compared to conventional synthetic sound absorbers [11]. It should be noted that mineral wool is defined as a natural fiber in the literature [12,13]. However, the natural fibers involved in this review are mainly composed of animal and vegetable fibers.
The specific objective of this paper is to review the existing and newly emerging natural fibers for sound absorption use. This paper first gives a brief introduction of the shortcomings of synthetic fibrous sound absorbers. The sound absorption mechanism along with several empirical and semi- phenomenological models are presented in Section 2. Section 3 is concerned with the characterization methods on sound absorption properties of sound absorbers. Different types of natural fibers are summarized and divided into three main groups, which are raw material, fiber assembly and composites are described in Section 4, followed by a brief conclusion.
2. Sound Absorption Mechanism
As a typical porous material, fibrous sound absorber contains diverse channels and cavities which allow the sound waves to penetrate the structure. Energy loss of the sound in sound absorption of fibrous materials caused by viscous effects and thermal transfer is the primary mechanism [14]. These losses occur when sound propagates in the interconnected pores of a fibrous absorber. The viscous losses happen where a thin layer of air adjacent to the wall of a pore which is within the surface of fibers. The sound dissipates with friction between the pore walls due to the viscosity of air. Sound energy losses due to thermal conduction between the air and the absorber has some impact on sound absorption. This usually is more important at low frequency. Vibrations of the material also contribute to the sound energy losses, but they are often less important than the absorption as sound propagates through the interconnected pores.
In the Zwikker and Kosten theory [15], the surface characteristic impedance of rigidly backed porous material is determined by the characteristic impedance, the complex wavenumber and the material thickness:
where is the surface characteristic impedance, is the characteristic impedance, is the complex wavenumber, and is the material thickness. Subsequently, the sound absorption coefficient can be derived from the surface characteristic impedance:
where is the sound absorption coefficient, R is the pressure reflection coefficient, is the air density at room temperature, is the sound speed in air media at room temperature, and is the angle of incident sound wave. When the sound wave is normal incidence the equals 0°, then the Equation (2) can be simplified as:
This equation is mainly applied for normal-incidence sound absorption coefficient prediction based on the existing impedance models.
2.1. Empirical Model
The empirical models are developed by regression methods based on a large number of experimental data from impedance and airflow resistivity measurements. In these models, only airflow resistivity and thickness are required to predict surface impedance and sound absorption. Some models applied for airflow resistivity prediction can be found in the literature [16,17]. Besides, in the case that airflow resistivity measurement is unavailable, one empirical model proposed by Voronina that only needs porosity to predict the characteristic impedance and the complex wavenumber can be used [18].
Delany and Bazley [19] carried out a large number of impedance measurements and obtained the relationships relating the airflow resistivity to the characteristic impedance and wavenumber. The advised accurate frequency range is .
where is the frequency, is the airflow resistivity, is the complex number, and is the angular frequency.
Miki [20] proposed modifications to the Delany–Bazley model in order to generate a more accurate model, valid for a broader frequency range. The characteristic impedance and wavenumber in Miki’s model are given by:
One model depending on porosity can be alternatively used to study materials’ acoustic properties [18]. In this model, the characteristic impedance and the complex wavenumber is given by:
where is the structural characteristic:
where is the open porosity, is the air dynamic viscosity, and is obtained from the following empirical expression:
It was stated that this model is valid if the following condition is met, , which means the lower frequency limit is:
2.2. Semi-Phenomenological Model
The semi-phenomenological models consider the frame of fibrous material as rigid. These models use four to eight non-acoustical parameters (e.g., porosity, tortuosity, airflow resistivity, viscous and thermal characteristic lengths) to calculate the dynamic density and dynamic bulk modulus. The characteristic impedance () and complex wavenumber () can be rapidly calculated by the following equations:
where is the equivalent dynamic density, and is the dynamic bulk modulus.
One of the most popular semi-phenomenological models is collectively called the Johnson–Champoux–Allard–Lafarge (JCAL) model [21,22,23]. In the JCAL model, the equivalent dynamic density incorporates with the viscous losses, and the equivalent dynamic bulk modulus with the thermal losses.
In the model, the equivalent dynamic density is described as:
where is the dynamic tortuosity,
where is the dynamic tortuosity, is the kinematic viscosity, is the static viscous permeability, and is the viscous characteristic length.
The dynamic bulk modulus is described as:
where is the specific heat ratio, is the static pressure, and is the thermal tortuosity,
where , where is the Prandtl number, is the static thermal permeability, and is the thermal characteristic length.
3. Acoustical Characterization
A variety of approaches can be used to characterize the acoustical properties of porous sound absorbers, e.g., impedance tube method, reverberation chamber method, two-microphone free field method and in situ method. The two most widely applied methods, impedance tube method and reverberation chamber method, are introduced in this section. The impedance tube method only requires small size specimens and measures various parameters. Another method can characterize the sound absorption coefficient for random incidence, but large size specimens are required.
3.1. Impedance Tube Method
The impedance tube enables measurements under well-defined and controlled conditions. In addition, this method is convenient and inexpensive because only small samples are required. For instance, the measurement of normal incidence absorption coefficient and surface impedance on Brüel & Kjær impedance tube Type 4206 (Brüel & Kjær, Nærum, Denmark) only needs two cylindrical samples, which are 100 and 29 mm in diameter [24].
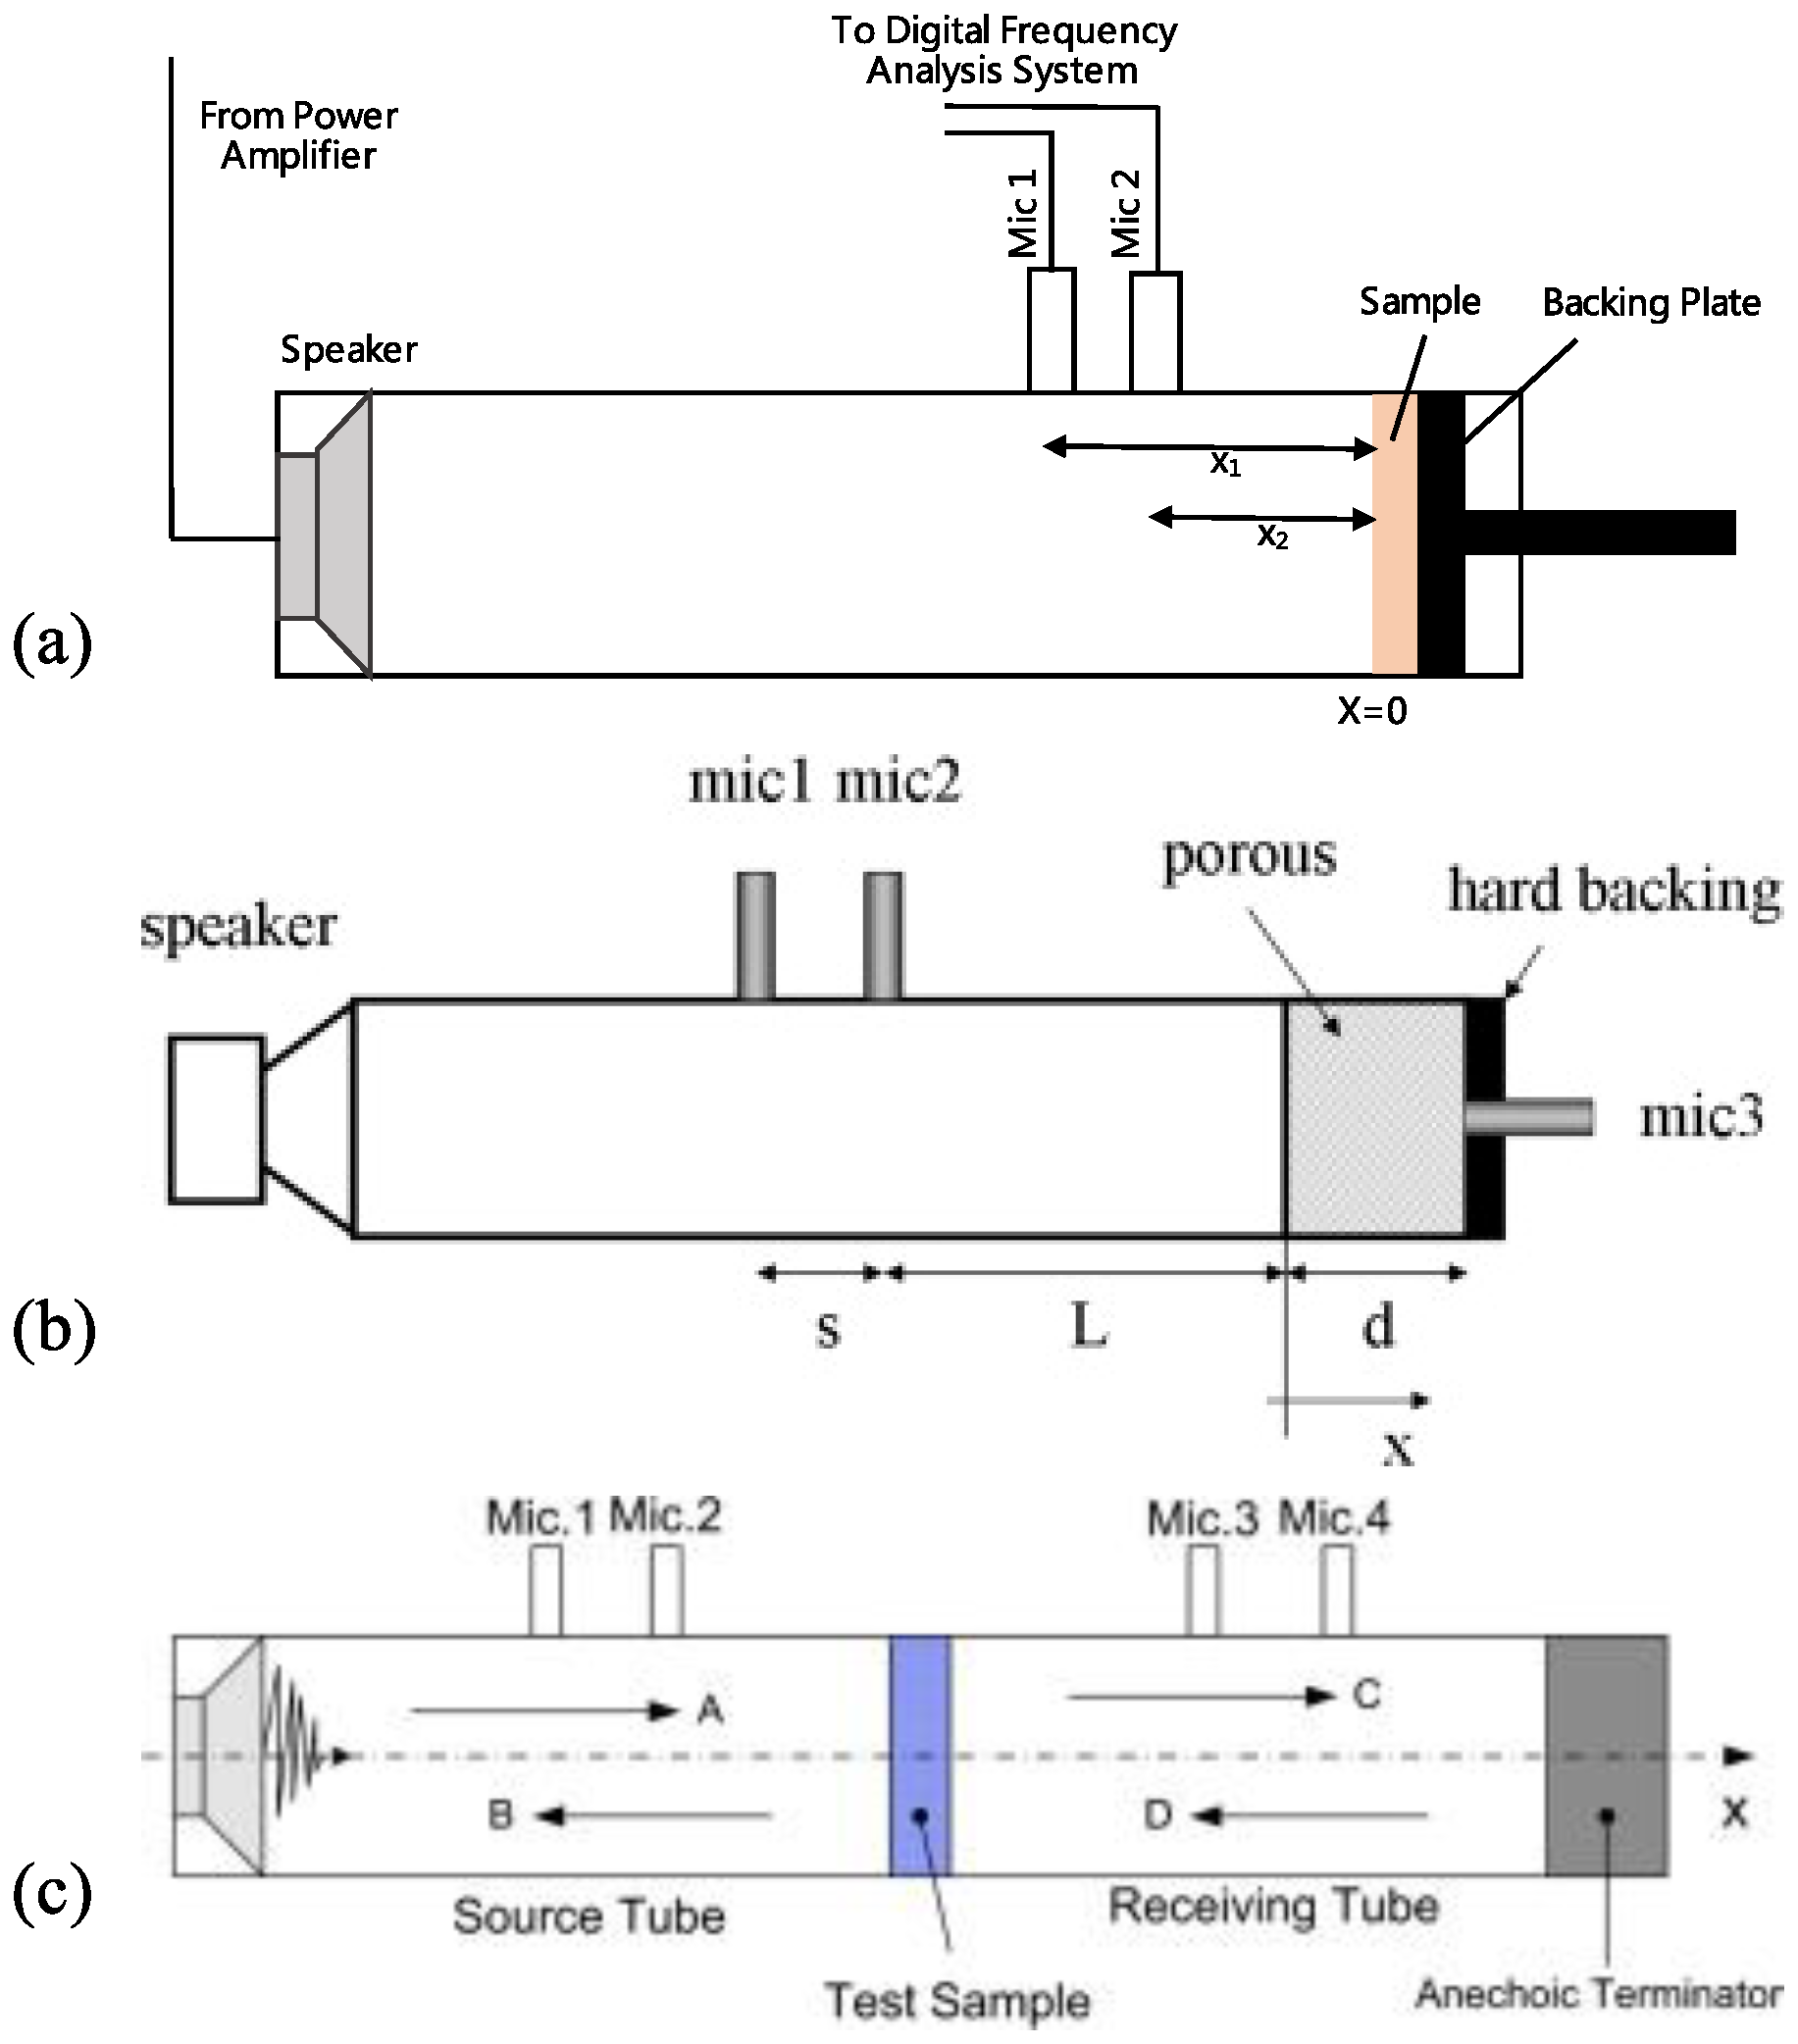
The impedance tube is conventionally classified according to the number of microphones, e.g., two-microphone impedance tube, three-microphone impedance tube and four-microphone impedance tube. The experimental setups of these three impedance tubes are illustrated in Figure 1.
During the test in a two-microphone impedance tube, a sound source is mounted at one end of the impedance tube and a specimen is placed at the other end. The speaker generates broadband excitation signals (e.g., swept sine). These incident sound signals propagate as plane waves in the tube and hit the sample surface. The reflected wave signals are acquired and compared to the incident sound wave. As shown in Figure 1b, the third microphone of the three-microphone impedance tube is inserted in the piston and exposed to maximum pressure for a better signal to noise ratio [26,28]. Like the two-microphone impedance tube, a specimen is backed on the rigid termination in the three-microphone tube. In the four-microphone impedance tube, two microphones are located on both sides of a specimen and the tube ends with an anechoic termination. Because any reflected sound from the termination will pass back the specimen and be measured by microphones 1 and 2, thus, the assurance of measurement is critically decided by the quality of the anechoic termination [29,30].
The impedance tube with different numbers of microphones has various functions. The measured parameters of impedance tubes are listed in Table 1. The two-microphone tube can be used to measure the sound absorption coefficient, reflection coefficient and surface impedance. While the other two types of tubes can measure more parameters, e.g., transmission loss, dynamic density and dynamic bulk modulus. Measurements carried out on the two-microphone tube can be conducted by the standing wave ratio method and transfer function method. The standing wave ratio method is relatively time-consuming and tedious since it only measures one frequency at a time and the phase information is needed to locate minima in the standing wave. By comparison with the standing wave ratio method, transfer function method is more popularly used in impedance tube measurement. Salissou et al. [31] stated that one-load method can be adopted on the three-microphone tube when the specimens are geometrically symmetrical. The two-load method used in the four-microphone tube is a robust technique that can cover a variety of samples. It should be noted that the impedance tube is able to recover non-acoustical parameters of porous materials (e.g., tortuosity, viscous and thermal characteristic lengths) with the help of least square or Bayesian approaches [32,33]. In our recent study, several non-acoustical parameters of fibrous polyester panels were referred via the Bayesian reconstruction procedure and their homogeneity was assessed by comparing the referred porosity, tortuosity, viscous characteristic length, thermal characteristic length, airflow resistivity and thermal permeability obtained from two orientations [34].
3.2. Reverberation Chamber Method
The impedance tube is frequently adopted to validate the accuracy of prediction models for porous materials [25]. However, the impedance tube only gives the acoustical properties under the situation of samples facing normal incidence sound waves. Thus, a more practical method that can characterize the random incidence absorption coefficient is needed for absorption performance specifications in interior design. The technique of reverberation chamber measurement can be simply described as, by comparing the reverberation time of a specialist room before and after a tested absorber, the random incidence absorption coefficient can be calculated [4]. However, the reverberation time may exhibit erratic values due to the irregularly distributed sound absorption on the surfaces [39]. One method presented by Benedetto and Spagnolo [39] can be used to correct this problem:
where is the random-incidence absorption coefficient, is the is the angle of incident sound wave, and is the sound absorption coefficient at angle given by:
where is the air density at room temperature, is the sound speed in air media at room temperature, and is the surface characteristic impedance:
where is the normal-incidence absorption coefficient evaluated in the impedance tube.
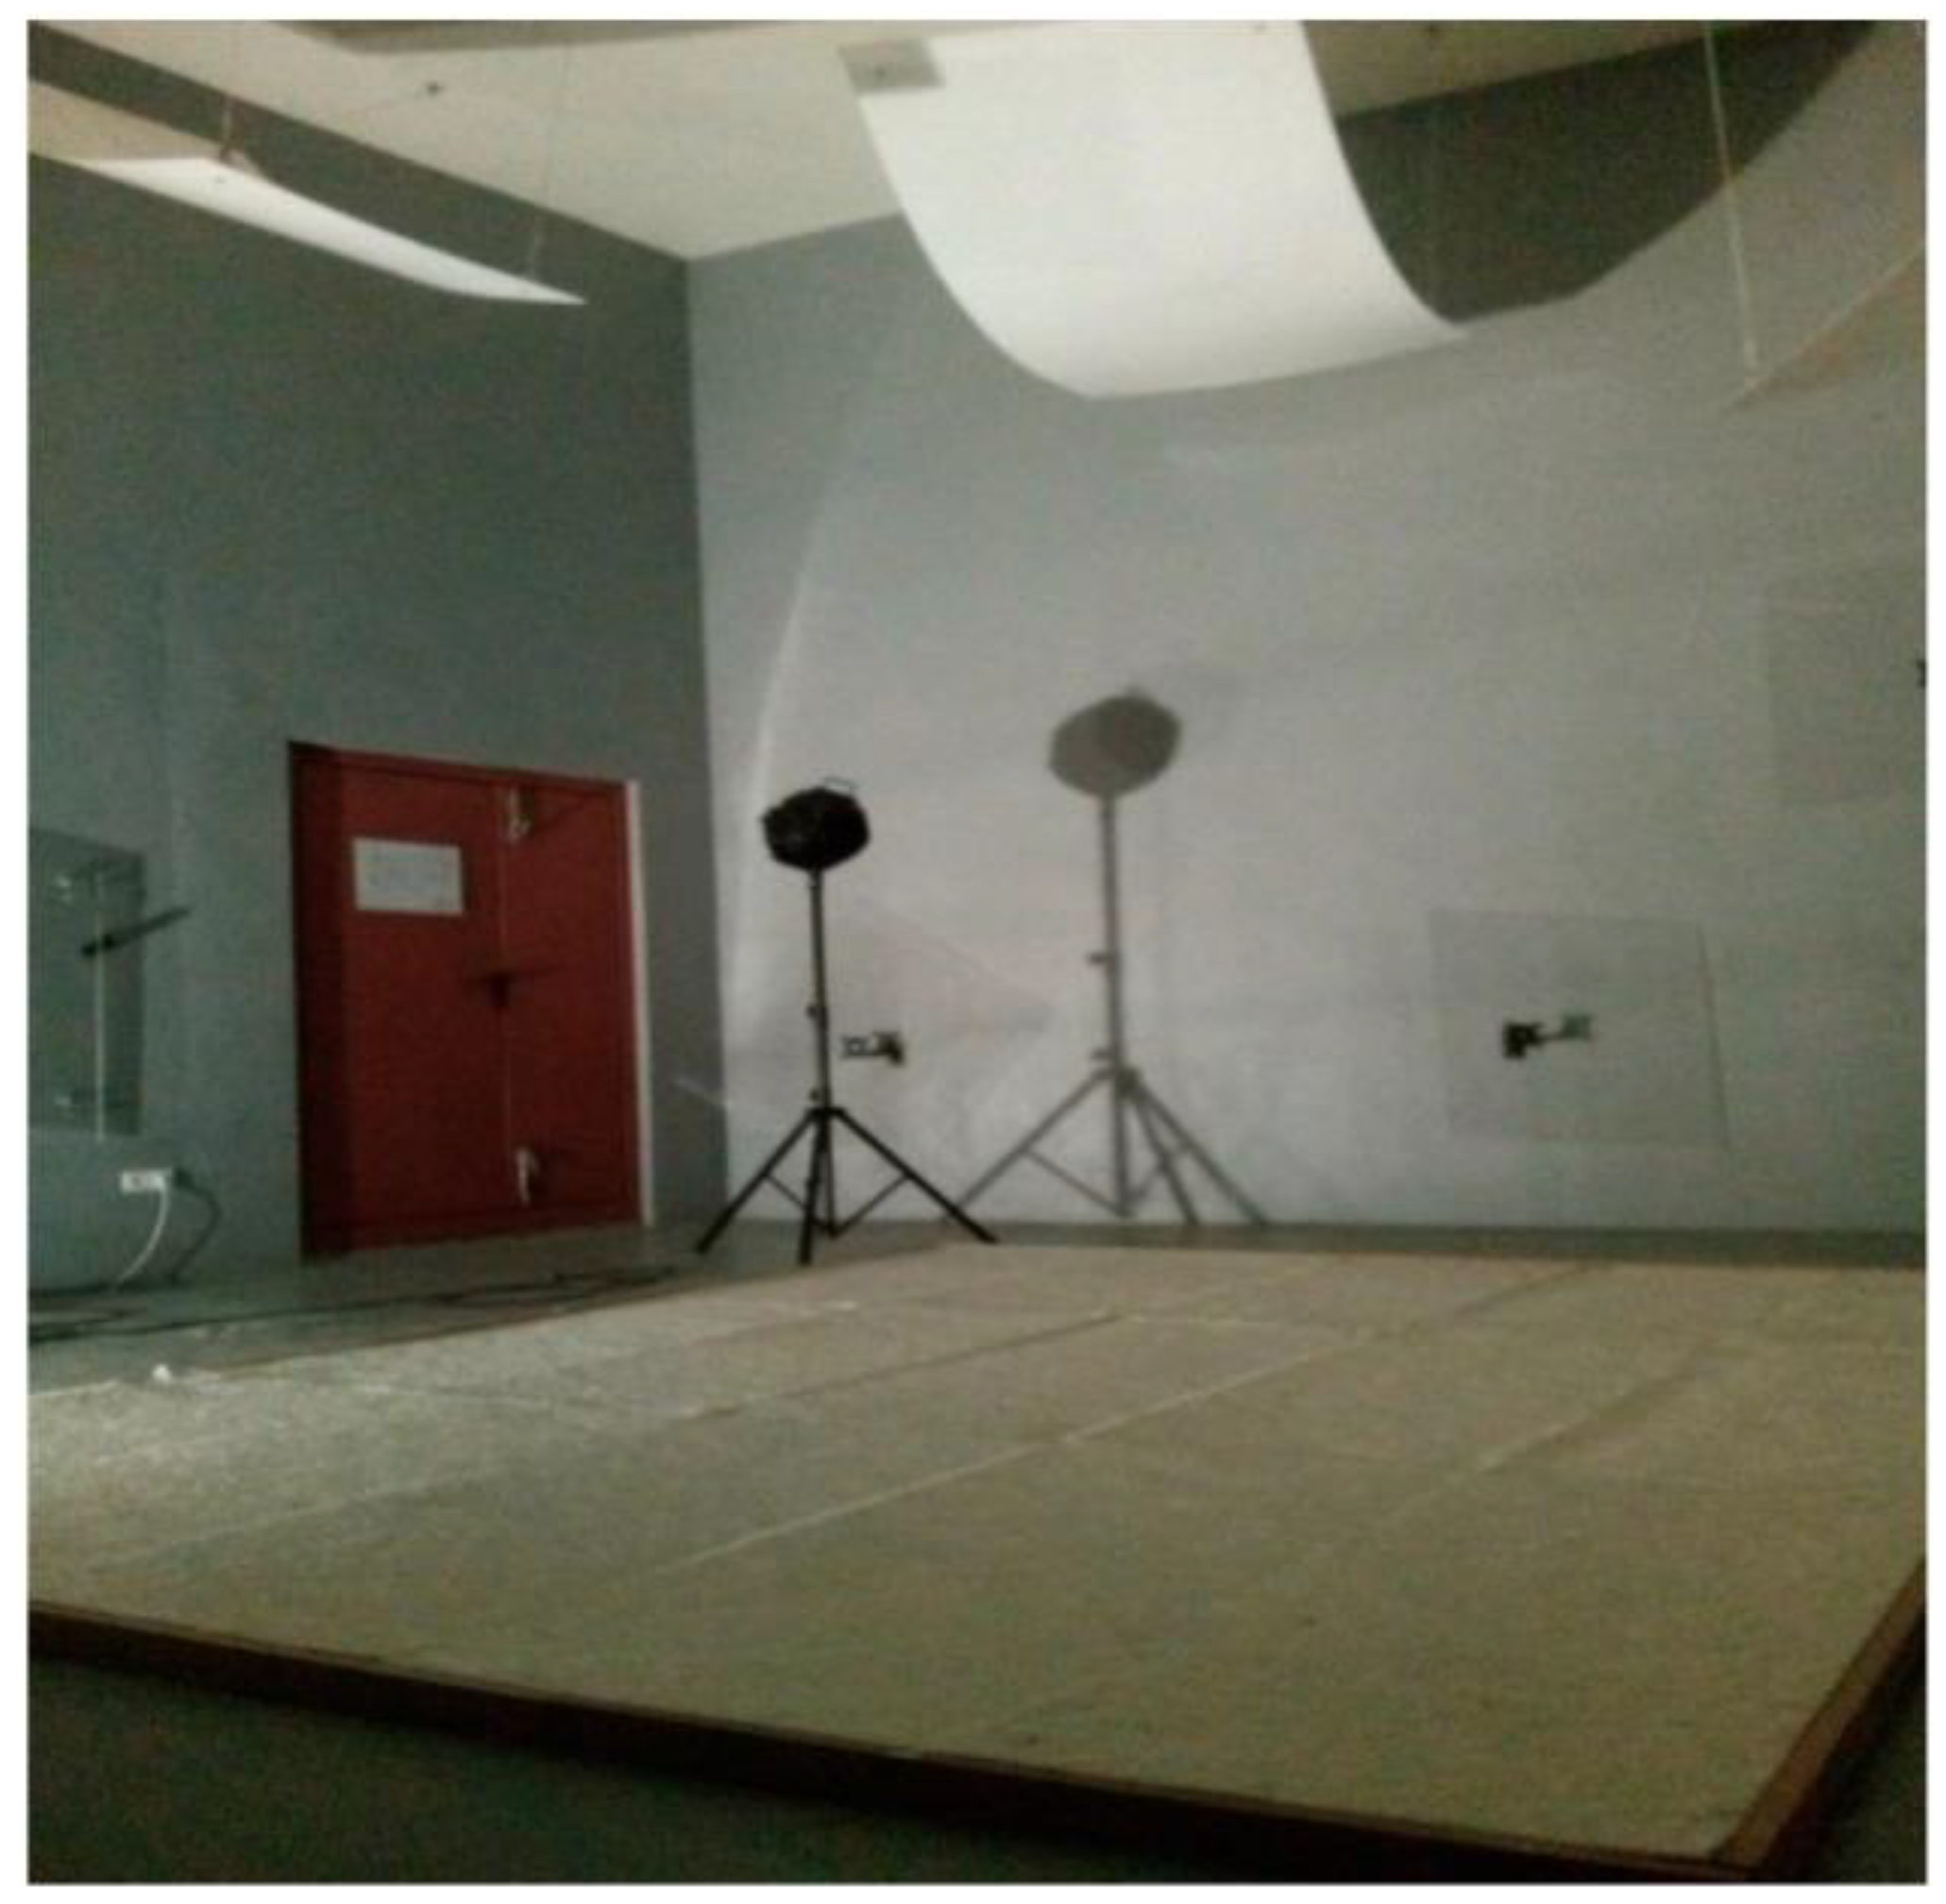
Since the air temperature and humidity have effects on properties of sound in air, the sound speed in air and sound absorption of air should be strictly followed based on the standards of EN 20354 or ASTM C423-17 [40,41]. Although the reverberation chamber gives such practical measurement, it has several disadvantages, such as large samples being required (e.g., >10 m2) in a full-scale chamber, and only the absorption coefficient being measured, which is expensive and inefficient [42]. Figure 2 demonstrates an example of the reverberation test on a sample with a size of 10.8 m2 at the EPS Gandia at the Universitat Politécnica de València [43]. Thus, the impedance tube measurement is usually taken to understand the acoustical properties of sound absorbers before undertaking a reverberation test. Several investigations on small-scale reverberation chamber methods have been recently emerged [44,45]. This method is able to overcome the main limitations of impedance tube and full-scale reverberation chamber methods. A small size sample (e.g., <0.5 m2) can be characterized in small-scale reverberation chamber. The main disadvantage of this method is that its reliability is relatively poor at the low frequencies due to the edge effect. The recommended sample size and measured frequency range for porous materials and thin rigid materials have been proposed by Shtrepi and Prato [44]. However, more detailed benchmarks are essential in prior to applying the small-scale reverberation chamber method for acoustic characterization on various sound absorbers.
Because of the impedance tube and the fact that reverberation methods measure the sound absorption under different incidence sound waves, the absorption can be exaggerated due to diffraction effects during reverberation chamber test. Hence, the sound absorption coefficient measured via reverberation chamber is usually higher than that from impedance tube. The comparison between the sound absorption from these two methods was presented in a conference [46]. It was shown that the results determined in the reverberation chamber are higher than that in the impedance tube in the entire frequency range, and the difference is most obvious in the low-frequency range.
In spite of impedance tube measurement and reverberation chamber methods are widely used for acoustic characterization. The reproducibility concerns are crucial for these two methods [47,48]. For example, the impedance tube measurements carried out in different laboratories can exhibit various results with more than 20% dispersion [47]. Therefore, the corresponding standards should be more precise on sample preparation, sample mounting condition, signal processing method, etc.
4. Natural Fiber Sound Absorber
Natural fiber has played an important role in the history of human evolution since approximately 7000 BC [49]. Nearly all natural fibers can be used to absorb unwanted sound. The natural fiber sound absorber is in forms of raw material, fiber assembly and composite. The different forms of natural fiber absorber will be introduced individually in this section. Besides, the numerical comparison between natural fiber sound absorbers and glass fiber absorber will be presented.
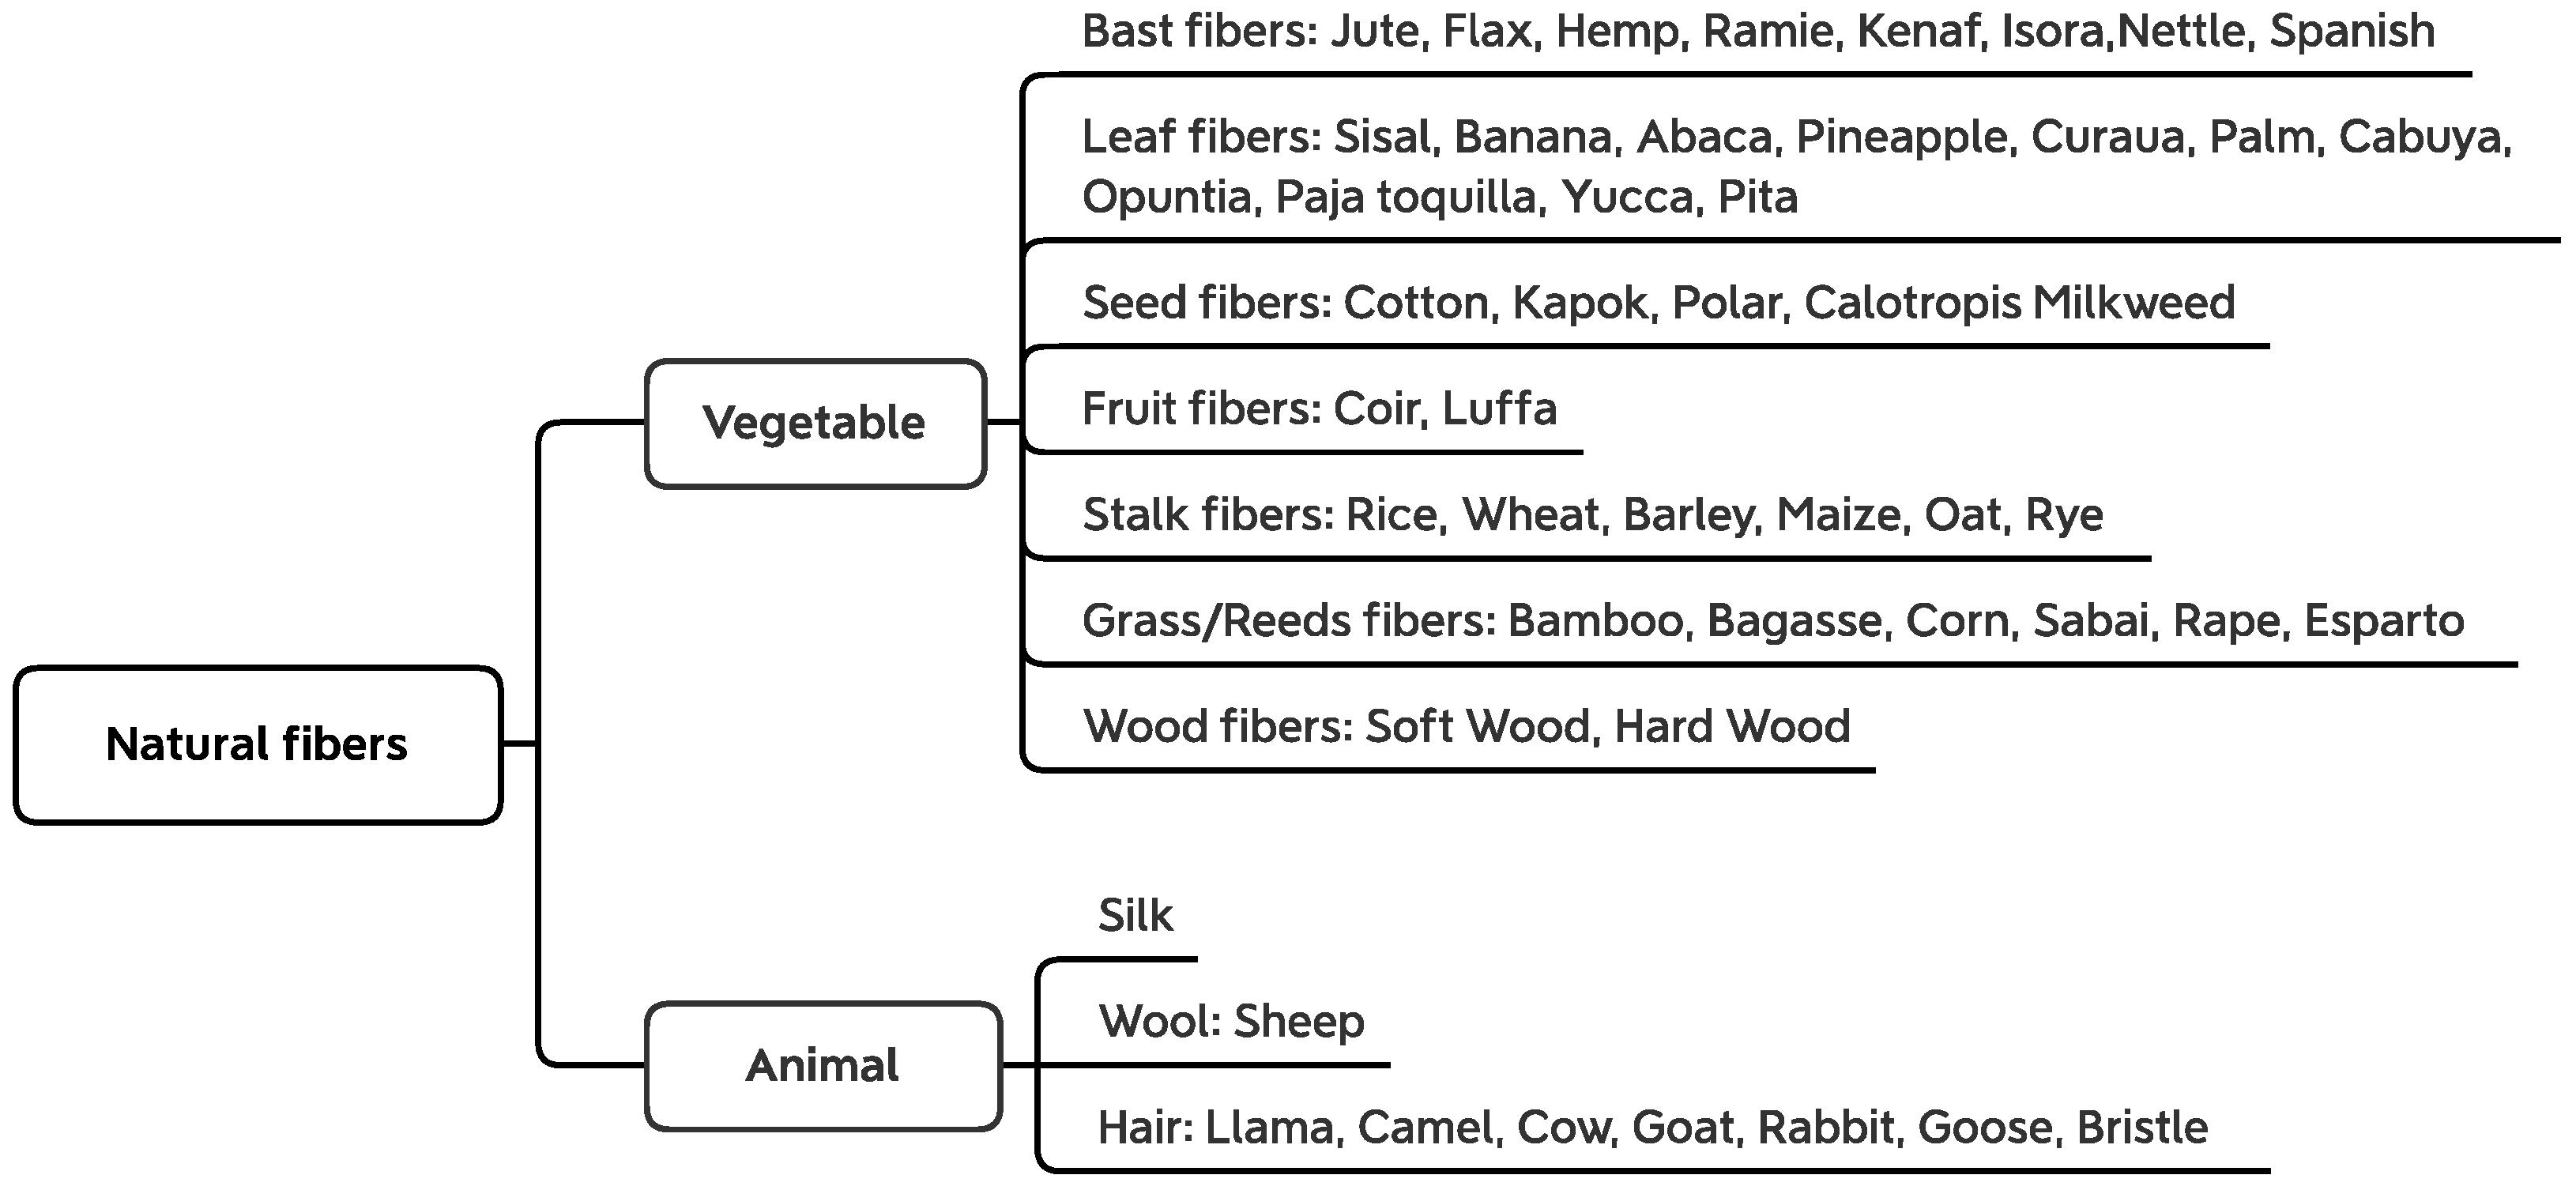
As stated above, mineral fibers were excluded in this review. Figure 3 illustrates the classification of natural fiber that is mainly composed of vegetable and animal fibers. A comprehensive search was conducted through electronic databases, including Google Scholar, ScienceDirect, Scopus, Springer Link and Taylor & Francis Online. First, articles related to sound absorption and acoustic properties of natural fibers were searched by using the following terms: “sound absorption of XX fiber” and “acoustic properties of XX fiber”. The “XX” represents each fiber listed in Figure 3. Second, general terms “sound absorption of sustainable material (or natural fibers)” and “acoustic properties of sustainable material (or natural fibers)” were used to do a supplementary search. Additionally, some articles were found based on cross-references. Articles regarding the sound absorption properties of natural fibers were included if they met the following criteria: (a) published or in press in a peer reviewed or scientific journal in English; (b) published between January 2000 and June 2020; (c) the sample preparation is described in details; (d) the samples composed of at least 50 wt.% natural material; (e) the curves of sound absorption coefficient were clear and identifiable. We did not specify the exclusion criteria for this review.
4.1. Raw Natural Fiber Sound Absorber
Many steps of pretreatment are needed to prepare final commercially used natural fiber sound absorbers, such as fiber bundle extraction, alkaline treatment and fabrication of panel or nonwoven fabric. It is possible to use natural fiber as a sound absorber under unprocessed or less processed conditions. Some researches related to the acoustical properties of raw natural sound absorbers are listed in Table 2.
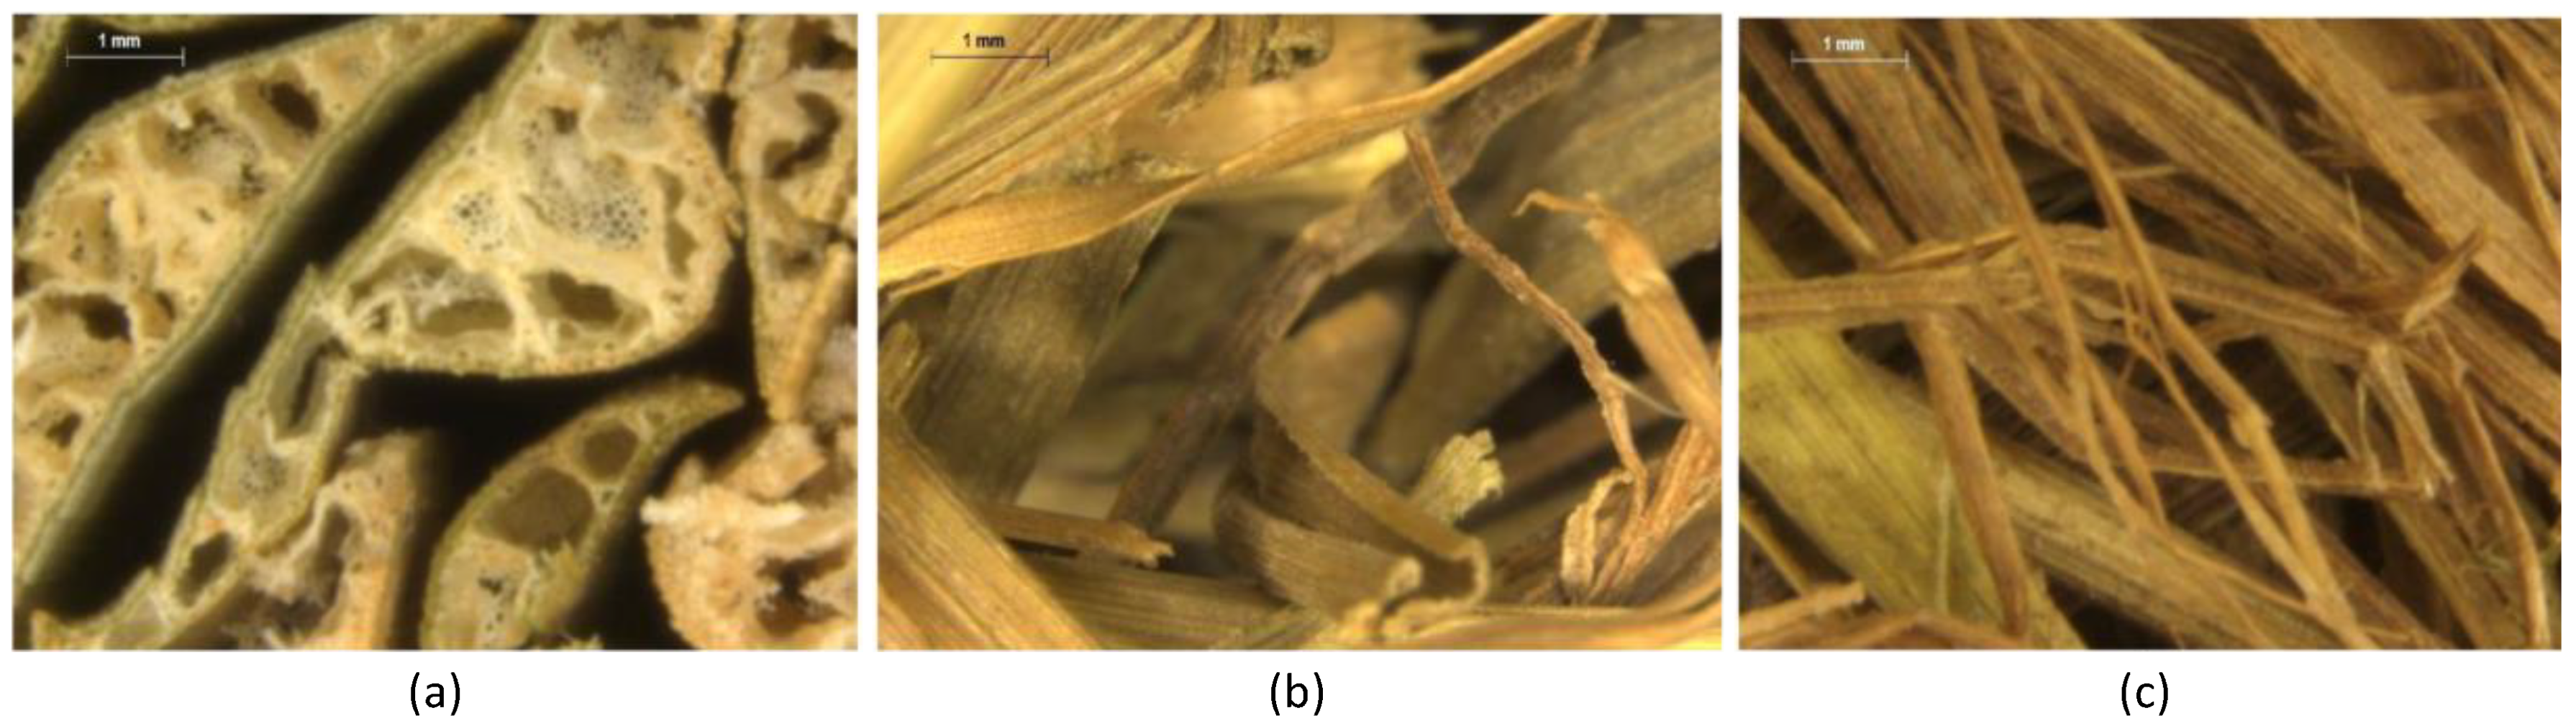
Due to the parallele-piped shape, the hemp particles are mixed in a plurality of ways and then the material porosity and pore size distribution are strongly affected. Glé et al. [51,52] studied the effect of particle shape and size distribution on acoustic properties of hemp particles. The characteristic dimension of the hemp particles and the configuration of the particles in a tube are shown in Figure 4. Hemp particles with a size distribution show better sound absorption at low frequency than single-sized spherical aggregates. Esparto grass is a gramineous plant and grows in the Western Mediterranean and northern areas of North African countries [53]. Research comparing three different types of raw esparto grass from Pakistan, Tunisia and Egypt were investigated (see Figure 5). The calculated coefficients combined with Delany-Bazley formula can accurately predict the sound absorption coefficient of the esparto grass fiber at the frequencies higher than 400 Hz. The sound absorption properties of esparto grass are comparable to traditional glass fiber materials with equivalent thickness.
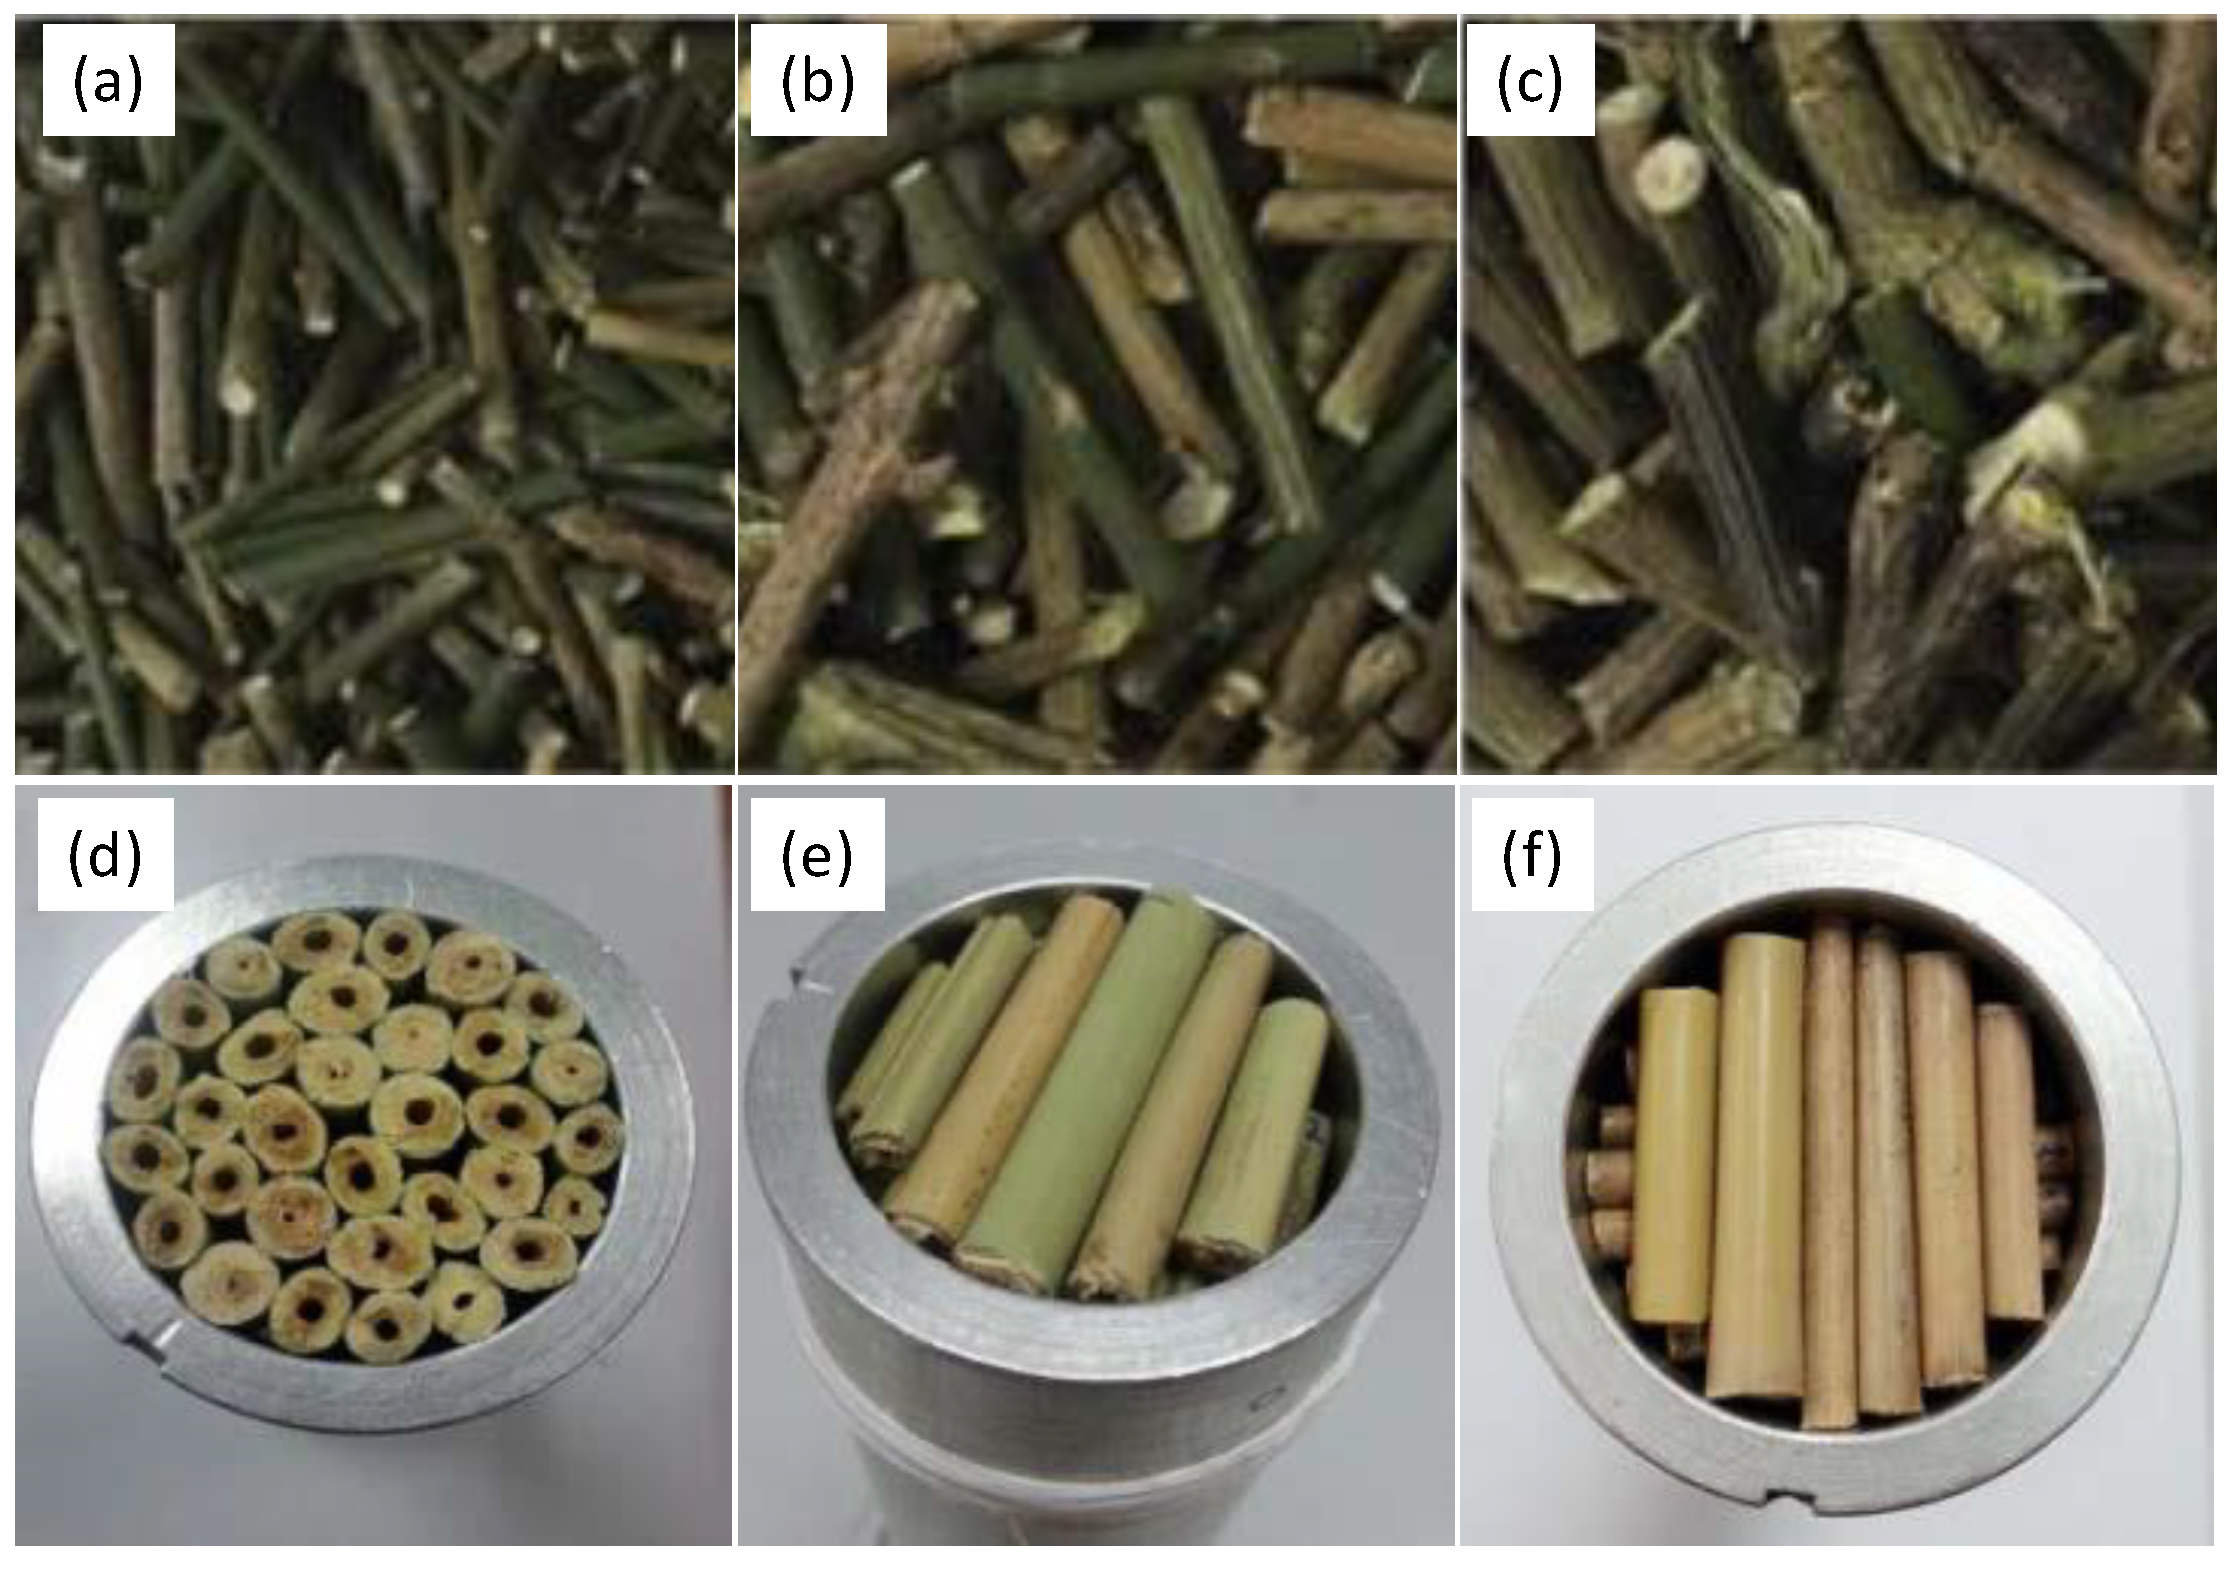
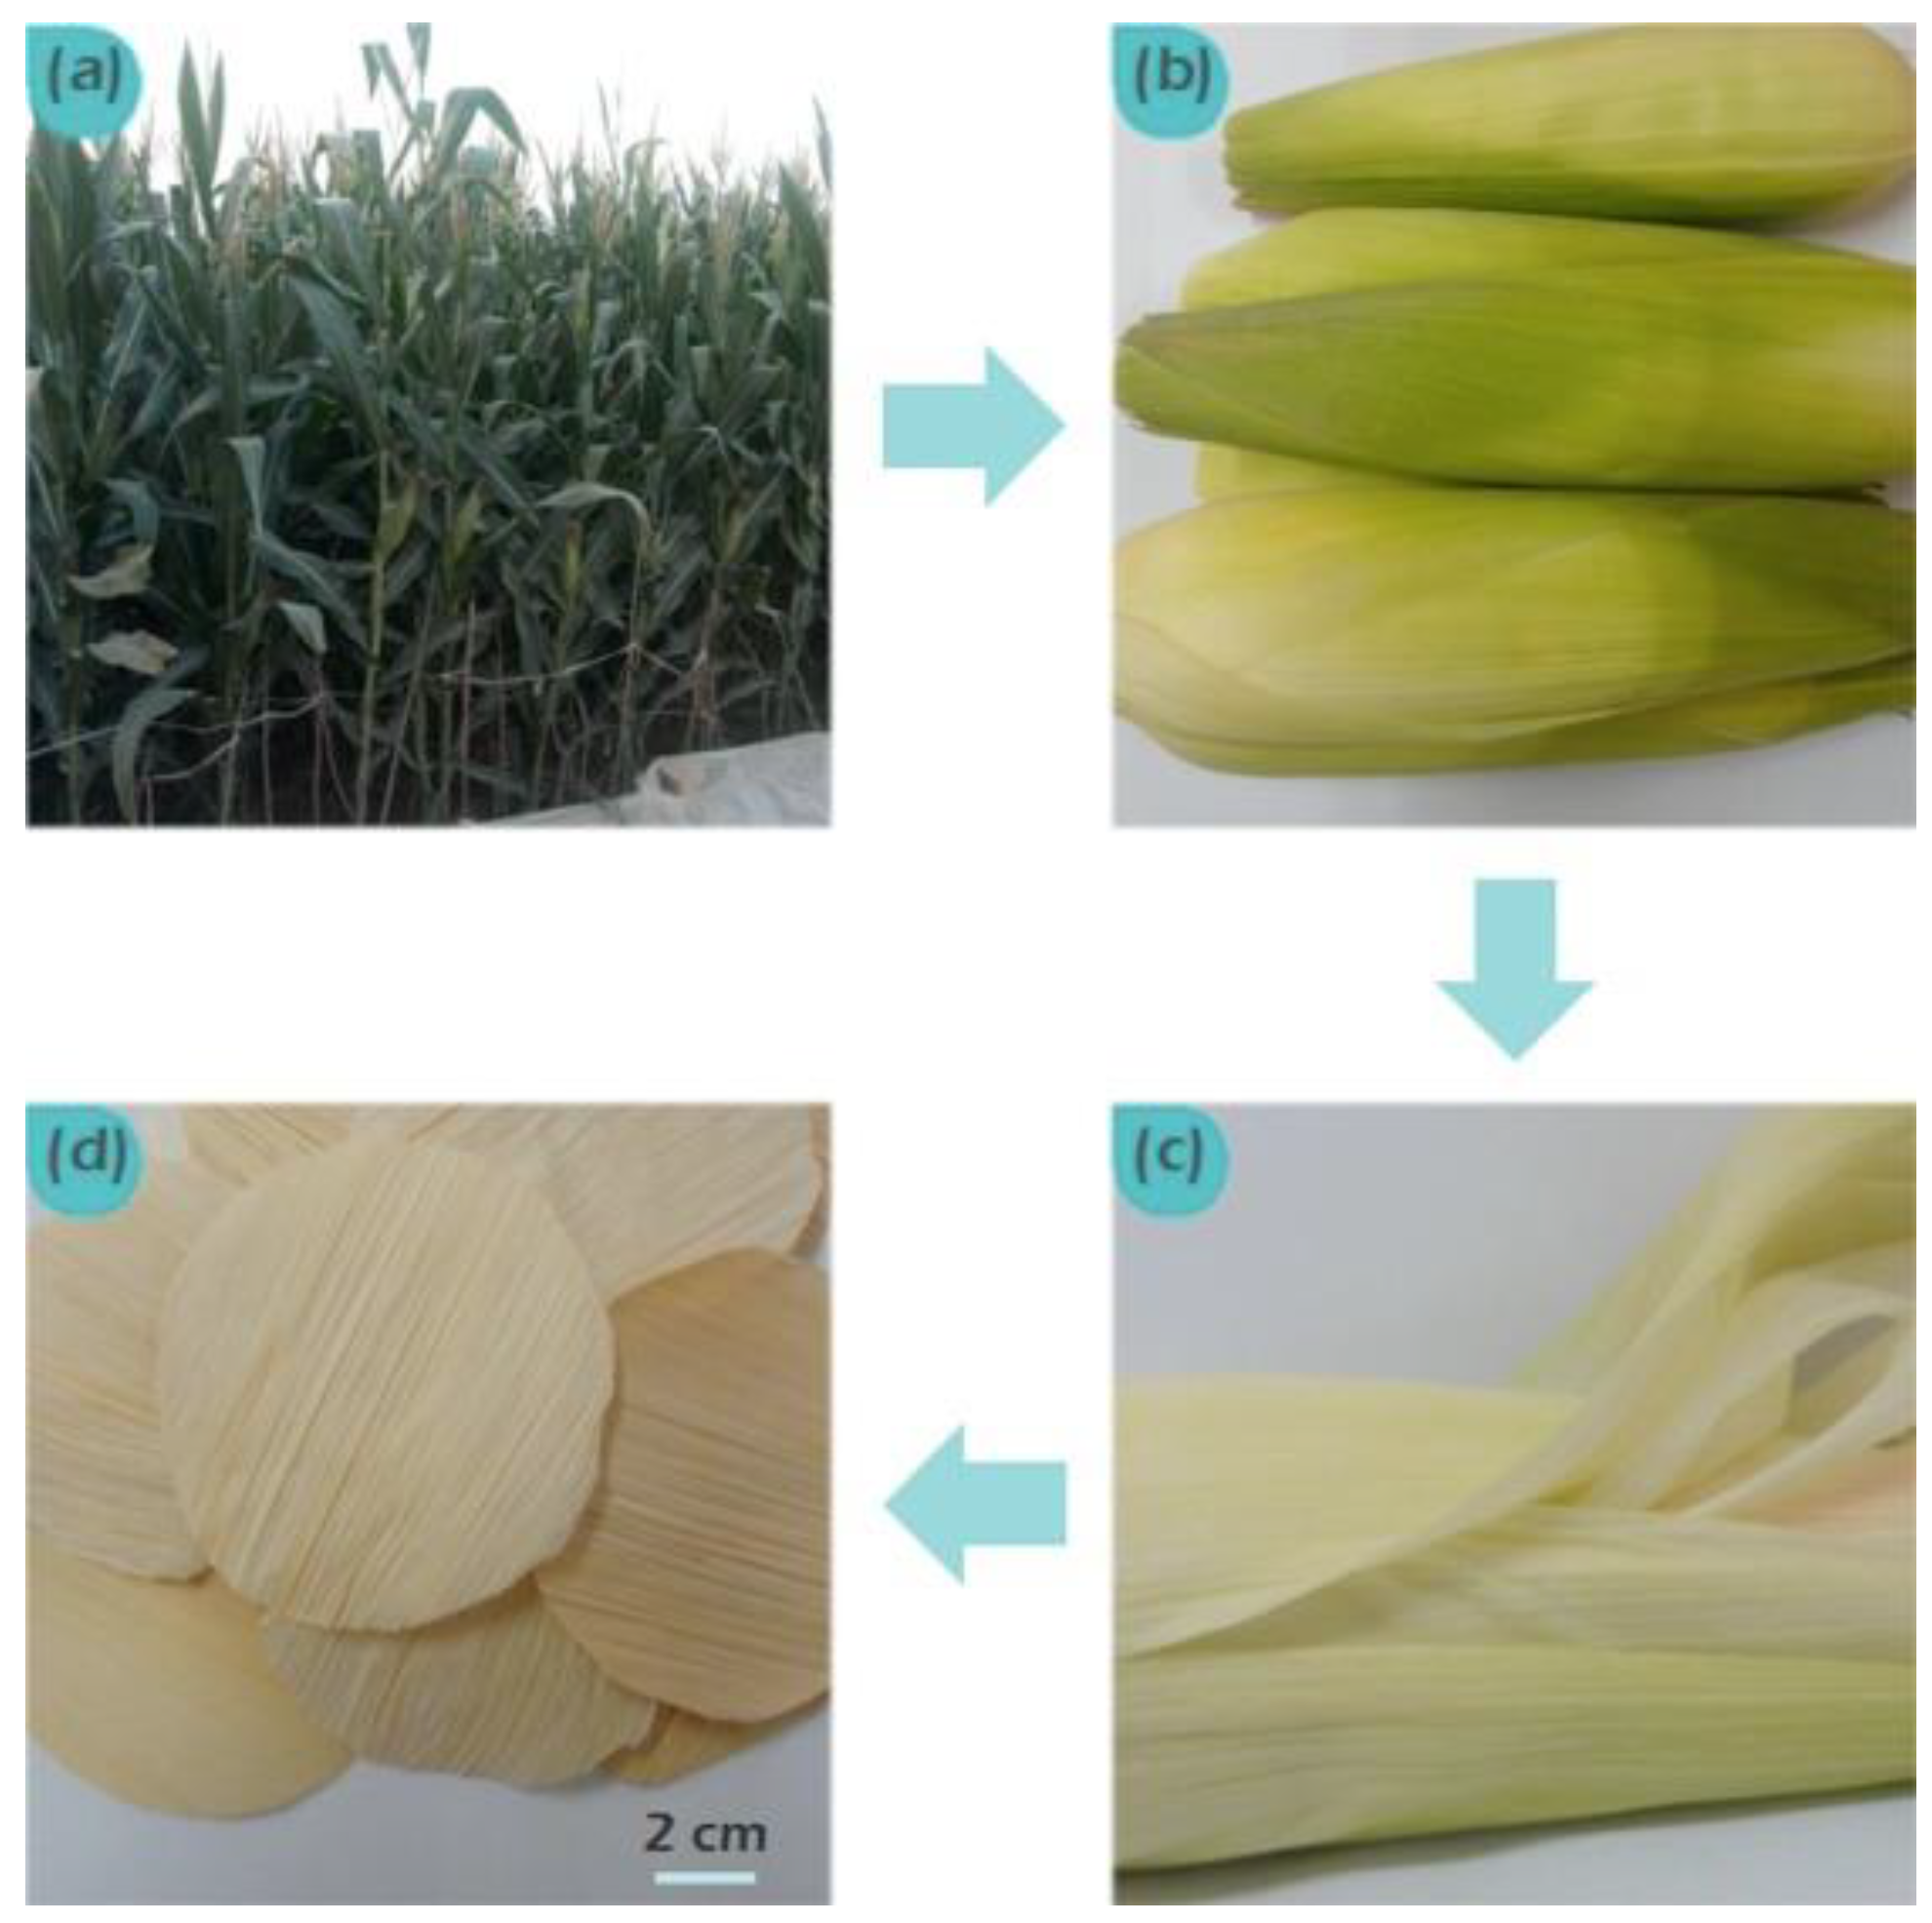
The brooms, belonging to the Fabaceae family, are perennial woody shrubs with a height ranging from 0.5 m to 5 m [54]. The sound absorption properties of broom fiber were studied using impedance tube and artificial neural networks. The sound absorption behavior of the broom fiber is a typical granular material. Bamboo has similar shape with brooms, but the bamboo has hollow structure (see in Figure 6). Transverse arranged bamboo showed better sound absorption then axial arranged samples [55]. However, the sound absorption properties of bamboo samples in transverse and cross transverse arrangements are indistinguishable. Corn husk theoretically has better sound absorption properties than bark cloth because of corn husk’s special groove structure [56]. The general procedure to prepare the corn husk samples is illustrated in Figure 7. Corn husk is a potential candidate for noise reduction since corn husk has thinner thickness and lighter weight but comparable sound absorption properties. Tea is the second most consumed drink in the world. The acoustic properties of wasted tea residues were characterized under a two-microphone impedance tube [57]. It was an interesting attempt, although the results of tea residues facing a wire mesh did not show a good sound absorption. However, the tea residues can be recycled as filling materials of sound absorbers.
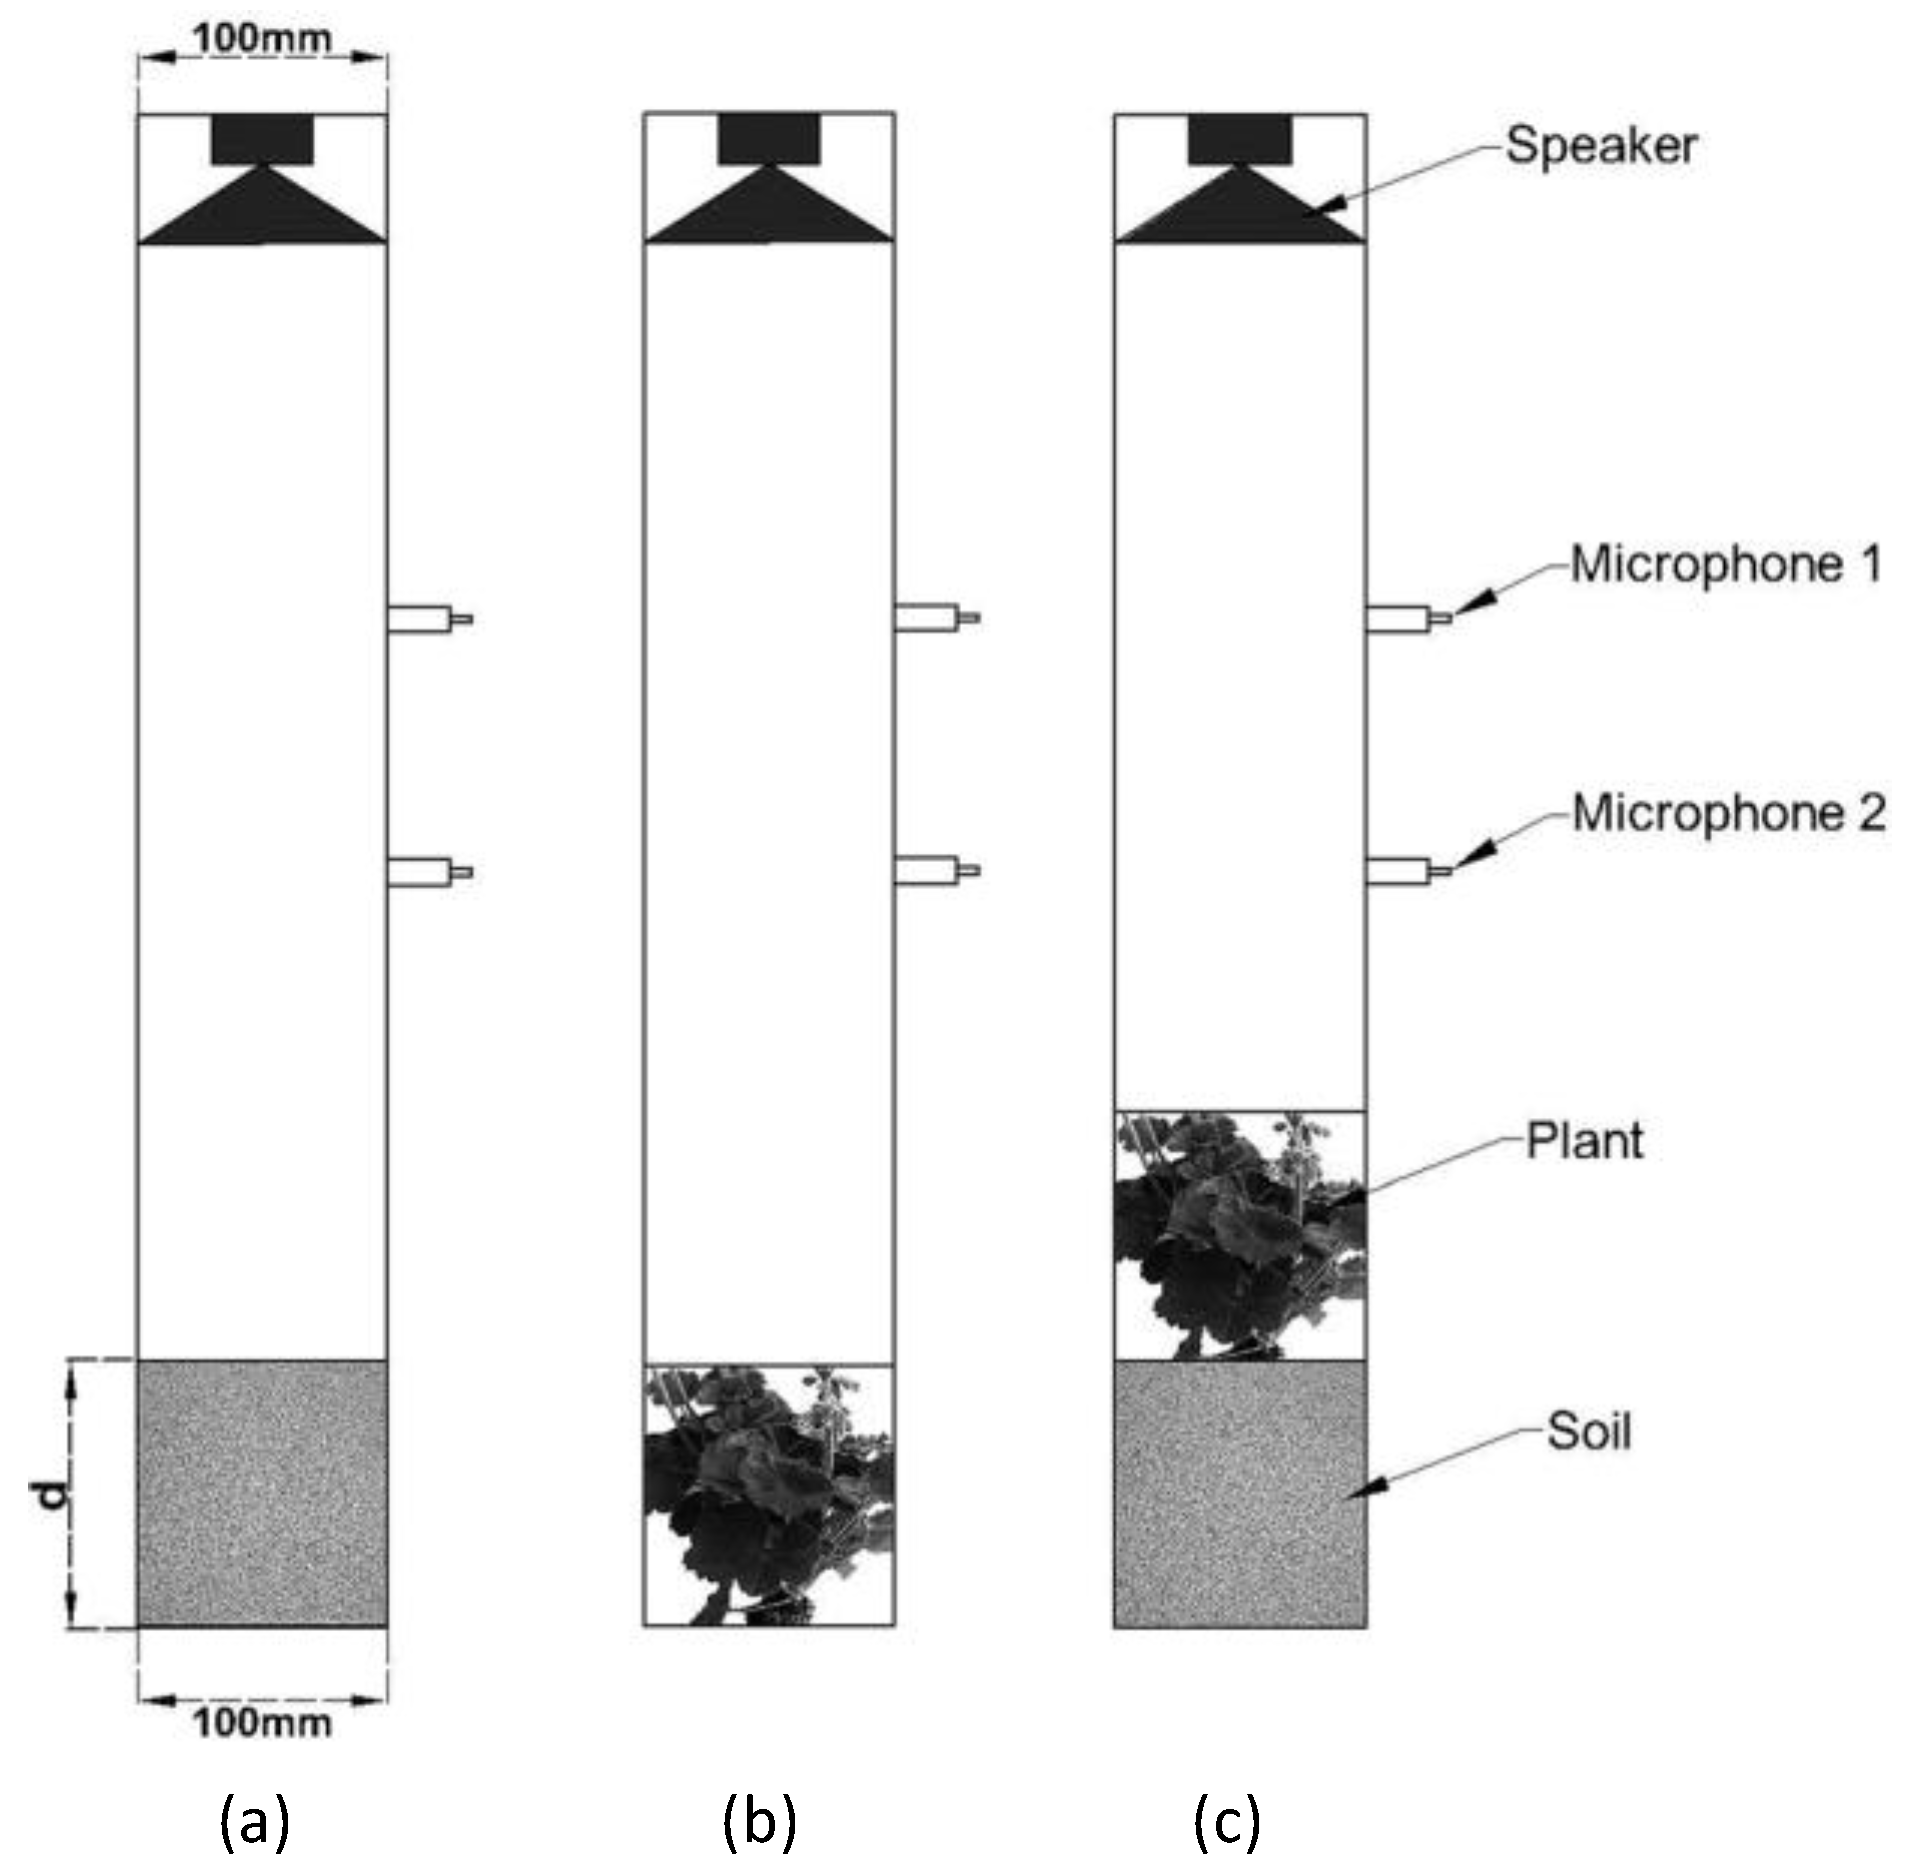
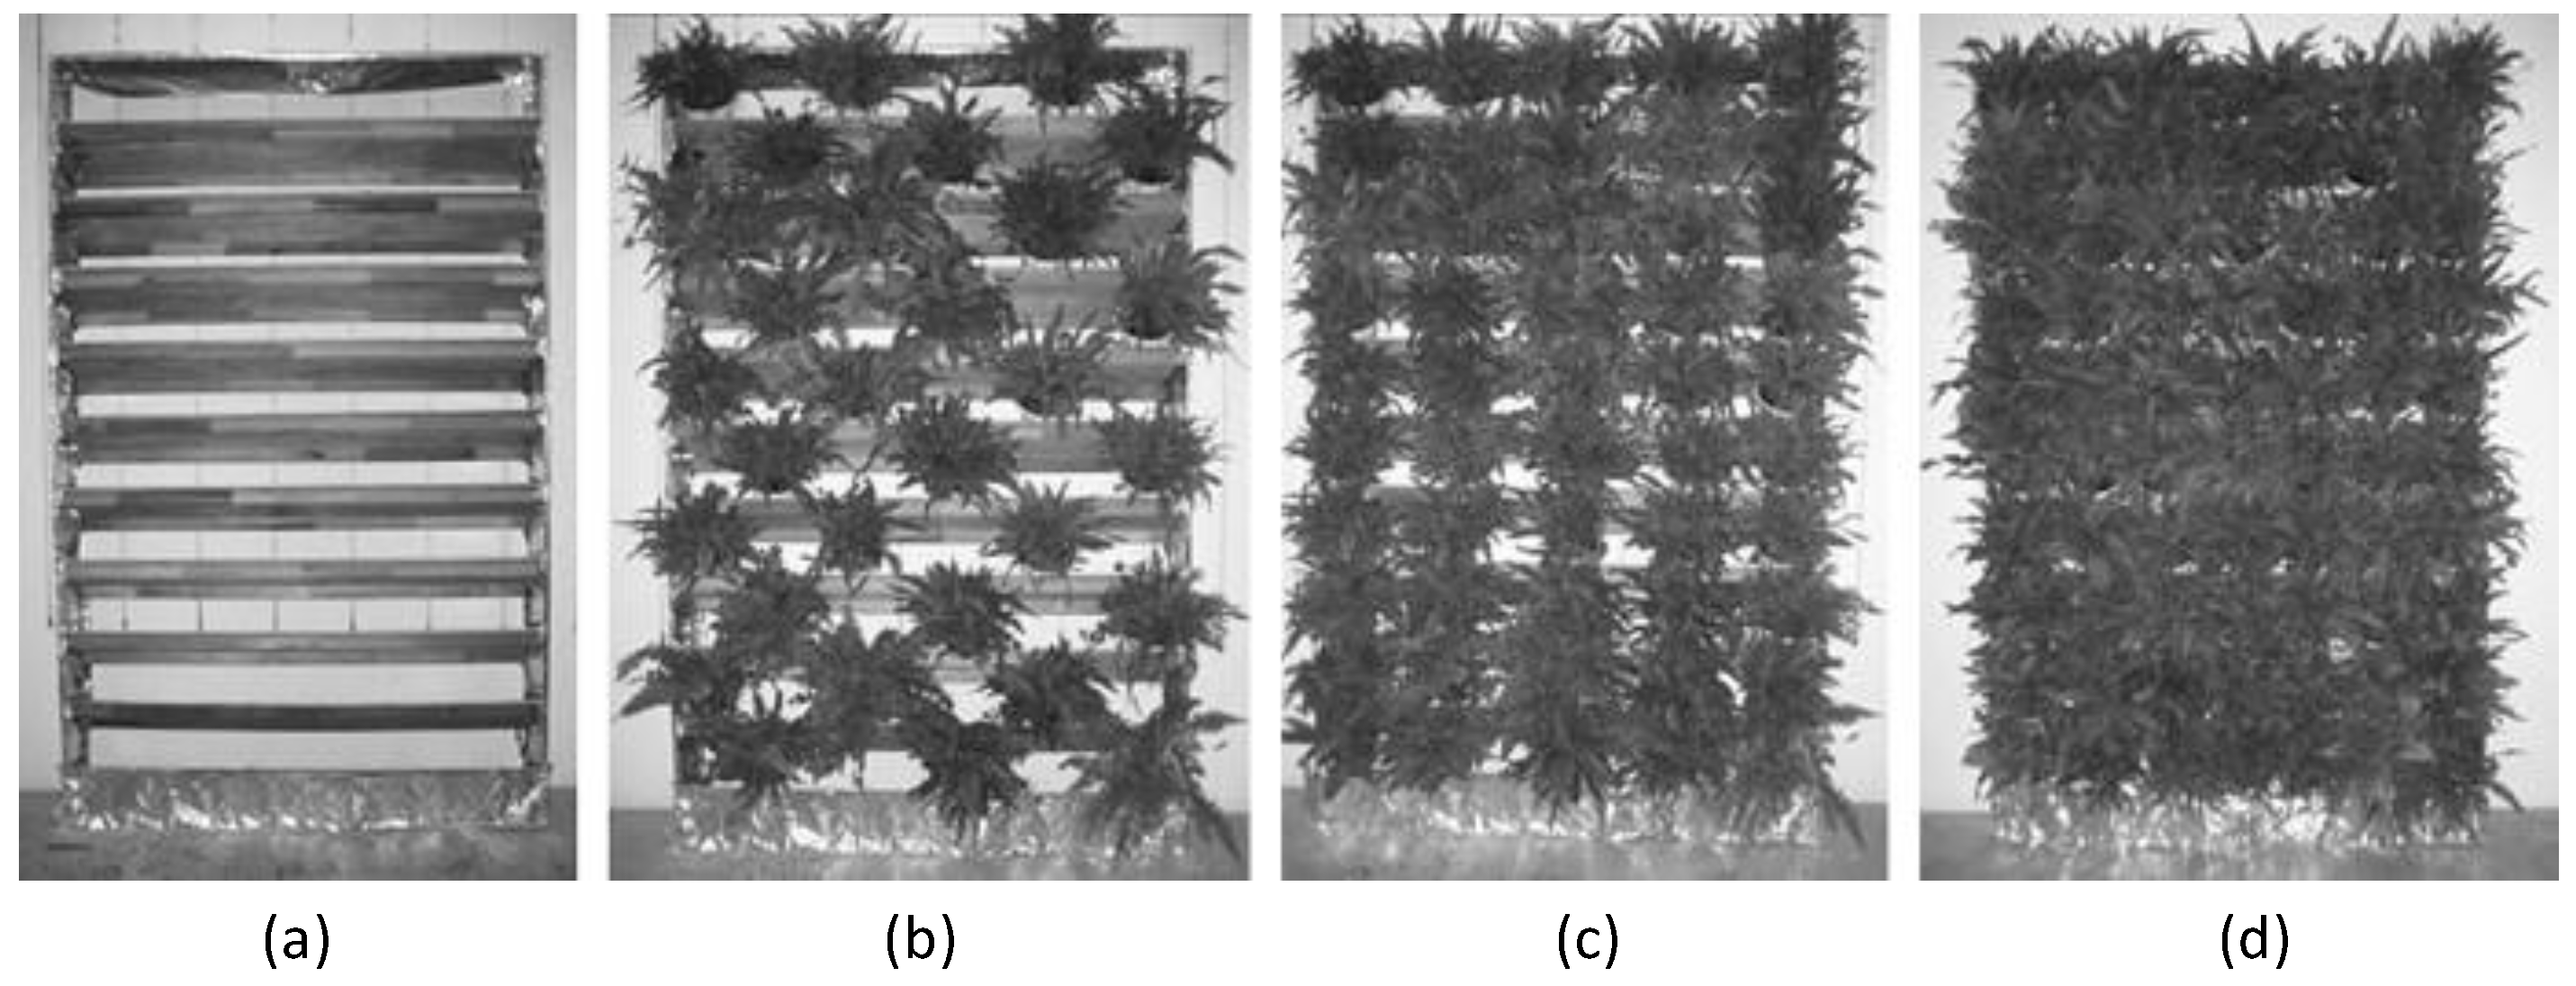
Except the above “harvested” natural materials, the growing plants are potential natural sound absorbers [59,60,61]. Horoshenkov et al. [59] adopted a 100 mm diameter impedance tube to carry out the measurements of acoustical properties of five types of plant species with and without soil (see Figure 8). Their results showed that the sound absorption coefficient of plants is mainly determined by the leaf area density and angle of leaf orientation. A typical application of growing plants for sound absorption purposes is the vertical greenery systems [60]. The sound absorption of vertical greenery systems with empty, 43%, 71% and 100% greenery coverage densities was tested in a reverberation chamber (National University of Singapore, Singapore). The greenery system with different coverage densities is shown in Figure 9. By comparing other building materials and furnishings, the vertical greenery system has one of the highest random incidence sound absorption values.
There are plenty of advantages to directly use raw natural fiber materials as sound absorbers. There is very less or even no pretreatment and modification on fibers in the whole manufacturing process. Before applying to the practical application, they just need to be harvested, air-dried and cut to the required size. The growing plant can be directly used as a sound absorber, such as the vertical greenery system. Consequently, the preparation of raw natural fiber sound absorbers consumed less energy, involved low carbon footprint and was more environmentally friendly compared with well-processed fibrous sound absorbers. In addition, there is more possibility of acoustical properties due to the diversity of the raw natural fiber materials in nature. On the other hand, their acoustical properties do not remain stable all the time as a result of diversity and inhomogeneity. Consequently, it is not easy to precisely predict their acoustical performance for sound absorption at specific frequencies. Additionally, the health risk exists, since the raw natural fiber materials may contain dust, dirt and impurities, etc. Thus, the health risk of raw natural fiber materials should be comprehensively evaluated before mounting in the living environment.
4.2. Natural Fiber Assembly Sound Absorber
Fiber assembly is an important role in sound absorption material, it can be in the structure of loose fiber, nonwoven fabric (or felt), woven fabric and knitted fabric. Excluding the loose fiber, other structures are generated by mechanical method or textile technologies (weaving and knitting). A number of published works presented the investigation of sound absorption properties of natural fiber assemblies, some of the works are summarized in Table 3. The listed fiber assembly is pure and single component, natural fibers mixed with other materials will be introduced in Section 4.3.
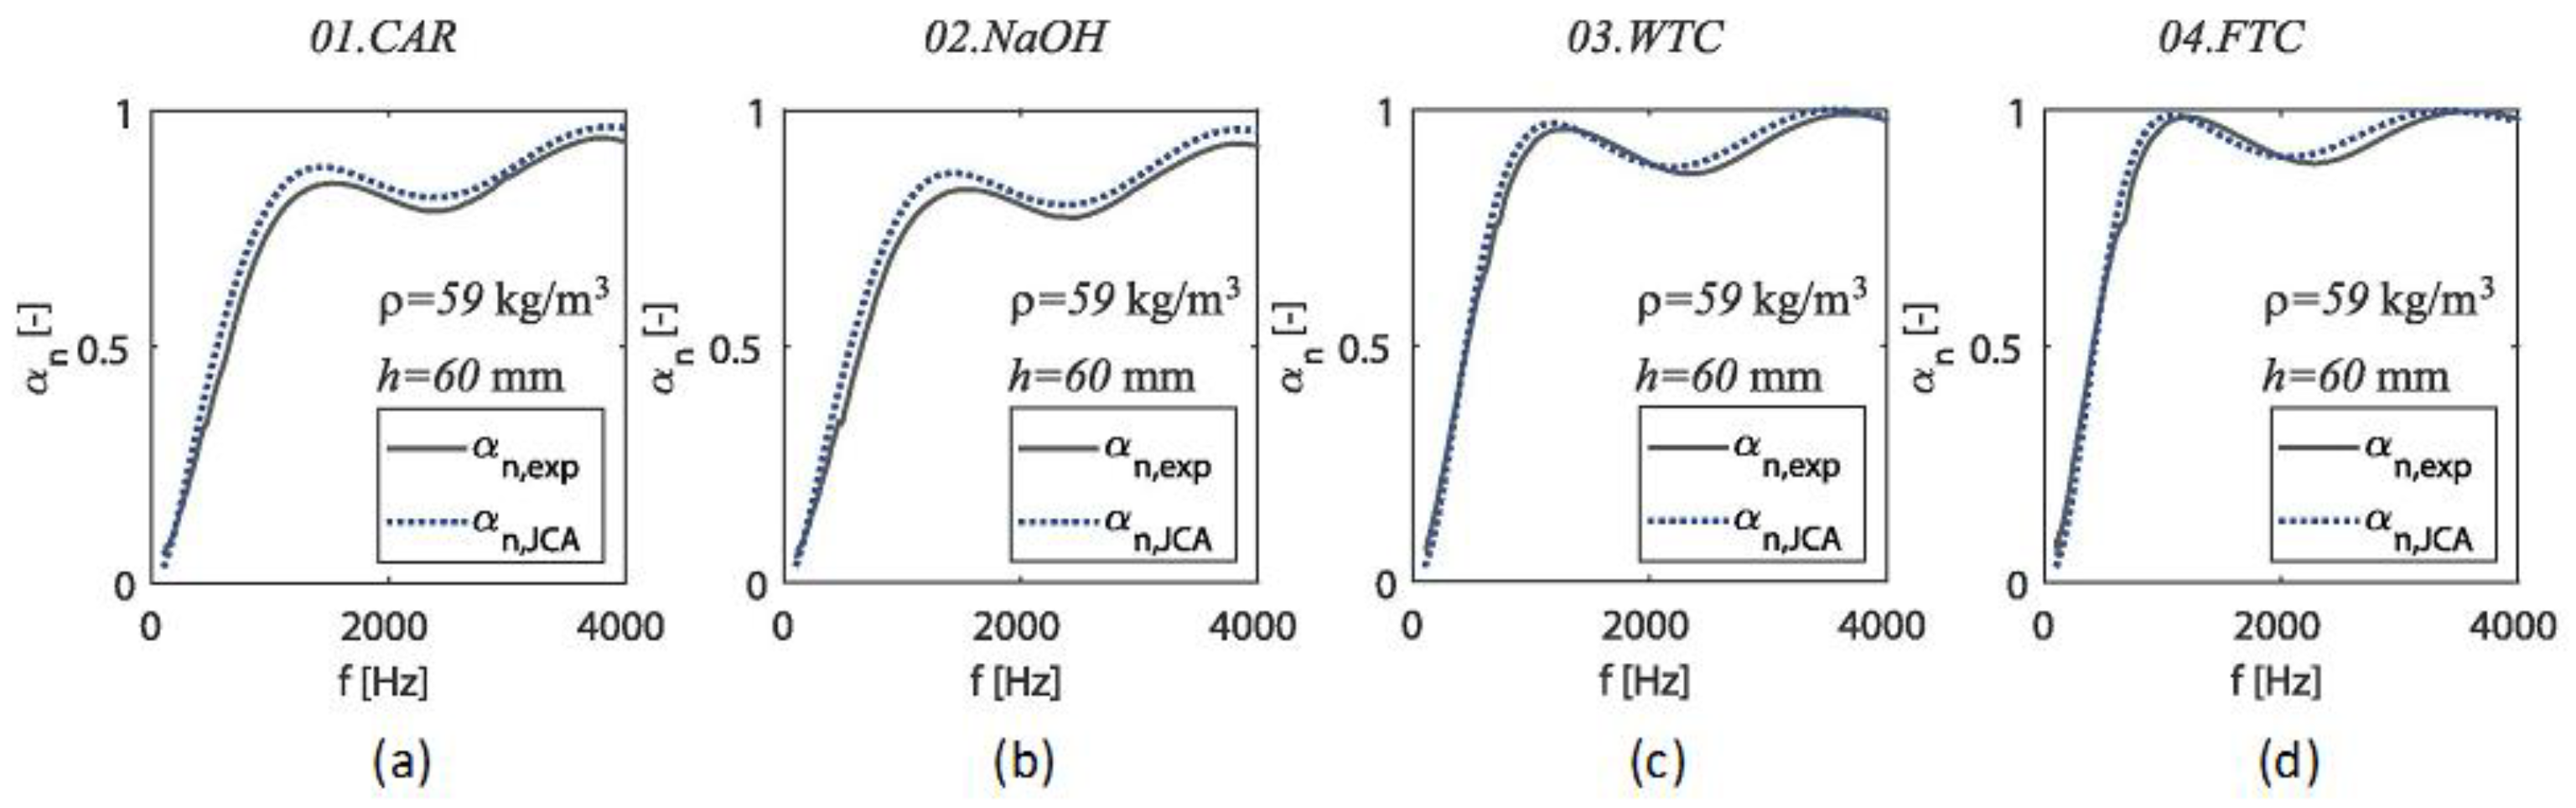
Effect of manufacturing process and treatment on the acoustical performance of hemp fiber was investigated by Santoni et al. [62]. The cylindrical hemp samples compressed from loose fibers for impedance tube measurement is demonstrated in Figure 10. An alkaline treatment followed by two combing processes can enhance the acoustical performance due to the morphology modification of hemp fibers. Additionally, they applied one semi-phenomenological model (i.e., Johnson–Champoux–Allard model) to predict the normal incidence sound absorption coefficient and compared with the measured values of hemp fiber samples at each stage of the manufacturing process (see Figure 11). It can be seen that the semi-phenomenological model can accurately predict the sound absorption of hemp fiber.
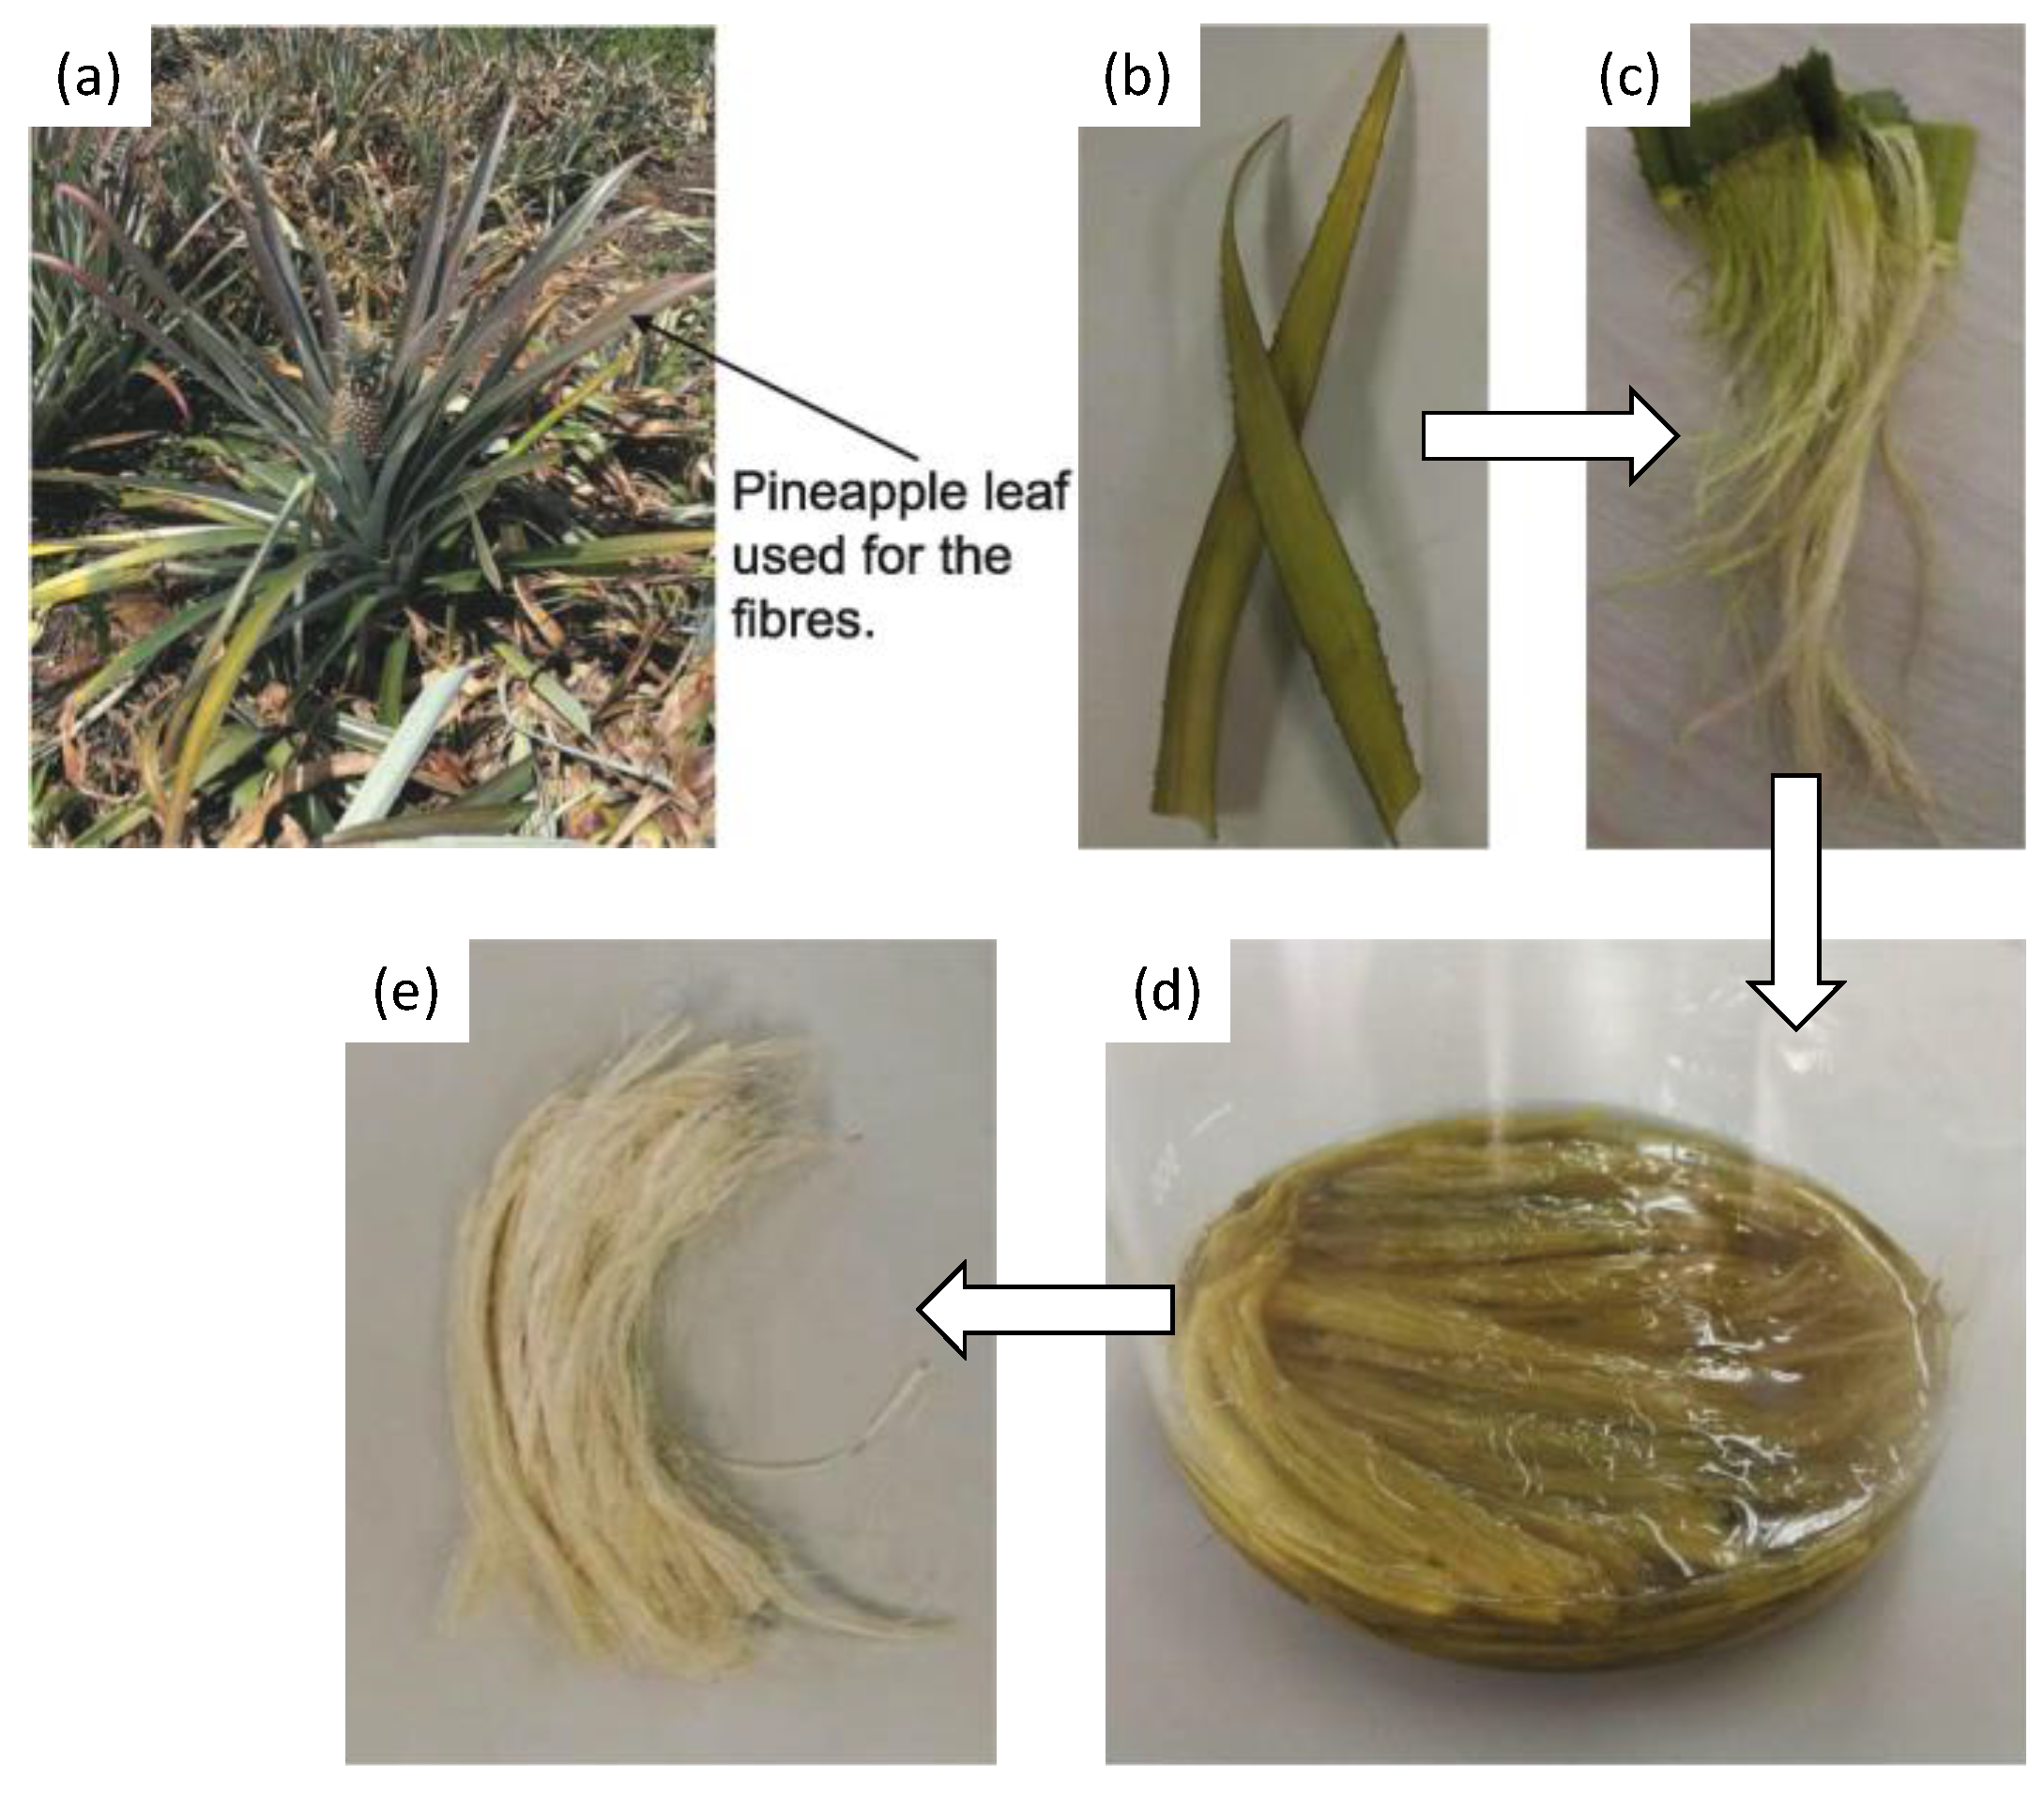
Berardi and Iannace [63] measured the sound absorption coefficient of kenaf fiber, wood fiber, coconut fiber and sheep wool on an impedance tube. Besides the listed findings in Table 3, the limits of empirical models on the acoustical prediction of natural fibers were found. The fiber of pineapple leaves has long been used for textiles in the Philippines [64]. Figure 12 shows the pineapple plant and extraction of pineapple-leaf fiber. The sound absorption coefficient of pineapple-leaf fibers reaches 0.9 on average above 1000 Hz by controlling the density and/or the air cavity behind the sample. The comparison of sound absorption performance between cashmere fiber, goose down, kapok fiber and acrylic fiber was reported in 2010 [66]. Goose down and kapok fiber have higher sound absorption coefficients compared with acrylic fiber that have the same density, which is around 11.8 kg/m3. Oldham et al. [42] did abundant experiments and analyses on the sound absorption properties of some biomass materials which include raw cotton fiber, jute fiber, sisal fiber, etc. They found that existing models can precisely predict the acoustic characteristics of fibers with diameters less than approximately 60 μm. Another finding is that natural fibers with small diameter are more effective on sound absorption compared with conventional absorbers, such as mineral fiber and glass fiber.
It should be noted that the articles studying acoustic the properties of natural loose fiber and nonwoven fabrics can be found in the literature; however, publications regarding natural fiber in the structure of woven and knitted fabrics for sound absorption purpose is limited.
4.3. Natural Fiber Composite Sound Absorber
Although natural fiber assemblies have good acoustical absorption properties, they may be not suitable to be commercially used [6]. They generally need to be mixed with additives to keep them in shape and improve characteristics, such as fire retardancy, moisture resistance and stiffness. In the view of expanding the usage of natural fibers to substitute synthetic materials for sound absorption purpose, considerable attention has been paid to the investigation of natural composite materials and their sound absorption properties. A summary of natural fiber composite sound absorbers is presented in Table 4.
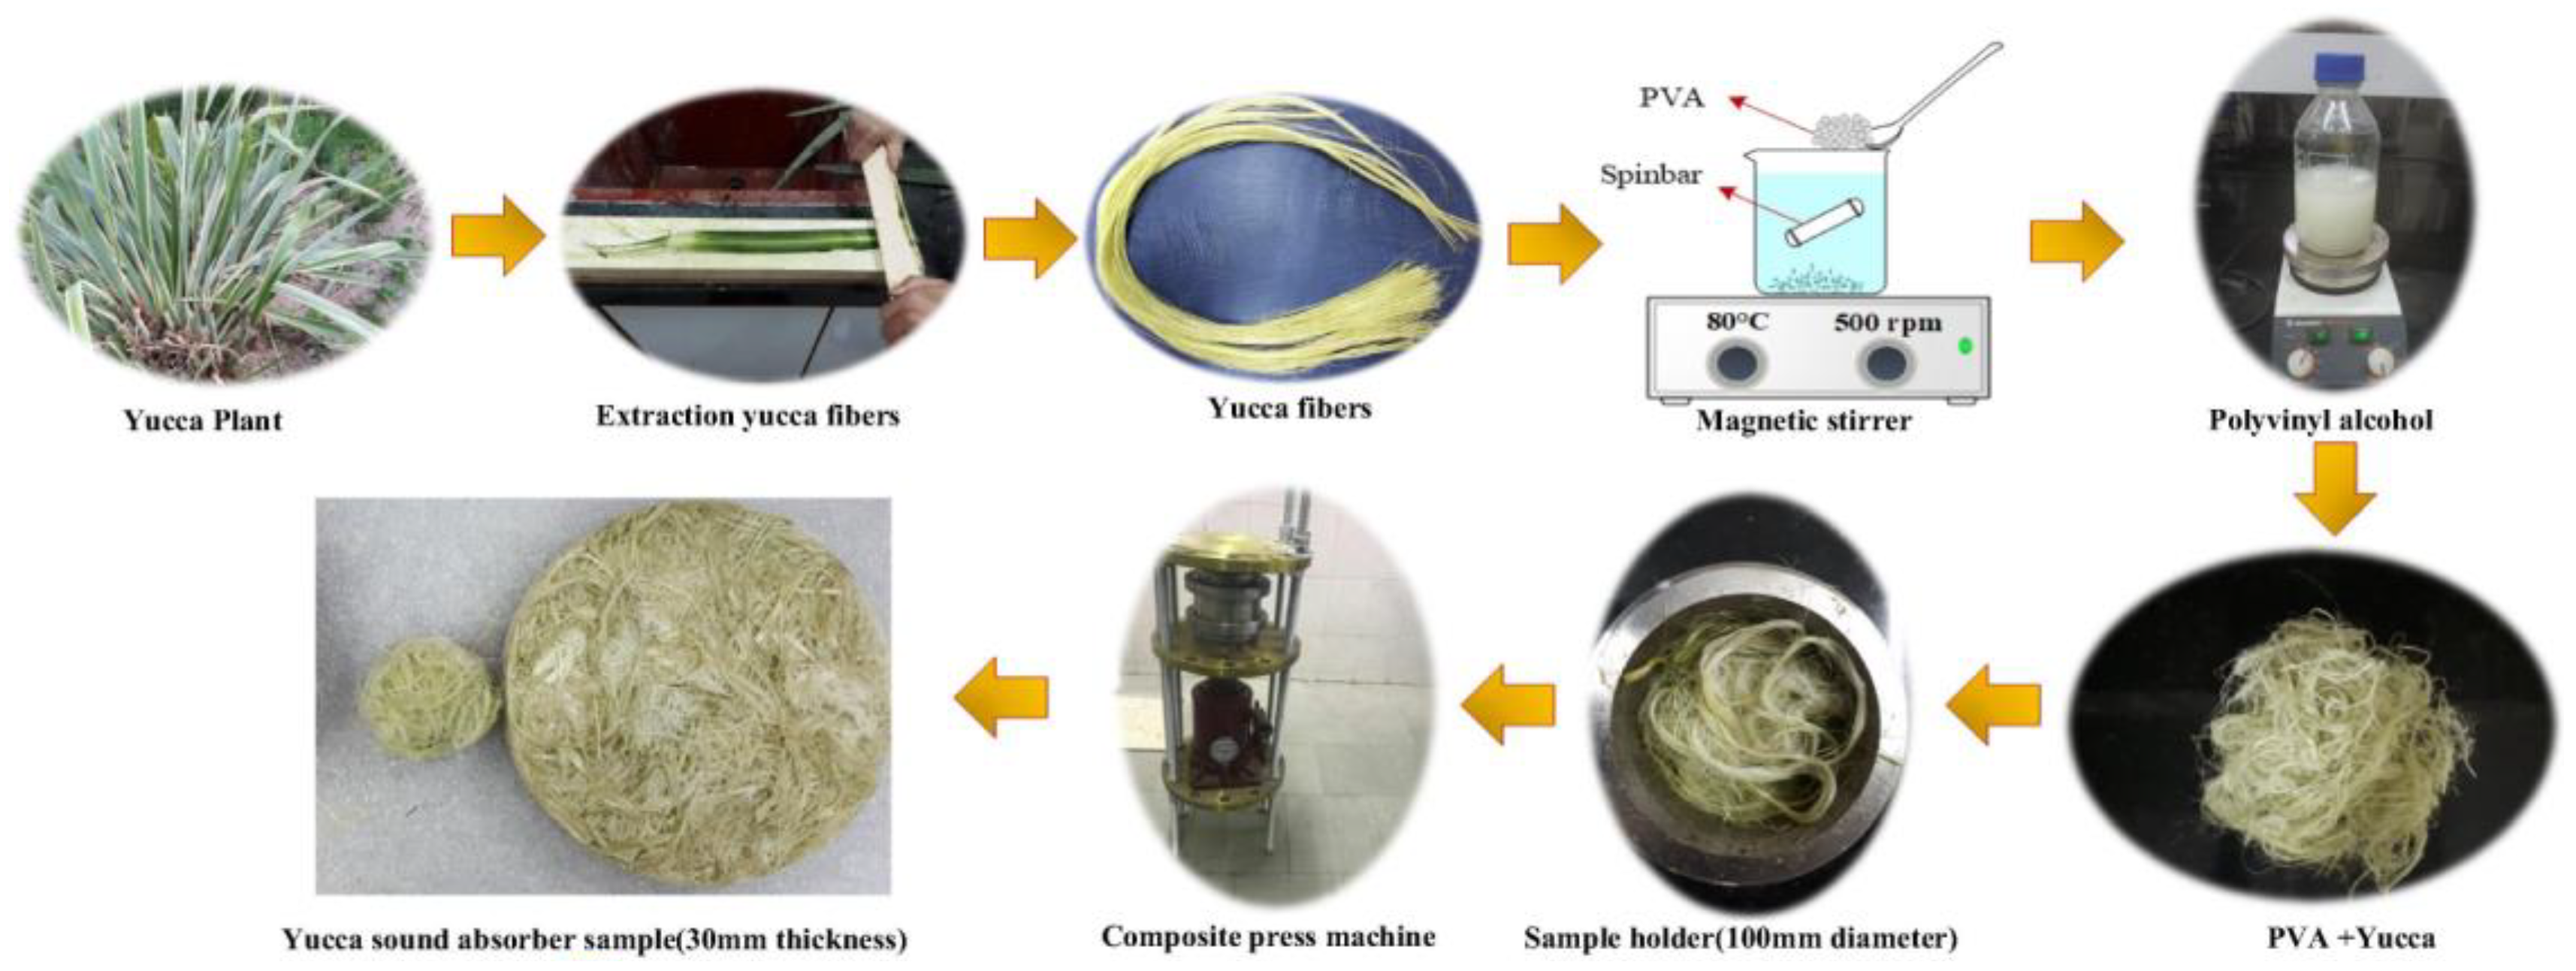
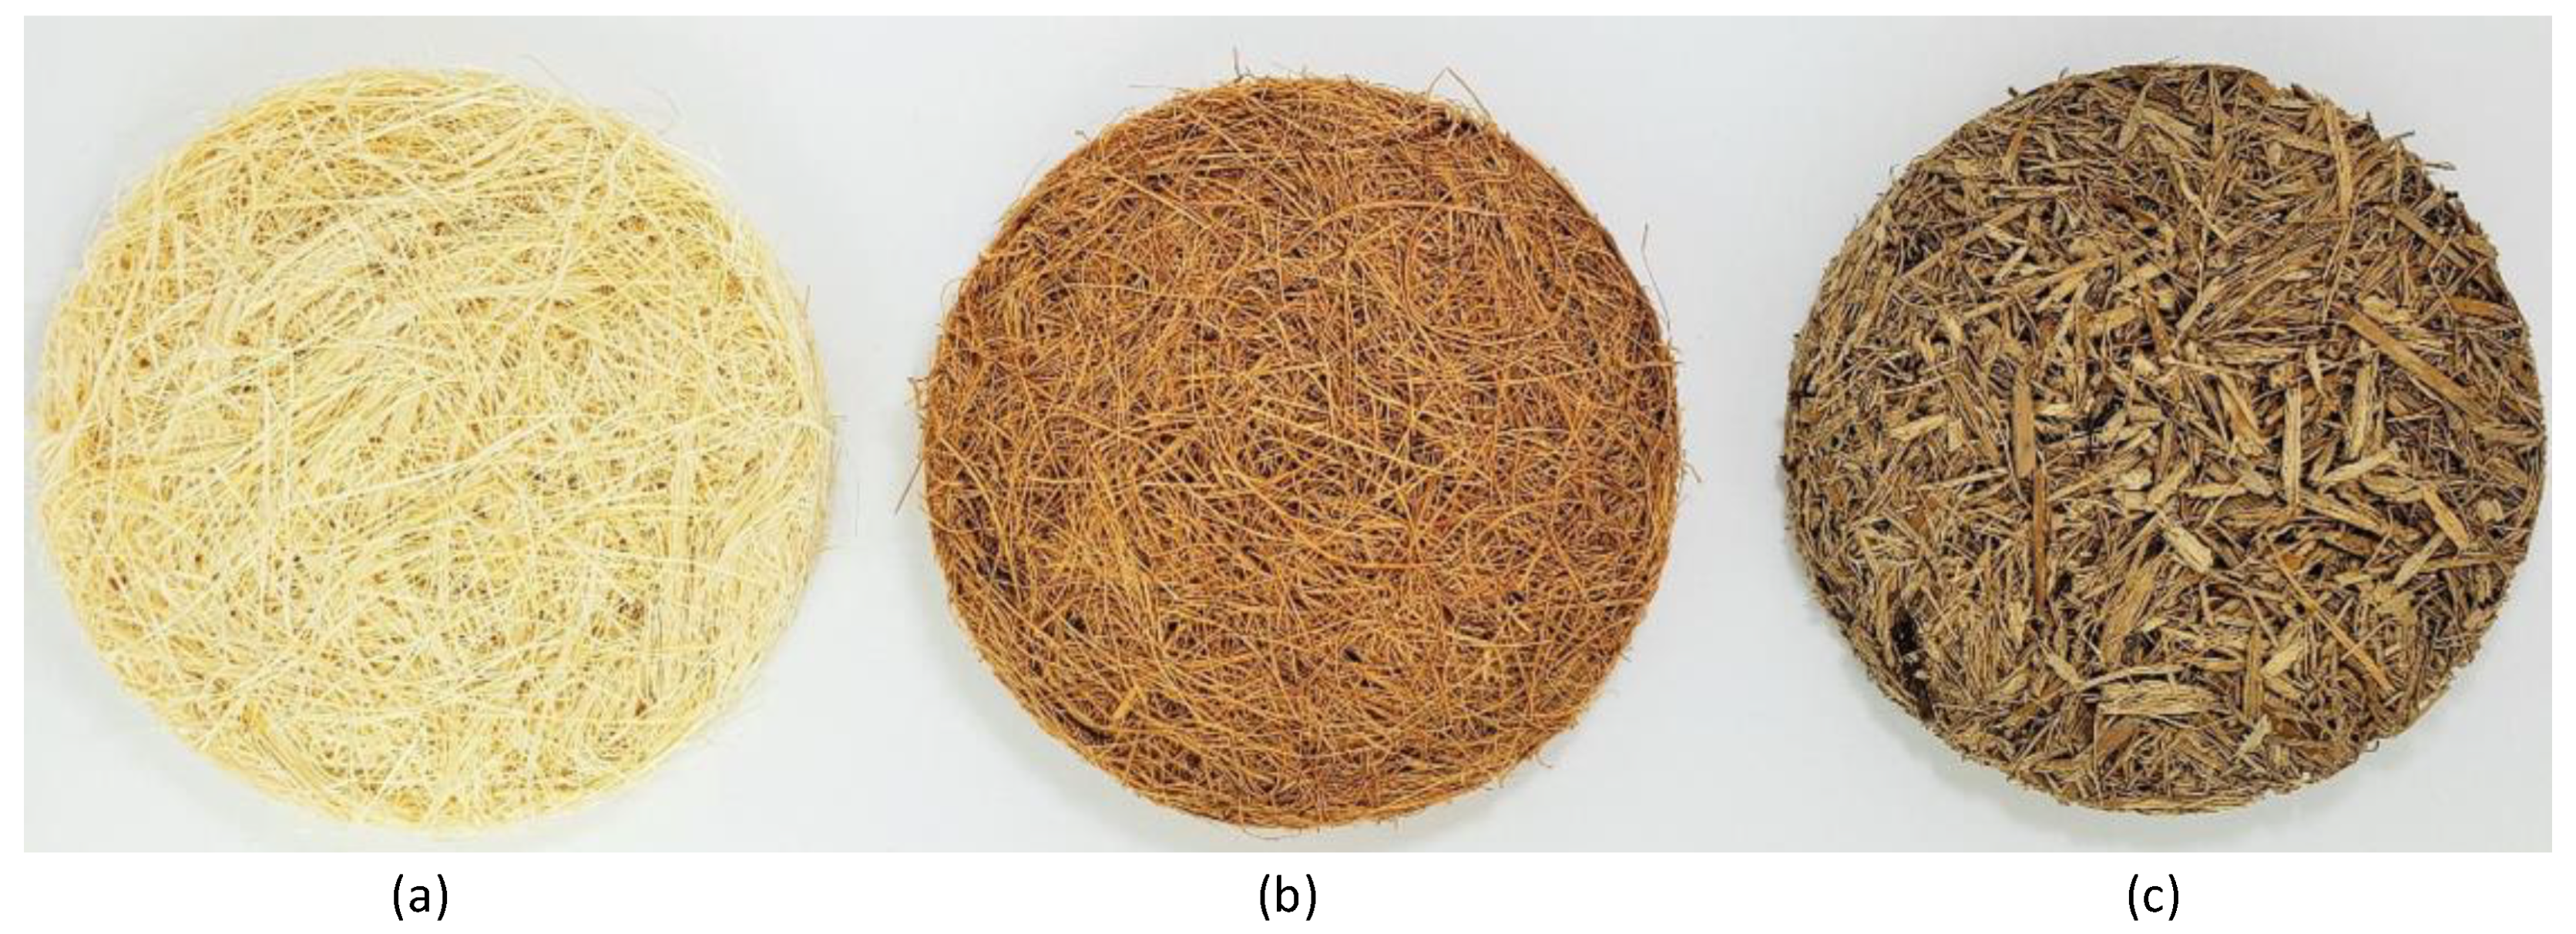
Pretreatment of natural fiber is required for commercial use since pretreatment can help to achieve desirable fiber quality, fiber strength, and a better fiber–matrix adhesion in the composite. The kenaf fiber composite exhibited better sound absorption properties especially in the high frequencies after treating with 6% concentration of NaOH [70]. Yucca Gloriso (YG) is commonly known as Spanish Dagger and widely grows in Southeastern USA, Mexico and India [71]. The YG fibers around the city of Tehran, Iran was selected to prepare the fiber composite (see Figure 13). Researchers compared the sound absorption properties of sisal, coconut husk and sugar cane composites [72]. The samples of these three composites are shown in Figure 14. Sugar cane composite has a superior sound absorption property compared to those of the sisal and coconut husk composites. This result agrees with other research, which was published in 2017 [73].
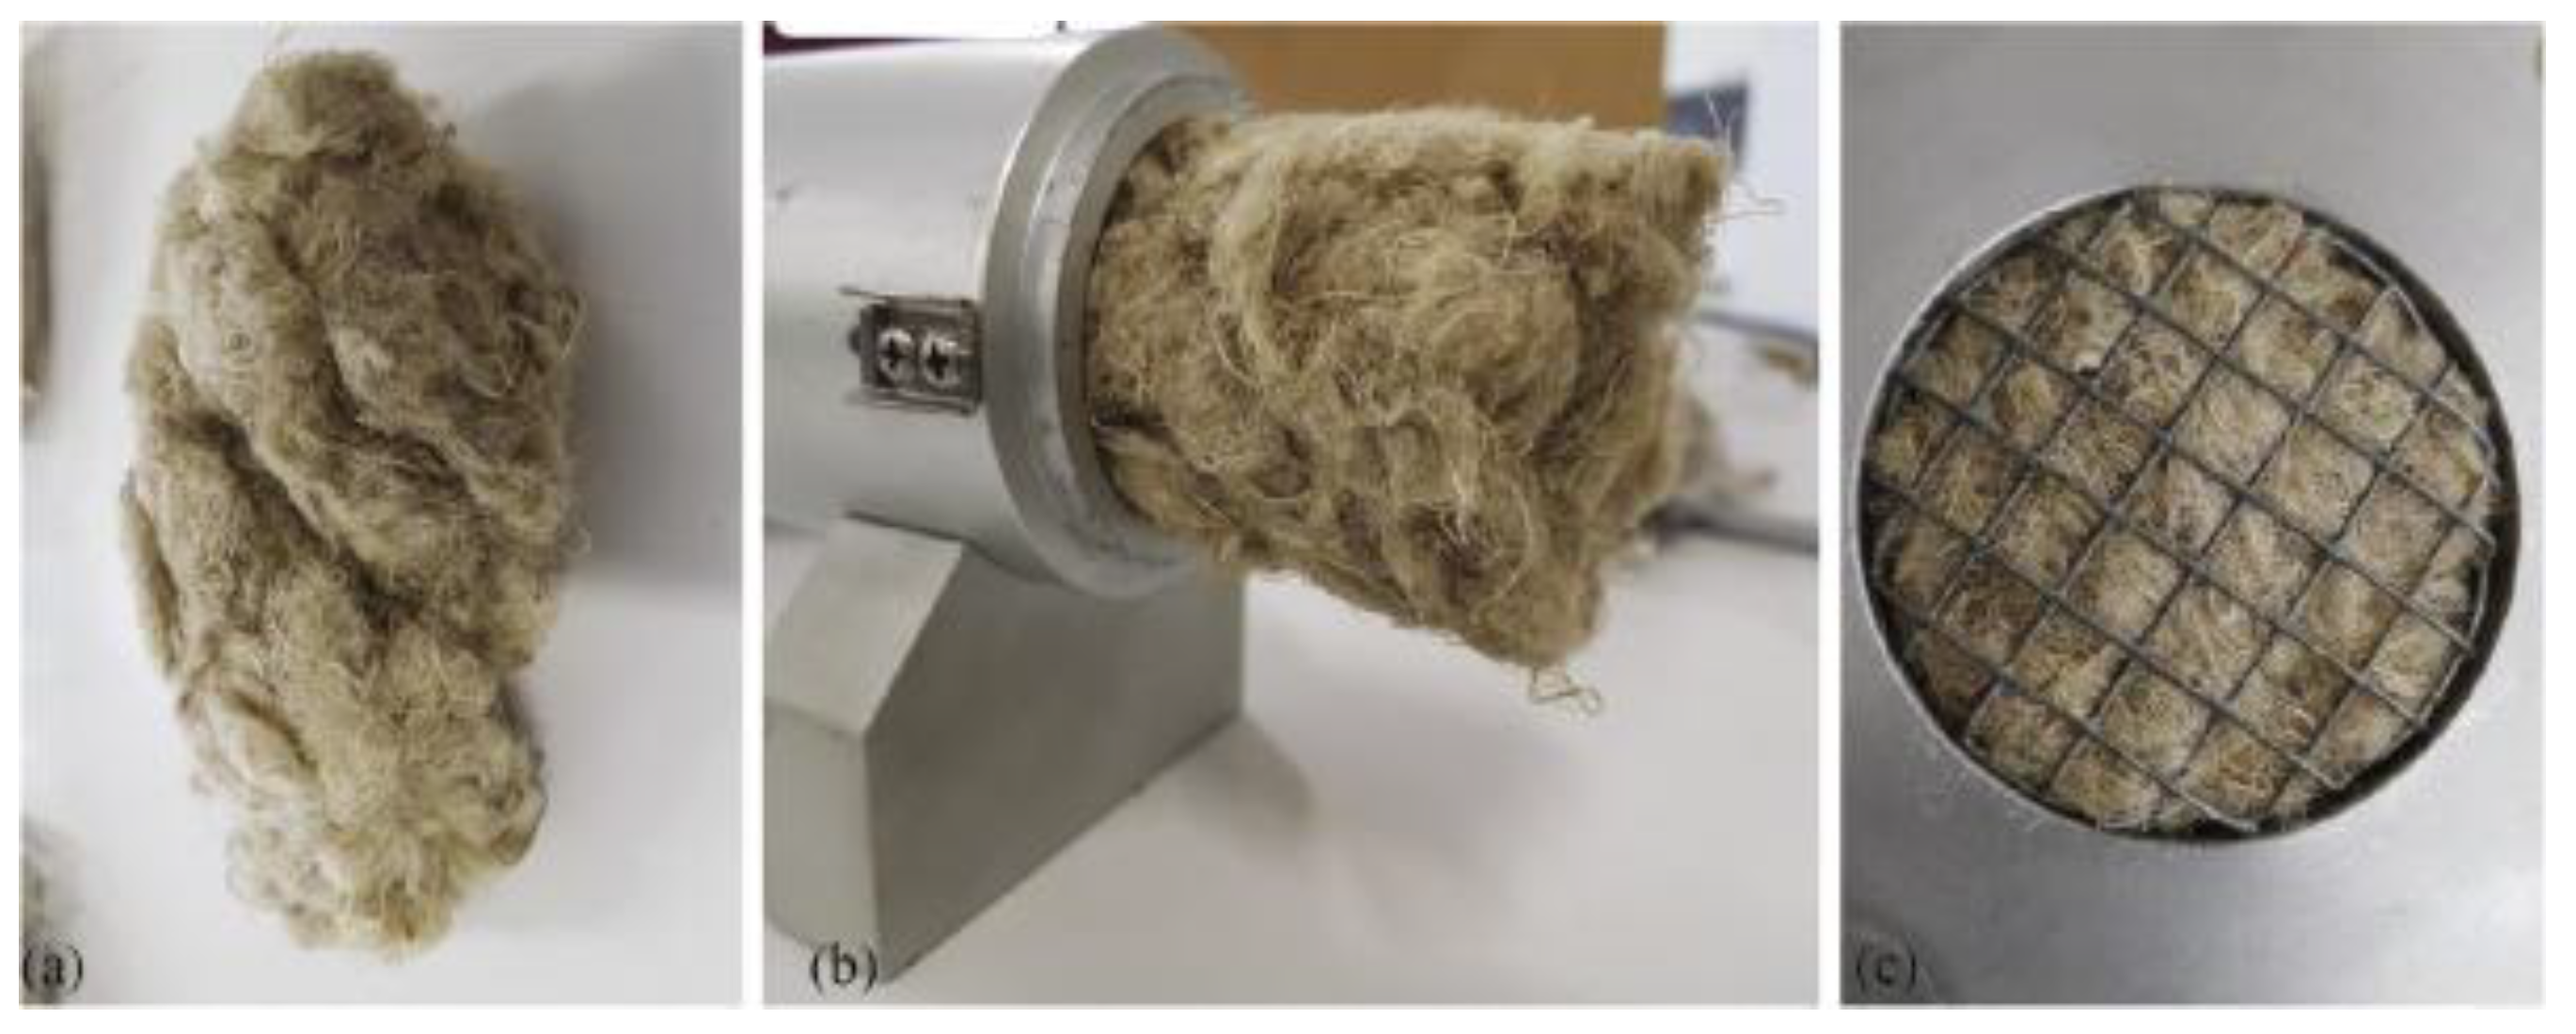
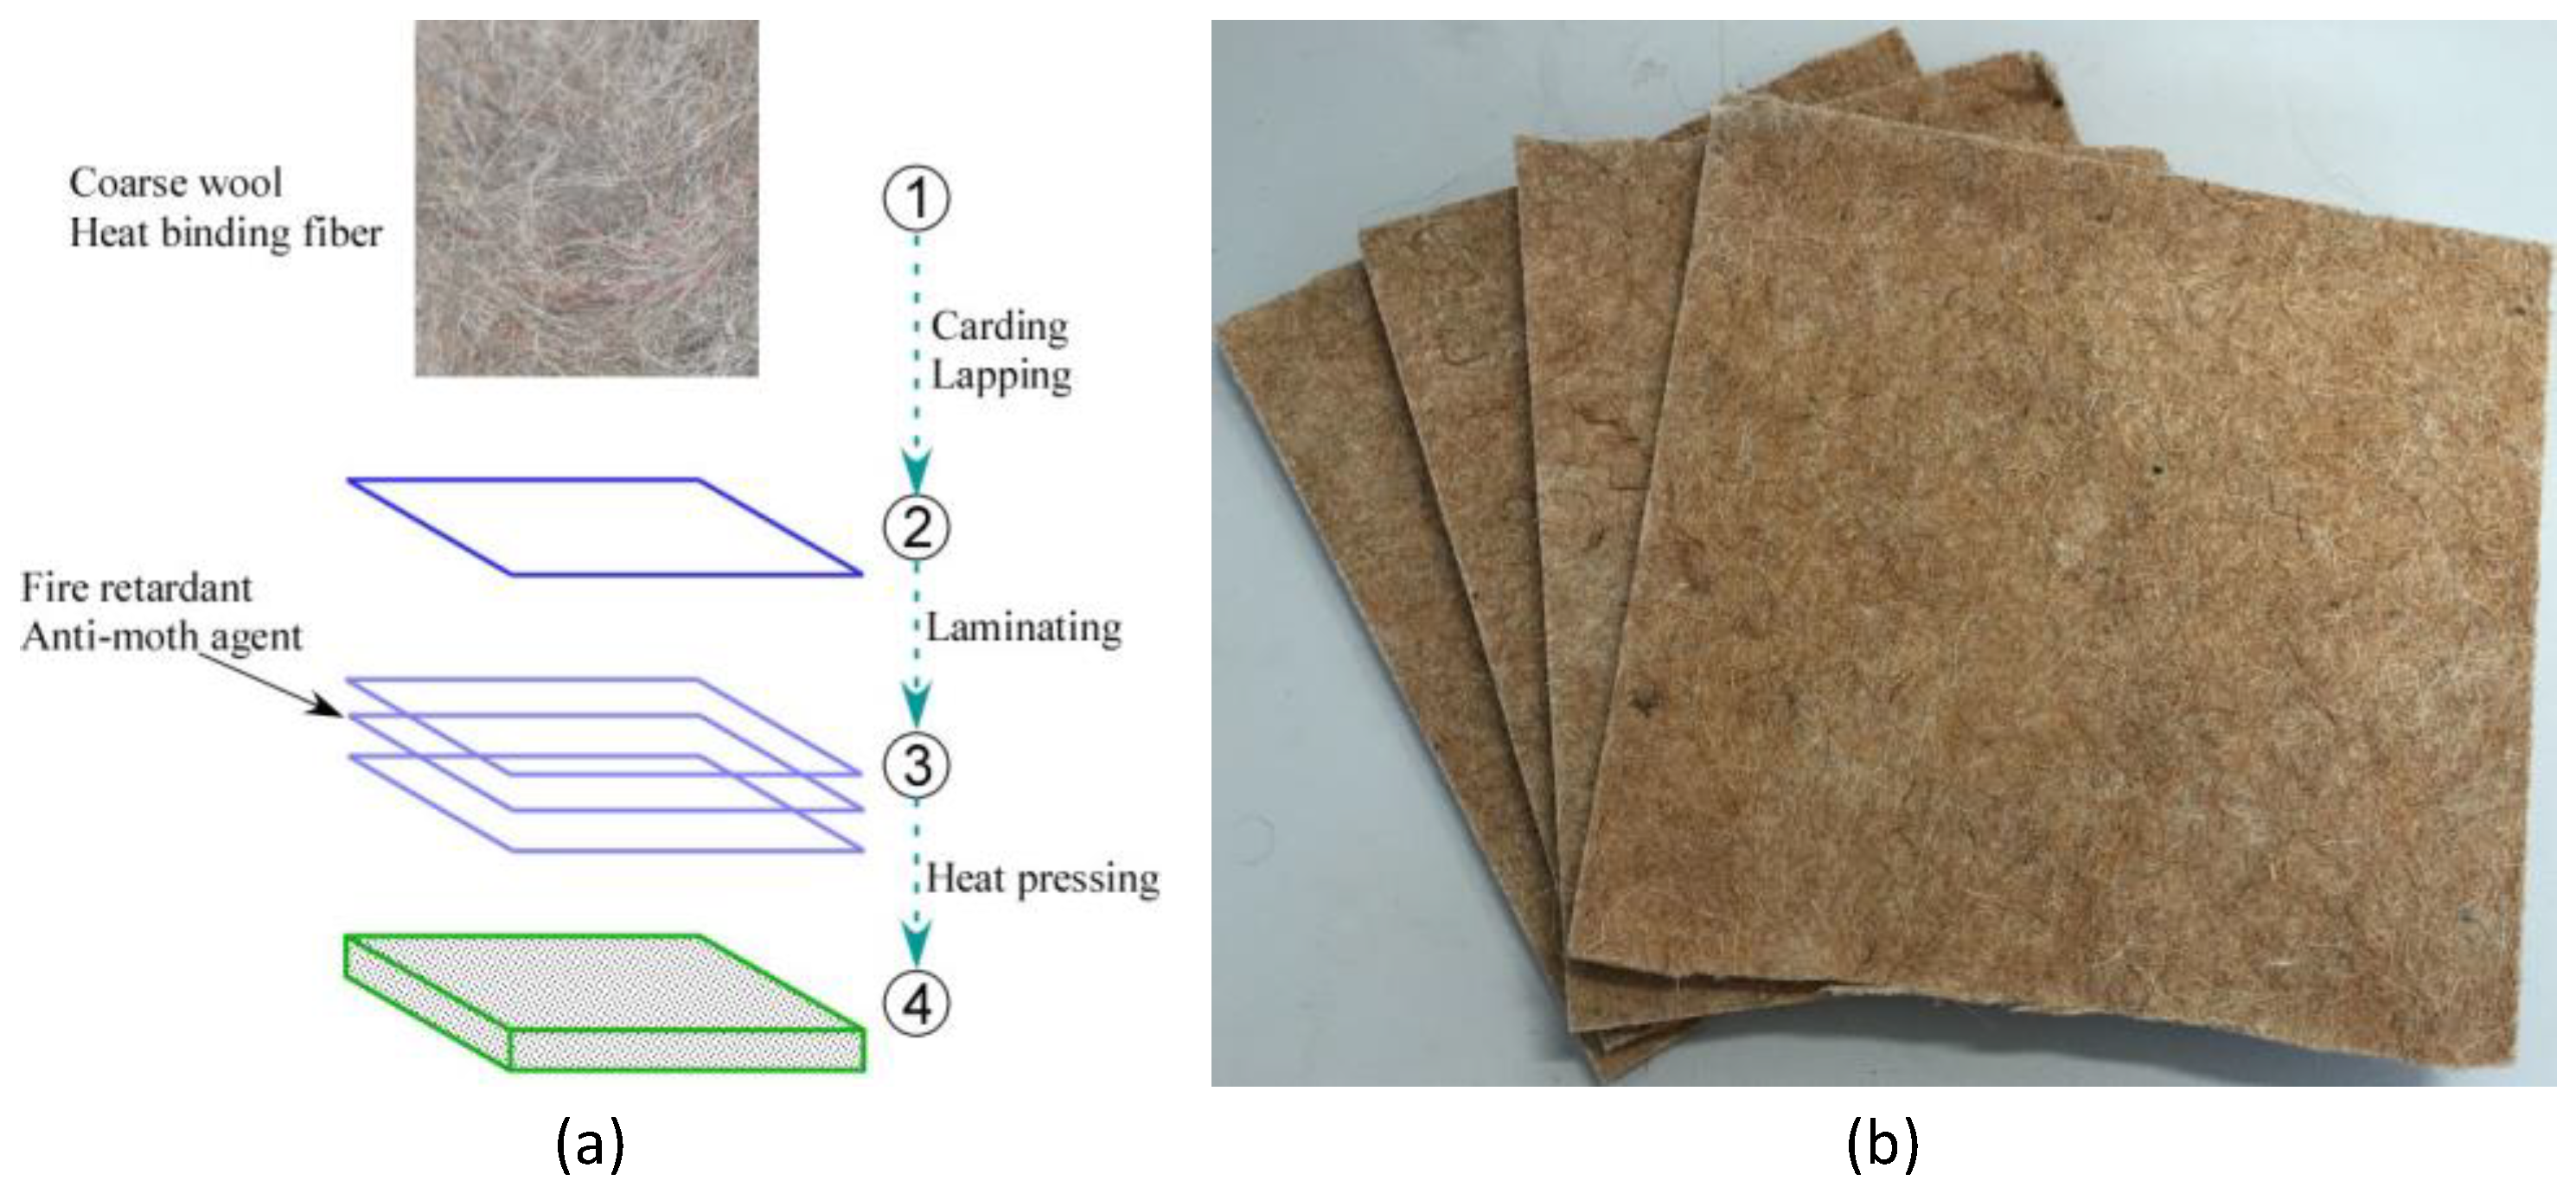
The wool fiber bundles mixed with binding fibers, anti-moth agents and a fire retardant were laminated under heat pressing to prepare wool board (see Figure 15) [75,83]. The wool composite with a density of 249.54 kg/m3 and a thickness of 18 mm showed a good sound absorption performance. Another research presented the comparison of thermal insulation, acoustic, moisture absorption and fire properties between waste wool and waste wool/RPET (recycled polyester fibers) composite [76]. A fire retardant and silicon were applied on needled-punched samples to increase the fire and moisture absorption properties, respectively. The results revealed that the RPET/waste wool composite exhibits the best sound absorption, thermal insulation, moisture absorption and fire properties. Besides the RPET/waste wool composite, flax fiber and hemp fiber composited with polyester fibers also showed comparable sound absorption [77]. A new model exhibited a good agreement with measured values by involving average fiber dimension, porosity and volume ratio of the polymer fibers.
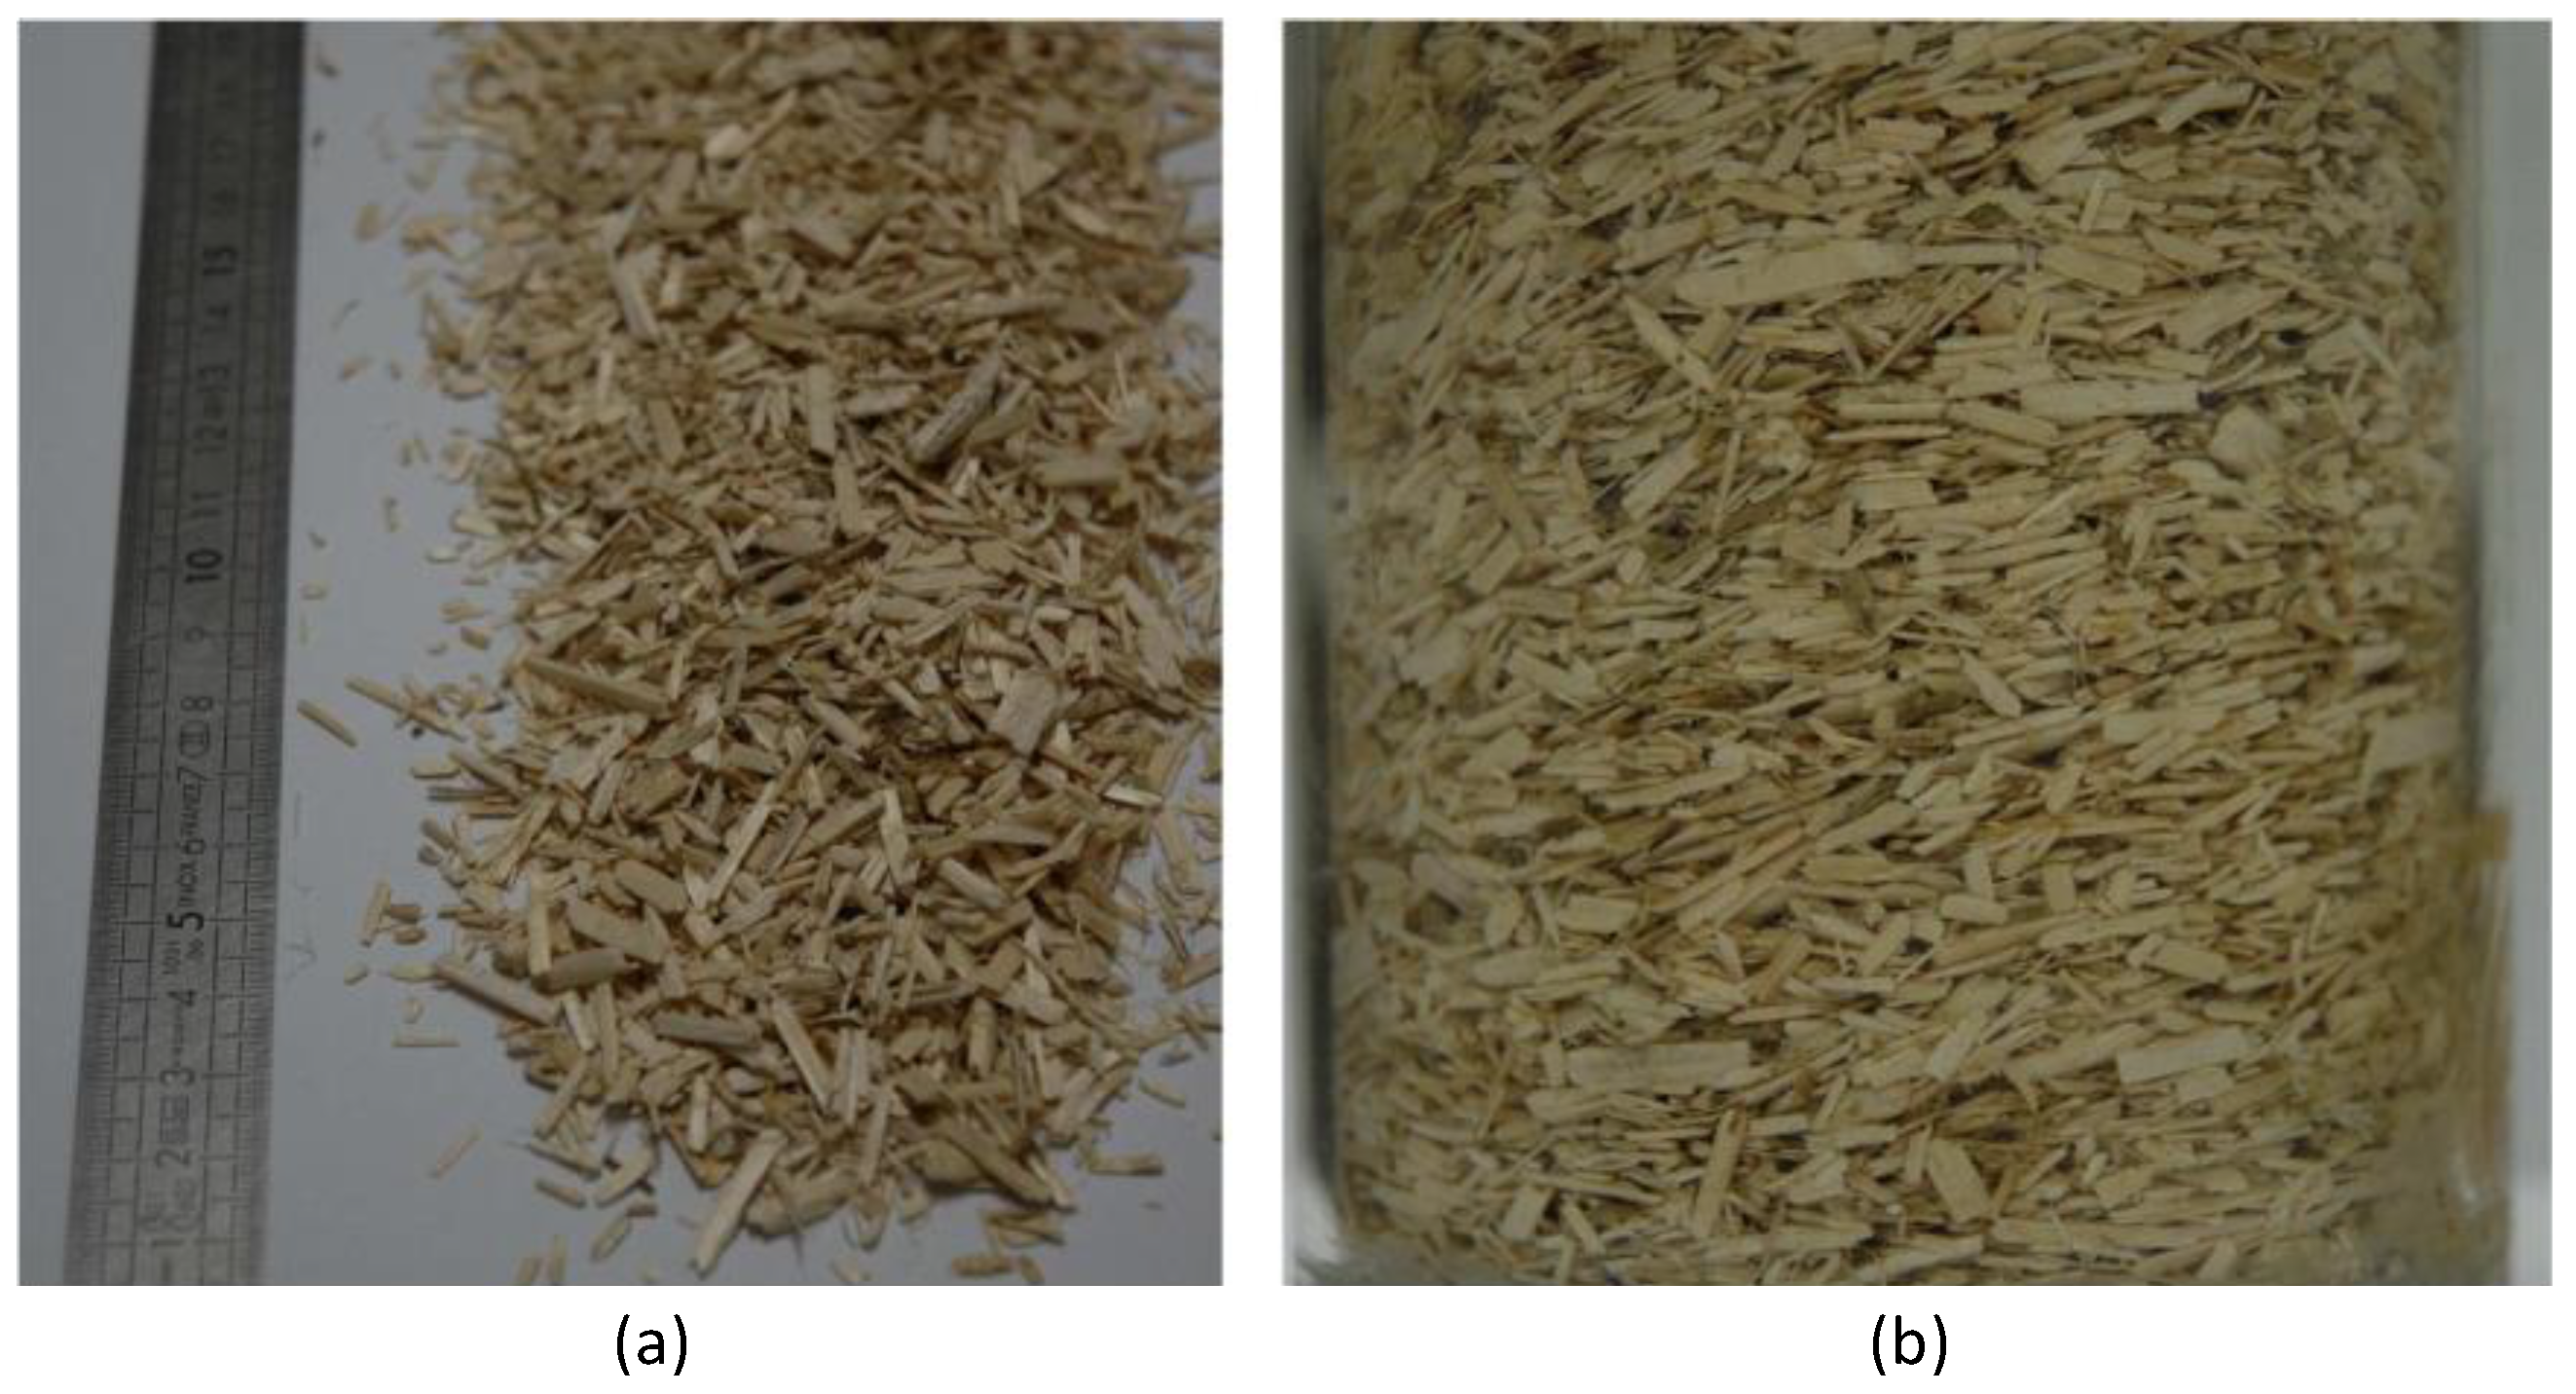
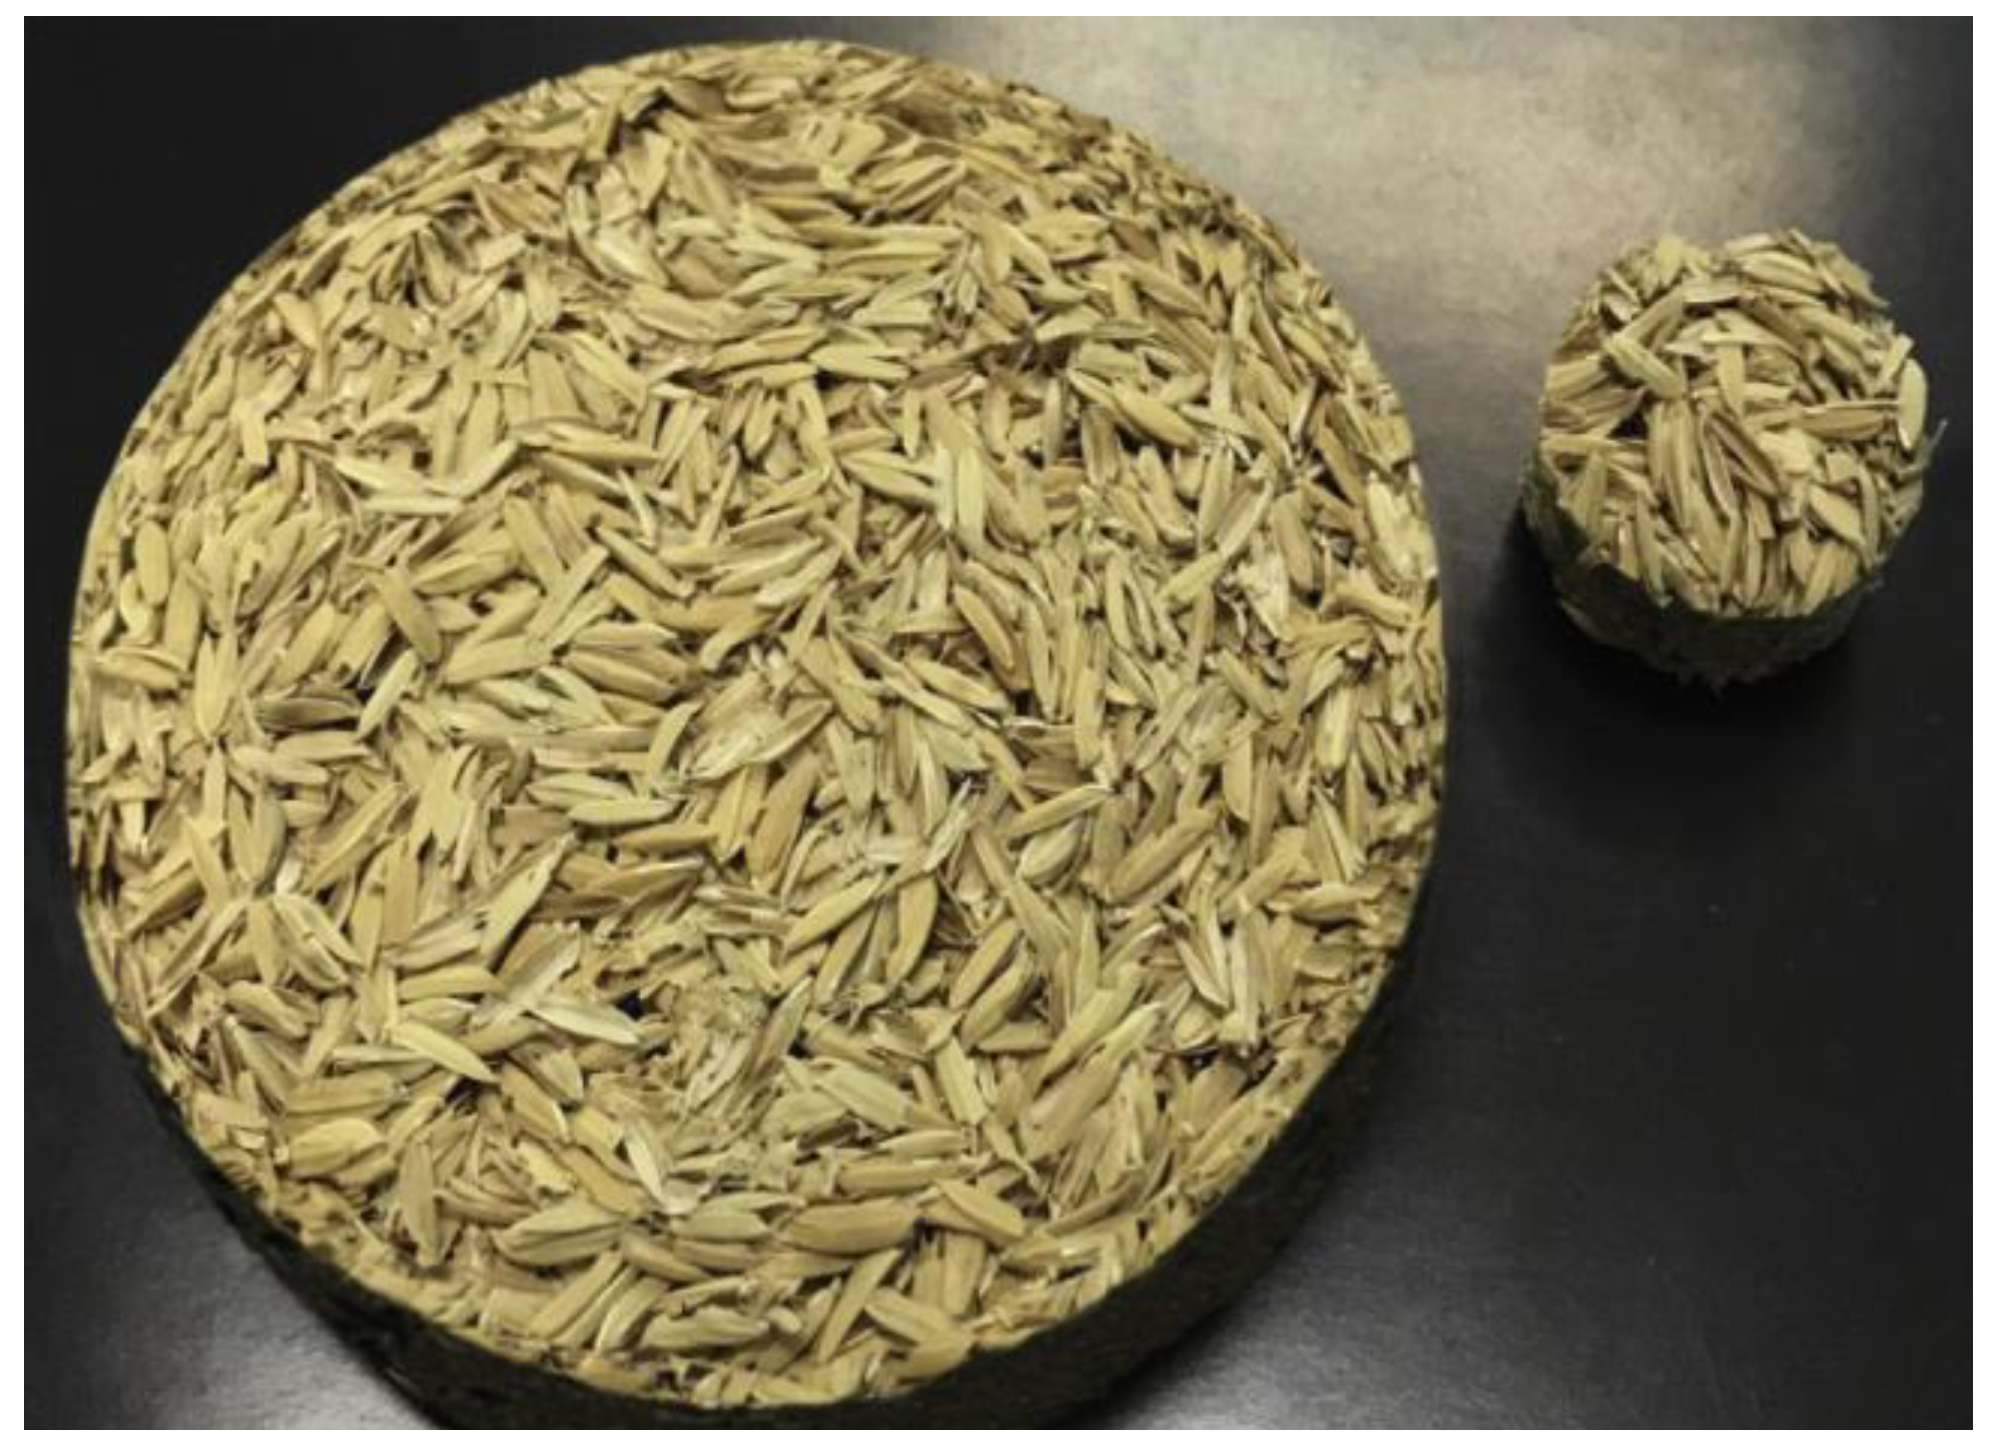
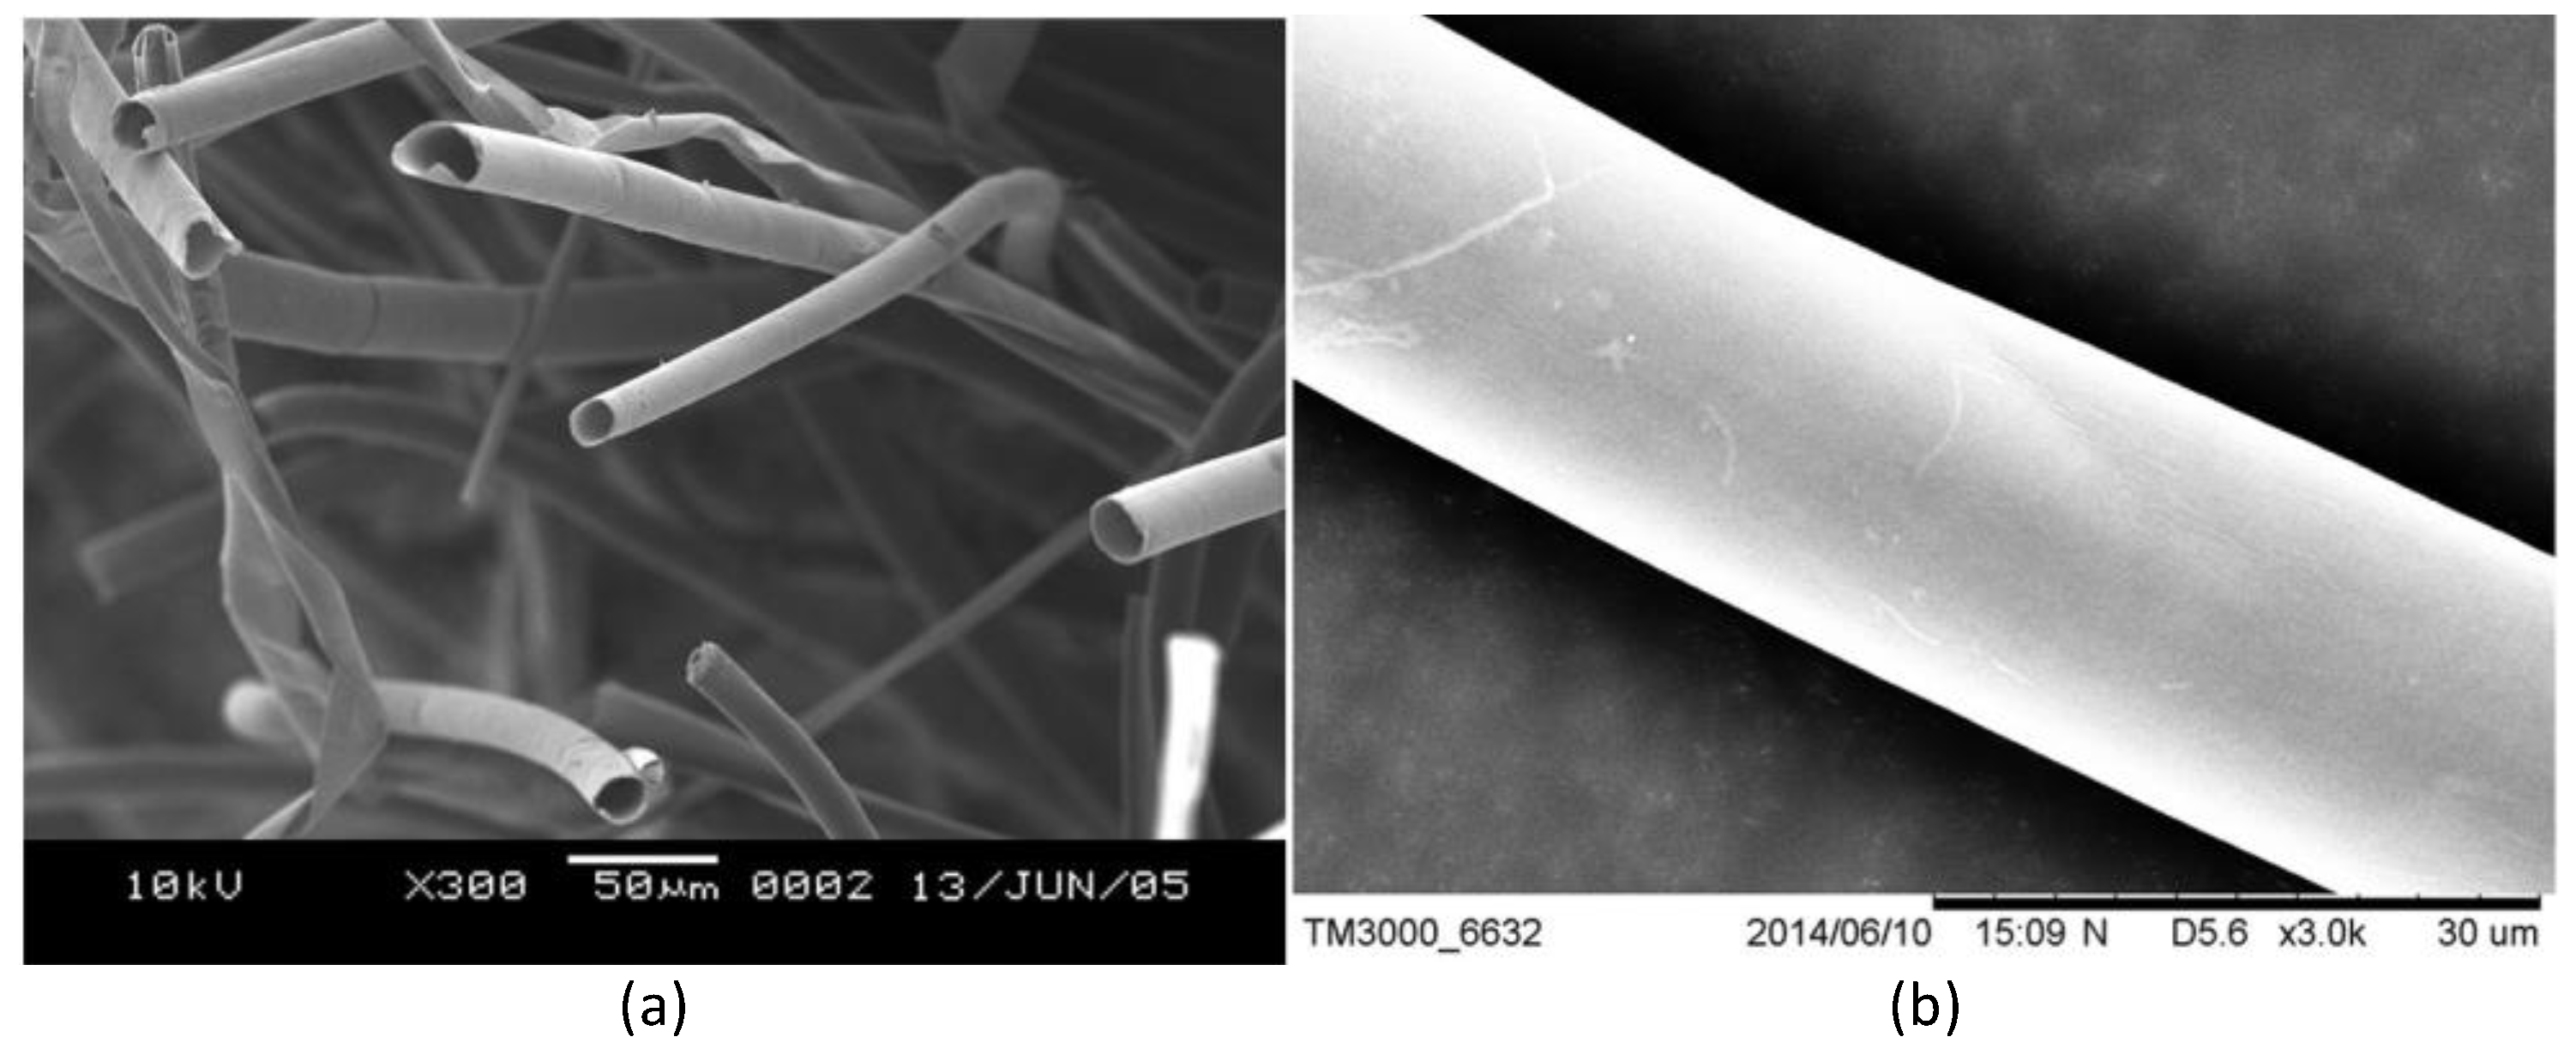
Rice husk is a co-product of rice processing and immediately available in its form [78]. The rice husk composited with a small amount of polyurethane glue (see Figure 16) exhibited better sound absorption performance than those of loose rice husk. Kapok fiber is a natural high hollow fiber with a maximum hollow degree of around 90%, as seen in Figure 17 [79]. Due to the large hollow structure, kapok fiber has been widely used as oil and a sound absorber [84,85]. The relatively thin kapok composite shown a reasonable sound absorption at low frequency (i.e., 100–1000) because kapok fiber can easily vibrate under sound waves at low frequency [79].
4.4. Comparison of Sound Absorption Performance between Natural Fiber Sound Absorbers
Although a number of studies claimed that the natural fiber sound absorbers have many advantages compared with conventional absorbers, not every natural fiber has the potential property to substitute mineral fiber and glass fiber. Thus, it is essential to compare the sound absorption properties of natural fibers and a conventional absorber. The sound absorption coefficients of different kinds of natural fiber sound absorbers were extracted from some selected articles that met the selection criteria. The thickness is a key parameter to the absorption performance, especially at low-frequency range. For a rigid-baked sound absorber, increasing thickness usually results in a clear increase in sound absorption at low-frequency range. One specific thickness (30 mm) is adopted to define thin and think natural fiber sound absorbers in this review. Materials with a thickness less than 30 mm are classified as thin sound absorbers, while materials thicker than 30 mm are thick absorbers. The presented sound absorption curves were extracted based on a software of WebPlotDigitizer (Pacifica, CA, USA). MATLAB software was subsequently used to redraw the sound absorption curves. All of the redrew curves are normal incidence sound absorption coefficient. In addition, conventional sound absorbers (i.e., glass fiber) with two thicknesses were selected to compare the natural sound absorbers.
The specifications of thin natural fiber sound absorbers and glass fiber are listed in Table 5. It can be found that glass fiber has a very small fiber diameter and a low density compared with natural fiber materials. The airflow resistivities of some absorbers are presented, but other absorbers’ resistivities are not available. Glass fiber exhibits relatively high airflow resistivity, although it has lower density. Despite the fact that some natural absorbers, e.g., sisal, coconut and sugar cane, have much higher density than glass fiber, their airflow resistivity are still lower than glass fiber. This can be attributed to their large fiber size.
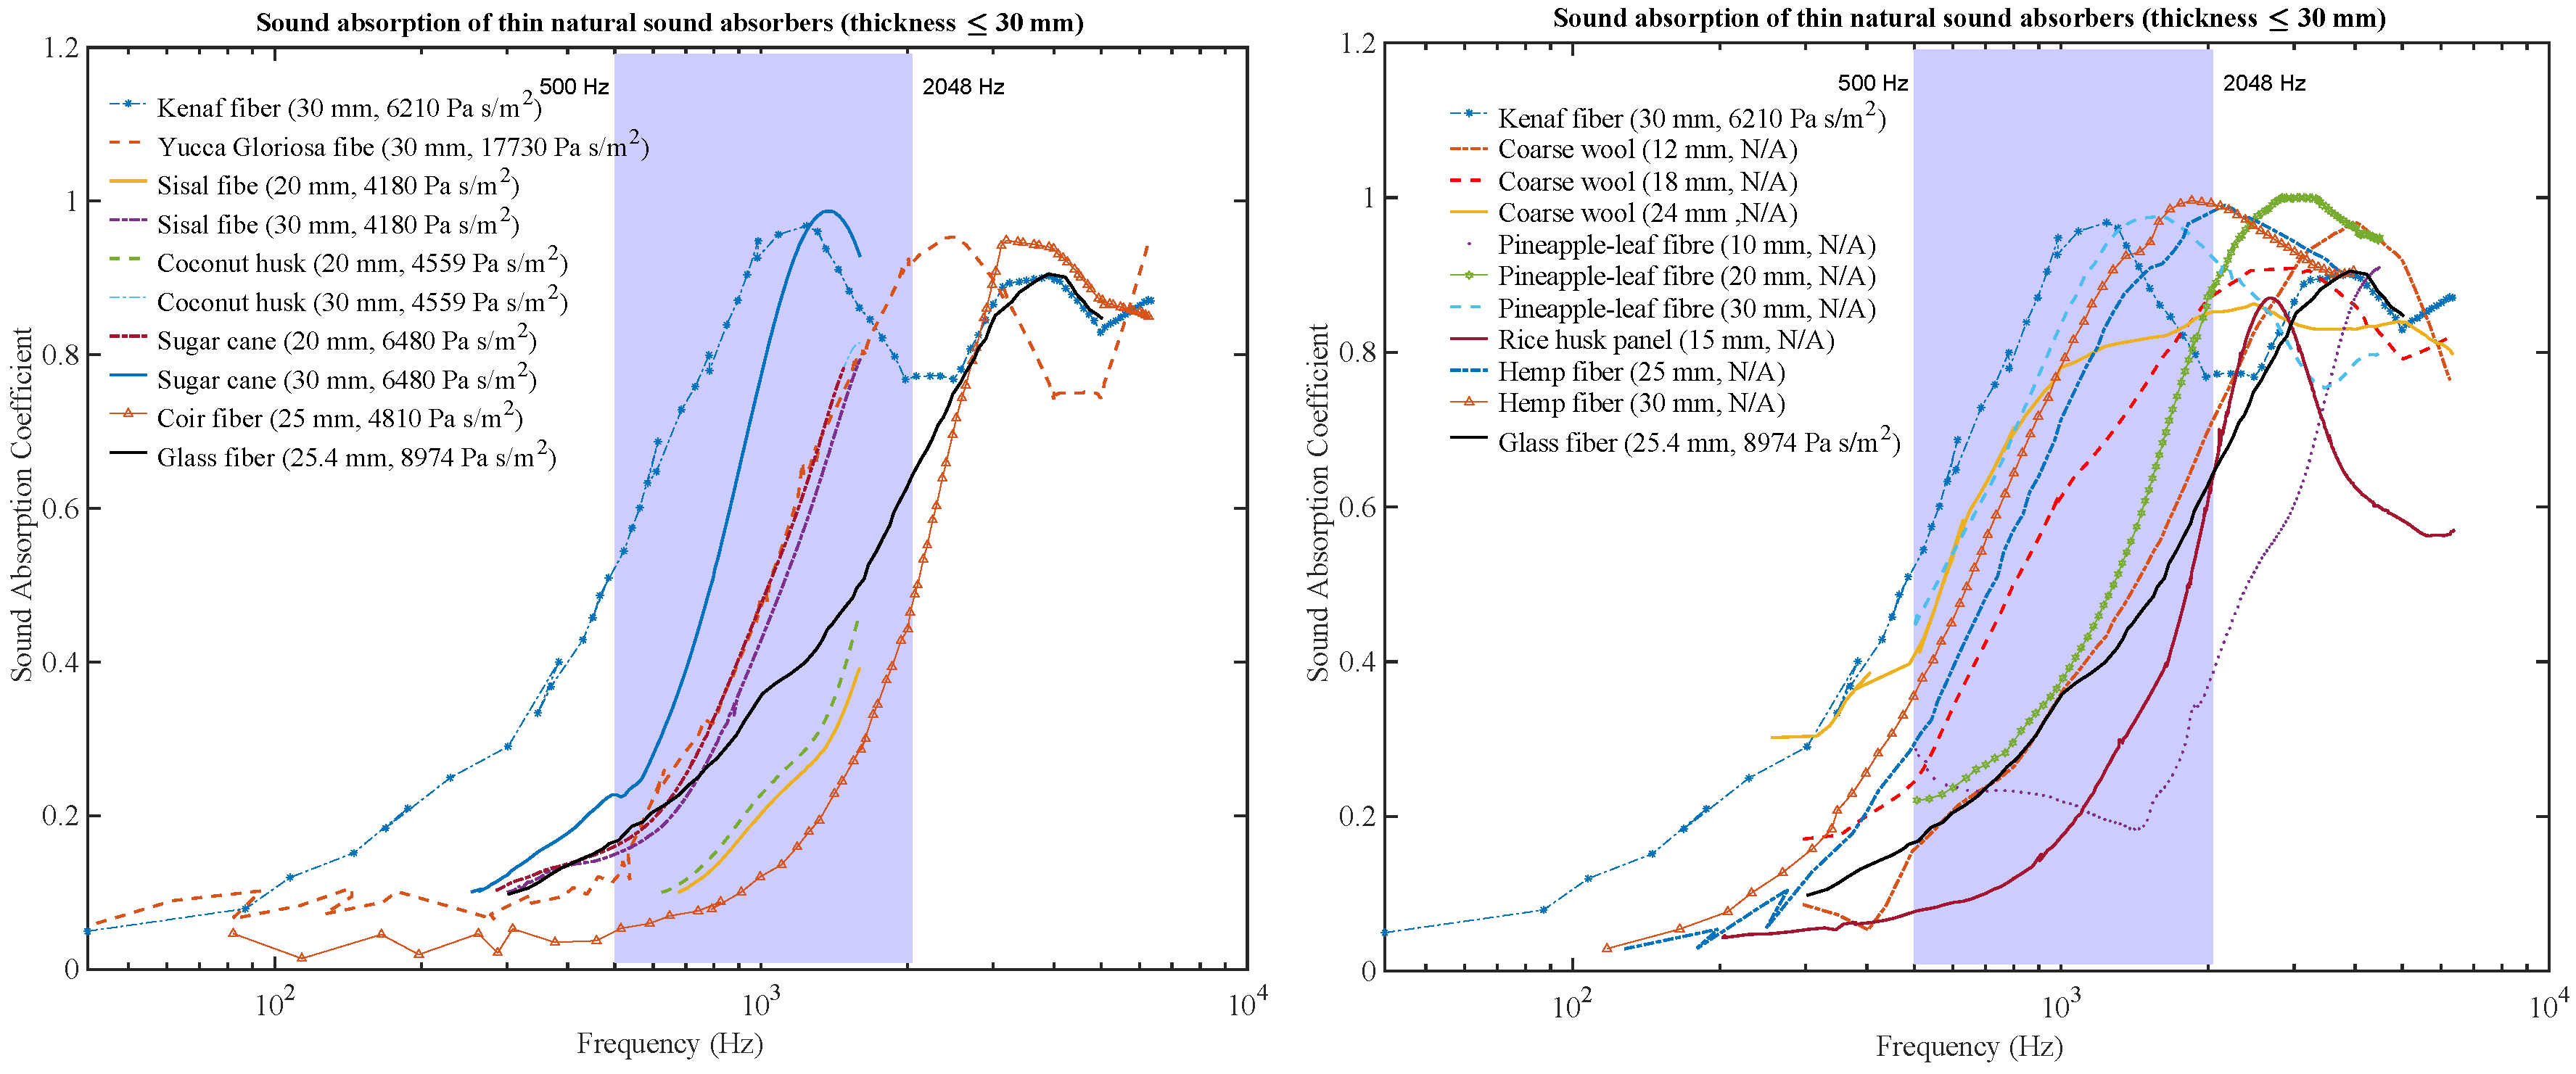
The extracted sound absorption coefficients of thin natural fiber sound absorbers and glass fiber are presented in Figure 18. In order to clearly compare the difference among the absorbers, the sound absorption curves are separately showed in two graphs. The thickness is reported in brackets followed by the correspondence airflow resistivity. The 30 mm thickness Kenaf fiber and glass fiber are presented in the two graphs as comparison curves. It can be found that thicker absorbers generally have better sound absorption properties than thinner absorbers. However, Yucca Gloriosa fiber, sisal fiber and coconut husk do not show comparable absorption performances compared with kenaf fiber, although they have the same thickness and similar density. Due to the loose fiber structure, the coir fiber exhibits worse sound absorption compared with thinner absorbers. Moreover, most of the natural absorbers show a better sound absorption than glass fiber.
Audio frequency is approximately in the frequency range of 20 Hz–20 kHz. The most sensitive frequency range for the human auditory system is between 500 and 4000 Hz [88]. Meanwhile, the most important frequencies for hearing and understanding communication lie in between 500 and 2048 Hz [89,90]. This frequency range has been highlighted in the graphs. Some materials’ peak sound absorptions are very close to 1, but the peaks are not located in the 500–2048 Hz range, such as Yucca Gloriosa fiber, coir fiber and coarse wool. The Kenaf fiber, sugar cane (30 mm), hemp fiber (30 mm) and pineapple-leaf (30 mm) show a good sound absorption in the frequency of 500–2048 Hz, while the glass fiber does not exhibit a good sound absorption performance at this frequency range.
The specifications of thick natural fiber sound absorbers and glass fiber are presented in Table 6. The thicknesses of these absorbers range from 35 to 100 mm. The kapok fiber has the lowest density, which is 8.3 kg/m3. By comparing other absorbers, glass and kapok fibers are very thin. Besides, hemp and flax fibers sizes are relatively small. As regards the airflow resistivity, the sugar cane/resin exhibits the highest value which is 61,857 Pa s/m2.
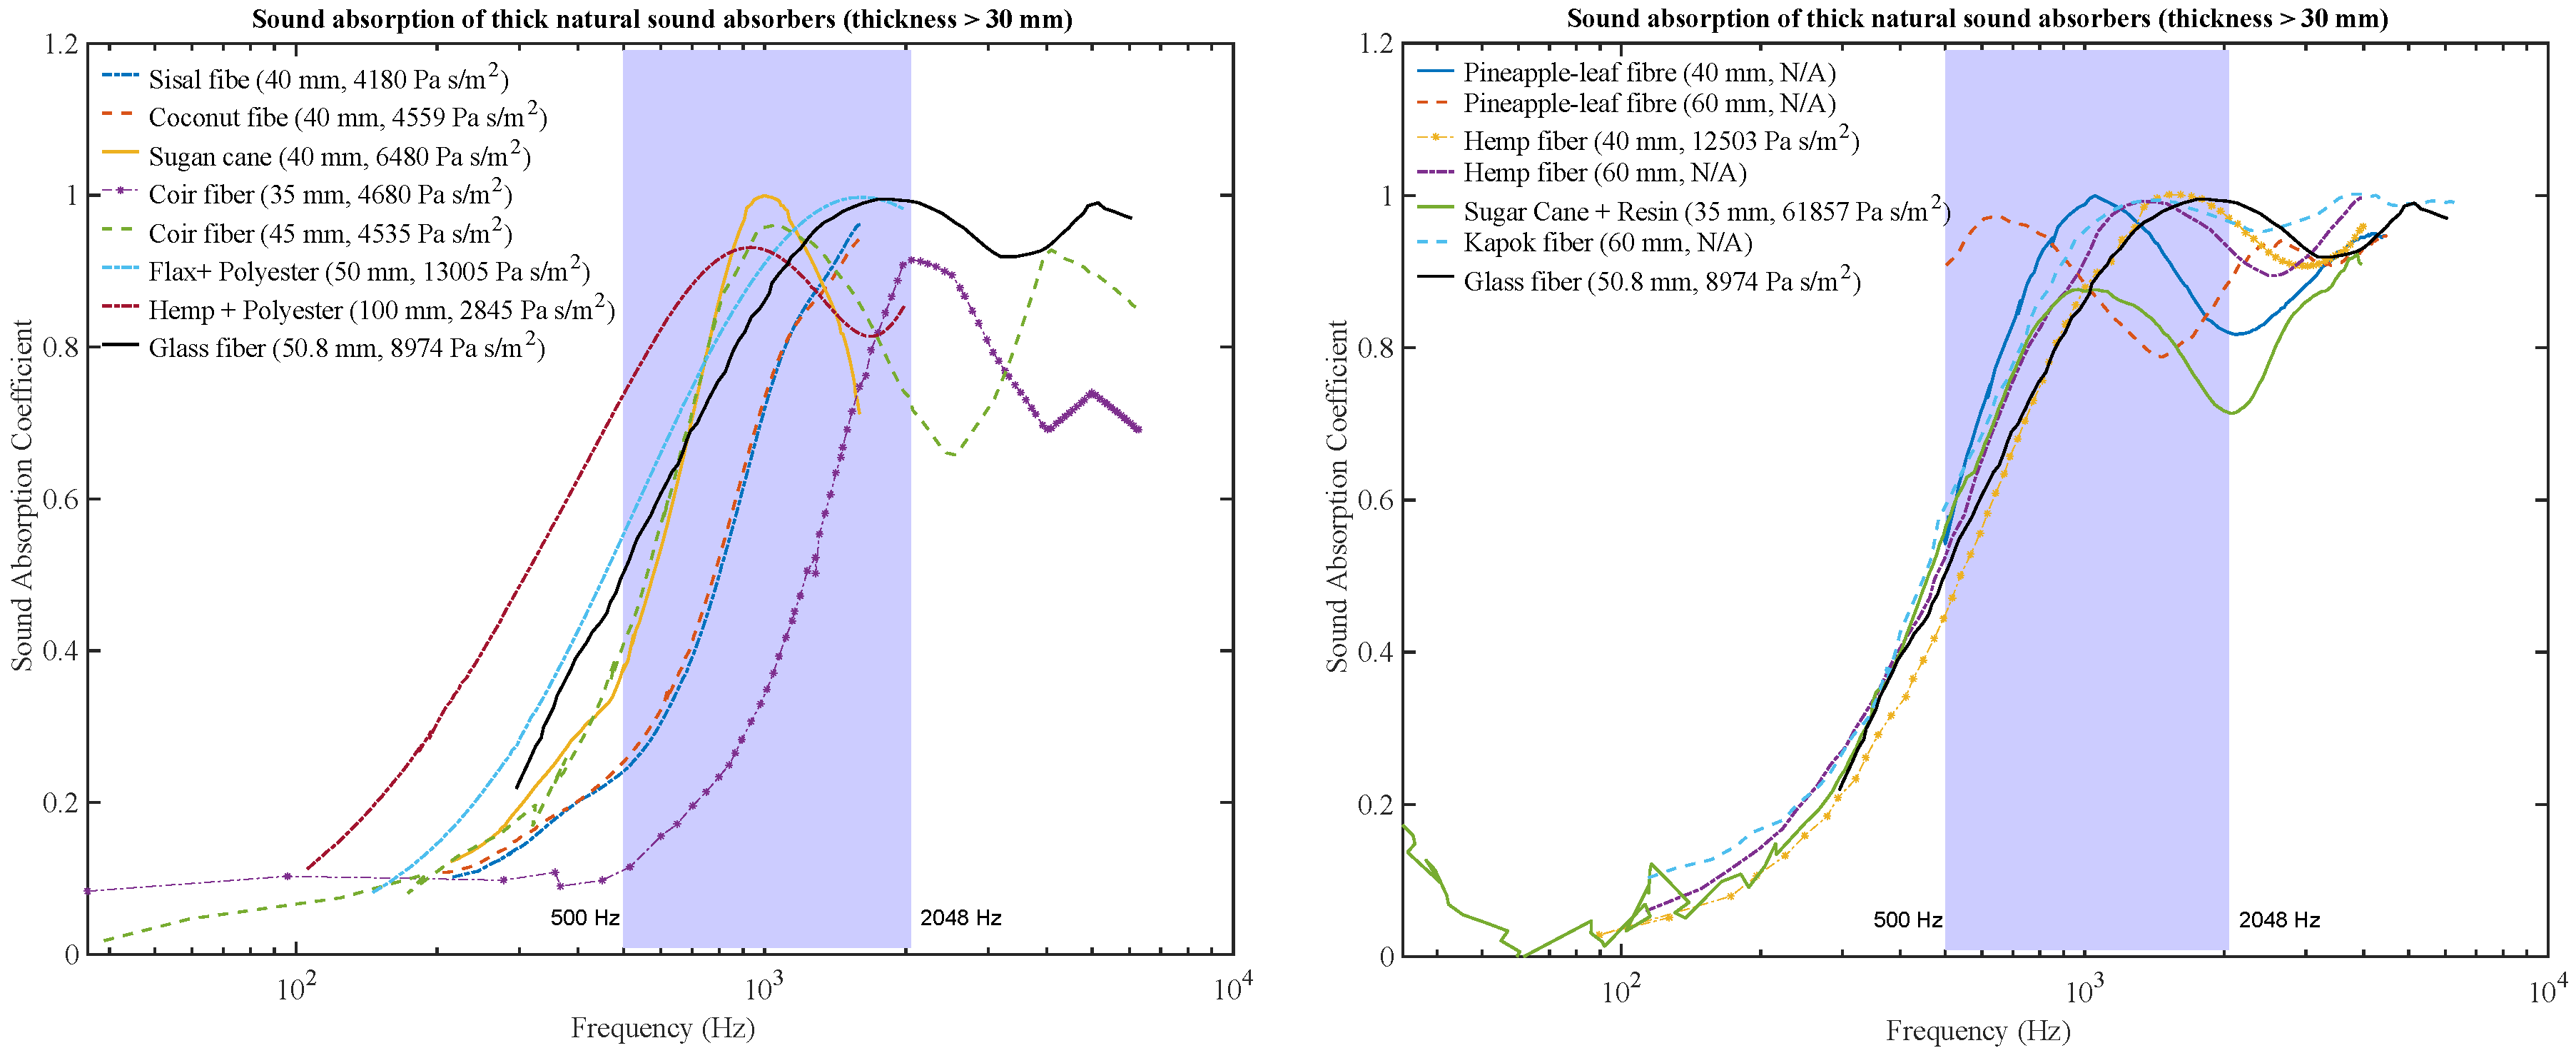
The sound absorption coefficients are demonstrated in Figure 19. It is obvious that most of the absorbers reach a peak value of sound absorption in the frequency of 500–2048 Hz. Additionally, thick sound absorbers have better sound absorption performances than those presented in Figure 18. Although the 30 mm thickness coconut husk composite does not show a good absorption, the 40 mm composite exhibits a better absorption coefficient. However, as frequency increases, the absorption coefficient shows a drop. In fact, sound absorption coefficients of most absorbers turn to drop after reaching the peaks. This is due to the resonance phenomena. Kapok fiber presents a relatively stable and high sound absorption not only in the frequency range of 500–2048 Hz but also in the high-frequency range. This can be explained by the small size and the special hollow structure (see in Figure 17). It can also be seen that flax/polyester composite (50 mm), coir fiber (45 mm), hemp/polyester composite (100 mm), pineapple-leaf fiber (40 mm), hemp fiber (60 mm) and kapok fiber (60 mm) are comparable to the glass fiber having 50.8 mm thickness. By taking account of their density and thickness, it can be found that density and thickness are not only the critical parameters to determine sound absorption performance. Fiber size and airflow resistivity are also significant. Additionally, density and thickness are very important for practical application, since lightweight and small size sound absorbers can be more widely used. Thus, it can be concluded the kapok fiber, pineapple-leaf fiber and hemp fiber can be the ideal alternatives to conventional materials (i.e., glass fiber).
5. Conclusions
The usage of natural fibers as sound absorbers can give a positive contribution to develop a competitive, resource efficient and low carbon economy due to the great advantages, such as easy availability, light weight, renewability, low CO2 emission, economical price and biodegradability. This paper reviewed different natural sound absorbers in the following categories: raw material, fiber assembly and composite. Besides, the comparison of sound absorption coefficient between natural sound absorbers and glass fiber was conducted. It was found that many different kinds of raw natural fibers, loose natural fiber assembly as filling materials, and natural fiber composited with other materials can be used as sound absorbers. The vertical greenery system gave a possibility of the usage of growing plants for noise reduction purposes. Some natural materials showed excellent sound absorption properties in the most sensitive frequency range of the human auditory system (i.e., 500–2048 Hz). It was concluded that kapok fiber, pineapple-leaf fiber and hemp fiber are the ideal alternatives to conventional sound absorbers. It should be noted that some shortcomings of natural fibers, such as large diameter, poor moisture resistance, poor anti-fungus property, low fire retardancy and poor fiber-matrix adhesion, could limit the commercial application of natural fiber. However, these shortcomings can be solved via proper fiber pretreatment. Although the sound absorption of natural fibers has been widely discussed, some aspects related to developing a reliable, robust and accurate model for predicting the sound absorption performance of natural fibers still can be further studied. Moreover, more efficient pretreatment methods with low environmental impact is meaningful to accelerate the usage of natural fibers in the building and automobile industries. Last but not least, involving the Life Cycle Assessment in natural fiber sound absorber development will benefit the long-term sustainable growth of natural fiber application.
Author Contributions
Conceptualization, T.Y.; Methodology, T.Y. and L.H.; Software, T.Y. and L.H.; Validation, T.Y., L.H. and X.X.; Formal analysis, T.Y. and X.X.; Investigation, T.Y., M.T.N. and L.H.; Resources, T.Y., M.P. and J.M.; Data curation, T.Y., X.X. and M.T.N.; Writing—original draft preparation, T.Y.; Writing—review and editing, T.Y. and L.H.; Visualization, T.Y.; Supervision, R.M., M.P. and J.M.; Project administration, M.P.; Funding acquisition, M.P. All authors have read and agreed to the published version of the manuscript.
Funding
The result was obtained through the financial support of the Ministry of Education, Youth and Sports of the Czech Republic and the European Union (European Structural and Investment Funds—Operational Programme Research, Development and Education) in the frames of the project “Modular platform for autonomous chassis of specialized electric vehicles for freight and equipment transportation”, Reg. No. CZ.02.1.01/0.0/0.0/16_025/0007293.
Conflicts of Interest
The authors declare no conflict of interest.
References
- Marquis-Favre, C.; Premat, C.; Aubrée, D.; Vallet, M. Noise and Its Effects—A Review on Qualitative Aspects of Sound. Part I: Notions and Acoustic Ratings. Acta Acust. United Acust. 2005, 91, 613–625. [Google Scholar]
- Marquis-Favre, C.; Premat, C.; Aubrée, D. Noise and Its Effects—A Review on Qualitative Aspects of Sound. Part II: Noise and Annoyance. Acta. Acust. United Acust. 2005, 91, 626–642. [Google Scholar]
- Cao, L.; Fu, Q.; Si, Y.; Ding, B.; Yu, J. Porous materials for sound absorption. Compos. Commun. 2018, 10, 25–35. [Google Scholar] [CrossRef]
- Na, Y.; Jeff, L.; Johni, C.; Gilsoo, C. Sound Absorption Coefficients of Micro-Fiber Fabrics by Reverberation Room Method. Text. Res. J. 2007, 77, 330–335. [Google Scholar] [CrossRef]
- Yang, T.; Xiong, X.; Mishra, R.; Novák, J.; Militký, J. Acoustic evaluation of Struto nonwovens and their relationship with thermal properties. Text. Res. J. 2018, 88, 426–437. [Google Scholar] [CrossRef]
- Papadopoulos, A.M. State of the art in thermal insulation materials and aims for future developments. Energy Build. 2005, 37, 77–86. [Google Scholar] [CrossRef]
- European Council Directive 67/548/EEC of 27 June 1967. On the approximation of laws, regulations and administrative provisions relating to the classification, packaging and labelling of dangerous substances. Off. J. Eur. Commun. 1967, 196, 1–98. [Google Scholar]
- Zhu, X.; Kim, B.J.; Wang, Q.W.; Wu, Q. Recent advances in the sound insulation properties of bio-based materials. BioResources 2014, 9, 1764–1786. [Google Scholar] [CrossRef] [Green Version]
- Yahya, M.N.; Sheng Chin, D.D.V. A Review on the Potential of Natural Fibre for Sound Absorption Application. In Proceedings of the IOP Conference Series: Materials Science and Engineering, Melaka, Malaysia, 6–7 May 2017; Volume 226, p. 012014. [Google Scholar]
- Asdrubali, F.; Schiavoni, S.; Horoshenkov, K.V. A Review of Sustainable Materials for Acoustic Applications. Build. Acoust. 2013, 19, 283–311. [Google Scholar] [CrossRef]
- Arenas, J.P.; Crocker, M.J. Recent trends in porous sound-absorbing materials. Sound Vib. 2010, 44, 12–18. [Google Scholar]
- Denton, M.J.; Daniels, P.N. Textile Terms and Definitions; Textile Institute: Manchester, UK, 2002. [Google Scholar]
- Chen, X. Modelling and Predicting Textile Behaviour; Woodhead Publishing: Cambridge, UK, 2009. [Google Scholar]
- Cox, T.J.; D’Antonio, P. Acoustic Absorbers and Diffusers: Theory, Design and Application, 3rd ed.; Taylor and Francis: New York, NY, USA, 2017. [Google Scholar]
- Zwikker, C.; Kosten, C.W. Sound Absorbing Materials; Elsevier: New York, NY, USA, 1949. [Google Scholar]
- Yang, T.; Mishra, R.; Horoshenkov, K.V.; Hurrell, A.; Saati, F.; Xiong, X. A study of some airflow resistivity models for multi-component polyester fiber assembly. Appl. Acoust. 2018, 139, 75–81. [Google Scholar]
- Xue, Y.; Bolton, J.S.; Gerdes, R.; Lee, S.; Herdtle, T. Prediction of airflow resistivity of fibrous acoustical media having two fiber components and a distribution of fiber radii. Appl. Acoust. 2018, 134, 145–153. [Google Scholar]
- Voronina, N. Acoustic properties of fibrous materials. Appl. Acoust. 1994, 42, 165–174. [Google Scholar] [CrossRef]
- Delany, M.E.; Bazley, E.N. Acoustical properties of fibrous absorbent materials. Appl. Acoust. 1970, 3, 105–116. [Google Scholar] [CrossRef]
- Miki, Y. Acoustical properties of porous materials-Modification of Delany-Bazley models. J. Acoust. Soc. Jpn. 1990, 11, 19–24. [Google Scholar] [CrossRef]
- Johnson, D.L.; Koplik, J.; Dashen, R. Theory of dynamic permeability and tortuosity in fluid saturated porous media. J. Fluid Mech. 1987, 176, 379–402. [Google Scholar] [CrossRef]
- Champoux, Y.; Allard, J.F. Dynamic tortuosity and bulk modulus in air-saturated porous media. J. Appl. Phys. 1991, 70, 1975–1979. [Google Scholar] [CrossRef]
- Lafarge, D.; Lemarinier, P.; Allard, J.F.; Tarnow, V. Dynamic compressibility of air in porous structures at audible frequencies. J. Acoust. Soc. Am. 1997, 102, 1995–2006. [Google Scholar] [CrossRef] [Green Version]
- Yang, T.; Xiong, X.; Venkataraman, M.; Mishra, R.; Novák, J.; Militký, J. Investigation on sound absorption properties of aerogel/polymer nonwovens. J. Text. Inst. 2019, 110, 196–201. [Google Scholar] [CrossRef]
- Yang, T.; Saati, F.; Horoshenkov, K.V.; Xiong, X.; Yang, K.; Mishra, R.; Marburg, S.; Militký, J. Study on the sound absorption behavior of multi-component polyester nonwovens: Experimental and numerical methods. Text. Res. J. 2019, 89, 3342–3361. [Google Scholar] [CrossRef]
- Doutres, O.; Salissou, Y.; Atalla, N.; Panneton, R. Evaluation of the acoustic and non-acoustic properties of sound absorbing materials using a three-microphone impedance tube. Appl. Acoust. 2010, 71, 506–509. [Google Scholar] [CrossRef] [Green Version]
- Jiang, N.; Chen, J.Y.; Parikh, D.V. Acoustical evaluation of carbonized and activated cotton nonwovens. Bioresour. Technol. 2009, 100, 6533–6536. [Google Scholar] [CrossRef] [PubMed]
- Horoshenkov, K.V. A review of acoustical methods for porous material characterisation. Int. J. Acoust. Vib. 2017, 22, 92–103. [Google Scholar] [CrossRef]
- Song, B.H.; Bolton, J.S. A transfer-matrix approach for estimating the characteristic impedance and wave numbers of limp and rigid porous materials. J. Acoust. Soc. Am. 2000, 107, 1131–1152. [Google Scholar] [CrossRef] [PubMed]
- Pispola, G.; Horoshenkov, K.V.; Asdrubali, F. Transmission loss measurement of consolidated granular media (L). J. Acoust. Soc. Am. 2005, 117, 2716–2719. [Google Scholar] [CrossRef] [PubMed] [Green Version]
- Salissou, Y.; Panneton, R.; Doutres, O. Complement to standard method for measuring normal incidence sound transmission loss with three microphones. J. Acoust. Soc. Am. 2012, 131, EL216–EL222. [Google Scholar] [CrossRef] [PubMed] [Green Version]
- Atalla, Y.; Panneton, R. Inverse Acoustical Characterization of Open Cell Porous Media Using Impedance Tube Measurement. Can. Acoust. 2005, 33, 11–24. [Google Scholar]
- Niskanen, M.; Groby, J.P.; Duclos, A.; Dazel, O.; Le Roux, J.C.; Poulain, N.; Huttunen, T.; Lähivaara, T. Deterministic and Statistical Characterization of Rigid Frame Porous Materials from Impedance Tube Measurements. J. Acoust. Soc. Am. 2017, 142, 2407–2418. [Google Scholar] [CrossRef]
- Yang, T.; Saati, F.; Groby, J.-P.; Xiong, X.; Petrů, M.; Mishra, R.; Militký, J.; Marburg, S. Characterization on Polyester Fibrous Panels and Their Homogeneity Assessment. Polymers 2020, 12, 2098. [Google Scholar] [CrossRef]
- ASTM E1050-19. Standard Test Method for Impedance and Absorption of Acoustical Materials Using a Tube, Two Microphones and a Digital Frequency Analysis System; American Society for Testing and Materials: West Conshohocken, PA, USA, 2019. [Google Scholar]
- ISO 10534-1. Acoustics—Determination of Sound Absorption Coefficient and Impedance in Impedance Tubes—Part 1: Method Using Standing Wave Ratio; International Organization for Standardization: Geneva, Switzerland, 1996. [Google Scholar]
- ISO 10534-2. Acoustics—Determination of Sound Absorption Coefficient and Impedance in Impedance Tubes—Part 2: Transfer-Function Method; International Organization for Standardization: Geneva, Switzerland, 1998. [Google Scholar]
- ASTM E2611-09. Standard Test Method for Measurement of Normal Incidence Sound Transmission of Acoustical Materials Based on the Transfer Matrix Method; American Society for Testing and Materials: West Conshohocken, PA, USA, 2009. [Google Scholar]
- Benedetto, G.; Spagnolo, R. Reverberation Time in Enclosures: The Surface Reflection Law and the Dependence of the Absorption Coefficient on the Angle of Incidence. J. Acoust. Soc. Am. 1985, 77, 1447–1451. [Google Scholar] [CrossRef]
- EN 20354. Acoustics-Measurement of Absorption in a Reverberation Room; European Committee for Standardisation: Brussels, Belgium, 1993. [Google Scholar]
- ASTM C 423-17. Sound Absorption and Sound Absorption Coefficients by the Reverberation Room Method; American Society for Testing and Materials: West Conshohocken, PA, USA, 2017. [Google Scholar]
- Oldham, D.J.; Egan, C.A.; Cookson, R.D. Sustainable acoustic absorbers from the biomass. Appl. Acoust. 2011, 72, 350–363. [Google Scholar] [CrossRef]
- Del Rey, R.; Uris, A.; Alba, J.; Candelas, P. Characterization of sheep wool as a sustainable material for acoustic applications. Materials 2017, 10, 1277. [Google Scholar] [CrossRef] [PubMed] [Green Version]
- Shtrepi, L.; Andrea, P. Towards a Sustainable Approach for Sound Absorption Assessment of Building Materials: Validation of Small-Scale Reverberation Room Measurements. Appl. Acoust. 2020, 165, 107304. [Google Scholar] [CrossRef]
- Del Rey, R.; Alba, J.; Bertó, L.; Gregori, A. Small-Sized Reverberation Chamber for the Measurement of Sound Absorption. Mater. Constr. 2017, 67, 1–9. [Google Scholar] [CrossRef] [Green Version]
- Drabek, P. Comparison of two internationally recognized methods for determining the sound absorption coefficient. In Proceedings of the MATEC Web of Conferences, Crete, Greece, 14–17 July 2017; Volume 125, pp. 1–4. [Google Scholar]
- Horoshenkov, K.V.; Khan, A.; Bécot, F.-X.; Jaouen, L.; Sgard, F.; Pompoli, F.; Prodi, N.; Bonfigli, P.; Pispola, G.; Asdrubali, F.; et al. Reproducibility Experiments on Measuring Acoustical Properties of Rigid-Frame Porous Media (Round-Robin Tests). J. Acoust. Soc. Am. 2007, 122, 345–353. [Google Scholar] [CrossRef]
- Scrosati, C.; Martellotta, F.; Pompoli, F.; Schiavi, A.; Prato, A.; D’Orazio, D.; Garai, M.; Granzotto, N.; Di Bella, A.; Scamoni, F.; et al. Towards More Reliable Measurements of Sound Absorption Coefficient in Reverberation Rooms: An Inter-Laboratory Test. Appl. Acoust. 2020, 165, 107298. [Google Scholar]
- Ryder, M.L. Report of textiles from Catal Hüyük’ Anatolian Studies. J. Br. Inst. Archaeol. 1965, 15, 175–176. [Google Scholar]
- Kozłowski, R.M. Handbook of Natural Fibers—Volume 1: Types, Properties and Factors Affecting Breeding and Cultivation; Woodhead Publishing: Cambridge, UK, 2020. [Google Scholar]
- Glé, P.; Gourdon, E.; Arnaud, L. Modelling of the acoustical properties of hemp particles. Constr. Build. Mater. 2012, 37, 801–811. [Google Scholar] [CrossRef]
- Glé, P.; Gourdon, E.; Arnaud, L.; Horoshenkov, K.V.; Khan, A. The effect of particle shape and size distribution on the acoustical properties of mixtures of hemp particles. J. Acoust. Soc. Am. 2013, 134, 4698–4709. [Google Scholar] [CrossRef]
- Arenas, J.P.; Del Rey, R.; Alba, J.; Oltra, R. Sound-Absorption Properties of Materials Made of Esparto Grass Fibers. Sustainability 2020, 12, 5533. [Google Scholar] [CrossRef]
- Iannace, G.; Ciaburro, G.; Trematerra, A. Modelling sound absorption properties of broom fibers using artificial neural networks. Appl. Acoust. 2020, 163, 107239. [Google Scholar] [CrossRef]
- Putra, A.; Khair, F.A.; Nor, M.J.M. Utilizing Hollow-Structured Bamboo as Natural Sound Absorber. Arch. Acoust. 2015, 40, 601–608. [Google Scholar] [CrossRef] [Green Version]
- Tang, X.; Zhang, X.; Zhang, H.; Zhuang, X.; Yan, X. Corn husk for noise reduction: Robust acoustic absorption and reduced thickness. Appl. Acoust. 2018, 134, 60–68. [Google Scholar]
- Tang, X.; Liu, X.; Yan, X. Investigation on the Sound Absorption Properties of Waste Green Tea Residues Covered by Woven Fabric. J. Nat. Fibers 2020. [Google Scholar] [CrossRef]
- Zunaidi, N.H.; Tan, W.H.; Majid, M.S.A.; Lim, E.A. Effect of physical properties of natural fibre on the sound absorption coefficient. J. Phys. Conf. Ser. 2017, 908, 1–6. [Google Scholar] [CrossRef]
- Horoshenkov, K.V.; Khan, A.; Benkreira, H. Acoustic properties of low growing plants. J. Acoust. Soc. Am. 2013, 133, 2554–2565. [Google Scholar] [CrossRef] [PubMed]
- Wong, N.H.; Kwang Tan, T.; Tan, P.Y.; Chiang, K.; Wong, N.C. Acoustics evaluation of vertical greenery systems for building walls. Build. Environ. 2010, 45, 411–420. [Google Scholar] [CrossRef]
- Azkorra, Z.; Pérez, G.; Coma, J.; Cabeza, L.F.; Bures, S.; Álvaro, J.E.; Erkoreka, A.; Urrestarazu, M. Evaluation of Green Walls as a Passive Acoustic Insulation System for Buildings. Appl. Acoust. 2015, 89, 46–56. [Google Scholar] [CrossRef] [Green Version]
- Santoni, A.; Fausti, P.; Marescotti, C.; Mazzanti, V.; Mollica, F.; Pompoli, F.; Bonfiglio, P. Improving the sound absorption performance of sustainable thermal insulation materials: Natural hemp fibres. Appl. Acoust. 2019, 150, 279–289. [Google Scholar]
- Berardi, U.; Iannace, G. Acoustic characterization of natural fibers for sound absorption applications. Build. Environ. 2015, 94, 840–852. [Google Scholar] [CrossRef]
- Putra, A.; Or, K.H.; Selamat, M.Z.; Nor, M.J.M.; Hassan, M.H.; Prasetiyo, I. Sound absorption of extracted pineapple-leaf fibres. Appl. Acoust. 2018, 136, 9–15. [Google Scholar]
- Sari, N.H.; Wardana, I.N.G.; Irawan, Y.S.; Siswanto, E. Physical and Acoustical Properties of Corn Husk Fiber Panels. Adv. Acoust. Vib. 2016, 2016, 1–8. [Google Scholar] [CrossRef] [Green Version]
- Yang, S.; Yu, W.; Ning, P. Investigation of the sound-absorbing behavior of fiber assemblies. Text. Res. J. 2010, 81, 673–682. [Google Scholar] [CrossRef]
- Or, K.H.; Putra, A.; Selamat, M.Z. Oil palm empty fruit bunch fibres as sustainable acoustic absorber. Appl. Acoust. 2017, 119, 9–16. [Google Scholar]
- Raj, M.; Fatima, S.; Tandon, N. An Experimental and Theoretical Study on Environment-Friendly Sound Absorber Sourced from Nettle Fibers. J. Build. Eng. 2020, 31, 101395. [Google Scholar] [CrossRef]
- Koruk, H.; Genc, G. Investigation of the Acoustic Properties of Bio Luffa Fiber and Composite Materials. Mater. Lett. 2015, 157, 166–168. [Google Scholar] [CrossRef] [Green Version]
- Samaei, S.E.; Mahabadi, H.A.; Mousavi, S.M.; Khavanin, A.; Faridan, M.; Taban, E. The influence of alkaline treatment on acoustical, morphological, tensile and thermal properties of Kenaf natural fibers. J. Ind. Text. 2020. [Google Scholar] [CrossRef]
- Soltani, P.; Taban, E.; Faridan, M.; Samaei, S.E.; Amininasab, S. Experimental and computational investigation of sound absorption performance of sustainable porous material: Yucca Gloriosa fiber. Appl. Acoust. 2020, 157, 106999. [Google Scholar] [CrossRef]
- Da Silva, C.C.B.; Terashima, F.J.H.; Barbieri, N.; De Lima, K.F. Sound absorption coefficient assessment of sisal, coconut husk and sugar cane fibers for low frequencies based on three different methods. Appl. Acoust. 2019, 156, 92–100. [Google Scholar]
- Othmani, C.; Taktak, M.; Zain, A.; Hantati, T.; Dauchez, N.; Elnady, T.; Fakhfakh, T.; Haddar, M. Acoustic characterization of a porous absorber based on recycled sugarcane wastes. Appl. Acoust. 2017, 120, 90–97. [Google Scholar]
- Taban, E.; Tajpoor, A.; Faridan, M.; Samaei, S.E.; Beheshti, M.H. Acoustic Absorption Characterization and Prediction of Natural Coir Fibers. Acoust. Aust. 2019, 47, 67–77. [Google Scholar] [CrossRef]
- Qui, H.; Enhui, Y. Effect of Thickness, Density and Cavity Depth on the Sound Absorption Properties of Wool Boards. Autex. Res. J. 2018, 18, 203–208. [Google Scholar] [CrossRef] [Green Version]
- Patnaik, A.; Mvubu, M.; Muniyasamy, S.; Botha, A.; Anandjiwala, R.D. Thermal and sound insulation materials from waste wool and recycled polyester fibers and their biodegradation studies. Energy Build. 2015, 92, 161–169. [Google Scholar] [CrossRef]
- Piégay, C.; Glé, P.; Gourdon, E.; Gourlay, E.; Marceau, S. Acoustical model of vegetal wools including two types of fibers. Appl. Acoust. 2018, 129, 36–46. [Google Scholar]
- Buratti, C.; Belloni, E.; Lascaro, E.; Merli, F.; Ricciardi, P. Rice husk panels for building applications: Thermal, acoustic and environmental characterization and comparison with other innovative recycled waste materials. Constr. Build. Mater. 2018, 171, 338–349. [Google Scholar] [CrossRef]
- Liu, X.; Yan, X.; Zhang, H. Effects of pore structure on sound absorption of kapok-based fiber nonwoven fabrics at low frequency. Text. Res. J. 2016, 86, 739–748. [Google Scholar] [CrossRef]
- Fatima, S.; Mohanty, A.R. Acoustical and fire-retardant properties of jute composite materials. Appl. Acoust. 2011, 72, 108–114. [Google Scholar] [CrossRef]
- Küçük, M.; Korkmaz, Y. The effect of physical parameters on sound absorption properties of natural fiber mixed nonwoven composites. Text. Res. J. 2012, 82, 2043–2053. [Google Scholar] [CrossRef]
- Ali, M. Microstructure, Thermal Analysis and Acoustic Characteristics of Calotropis Procera (Apple of Sodom) Fibers. J. Nat. Fibers. 2016, 13, 343–352. [Google Scholar] [CrossRef]
- Mamtaz, H.; Fouladi, M.H.; Al-Atabi, M.; Namasivayam, S.N. Acoustic absorption of natural fiber composites. J. Eng. 2016, 2016, 1–11. [Google Scholar] [CrossRef] [Green Version]
- Dong, T.; Xu, G.; Wang, F. Adsorption and adhesiveness of kapok fiber to different oils. J. Hazard. Mater. 2015, 296, 101–111. [Google Scholar] [CrossRef] [PubMed]
- Ganesan, P.; Karthik, T. Development of acoustic nonwoven materials from kapok and milkweed fibres. J. Text. Inst. 2016, 107, 477–482. [Google Scholar] [CrossRef]
- Attenborough, K. Sound Dissipation in Porous Media. Ph.D. Thesis, Department of Civil Engineering, The University of Leeds, Leeds, UK, 1969. [Google Scholar]
- Bravo, T.; Maury, C. Sound Attenuation and Absorption by Anisotropic Fibrous Materials: Theoretical and Experimental Study. J. Sound Vib. 2018, 417, 165–181. [Google Scholar] [CrossRef]
- Dobie, R.A.; Van, H.S. Hearing Loss: Determining Eligibility for Social Security Benefits; National Research Council (US) Committee on Disability Determination for Individuals with Hearing Impairments, Ed.; National Academies Press (US): Washington, DC, USA, 2004. [Google Scholar]
- Zakriya, M.; Ramakrishnan, G.; Gobi, N.; Palaniswamy, N.K.; Srinivasan, J. Jute-reinforced non-woven composites as a thermal insulator and sound absorber—A review. J. Reinf. Plast. Compos. 2017, 36, 206–213. [Google Scholar] [CrossRef]
- Strobel, J.; Wigley, E.; Evans, N.; Hung, W. BUZZ–Acoustical engineering methodologies to measure student engagement. Proc. Res. Eng. Educ. Symp. 2009, 1, 1–6. [Google Scholar]
- Othmani, C.; Taktak, M.; Zein, A.; Hentati, T.; Elnady, T.; Fakhfakh, T.; Haddar, M.D. Experimental and Theoretical Investigation of the Acoustic Performance of Sugarcane Wastes Based Material. Appl. Acoust. 2016, 109, 90–96. [Google Scholar]
- Xiang, H.F.; Wang, D.; Liua, H.C.; Zhao, N.; Xu, J. Investigation on sound absorption properties of kapok fibers. Chin. J. Polym. Sci. 2013, 31, 521–529. [Google Scholar] [CrossRef]
Figure 1.
The experimental setups of impedance tubes: (a) two-microphone tube [25], (b) three-microphone tube [26], and (c) four-microphone tube [27]. Reproduced with permission from Elsevier Ltd. and SAGE Publishing.

Figure 2.
A reverberation chamber at the EPS Gandia at the Universitat Politécnica de València [43].
Figure 2.
A reverberation chamber at the EPS Gandia at the Universitat Politécnica de València [43].

Figure 3.
Classification of natural fibers in the categories of vegetable and animal [50].
Figure 3.
Classification of natural fibers in the categories of vegetable and animal [50].

Figure 4.
Hemp particles: (a) characteristic dimension of the particles, and (b) configuration of the particles in a cylindrical tube [51]. Reproduced with permission from Elsevier Ltd.
Figure 4.
Hemp particles: (a) characteristic dimension of the particles, and (b) configuration of the particles in a cylindrical tube [51]. Reproduced with permission from Elsevier Ltd.

Figure 5.
Three different esparto grass fibers from: (a) Pakistan, (b) Tunisia, and (c) Egypt [53].
Figure 5.
Three different esparto grass fibers from: (a) Pakistan, (b) Tunisia, and (c) Egypt [53].

Figure 6.
Different diameter broom branches: (a) 1.5 mm, (b) 3 mm, (c) 4 mm, and the arrangement of bamboo in impedance tube: (d) axial arrangement, (e) transverse arrangement, and (f) cross transverse arrangement [54,55]. Reproduced with permission from Elsevier Ltd. and IPPT PAN.

Figure 7.
The preparation procedure of corn husk samples: (a) corn crops, (b) mature corn cob, (c) corn husk, and (d) circular corn husk sample [56]. Reproduced with permission from Elsevier Ltd.
Figure 7.
The preparation procedure of corn husk samples: (a) corn crops, (b) mature corn cob, (c) corn husk, and (d) circular corn husk sample [56]. Reproduced with permission from Elsevier Ltd.

Figure 8.
Impedance tube measurement of the growing plant: (a) soil sample, (b) plant sample, and (c) plant sample with soil [59]. Reproduced with permission from American Acoustical Society of America.
Figure 8.
Impedance tube measurement of the growing plant: (a) soil sample, (b) plant sample, and (c) plant sample with soil [59]. Reproduced with permission from American Acoustical Society of America.

Figure 9.
Vertical greenery system with different coverage densities: (a) empty, (b) 43%, (c) 71% and (d) 100% [60]. The used plant is Nephrolepis exaltata (Boston fern). Reproduced with permission from Elsevier Ltd.
Figure 9.
Vertical greenery system with different coverage densities: (a) empty, (b) 43%, (c) 71% and (d) 100% [60]. The used plant is Nephrolepis exaltata (Boston fern). Reproduced with permission from Elsevier Ltd.

Figure 10.
Hemp fibers for impedance tube measurement: (a) loose hemp fibers, (b) hemp fibers within the test rig, and (c) metallic mesh used to restrain the fibers in sample holder [62]. Reproduced with permission from Elsevier Ltd.
Figure 10.
Hemp fibers for impedance tube measurement: (a) loose hemp fibers, (b) hemp fibers within the test rig, and (c) metallic mesh used to restrain the fibers in sample holder [62]. Reproduced with permission from Elsevier Ltd.

Figure 11.
Comparison between numerical and experimental normal incidence sound absorption coefficient of the hemp fibrous material at each stage of the manufacturing process: (a) carding process, (b) alkaline treatment, (c) wide tooth combing, and (d) fine tooth combing [62]. Reproduced with permission from Elsevier Ltd.

Figure 12.
The pineapple plant and the leaves’ fiber extraction: (a) pineapple plant at a farm in Malaysia, (b) pineapple leaves, (c) raw pineapple-leaf fiber, (d) the fibers treated within 1% sodium hydroxide solution, and (e) the treated fibers [64]. Reproduced with permission from Elsevier Ltd.
Figure 12.
The pineapple plant and the leaves’ fiber extraction: (a) pineapple plant at a farm in Malaysia, (b) pineapple leaves, (c) raw pineapple-leaf fiber, (d) the fibers treated within 1% sodium hydroxide solution, and (e) the treated fibers [64]. Reproduced with permission from Elsevier Ltd.

Figure 13.
Sample preparation of Yucca Gloriosa fiber [71]. Reproduced with permission from Elsevier Ltd.
Figure 13.
Sample preparation of Yucca Gloriosa fiber [71]. Reproduced with permission from Elsevier Ltd.

Figure 14.
Natural fiber composite samples: (a) sisal, (b) coconut husk, and (c) sugar cane [72]. Reproduced with permission from Elsevier Ltd.
Figure 14.
Natural fiber composite samples: (a) sisal, (b) coconut husk, and (c) sugar cane [72]. Reproduced with permission from Elsevier Ltd.

Figure 15.
Wool board: (a) preparation procedure, and (b) wool board [75].
Figure 15.
Wool board: (a) preparation procedure, and (b) wool board [75].

Figure 16.
Rice husk composite samples for impedance tube measurement [78]. Reproduced with permission from Elsevier Ltd.
Figure 16.
Rice husk composite samples for impedance tube measurement [78]. Reproduced with permission from Elsevier Ltd.

Figure 17.
SEM images of kapok fiber: (a) cross-section, and (b) longitudinal section [84]. Reproduced with permission from Elsevier Ltd.
Figure 17.
SEM images of kapok fiber: (a) cross-section, and (b) longitudinal section [84]. Reproduced with permission from Elsevier Ltd.

Figure 18.
Comparison of sound absorption of thin natural fiber sound absorbers.

Figure 19.
Comparison of sound absorption of thick natural fiber sound absorbers.


Table 1.
A general comparison between different impedance tubes.
| Impedance Tube | Measured Parameter | Main Technique | Standard [35,36,37,38] |
|---|---|---|---|
| Two-microphone | Sound absorption coefficient (), Reflection coefficient () and Surface impedance () | Standing wave ratio method and transfer function method | ASTM E1050, ISO 10534-1 and ISO 10534-2 |
| Three-microphone | Sound absorption coefficient (), Reflection coefficient (), Surface impedance (), Transmission loss (), Dynamic density () and Dynamic bulk modulus () | Transfer function method and two-load method | ASTM E1050, ISO 10534-1, ISO 10534-2 and ASTM E2611 |
| Four-microphone | Two-load method | ASTM E1050, ISO 10534-2 and ASTM E2611 |
Table 2.
A summary of studies of raw natural fiber sound absorbers.
| Researcher | Raw Material | Key Findings |
|---|---|---|
| Glé et al. [51,52] | Hemp particle | The acoustical properties of hemp particles can be predicted based on the characteristics and configuration of the particles. Particle size distribution has a positive effect on the sound absorption at low-frequency range. |
| Arenas et al. [53] | Esparto grass | The sound absorption of raw esparto grass is comparable to traditional glass fiber materials with equivalent thickness. |
| Iannace et al. [54] | Broom branch | Broom branch with small diameter has worse sound absorption performance than thicker broom branches. |
| Putra et al. [55] | Bamboo | Transverse arranged bamboo showed better sound absorption then axial arranged samples. |
| Tang et al. [56] | Corn husk | Corn husk has robust sound absorption because of its groove structure. |
| Tang et al. [57] | Green tea residues | The waste green tea residues can be used for sound absorption as filling materials. |
| Zunaidi et al. [58] | Rice straw | Rice straw fiber can absorb sound effectively. Fiber mass and diameter have a significant effect on the sound absorption coefficient. |
| Horoshenkov et al. [59] | Growing plants | Leaf area density and dominant angle of leaf orientation are two key morphological characteristics for the acoustical properties. |
| Wong et al. [60] | Vertical greenery systems | The vertical greenery system is one of the best sound absorbers compared with other building materials and furnishings. |
Table 3.
A summary of studies of natural fiber assembly sound absorbers.
| Researcher | Fiber Assembly | Key Findings |
|---|---|---|
| Santoni et al. [62] | Hemp fiber | An alkaline treatment performed on the hemp fiber after two combing processes can modify the morphology, then the acoustical performance can be further improved. |
| Berardi and Iannace [63] | Kenaf fiber | Increasing the density from 50 kg/m3 to 100 kg/m3 results in sound absorption increasing at the frequency range of 200–2000 Hz. |
| Wood fiber | Wood fiber sample with 6 cm thickness exhibits high sound absorption coefficient at 500 Hz and 1650 Hz. | |
| Coconut fiber | Raw coconut fiber has good sound absorption coefficient at both low and medium frequencies. | |
| Sheep wool | The sound absorption coefficient of sheep wool is high at medium and high frequencies, with a homogenous behavior. | |
| Putra et al. [64] | Pineapple-leaf fiber | The pineapple-leaf fiber has comparable sound absorption coefficients with those of mineral wool and synthetic polyurethane foam. |
| Sari et al. [65] | Corn husk fiber | The 20 mm thickness corn husk fiber panels treated in 2% and 5% showed 100% sound absorption in the low-frequency range from 1600 Hz to 3250 Hz. |
| Yang et al. [66] | Cashmere fiber | The sound absorption of cashmere fibers increased gradually with increased density. |
| Goose down | Goose down has much better sound absorption performance than those of cashmere fibers and acrylic fibers with the same density (i.e., ~11.8 kg/m3). | |
| Kapok fiber | The sound absorption of kapok fiber has a small difference in the density range of 11.8–47.2 kg/m3. | |
| Oldham et al. [42] | Cotton fiber | Cotton fiber has similar sound absorption properties with rock wool and glass fiber. |
| Jute fiber | Although jute fiber has a larger diameter, the sound absorption characteristics are similar to wool fiber. | |
| Sisal fiber | The sound absorption property of sisal fiber is relatively poor. | |
| Or et al. [67] | Oil palm empty fruit bunch fiber | The fiber assembly with thicknesses of 40 mm and 50 mm having a density of 292 kg/m3 exhibited good sound absorption with a coefficient of 0.9 on average above 1 kHz. |
| Raj et al. [68] | Nettle fiber | Nettle fiber needle punched nonwoven with 56 mm thickness and 90 kg/m3 density showed an optimum sound absorption. |
| Koruk and Genc [69] | Luffa fiber | Sound absorption coefficients of a luffa fiber sample with a small thickness (12 mm) was quite high. |
Table 4.
A summary of studies of natural fiber composite sound absorbers.
| Researcher | Composite | Production Method | Key Findings |
|---|---|---|---|
| Samaei et al. [70] | kenaf fiber + polyvinyl alcohol (PVA) | Glued together under pressure | The kenaf fiber treated in 6% concentration of NaOH had thinner diameter, better appearance and superior sound absorption than untreated fiber. |
| Soltani et al. [71] | Yucca Gloriosa fiber + PVA | Glued together under pressure | The Johnson–Champoux–Allard model can precisely predict the acoustical properties of Yucca Gloriosa (YG) fiber. The YG fiber absorbed the sound effectively. |
| Da Silva et al. [72] | Sisal fiber (or coconut husk) + PVA | Glued together under pressure | The sisal and coconut husk composites exhibited similar values of sound absorption although they have different microscopic structures. |
| Othmani et al. [73] | Sugar cane + Resin | Glued together | Sugar cane is a good sound absorber at medium and high frequencies. |
| Taban et al. [74] | Coir fiber + PVA | Glued together under pressure | Thicker coir fiber composite has a higher sound absorption coefficient. The Johnson–Champoux–Allard model can be used to predict the acoustic behavior of coir fiber composite. |
| Qui et al. [75] | Coarse wool + Binding fibers | Laminated by heat pressing | Wool composite has an excellent sound absorption property |
| Patnaik et al. [76] | Waste wool + recycled polyester fiber (RPET) | Needle punched | The RPET/waste wool composite exhibits the best sound absorption, thermal insulation, moisture absorption and fire properties. |
| Piégay et al. [77] | Flax fiber + Polyester fiber | Thermal bonded | The sound absorption performance of flax fiber/polyester fiber composite is excellent in the frequency range of 1000–2000 Hz. |
| Hemp fiber + Polyester fiber | Thermal bonded | Hemp fiber/polyester fiber composite has poor mid-frequency sound absorption performance although it has two times the thickness of flax fiber/polyester fiber composite. | |
| Buratti et al. [78] | Rice husk + Polyurethane glue | Glued together | The rice husk composite in general presented better sound absorption properties than those of loose rice husk. |
| Liu et al. [79] | Kapok fiber + Polyester fiber | Needle punched | Smaller pore diameter or greater porosity showed better sound absorption at low frequency for kapok composite. |
| Fatima and Mohanty [80] | Jute fiber + Natural rubber latex | Glued together | Jute composite shows more significant acoustical attenuation properties than glass fiber. |
| Küçük and Korkmaz [81] | Cotton + Polyester | Thermal bonded | The cotton/polyester composite resulted in the best sound absorption coefficient in the mid-to-high frequency ranges. |
| Ali [82] | Calotropis + Resin | Glued together | High density Calotropis composite exhibited a good sound abruption behavior at high frequencies. |
Table 5.
Specifications of the thin (i.e., thickness ≤ 30 mm) natural fiber sound absorbers and glass fiber.
Table 5.
Specifications of the thin (i.e., thickness ≤ 30 mm) natural fiber sound absorbers and glass fiber.
| Material | Thickness mm | Porosity % | Bulk Density kg/m3 | Fiber Diameter μm | Airflow Resistivity Pa s/m2 | Measured Frequency Hz | Reference |
|---|---|---|---|---|---|---|---|
| Glass fiber | 25.4 | 98.7 | 28.8 | 7 | 8974 | 300–5000 | [86,87] |
| Kenaf fiber + PVA | 30 | >85 | 200 | 68.23 ± 5.65 | 6210 | 63–6300 | [70] |
| Yucca Gloriosa fiber | 30 | 85.24 | 200 | 130.8 | 17,730 | 63–6300 | [71] |
| Sisal fiber + PVA | 20 | N/A | 214.6 ± 8.8 | 202 ± 64 | 4180 ± 336 | 172–2000 | [72] |
| 30 | N/A | 214.6 ± 8.8 | 202 ± 64 | 4180 ± 336 | |||
| Coconut husk + PVA | 20 | N/A | 202.3 ± 14.6 | 190 ± 69 | 4559 ± 387 | ||
| 30 | N/A | 202.3 ± 14.6 | 190 ± 69 | 4559 ± 387 | |||
| Sugar cane + PVA | 20 | N/A | 200.8 ± 10.8 | 384 ± 134 | 6480 ± 796 | ||
| 30 | N/A | 200.8 ± 10.8 | 384 ± 134 | 6480 ± 796 | |||
| Coir fiber | 25 | 75.23 | 130 | 263 | 4810 | 63–6300 | [74] |
| Coarse wool + Binding fibers | 12 | N/A | 249.54 | >50 | N/A | 60–6300 | [75] |
| 18 | N/A | 249.54 | >50 | N/A | |||
| 24 | N/A | 249.54 | >50 | N/A | |||
| Pineapple-leaf fiber | 10 | N/A | 117 | N/A | N/A | 500–4500 | [64] |
| 20 | N/A | 117 | N/A | N/A | |||
| 30 | N/A | 117 | N/A | N/A | |||
| Rice husk + Glue | 15 | 59.7 | 170 | N/A | N/A | 200–6400 | [78] |
| Hemp fiber | 25 | N/A | 141 | 18.4 | N/A | 1000–4500 | [62] |
| 30 | N/A | 117 | 18.4 | N/A |
Table 6.
Specifications of the thick (i.e., thickness > 30 mm) natural fiber sound absorbers and glass fiber.
Table 6.
Specifications of the thick (i.e., thickness > 30 mm) natural fiber sound absorbers and glass fiber.
| Material | Thickness mm | Porosity % | Bulk Density kg/m3 | Fiber Diameter μm | Airflow Resistivity Pa s/m2 | Measured Frequency Hz | Reference |
|---|---|---|---|---|---|---|---|
| Glass fiber | 50.8 | 98.7 | 28.8 | 7 | 8974 | 300–6000 | [86,87] |
| Sisal fiber + PVA | 40 | N/A | 214.6 ± 8.8 | 202 ± 64 | 4180 ± 336 | 172–2000 | [72] |
| Coconut husk + PVA | 40 | N/A | 202.3 ± 14.6 | 190 ± 69 | 4559 ± 387 | ||
| Sugar cane + PVA | 40 | N/A | 200.8 ± 10.8 | 384 ± 134 | 6480 ± 796 | ||
| Sugar cane + Resin | 35 | N/A | N/A | 500–700 | 61,857 | 50–4000 | [91] |
| Coir fiber | 35 | 76.12 | 130 | 263 | 4680 | 63–6300 | [74] |
| Coir fiber | 45 | 76.90 | 130 | 263 | 4535 | ||
| Flax + Polyester | 50 | N/A | 67 | 26.4 | 13,005 ± 260 | 143–1993 | [77] |
| Hemp + Polyester | 100 | N/A | 45 | 44.2 | 2845 ± 70 | ||
| Hemp fiber | 40 | N/A | 88 | 18.4 | 12,503 | 500–4500 | [62] |
| 60 | N/A | 59 | 18.4 | N/A | |||
| Pineapple-leaf fiber | 40 | N/A | 117 | N/A | N/A | 500–4500 | [64] |
| 60 | N/A | 117 | N/A | N/A | |||
| Kapok fiber | 60 | 97.7 | 8.3 | 15–23 | N/A | 100–6300 | [92] |
Publisher’s Note: MDPI stays neutral with regard to jurisdictional claims in published maps and institutional affiliations. |
© 2020 by the authors. Licensee MDPI, Basel, Switzerland. This article is an open access article distributed under the terms and conditions of the Creative Commons Attribution (CC BY) license (http://creativecommons.org/licenses/by/4.0/).
Share and Cite
MDPI and ACS Style
Yang, T.; Hu, L.; Xiong, X.; Petrů, M.; Noman, M.T.; Mishra, R.; Militký, J. Sound Absorption Properties of Natural Fibers: A Review. Sustainability 2020, 12, 8477. https://0-doi-org.brum.beds.ac.uk/10.3390/su12208477
AMA Style
Yang T, Hu L, Xiong X, Petrů M, Noman MT, Mishra R, Militký J. Sound Absorption Properties of Natural Fibers: A Review. Sustainability. 2020; 12(20):8477. https://0-doi-org.brum.beds.ac.uk/10.3390/su12208477
Chicago/Turabian StyleYang, Tao, Lizhu Hu, Xiaoman Xiong, Michal Petrů, Muhammad Tayyab Noman, Rajesh Mishra, and Jiří Militký. 2020. "Sound Absorption Properties of Natural Fibers: A Review" Sustainability 12, no. 20: 8477. https://0-doi-org.brum.beds.ac.uk/10.3390/su12208477
Note that from the first issue of 2016, this journal uses article numbers instead of page numbers. See further details here.