Moose Management Strategies under Changing Legal and Institutional Frameworks


1
Laboratory of Mammalian Ecology, Nature Research Centre, Akademijos 2, 08412 Vilnius, Lithuania
2
Faculty of Economics, Kindai University, 4-1 Kowakae 3-chome, Higashiosaka, Osaka 577-8502, Japan
*
Author to whom correspondence should be addressed.
Sustainability 2020, 12(20), 8482; https://0-doi-org.brum.beds.ac.uk/10.3390/su12208482
Submission received: 1 September 2020
/
Revised: 7 October 2020
/
Accepted: 12 October 2020
/
Published: 14 October 2020
(This article belongs to the Special Issue Mammal Status: Diversity, Abundance and Dynamics)
Abstract
:Moose (Alces alces) management strategies in Lithuania, East Europe, were analyzed. The study was intended to show the (un)sustainability of the current management approach in relation to changes in hunting rules, hunting organization and development of the responsible administrative bodies. Moose population and bag dynamics were analyzed using I index in connected scatterplots and compound annual growth rates (CAGR). In 1962–2020, the CAGR of the moose population was 3.84%, resulting in a population size increase of nearly 10 times. The seesaw principle in moose management was confirmed, showing three periods of population decrease (1973–1977, 1989–1995, 2000–2005), and two periods of hunting bag decrease (1976–1978 and 1990–1993). All decline phases were related to legal and administrative issues in the country. Since 2006, population growth has not been controlled. Lithuania has no long-term strategy of the moose population management at any administrative level. The current management approach is not sustainable, as it has not ensured long-term stability of the moose population. The current continuous growth of population, followed by only a moderate increase in the hunting bag, is related to the possibility for owners to adopt long-term planning of the hunting plot units.
1. Introduction
Almost all of Europe is populated by ungulates; their populations are expanding due to changes in land use (reforestation, abandonment of agricultural lands) [1], reintroductions, legislative changes and management approaches [2]. Of the ungulates, the moose (Alces alces L.) is one of the biggest and has a circumpolar species distribution [3,4]. The species inhabits tundra, taiga, boreal and temperate zones, and is found in woodland habitats, wetlands and swamps. Mosaic and second-growth forests are preferred [4]. Farmland and pastures are used when adjacent to forests [5].
In North America, the moose population is about one million individuals, while the European populations amount to nearly half a million and are still growing [4]. The largest moose populations are in Fennoscandia, mainly in Sweden and Finland, and these countries also maintain the highest hunting bags [5]. The growth of moose populations in many countries depends on land privatization and forest dynamics. However, political and economic shocks are not only the main drivers of forest change [6], but can also be the main drivers of wildlife population changes [7], including that of moose [8]. Moose is hunted in all countries within their continuous distribution, including within most of the protected areas [9]. However, there is a lack of a unified approach to the hunting [10], even in neighboring countries such as Lithuania, Latvia, Estonia and Poland [11].
In Lithuania, moose is the second largest ungulate after European bison [12]. After being abundant across the country in the 19th century, moose numbers then significantly decreased at the beginning of the 20th century. There were just 25 individuals left in 1920, and only 32 individuals in 1932. Thereafter, the population increased to over 300 in 1940, before then being decimated after WWII by poaching and wolves [13]. In 1948, only 91 moose were found during survey work. With the imposition of a hunting ban, along with afforestation of the country and carnivore control, the population then increased again, reaching 251 individuals in 1954 and 1500 individuals in 1961 [14].
Since 1962, moose numbers in Lithuania have fluctuated widely [12,14], and the moose hunting ban was ended. In this paper, we analyze population levels and bag trends since this date. We use official numbers, as expert opinions regarding population numbers, especially in the 1970s, were frequently at odds with each other, with estimates differing by a factor of two in some cases [13]. Analysis is done in the framework of the political and management changes that have occurred in the country since 1962.
The aim of this paper was to analyze the sustainability of moose management strategies in Lithuania in relation to changes in hunting rules, hunting organization and the development of the responsible administrative bodies. We consider management sustainable when several conditions are met: (1) a target moose population size has been set as the basis for long-term management, (2) management is characterized by smooth changes or stability in moose numbers, (3) the hunting bag-to-moose ratio is stable over long periods of time or fluctuates insignificantly, and (4) moose densities and quotas are equable across all 10 counties of Lithuania over the long term. If these assumptions are not met, moose management should be defined as not sustainable.
2. Materials and Methods
2.1. Study Site
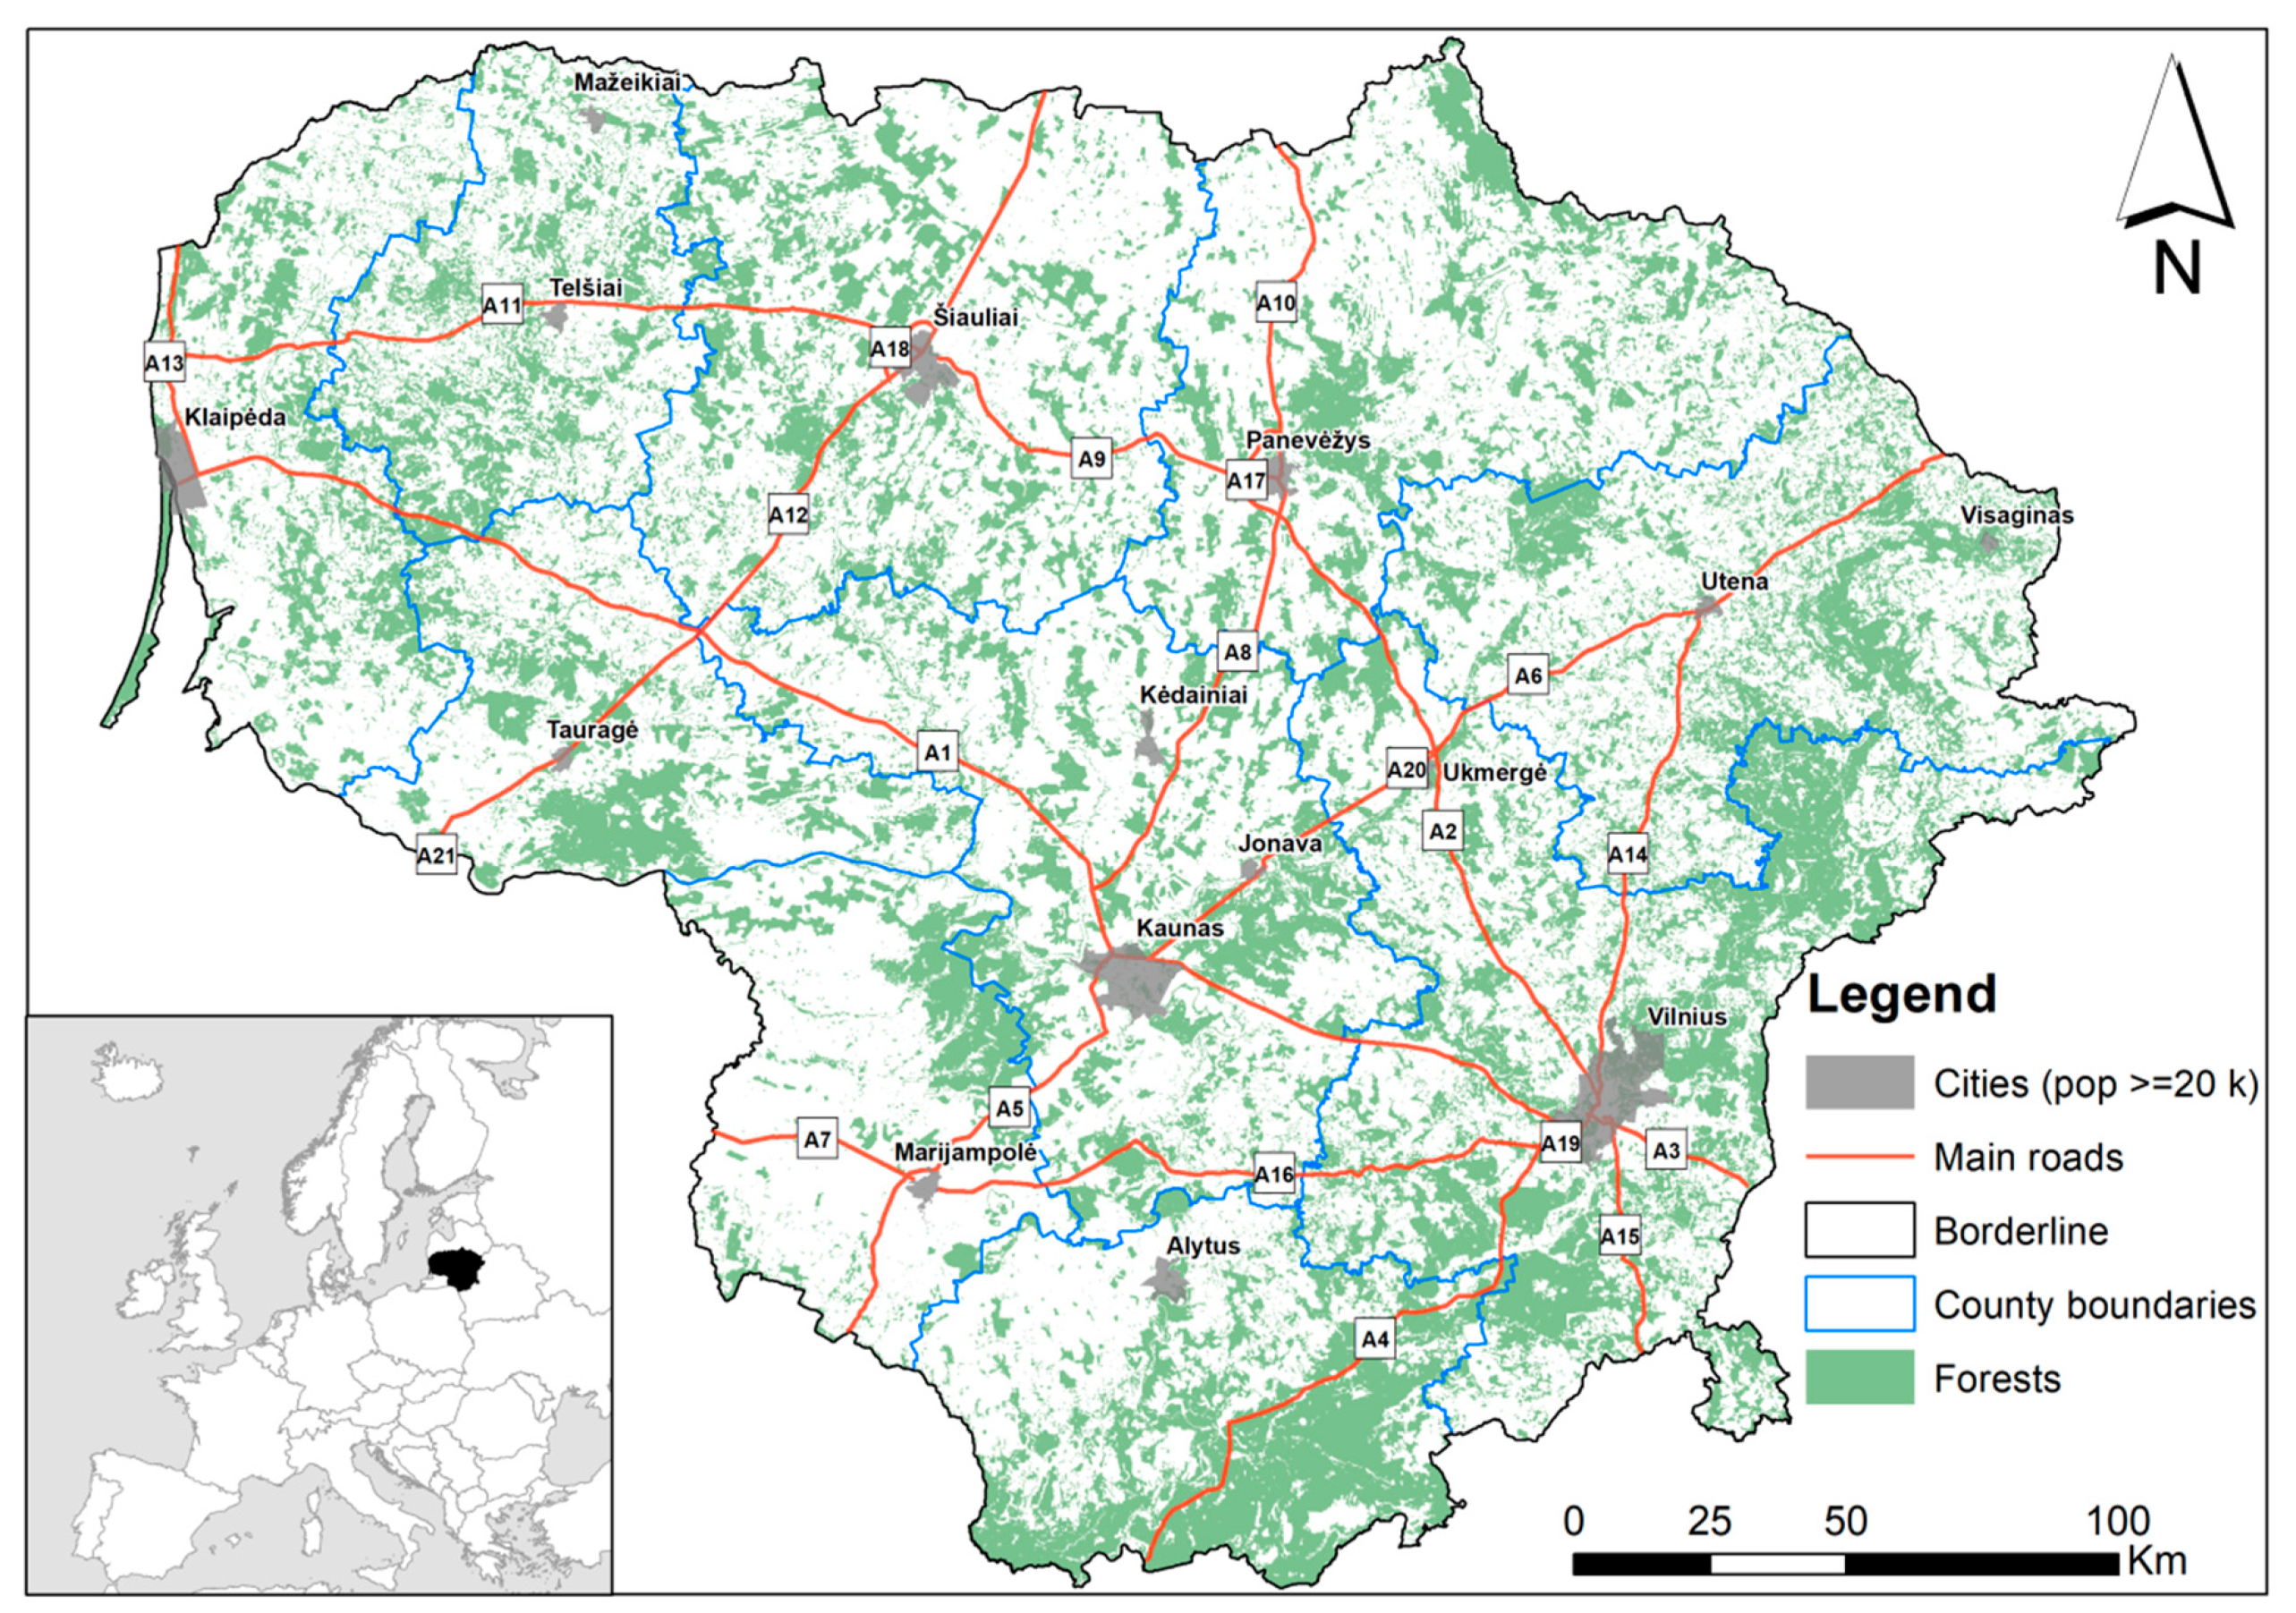
The study site covers the territory of Lithuania, located in the mixed forest zone of Northern Europe, with an area of 65,300 square kilometers (Figure 1). In 2012, forest land and arable land each covered 33% of the territory, while semi-natural vegetation covered 27% of the territory [15]. In 2018, most of the land in Lithuania was agricultural (52.26%), and forests (33.2%). Built-up territories and roads covered 3.64% and 1.61% respectively. All environmental data for 2018 were obtained from the National Land Service under the Ministry of Agriculture of the Republic of Lithuania [16]. Forest cover increase between 1990 and 2018 was obtained from the CORINE [17]. The road network length is 21,238 km [18], of these 1865 km are main roads with annual average daily traffic of 3000–20,000 cars per day [19]. The population density was 31 inhabitants per square kilometer in 2011, and is currently declining [20]. Prior to the year 2000, 68 species of mammals occurred in the country, including eight species of ungulates [21]. Currently, the list is about 75 species, though there have been no additions in ungulate species [22]. There are 10 administrative counties in Lithuania, differing in area, forest percentage, habitat structure, moose numbers and bag, as well as moose population management peculiarities.
2.2. Data on Moose Numbers, Hunting Bag, Administrative and Legal Changes Related to the Species
Data on moose numbers and hunting bag size were obtained from the official source, i.e., the Ministry of Environment of the Republic of Lithuania (data for recent years available online at [23]), and their archives. The most detailed available numbers are at the level of the administrative district, of which there are 60 in Lithuania, but the number of districts was not stable in the period 1962–2020, so we pooled data to the higher administrative level, the county.
We accept all criticism that so called “official” data may be biased. However, (i) there are no other data sources over the long term; (ii) expert evaluations have even greater and more unpredictable bias; and (iii) an increasing number of publications use these numbers (see [24,25], including for Lithuania [7,11].
Changes in the regulations concerning moose management were collected from official sources, which are referenced in Chapter 4.1.
2.3. Data Processing and Statistics
Trends of changes in moose numbers, bag size and bag-to-population ratio were analyzed using a connected scatterplot [26,27] and compound annual growth rate analysis [28,29].
A connected scatterplot depicts a unit-free index, I(t). For a given t year it is defined as
where N(t) and N(t − 1) are population or hunting bag sizes at the t and t − 1 year, respectively.
I(t) = (N(t) − N(t − 1))/N(t)
As the index I(t) is dimensionless, it is suitable for comparison of population sizes between species or, in our case, between counties [26]. The connected scatterplot is divided into four quadrants by indices I(t) on horizontal and I(t + 1) on vertical axe. The first (third) quadrant is the area where both indices are positive (negative). It implies that population is under increasing (decreasing) stage. The second (fourth) quadrant is the area where I(t) > 0 (<0) and I(t + 1) < 0 (>0). It implies that population is moving onto the increasing (decreasing) stage at year t. Graphic representation of the I(t) changes with connected scatterplot allows the defining of periods of population growth (curve in the upper right quadrant of the graph) and population decline (curve in the lower left quadrant). Average and variance of the I index, denoted as MAVI and VAR, were calculated in the standard way, using absolute values of I(t). Wide fluctuations of the population size yielded large average I values. Averages are comparable between sites.
Compound annual growth rate (CAGR), re-phrased from [28], defines the population or bag size that would be required for the moose population to grow or decline, from a beginning value to an end value. This way, the number or bag values of moose are smoothed and can be used to evaluate long-term changes. The CAGR was defined as:
where IV is the initial value and FV is the end or final value (of moose number, hunting bag or size of bag-to-population ratio) and n is the number of years [29].
All calculations were done in Excel and Statistica for Windows [30].
3. Results
We present results of moose population dynamics across Lithuania for the period 1962–2020, then switch to finer scale and analyze data for 10 counties (higher level administrative division) over a shorter period. All changes are examined in the framework of concurrent legal changes and management decisions.
3.1. Changes in Population Size and Hunting Bag at the Country Scale, 1962–2020
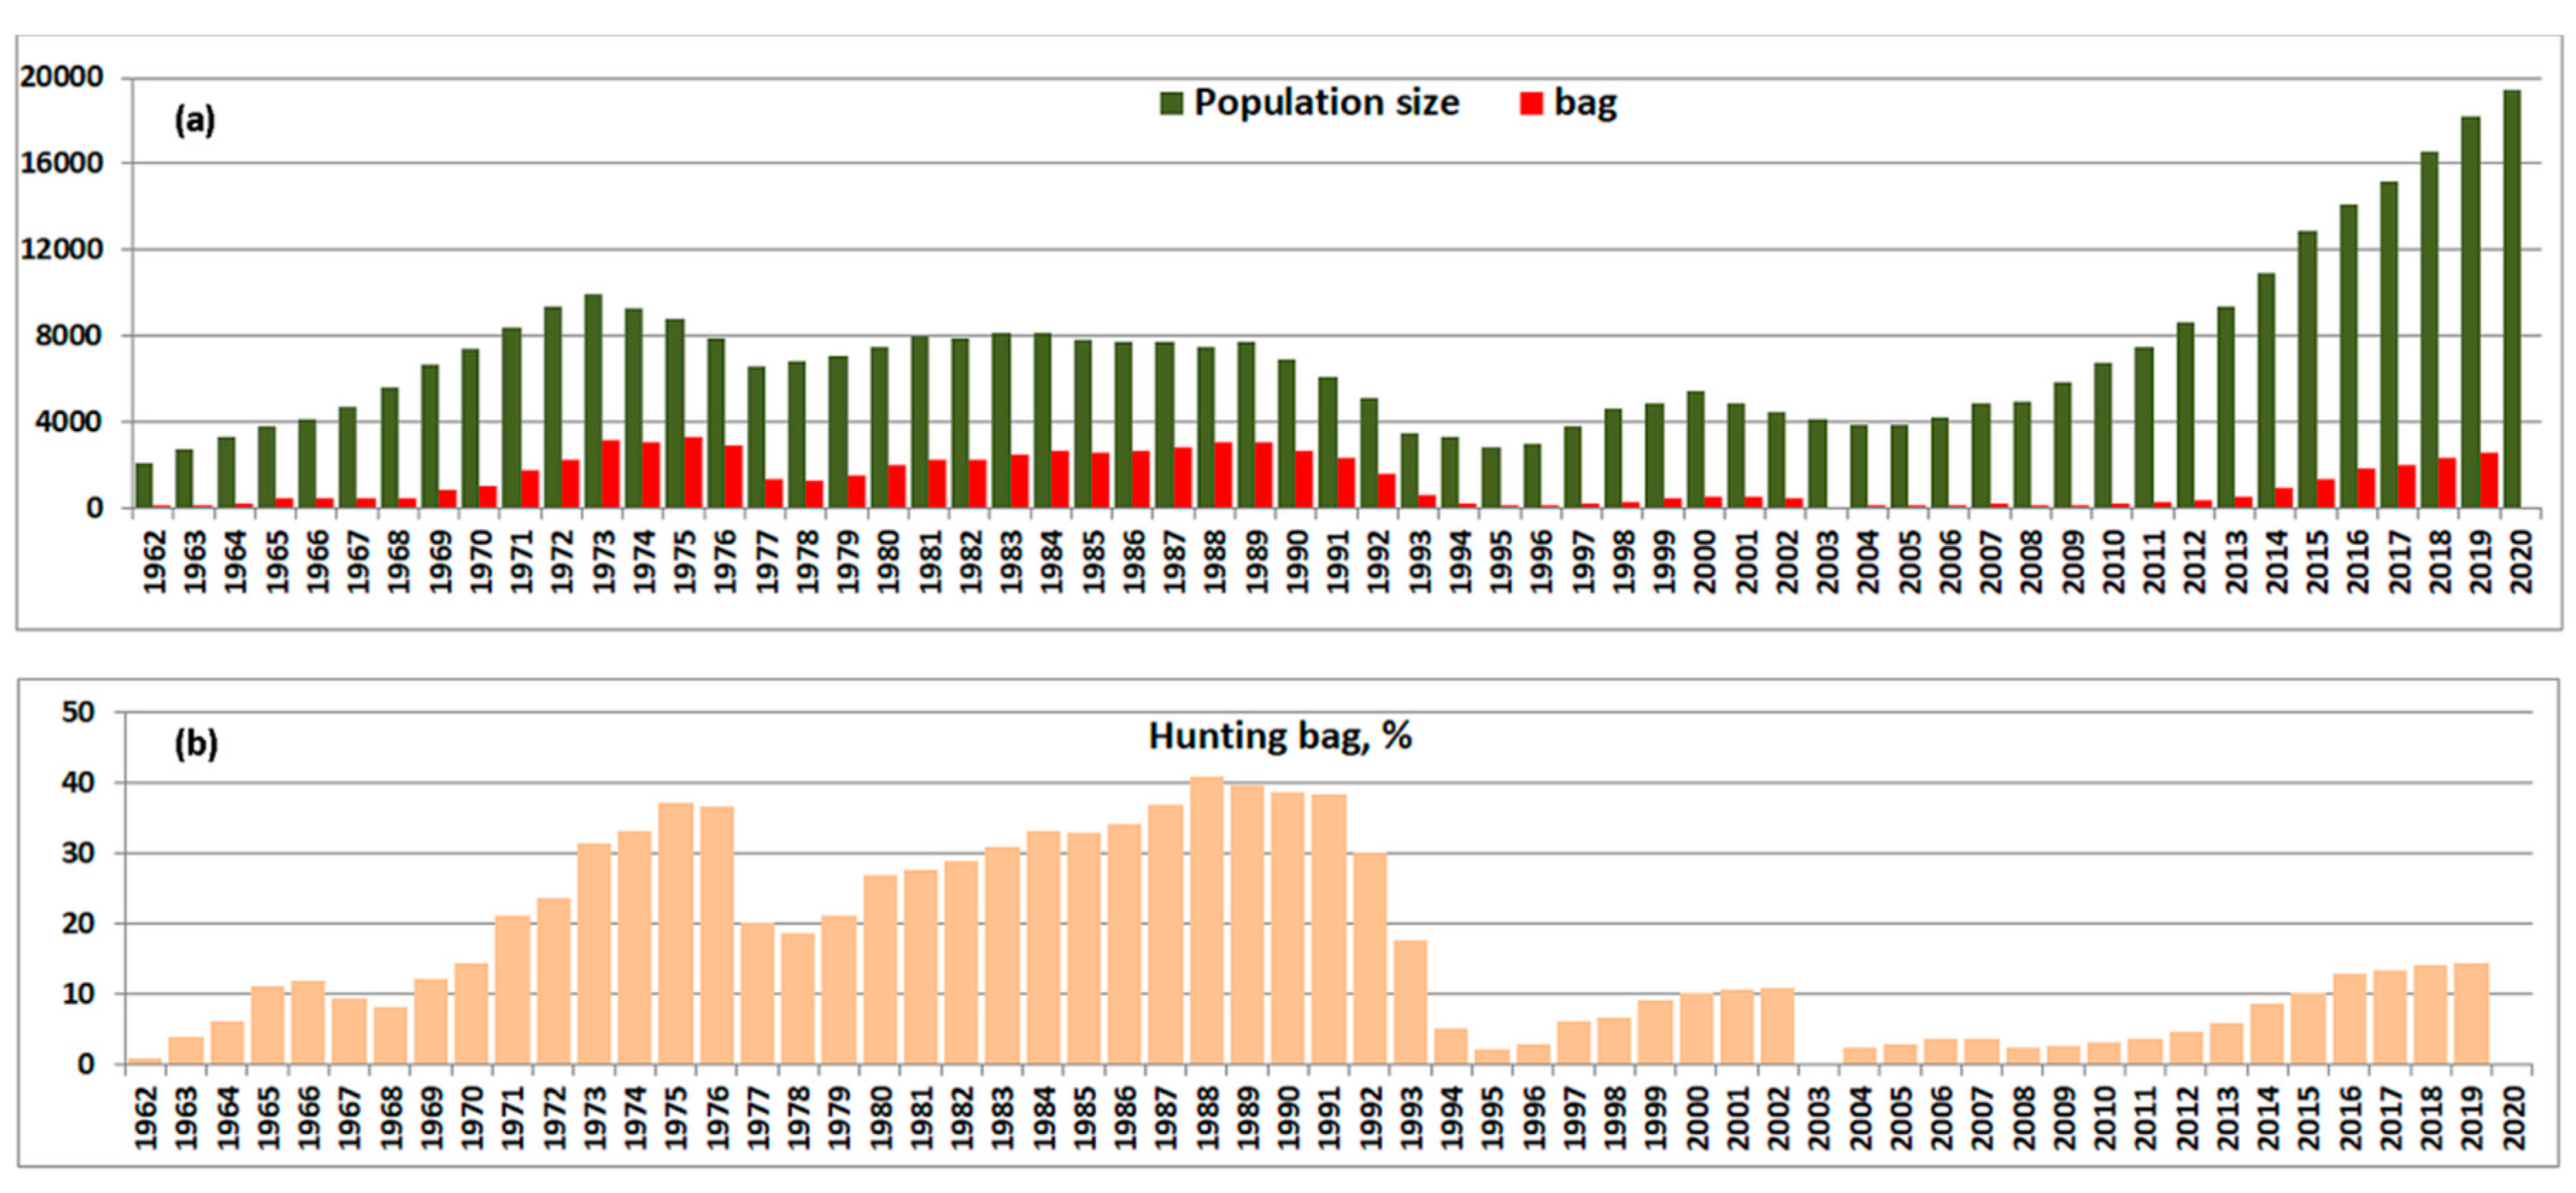
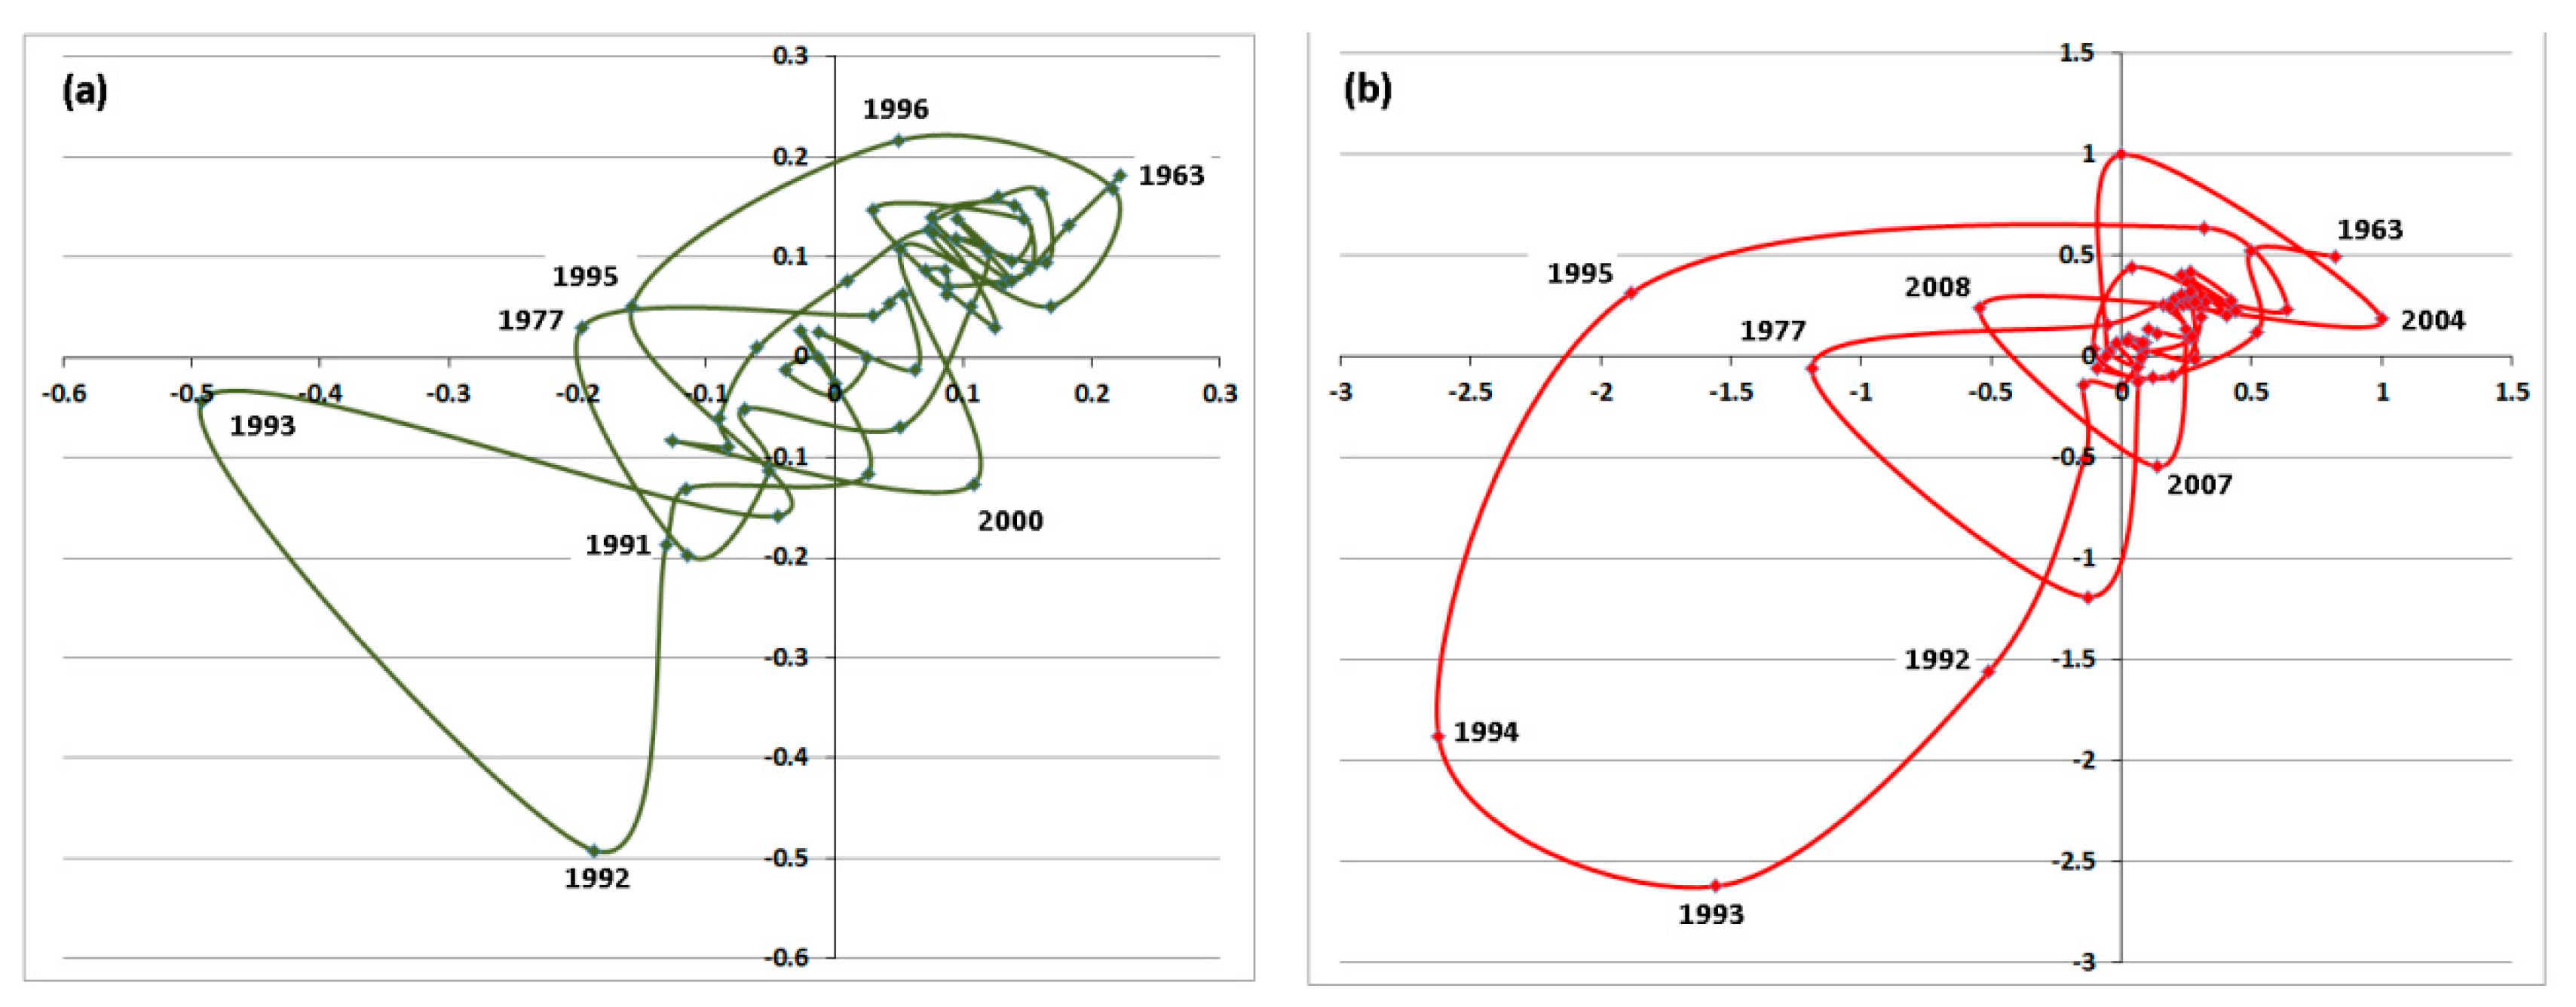
Moose populations in the country were not stable in the period 1962–2020—population numbers underwent two periods of significant decrease and one of milder decrease, though they also saw continual growth from 2006 (Figure 2a). These periods were characterized by differences in the compound annual growth rate, CAGR, see Table 1 and connected scatterplot (Figure 3a). Most I values in Figure 3a are less than 0.5 and are located in the first quadrant, meaning that the moose population was often under expanding conditions, though population growth was not rapid.
The first population decrease, in 1973–1977, occurred along with increase in the hunting bag, which in 1975–1976 was unusually high for the country (Figure 2b). The next decline started in 1989 and was the longest during the period (with a curve in the fourth quarter, Figure 3a). The hunting bag reached its peak in 1989 and thereafter decreased gradually for some years (Figure 2a), thus the bag-to-population ratio between 1988 and 1991 was at its highest level in the whole period (Figure 2b). A final population decrease occurred in the period 2000–2005 and was marked by a complete hunting ban in 2003 and minimum bag numbers until 2009.
The compound annual growth rate of the moose population after the removal of harvests in 1962–2020 was 3.84%. As a result, the population size increased by nearly 10 times (Figure 2a). The CAGR of the hunting bag in 1962–2019 was 8.96%. As changes in the bag were not strictly related to population size, this illustrates management delays.
The seesaw principle was confirmed in moose management. There were three periods of population decrease, two were relatively severe (1973–1977 and 1989–1995, CAGR = −7.79% and −15.27%, respectively), while the other was milder (2000–2004, CAGR = −6.63%). These fluctuations were followed by two periods of the hunting bag decrease (1976–1978 and 1990–1993, CAGR = −24.33% and −30.98%, respectively). Since 2006, population growth has not been controlled despite the higher rate of bag increase.
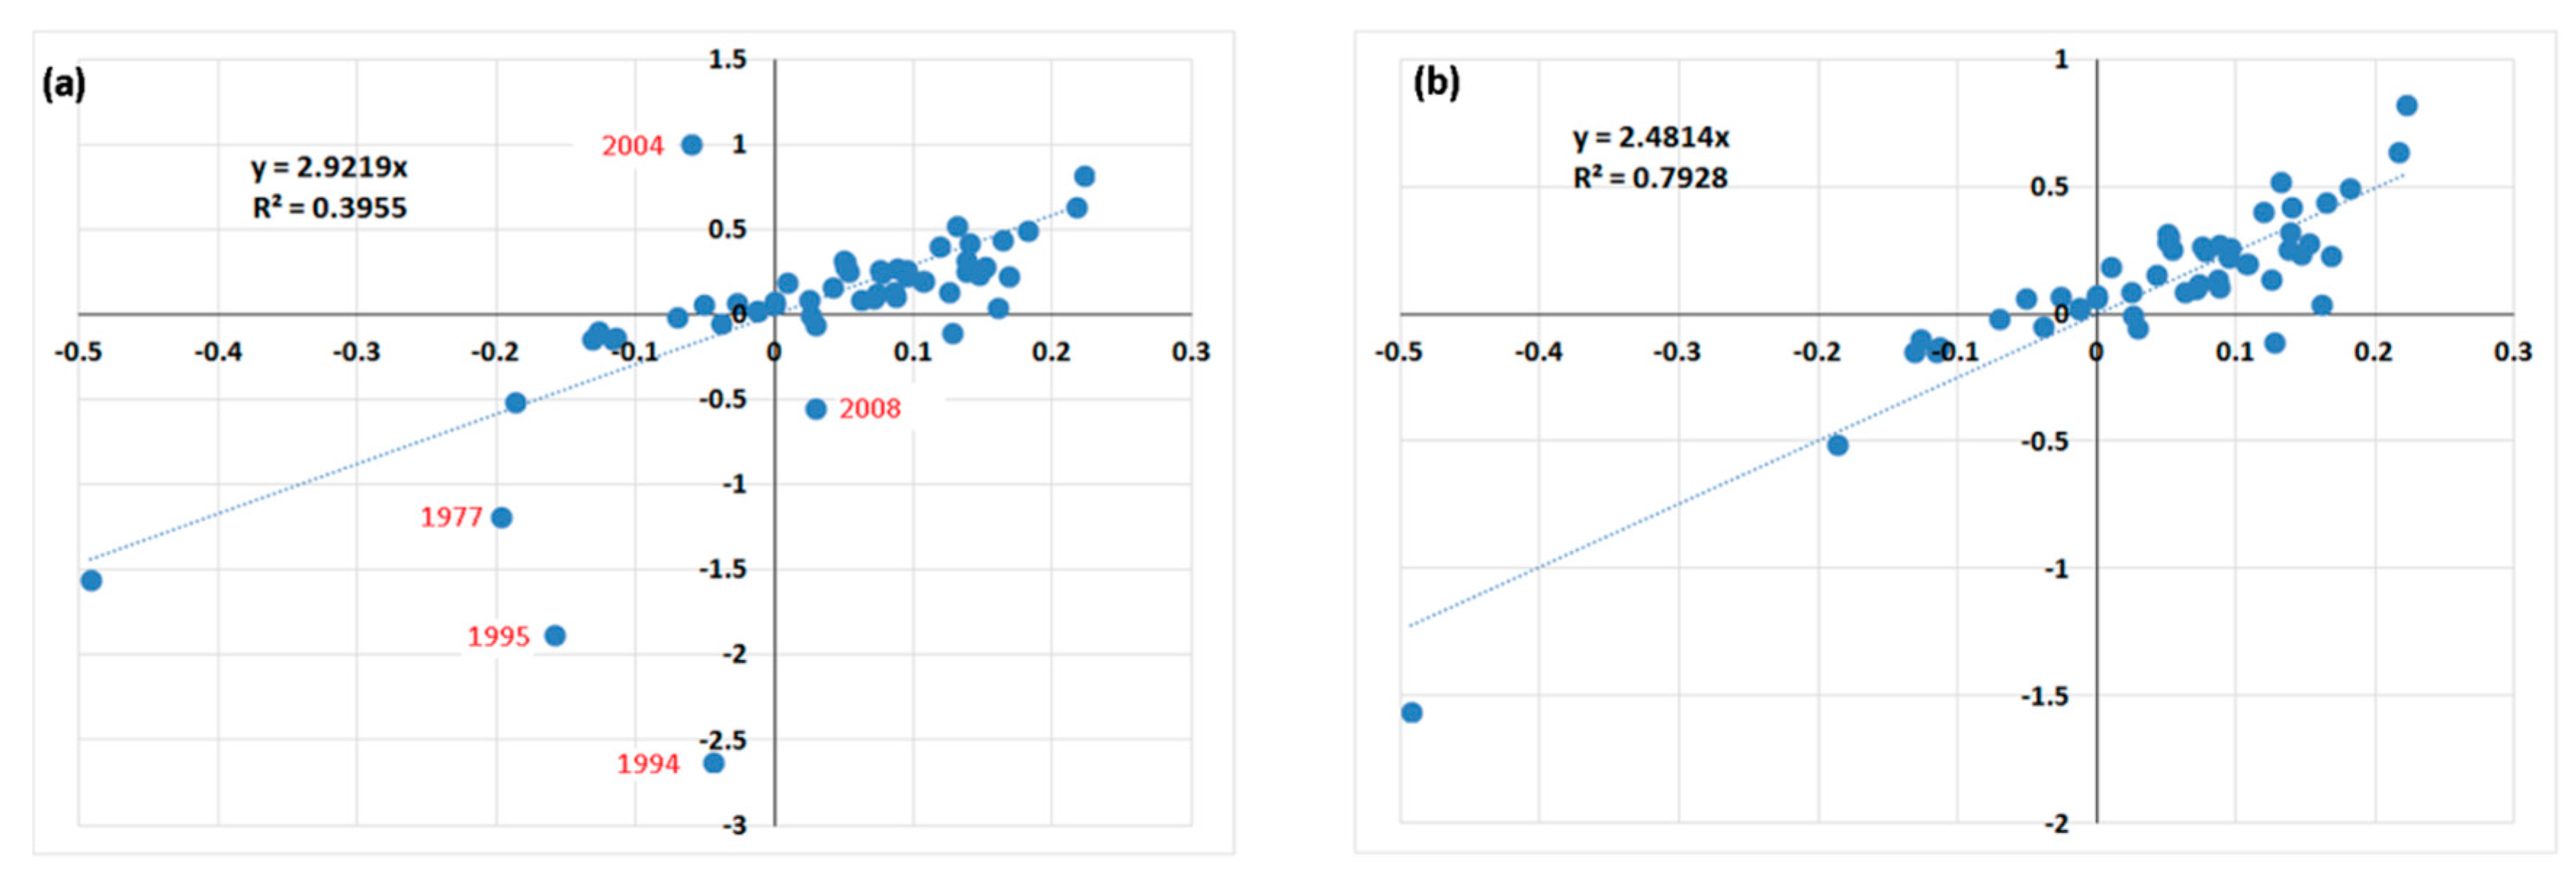
We found a positive relationship between changes in moose population size and changes in hunting bag (Figure 4), including in the outliers (Figure 4a), i.e., the bag ratio changes in 1977, 1994, 1995, 2004 and 2008. Note that the moose population census is conducted after the hunting season each year and the hunting bag for the next season is set after the population census. Thus, roughly speaking, the positive slope in Figure 4 implies that the population size is increasing. Our results indicated that moose numbers were, on average, steadily increasing between 1962 and 2020: this relationship is shown in Figure 4a where a population number change of one unit is accompanied by a bag size change of 2.9219 units. Outlier years are characterized by drops in the bag-to-population ratio (Figure 2b), which in fact are management failures. Removing the outliers, the results in I(t) of bag become linearly related to population changes, i.e., the I(t) of population numbers (Figure 4b) and the increase in determinant coefficient, R2. The difference between 2.9219 units and 2.4814 units implies that the response in terms of hunting bag adjustment is too slow, resulting in drastic falls of population size and, later on, hunting bags. It is recommended to more rapidly change the bag size when the population sizes change drastically.
Generalizing, if we define moose population changes in the country as moderate (except for 1989–1995; Figure 2a), then the hunting bag-to-population ratio changes are significant (Figure 2b), and bag changes are drastic (Figure 2a). These patterns were not similar across all counties (see Section 3.2).
3.2. Changes in Population Size and Hunting Bag at the County Scale, 1993–2020
Moose population dynamics and bag changes in 10 counties in 1998–2020 are presented as connected scatterplots in Figures S1 and S2, respectively. Data on both population and bag sizes at the county level are available from 1993, but data are missing for some years between 1994 and 1998 and for 2020 (Table S1).
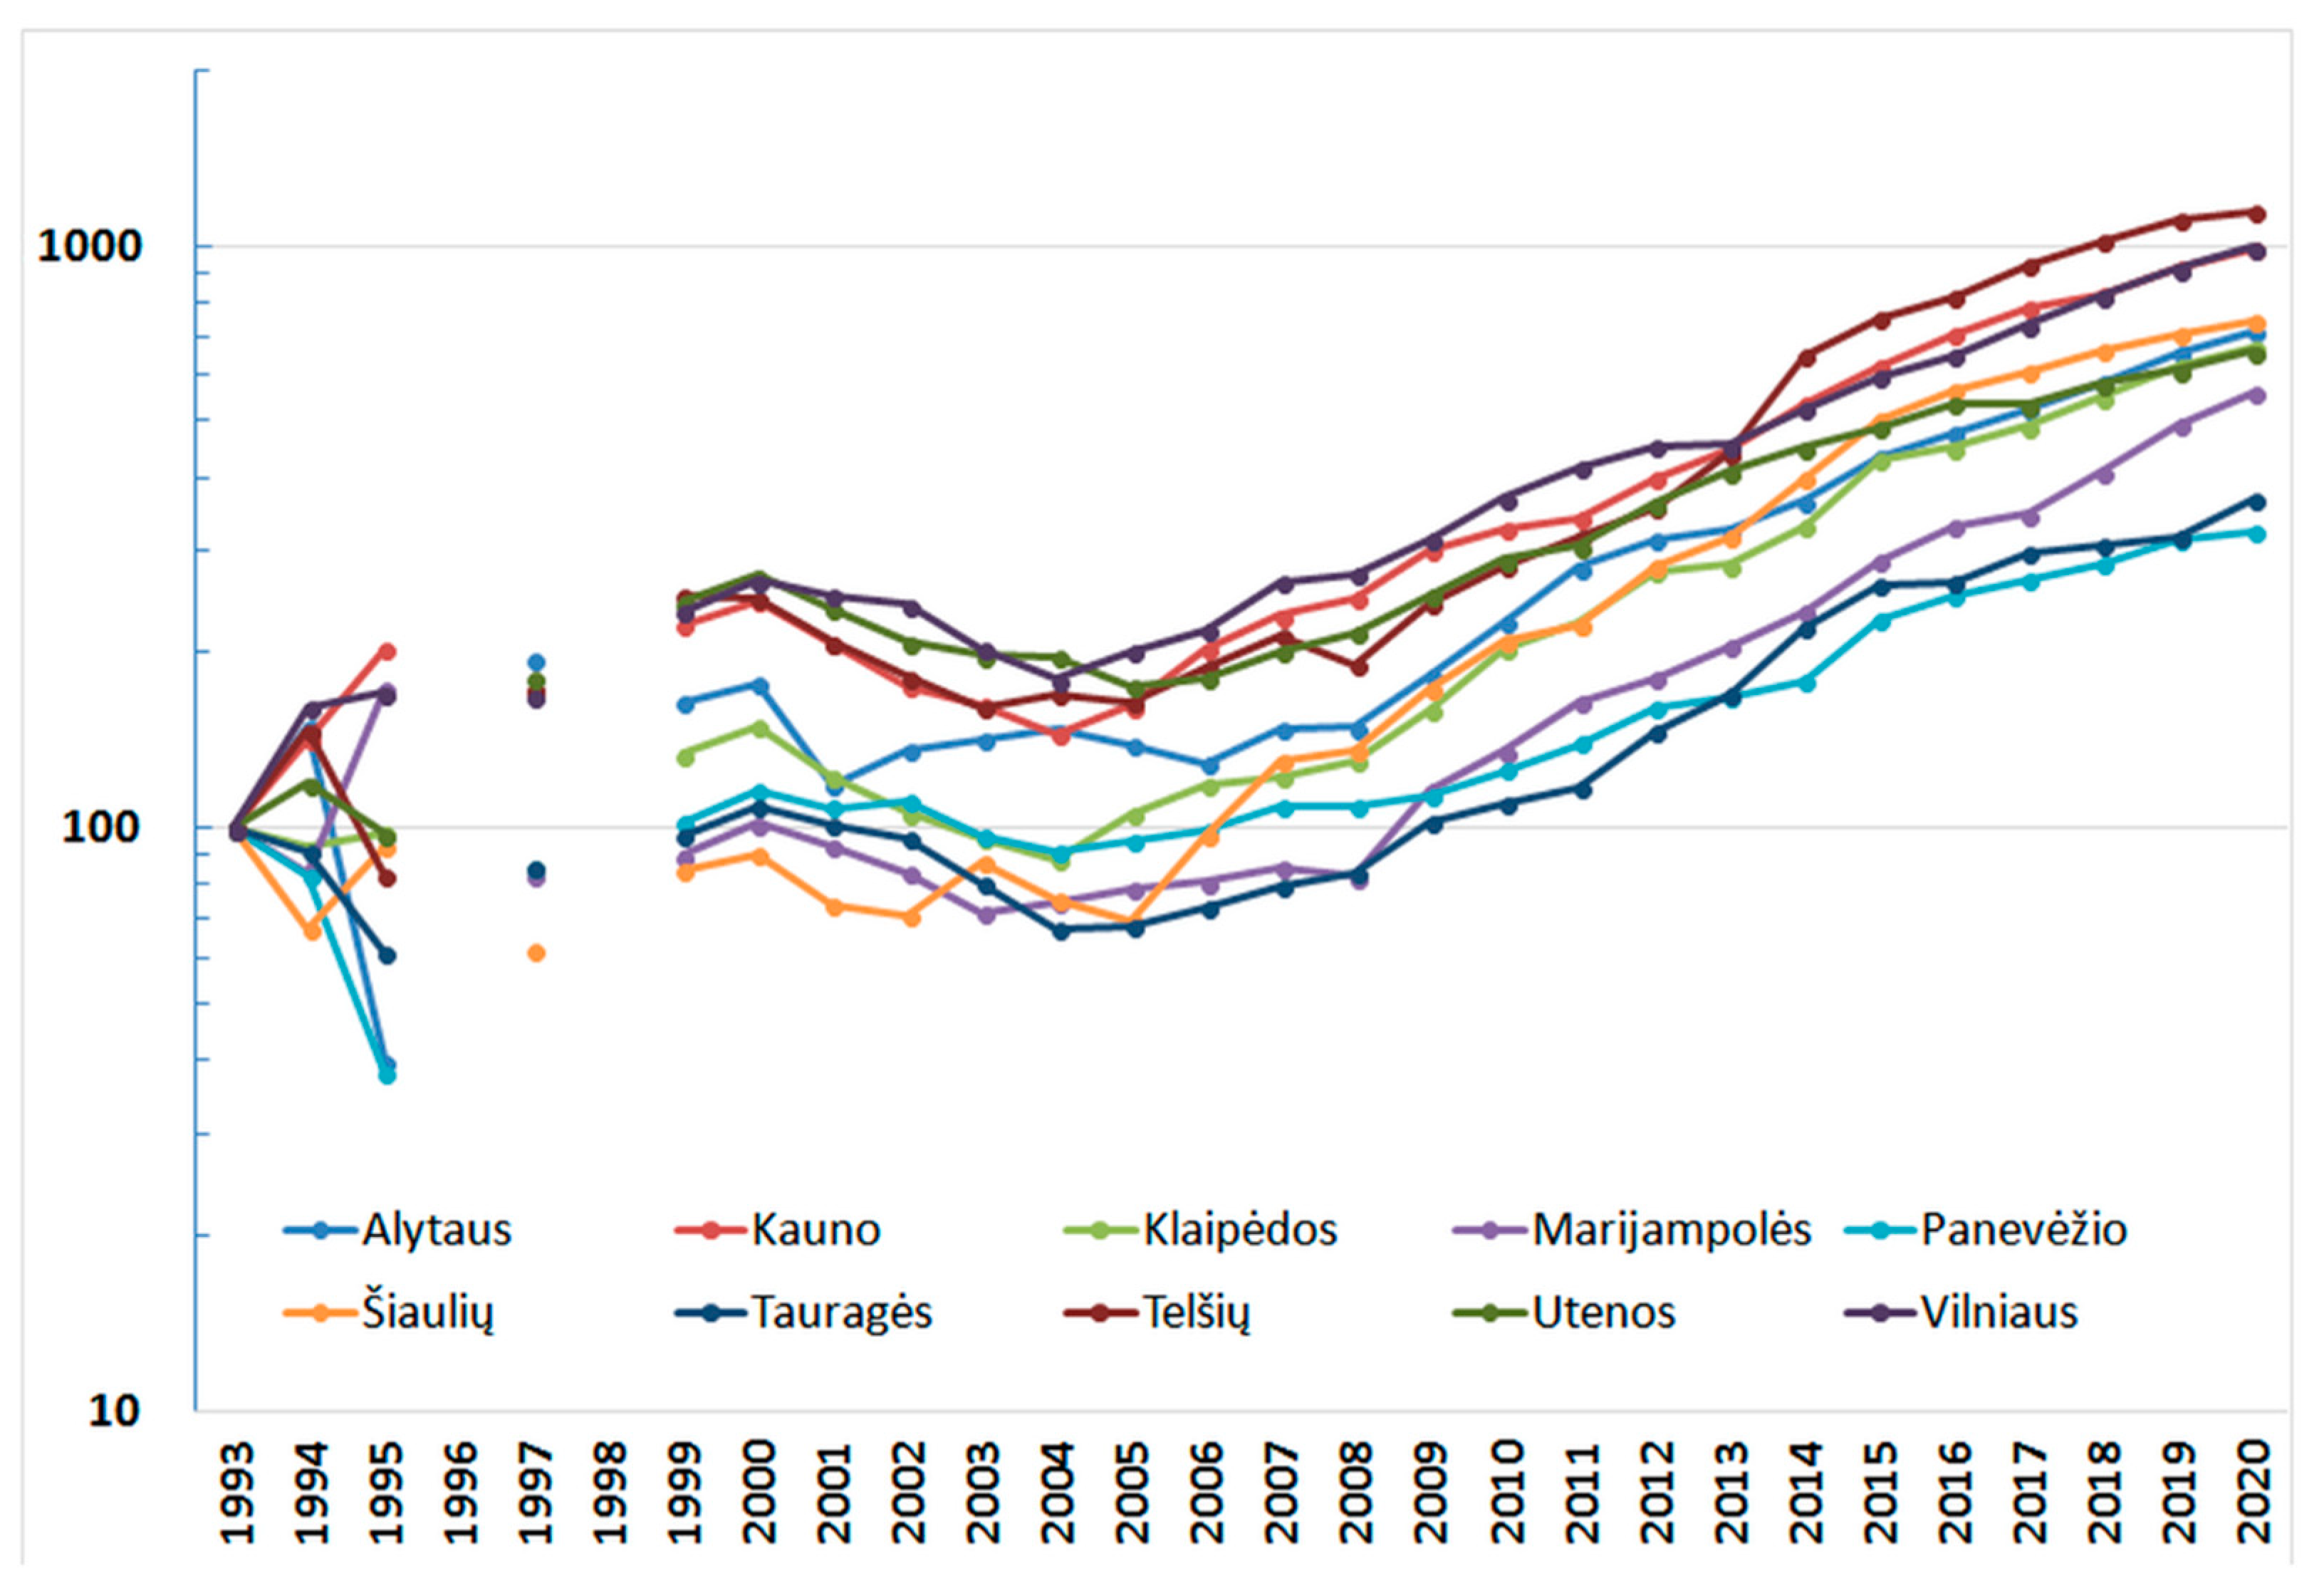
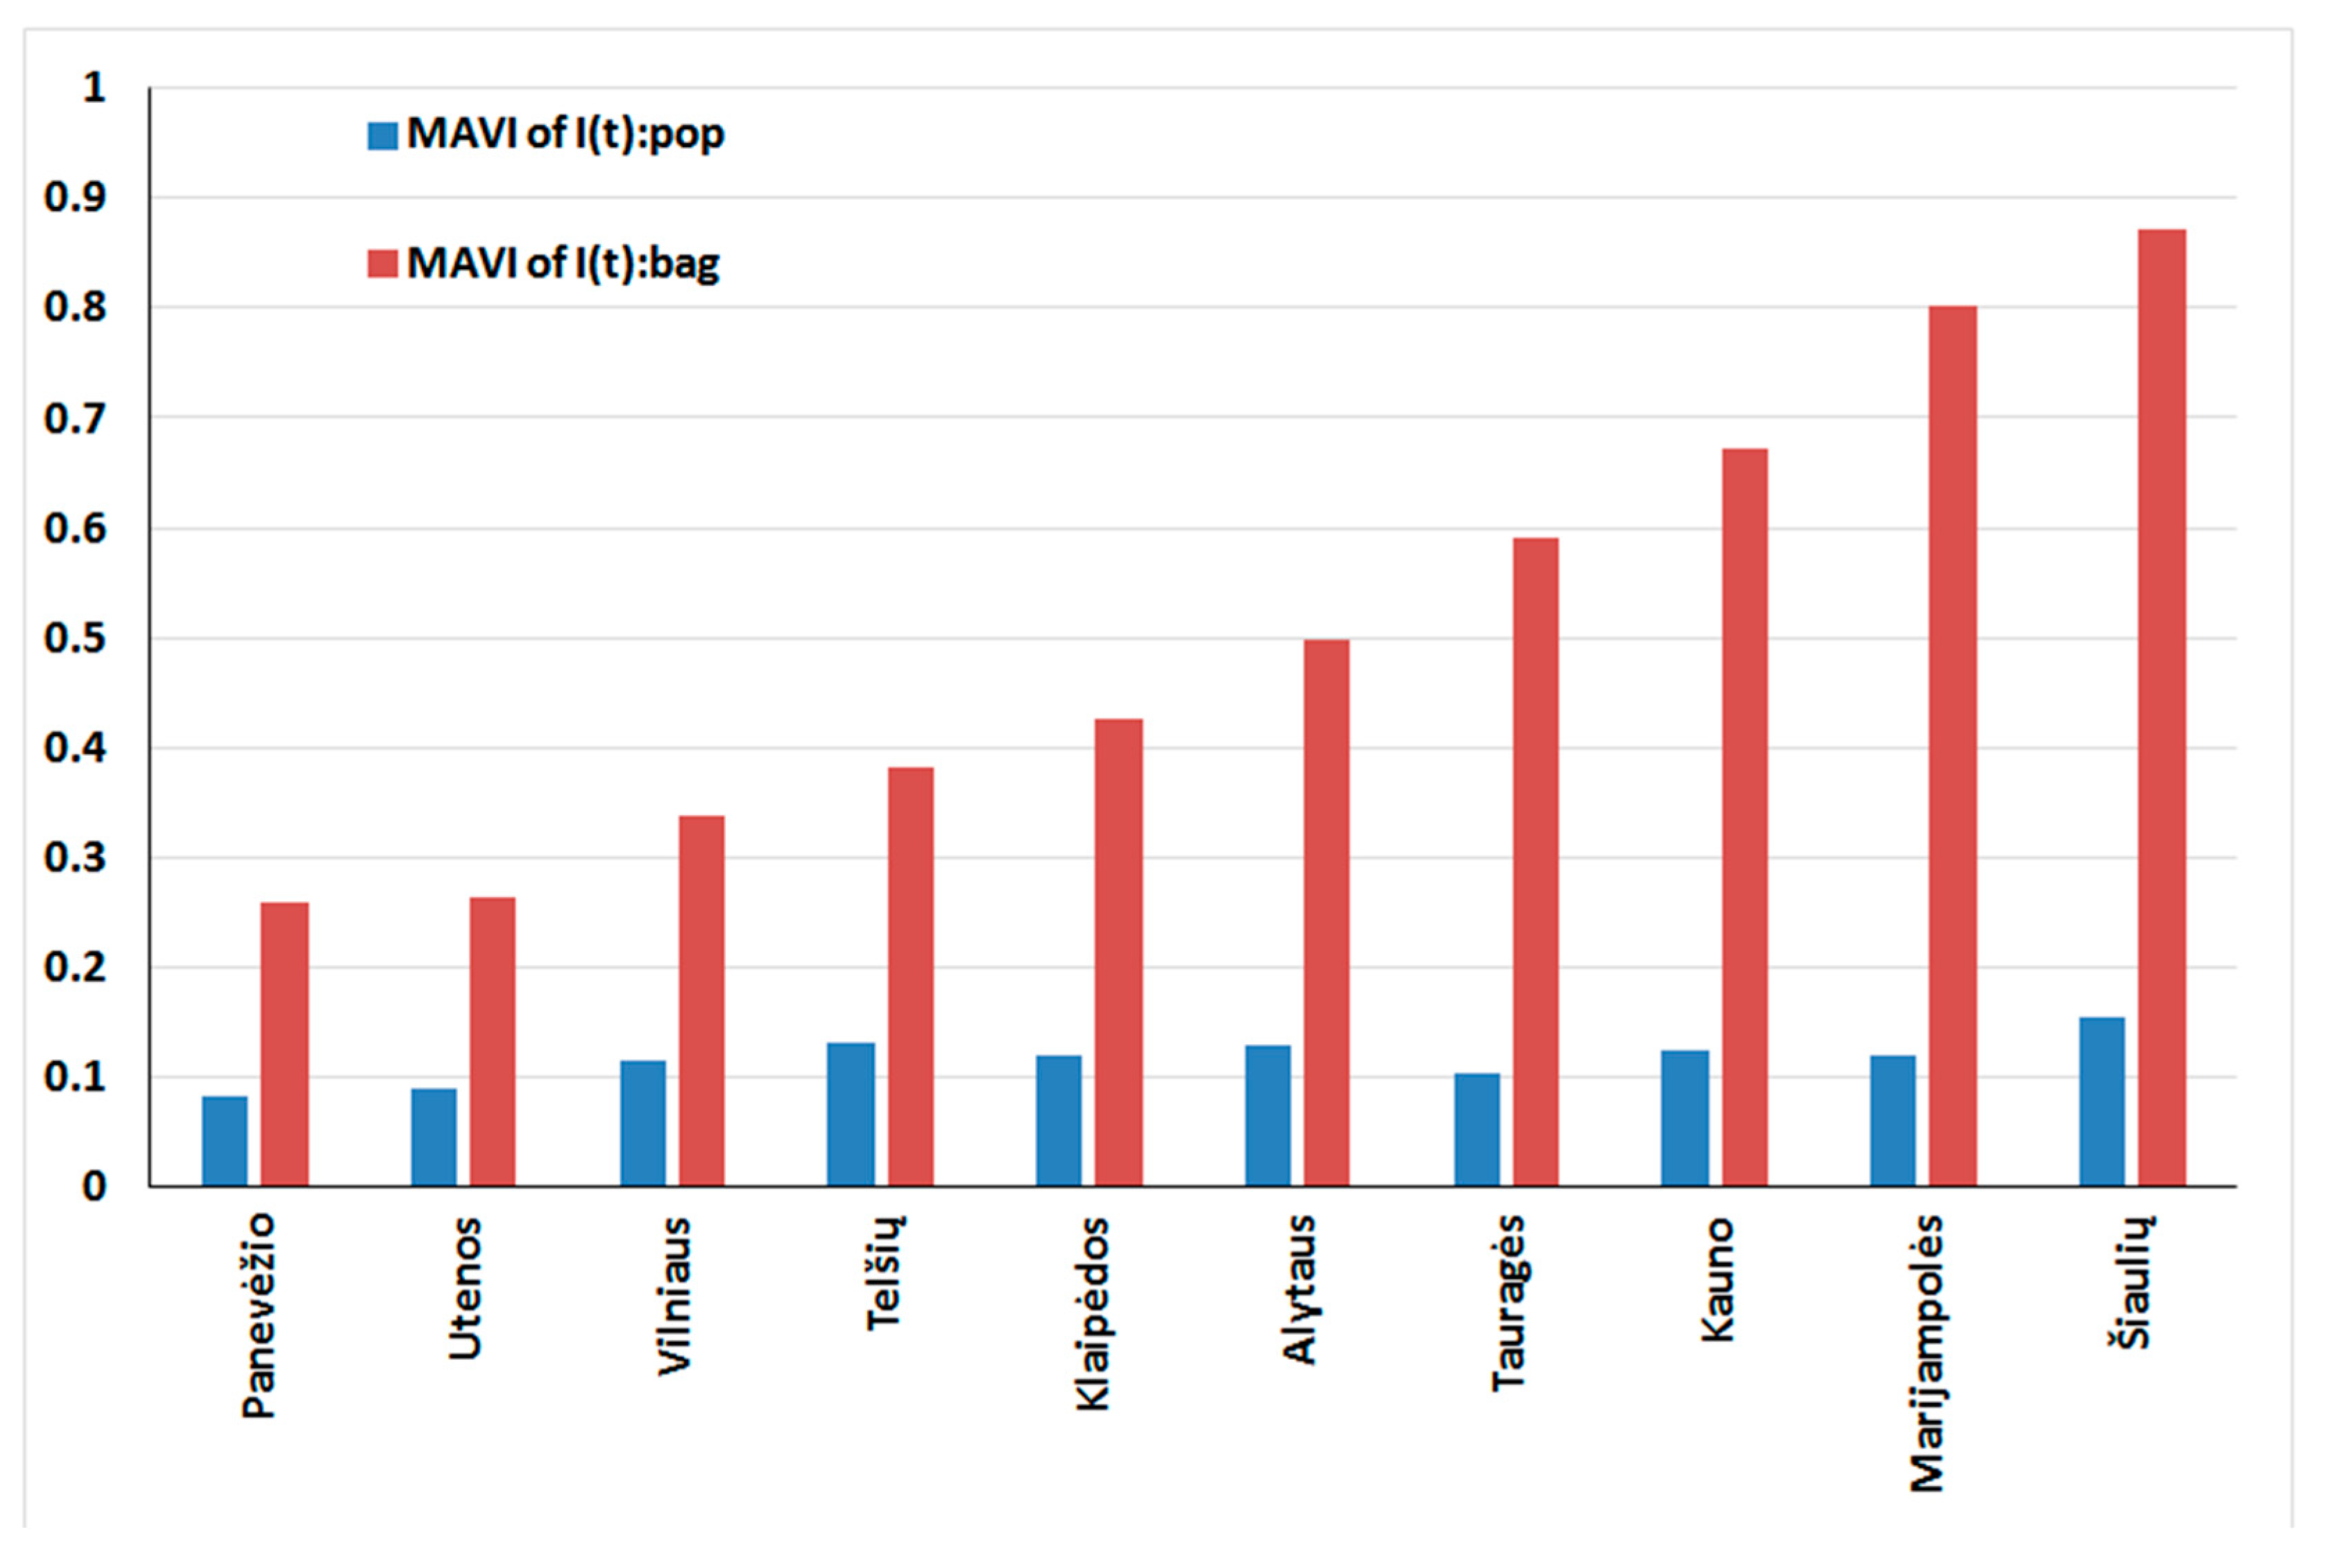
Comparing relative moose number dynamics, we did not find expressed differences in the trends of population increment among counties between 1993 and 2020. Proactive control of the hunting bag by wildlife management authorities has led to a continuous increment in the population size, most expressed since 2004–2008 (start time of increment in the counties was not the same). The trends of population growth are presented in Figure 5, with the initial numbers in 1993 equaling 100 (logarithmic scale is used). The efforts of authorities have been successful because the MAVI of I(t) for the population size for each country is almost the same while the MAVI of I(t) for hunting bag for each country differs substantially (Figure 6), implying that some counties take more actions (changes in hunting bags) to stabilize/increase the population size. The presented data allow us to conclude that management patterns were not similar.
The initial populations were not equal among counties (for the numbers see Table S1), but despite differences in growth rates (density increase 3.12–11.07 times, CAGR 4.15–8.97), the final population sizes in 2020 still tend to be greater in the counties with larger populations in 1993. For the sake of comparison, we set the population size in 1993 as 100. From this, we can conclude the most successful county was Telšių, with the current population size being 11.45 (=1202/105) times higher than that of 1993, while the least successful was Panevėžio county, the population here being 3.23 (=2525/783) times higher (Figure 5). Šiaulių county experienced the worst position several times until 2005, but the size of the moose population has increased at a relatively higher rate since 2006, implying some success in moose management in the years since 2006. In fact, MAVI of I(t) for hunting bag for Šiaulių county is the largest, suggesting that control of hunting bag has resulted in the observed successful increment of population in recent years.
Comparison of the densities of the population and hunting bag per unit of forested area (Tables S2 and S3), and dynamics of density changes (Table 2), showed some patterns characteristic of several counties. In the counties with highest initial moose densities in 1993 (Panevėžio and Utenos, 3.463 and 2.032 individuals per 1000 ha of forest area, respectively), the density increase rates were most moderate (3.12 and 6.13 times, respectively), with CAGR also being smallest. Vice versa, the two counties with the lowest initial moose densities (Kauno and Telšių, 0.745 and 0.658 individuals per 1000 ha of forest area, respectively) show the highest increase rates in the 1993–2020 period, being 9.14 and 11.07 times. Their CAGR for the same period were also among the top three (Table 2). However, the fastest population density growth in the 2005–2020 period was characteristic of other counties (Klaipėdos and Šiaulių).
Relative dynamics of the hunting bag densities (number of hunted moose per 1000 ha of forest area in the county) was different from the population density changes. The two counties (Panevėžio and Utenos) with the highest density of hunting bag in 1998 were characterized with the highest animal density. Growth of the bag density in these counties for 1998–2019 were among the most moderate: CAGR was 5.94% and 7.36%, respectively (Table 2). The bag density growth in these counties for 2005–2019 was the smallest: 3.42 and 3.11 times, CAGR 7.99% and 7.34%, while the CAGR of the bag in other counties was 9.77–15.01%.
3.3. Environmental Parameters and Moose Population Dynamics
County-based environmental data are presented in Table 3. The areas of the counties remained stable in 2014–2018 (the maximum change in the three counties was in the range of 0.02% or less). Between 2014 and 2018, forest percentage in Lithuania increased from 33.4 to 33.7% [31]. Increase in the forest percentage from 1990 to 2018 was 2.6% for the entire country [17], and was best expressed in the eastern and northern counties. While wetland share was relatively constant, other factors between counties differed to a higher extent (Table 3).
Environmental data were analyzed for correlation with moose and hunting bag densities and indicators of their relative increase. Absolute values of moose and bag numbers were not used for correlation analysis, as they are area-dependent. All correlations but one were non-significant due to the small sample size, n = 10 (Table S4), however, there were some patterns.
Increase in the forest area in the 1990–2018 period was strongly and significantly correlated with the CAGR of 1993–2000 (r = 0.74), and positively correlated with the moose densities and moose bag densities in 2000–2015. From 2000, positive correlations of moose densities and moose bag densities were found with the increase in forest area within it in 2014–2018 (r = 0.31–0.49), the share of wetlands (r = 0.20–0.31) and the proportion of water bodies (r = 0.21–0.45), while negative correlations were found with human population density. The last figure also includes 1993, as that year saw the strongest correlations of moose densities and moose bag densities with human population density (r = −0.41 and −0.42) in the period of 1993–2020.
4. Discussion
Results of this study show that from the long-term perspective, despite overall growth in numbers, moose management in Lithuania was not fully sustainable, as the populations experienced three extreme decrease periods, followed by significant reductions in the hunting bag or even a ban on moose hunting. In the most recent period, moose numbers in the country have undergone a period of constant growth. The achieved density in 2020 is the greatest ever experienced. At the county level, there were differences in the pattern of density and hunting bag dynamics. In the most recent decades, the highest CAGRs were characteristic to the counties which earlier were characterized by low moose densities. The dynamics of the hunting bag in the counties was not directly related to the population densities.
We acknowledge that the dataset used is not bias-free. However, this is the only data source available for moose management decisions in the country. Evaluations of moose populations and management decisions in neighboring countries have always relied on “official” data [7,11], despite the possible influence of changes in the methods of mammal surveying, of political turmoil and of variation or absence of management decisions. As we examined the CAGR and hunting bag variations over quite long-term periods, our results and conclusions should not be sensitive to possible over- or under-estimates of population numbers.
Our results of I index in the connected scatterplots seem to be consistent with Kawata et al. (2013). Most values of I index in Figure 3a and Latvian moose in [26] are less than 0.5, this was the maximum in the initial stage of recovery (before population size reaches 1000 heads); later I values were < 0.2. Other moose populations were not evaluated using the same methods. Moose bag changes were more expressed, with I index being >1 in the periods of the most expressed management changes.
Positive correlations of the moose density and moose hunting bag density with the long-term and the short-term forest increase, share of wetlands and water bodies in the county may, in addition to a negative correlation with human population density, be interpreted as a suitably diverse habitat with less human pressure for these animals. As noticed in [13], reforested areas and mires are the main winter habitats for moose in Lithuania, and are used 1.5–11 times more than all other habitats. Forest area increase was most expressed in the northern and eastern counties, characterized with the highest moose population densities. However, based on moderate correlation coefficients, these factors are not the main regressors defining moose population dynamics. To understand the background of these patterns, legal and administrative issues of moose management and hunting should be analyzed and compared to species management in other countries.
4.1. Legal and Administrative Background of Moose Population Management in Lithuania
Arranged as a timescale, there have been a number of important legal and administrative changes related to moose population management [13,14,33,34,35,36,37,38,39,40,41,42,43,44]:
- 1962–1988 was the period during which ungulates were valued and protected (from poaching). Meat did not belong to hunters, it was obligatory to deliver it to state-owned meat factories and it was thereafter exported for hard currency [33]. Sums were considerable, increasing from 1.96 million rubles in 1986 to 3.01 million rubles in 1990 [31]. As a result, hunters were not interested in an increase in moose numbers or in moose hunting.
- From 1988, institutional changes occurred in the regulation of hunting. Until 1988, quotas were set on the basis of the previous year of survey data. A decrease in numbers in 1973–1977 was conditioned by overhunting, as the bag in these years was unusually high. It was corrected by a rapid bag drop in 1977–1978 (see Figure 1). Management of wildlife was transferred to the Ministry of Forestry in 1989. This period was characterized by the highest ever bag-to-population ratio, and resulted in the largest and fastest decline in moose numbers. Overhunting was officially justified, but was later followed by a reduction in the hunting bag from 1991 to 1995, when only 58 moose were hunted [14,34].
- After the independence of Lithuania (1990), a period of reorganization followed, with administrative and legal changes negatively affecting moose numbers. Moose overhunting was based on the norms of allowable density of ungulates [35] (Table S5). When leasing land for hunting, hunters were obliged to regulate ungulate densities. The availability of rifles to hunters, the simplified procedure of possessing guns by farmers for self-defense and the lack of hunting control all resulted in a rise in poaching levels [36].
- Between 1990 and 1995, administrative bodies and hunting organizations underwent a period of reorganization. In 1995, regulation and control of hunting were transferred to the Ministry of Environmental Protection, this renamed the Ministry of the Environment of the Republic of Lithuania in 1988 [37]. Several documents related to moose population management were adopted, namely the Regulation for Hunting in the Republic of Lithuania (1995, last change in 2000, consolidated edition in [38]) and the Rules of Hunting in the Republic of Lithuania (1995, changes and consolidated edition at [39]).
- In 2002, the Law on Hunting (2002, consolidated edition at [40]) established concepts of hunting, hunting plot units (order of designation and size) and selection. In our opinion, the main issue that encouraged further moose population growth was the statement that hunting plot units would be leased for terms no shorter than 10 years, thus enabling hunter organizations to seek long-term wildlife management strategies. In the hunting plot units, hunters started being able to increase ungulate populations without asking for quotas. In subsequent years, further legal changes came into force, namely Ruling of the Constitutional Court on the Law on Hunting, 2005 [41], the Description of the Order of Preparation, Coordination, Presentation to Affirmation and Affirmation Order of the Projects of Hunting Administration, 2005 [42] and the Order of Preparation, Coordination, Presentation to Affirmation and Affirmation Order of the Projects of Hunting Administration (in force from March 2005).
- In 2012, a new edition of the Rules of Hunting in the Republic of Lithuania was published (coming into effect from 2013, last redaction 2018). According to the 2001 edition of the Rules of Hunting in the Republic of Lithuania, as of 2002, moose limits would be set upwards from the bottom by a committee in every administrative district [43]. The limit would be set by 15 April, considering the proposal, the bag of the previous season and damage done by cervids. During the season, the limit size could be re-considered. Any limit increase over 50% had to be approved by the regional Department of Environmental Protection
Prior to the implementation of these legal and organizational issues, moose numbers had grown in the period 1996–2000, but then decreased again from 2000 to 2005 despite limits in the period 1995–2002, a hunting ban in 2003 and continued hunting restraints until 2008. Further evolution of moose management came to an end with the period of continuous population growth that has occurred since 2008, accompanied by only a moderate increase in the moose hunting bag (see Figure 2, Figure 5 and Table 1). Changes in moose population have had some regional peculiarities (see Table 2). Therefore, we may conclude that the possibility for owners to plan within the hunting plot units has had a much greater impact than the temporal ban on moose hunting and temporal limitations. However, in 2020, there is no long-term strategy of moose population management, neither at the country level, nor at the lower level.
Other regulations in regard to moose hunting, such as the length of the hunting season and limitations related to the selection process, do not have tangible influences on the sustainability of species management (or, at least, have not had so far). Adult male moose may be hunted only by approved hunters-selectionists. Terms have changed over time, last changes done in 2018 [43] and 2020 [44]. Since 2020, bulls are hunted from 1 September to 31 December (the requirement for a qualification of hunter-selectionist is implemented in the Rules of Hunting in the Republic of Lithuania), while cows can be hunted from 1 October to 30 November and calves from 1 October to 31 January [44].
4.2. Moose Populations and Management Examples in Some European Countries
The best-known examples of moose population management are those in Fennoscandian countries, these characterized by high moose densities and the most heavily hunted populations in the world [10,45]. In 2000, the moose population across the region reached about 500,000 animals with an annual bag of about 200,000. The harvest maximums were observed in Sweden and Finland in the 1980s, and in Norway and a second peak in Finland in the 1990s [45]. In 2002 and 2003, Finland again experienced “an unprecedentedly high level of culling”, over 84,000 moose hunted in two consecutive years [5]. In Norway, the highest bag, over 37,000 moose, was registered in 2005 [46]. In 2017, the numbers of hunted moose were over 84,500 in Sweden, 56,600 in Finland, 31,600 in Norway, 7000 in Latvia and 6900 in Estonia [2]. Below, we briefly analyze moose management principles in these countries [5,11,13,45,46,47,48,49,50,51,52,53,54,55,56,57,58,59,60,61,62,63,64,65,66,67,68,69,70,71,72,73,74,75,76,77,78], looking for differences or similarities with moose management in Lithuania.
In Sweden, a collaborative ecosystem-based management of moose [47] aims to “achieve a high-quality moose population in balance with the grazing resources” [48], solving also conflict between hunters and other societal interests [49]. Moose management groups include landowners, hunters and reindeer husbandry representatives in some counties. Differently to Lithuania, these groups also set hunting quotas for moose [50]. Management of moose has been influenced by the re-establishment of wolves [51], hunting tourism [52] and changes in values [53]. Problems have been identified, namely “lack of funding, unclear roles and responsibilities” [54].
In Norway, hunters take an active part in the moose management process [45]. Currently, the role of local authorities in environmental management, including hunting, is being strengthened [55,56]. Management of cervids is implemented in large management areas, each of which comprises of a number of areas, jaktvalds [57]. Each jaktvald has a steering committee and management plans. In these plans, chapters on moose population status, habitats, management goals and means of achieving these goals should be presented, and should be in balance with the goals of the municipality. Municipal goals should correspond to the county, i.e., to the broader territorial and administrative extent [58]. After approving the plan, the municipality issues permits for moose (numbers of bulls, cows and calves), which are distributed to the hunting teams by the jaktvald steering committee [57]. Such a multi-level management is specific to the country and differs from Lithuania.
In Finland, moose management aims have changed from protection and low hunting bag in the 1990s to intensive harvesting to limit population and damage to forests in the mid 1980s and the years since 2000 [59]. Differently to Lithuania, management goals are the stability of population, high reproduction rate and high harvest intensity. As the law requires a minimum of 1000 ha of integrated area for moose hunting, this has resulted in land being rented to hunting clubs [60]. With the rural society aging and members being unable to hunt moose intensively, preferences have changed to lower moose population numbers in recent decades [61]. Currently, moose management is based on monitoring results [62,63].
In Poland, following a peak of 6000 individuals in 1981, moose numbers declined due to intensive hunting and poaching, reaching just 2100 in 2000 [64]. Hunting was stopped in 2001 and thereafter the population grew to 21,323 individuals in 2017 [65]. Following this, there was an expectation of a resumption of hunting in 2018 [66], but this did not happen [67,68]. The most recent population size estimate in Poland was for 26,178 individuals in 2019 [69]. Population growth in the last decades resembles that in Lithuania, and has a similar cause, under-hunting.
In Estonia, moose number fluctuations have been observed, but are not synchronous with the other Baltic States [13,70,71]. Due to forest damage, a reduction in moose numbers was negotiated [72] and, as such, a very high moose bag-to-population ratio has been characteristic to Estonia, being over 50% in 1980, over 40% in 1990–1993 (resulting in a nearly triple decrease in numbers until 1995) and over 60% in 2019 [70]. Thus, moose management is unsustainable for the same reasons and in the same way as in Lithuania. Recent population estimates are provided by users of the hunting districts, as well as by pellet count-based monitoring since 2015 [71]. Quotas on moose are issued by the Hunting Council [73], and approved by the Environmental Board.
In Latvia, the maximum numbers of moose were recorded in 1972: 21,000 by official data and about 45,000 by expert estimation [13]. Similarly to Lithuania, reorganization after independence resulted in a moose number decrease, followed by sharp decrease in the moose hunting bag [74]. Since 2008, continuous growth has been observed until 2020, with the hunting bag closely following population tendencies from 1996 [75]. No management plans for cervids existed in Latvia prior to 2005 [11]. Now moose management in the country is supervised by the State Forest Service. Quotas are set according to estimated numbers and to damage caused to the forest [76]. However, the reliability of such estimates has recently been doubted by the State Audit [77]. Currently, various locally and temporarily introduced management manipulations with quotas and hunting permits are implemented in order to stabilize population structures and prevent conflicts with forestry [78].
Concluding, moose management in Baltic countries and Poland is not sustainable in terms of population and hunting stability and it lacks any long-term strategy.
4.3. Moose-Related Problems: Why Is Management Necessary?
Recovery of populations of large mammals in Europe is beyond doubt [2,7,10,79]. As for ungulates, a lack of a common strategy for their management [7] requires unification, at least in protected territories [9,80].
Ungulates, including moose as the biggest cervid species, are important in boreal and non-boreal ecosystems. Moose have been demonstrated to be keystone species of the forests [81], but under high densities they destroy forest diversity, structure and functioning [82,83]. The impacts of browsing on the other species are mostly indirect, requiring the maintenance of favorable numbers of browsers, monitoring the size of their populations and using an adaptive management approach [84].
We did not analyze moose damage to forest regeneration and young stands, as this is a well-known issue in all countries with high numbers of animals [2,48,67,85,86,87,88]. However, high numbers of moose pose a direct threat to humans, as their large size and long legs cause injuries or lethal consequences in wildlife–vehicle collisions [89]. This also is characteristic to Lithuania, where the growth of moose populations has resulted in an increase in moose-related wildlife–vehicle collisions [90,91]. While mitigation strategies should be species-tailored [92], they are all costly. Moose management measures, such as moose hunting near roads may be another solution [89].
Moose population management is also intertwined with conservation and environmental and economic issues [93]. In the countries with moose permit systems, an increased number of permits benefits hunters, but not necessarily local inhabitants [94].
To be effective, management has to be science-based [2,93]. Moose interactions with forestry, agriculture and transport become increasingly complex [95]. For effective management, ungulates should be considered a part of the ecosystem and their management needs to be holistic [50] and sustainable; the populations of animals should be seen as renewable resources. We found that moose population growth rates may vary significantly between countries, for about 10% in British Columbia during 1996–2015 [96], but up to 30% in the Baltic countries [11,70,78]. This fact alone requires different approaches for maintaining the sustainability of moose populations.
Innovative approaches, such as hunting for fear (diverting animals from areas where they are not desirable) [97], consideration of the issues of functional heterogeneity [98] and social-ecological setting [50] are being used in the management of moose. Classified as services or disservices, “depending on the value orientation and economic position of the various stakeholders perceiving this relationship” [2], moose management may seek different scenarios. Populations could be managed towards an increase, a decrease or to a level of sustainable harvesting. Alternatively, along with monitoring of the situation, no intervention could be applied [81]. Whatever scenario will be applied in the future, Lithuania currently lacks coordinated approach, as the perspective of the moose population is undefined at the state level.
5. Conclusions
In the long term, the moose management approach in Lithuania was not sustainable, as it did not ensure the stability of the moose population, nor the relative stability of the hunting bag or a balance of moose quotas between counties in the country. All decline phases in moose numbers were related legal and administrative issues in the country. Similar situation is characteristic also to other Baltic countries.
Between 1993 and 2020, there were no big differences in the trends of population increment at the county level, probably because wildlife management authorities in Lithuania and each county have controlled bag numbers proactively, so that a continuous increment of the population size was achieved.
The observed continuous growth in moose numbers after 2008, followed by only a moderate increase in the moose hunting bag, is related to the possibility for owners to adopt long-term planning of the hunting plot units. However, Lithuania has no long-term strategy for moose population management at any administrative level.
Supplementary Materials
The following are available online at https://0-www-mdpi-com.brum.beds.ac.uk/2071-1050/12/20/8482/s1, Table S1: Moose numbers (N) and hunting bag (B) size in the territories of 10 counties of Lithuania, 1993–2020, Table S2: Moose densities (individuals per 1000 ha of forest area) in the territories of 10 counties of Lithuania, 1993–2020, Table S3: Moose hunting bag densities (shot individuals per 1000 ha of forest area) in the territories of 10 counties of Lithuania, 1998–2020, Table S4: Correlation matrix between environmental data, moose densities, hunting bag densities and indicators of relative increase in moose numbers, population densities and bag densities, Table S5: Norms of allowable maximum density of ungulates in the forests of Lithuania (1995), which become Norms of recommended maximum density of ungulates in the forests of Lithuania in 2005 [35], Figure S1: Connected scatterplots of changes of moose population numbers in 1998–2020, Figure S2: Connected scatterplots of moose hunting bag changes in 1998–2020.
Author Contributions
Conceptualization, L.B. (Linas Balčiauskas); methodology, L.B. (Linas Balčiauskas) and Y.K.; formal analysis L.B. (Linas Balčiauskas) and Y.K.; literature search, L.B. (Laima Balčiauskienė); data curation, L.B. (Linas Balčiauskas); writing—original draft preparation, L.B. (Linas Balčiauskas), L.B. (Laima Balčiauskienė) and Y.K.; writing—review and editing, L.B. (Linas Balčiauskas), L.B. (Laima Balčiauskienė) and Y.K. All authors have read and agreed to the published version of the manuscript.
Funding
This research received no external funding.
Acknowledgments
Authors acknowledge the help of Andrius Kučas from the Nature Research Centre, Lithuania in obtaining data on environmental variables and Jolanta Urbelionytė from the Ministry of Environment of the Republic of Lithuania for support in obtaining data for moose numbers and bag size. We also thank Eugenijus Tijušas and Rimantas Baleišis for discussion on hunting and legal issues and changes in the hunting organization in Lithuania. Recent data on moose in Estonia were supplied by Juri Tŏnisson. We acknowledge the help of Guna Bagrade and Jānis Ozoliņš in obtaining information from Latvia. Language was edited by Jos Stratford. We are grateful to anonymous reviewers for their comments.
Conflicts of Interest
The authors declare no conflict of interest.
References
- Cretois, B.; Linnell, J.D.C.; Van Moorter, B.; Kaczensky, P.; Nilsen, E.B.; Parada, J.S.; Rød, J.K. Coexistence of large mammals and humans is possible in Europe’s anthropogenic landscapes. EcoEvoRxiv 2020. [Google Scholar] [CrossRef]
- Linnell, J.D.; Cretois, B.; Nilsen, E.B.; Rolandsen, C.M.; Solberg, E.J.; Veiberg, V.; Kaczensky, P.; Van Moorter, A.; Panzacchi, M.; Rauset, G.A.; et al. The challenges and opportunities of coexisting with wild ungulates in the human-dominated landscapes of Europe’s Anthropocene. Biol. Conserv. 2020, 244, 108500. [Google Scholar] [CrossRef]
- Hundertmark, K. Alces alces. The IUCN Red List of Threatened Species 2016: E.T56003281A22157381. 2016. Available online: https://0-dx-doi-org.brum.beds.ac.uk/10.2305/IUCN.UK.2016-1.RLTS.T56003281A22157381.en (accessed on 11 July 2020).
- Wilson, D.E.; Mittermeier, R.A. Handbook of the Mammals of the World. Volume 2. Hoofed Mammals; Lynx Edicions: Barcelona, Spain, 2011; pp. 350–444. [Google Scholar]
- Ruusila, V.; Kojola, I. Ungulates and their management in Finland In European Ungulates and Their Management in the 21st Century; Apollonio, M., Andersen, R., Putman, R., Eds.; Cambridge University Press: Cambridge, UK, 2010; pp. 86–102. [Google Scholar]
- Alix-Garcia, J.; Munteanu, C.; Zhao, N.; Potapov, P.V.; Prishchepov, A.V.; Radeloff, V.C.; Krylov, A.; Bragina, E. Drivers of forest cover change in Eastern Europe and European Russia, 1985–2012. Land Use Policy 2016, 59, 284–297. [Google Scholar] [CrossRef]
- Bragina, E.V.; Ives, A.R.; Pidgeon, A.M.; Balčiauskas, L.; Csányi, S.; Khoyetskyy, P.; Kysucká, K.; Lieskovsky, J.; Ozolins, J.; Randveer, T.; et al. Wildlife population changes across Eastern Europe after the collapse of socialism. Front. Ecol. Environ. 2018, 16, 77–81. [Google Scholar] [CrossRef] [Green Version]
- Razenkova, E.; Radeloff, V.C.; Dubinin, M.; Bragina, E.V.; Allen, A.M.; Clayton, M.K.; Pidgeon, A.M.; Baskin, L.M.; Coops, N.C.; Hobi, M.L. Vegetation productivity summarized by the Dynamic Habitat Indices explains broad-scale patterns of moose abundance across Russia. Sci. Rep. 2020, 10, 1–12. [Google Scholar] [CrossRef] [Green Version]
- Calkoen, S.T.S.V.; Muhlbauer, L.; Andren, H.; Apollonio, M.; Balčiauskas, L.; Belotti, E.; Carranza, J.; Cottam, J.; Filli, F.; Gatiso, T.T.; et al. Ungulate management in European national parks: Why a more integrated European policy is needed. J. Environ. Manag. 2020, 260, 110068. [Google Scholar] [CrossRef]
- Apollonio, M.; Andersen, R.; Putman, R. (Eds.) European Ungulates and Their Management in the 21st Century; Cambridge University Press: New York, NY, USA, 2010; pp. 578–584. [Google Scholar]
- Andersone-Lilley, Ž.; Balčiauskas, L.; Ozoliņš, J.; Randveer, T.; Tõnisson, J. Ungulates and their management in the Baltics (Estonia, Latvia and Lithuania). In European Ungulates and Their Management in the 21st Century; Apollonio, M., Andersen, R., Putman, R., Eds.; Cambridge University Press: New York, NY, USA, 2010; pp. 103–128. [Google Scholar]
- Balciauskas, L. Lithuanian mammal fauna review. Hystrix 1996, 8, 9–15. [Google Scholar]
- Baleishis, R.; Bluzma, P.; Ornicans, A.; Tonisson, J. The history of moose in the Baltic countries. Alces 1998, 34, 339–345. [Google Scholar]
- Baleišis, R.; Bluzma, P.; Balčiauskas, L. Ungulates of Lithuania, 3rd ed.; Akstis: Vilnius, Lithuania, 2003; 217p. [Google Scholar]
- European Environment Agency. Lithuania Land Cover Country Fact Sheet. 2012. Available online: https://www.eea.europa.eu/ds_resolveuid/1ca731f33d0c48a0a4ed60abe67fa6bf (accessed on 16 March 2020).
- National Land Service under the Ministry of Agriculture of the Republic of Lithuania. Available online: http://www.nzt.lt/go.php (accessed on 12 April 2020).
- European Environment Agency. Corine Land Cover 1990, Version 2020_20u1. Available online: https://land.copernicus.eu/pan-european/corine-land-cover/clc-1990?tab=metadata (accessed on 17 September 2020).
- Lithuanian Road Administration under the Ministry of Transport and Communications. Web Map of Annual Average Daily Traffic Data in Lithuania. Available online: http://gissrv.eismoinfo.lt/server/rest/services/LAKD/VMPEI/MapServer?f=jsapi (accessed on 16 March 2020).
- Road Network. Available online: http://lakd.lrv.lt/en/sector-activities/road-network (accessed on 22 July 2019).
- Ubarevičienė, R.; van Ham, M. Population decline in Lithuania: Who lives in declining regions and who leaves? Reg. Stud. Reg. Sci. 2017, 4, 57–79. [Google Scholar] [CrossRef] [Green Version]
- Balčiauskas, L.; Trakimas, G.; Juškaitis, R.; Ulevičius, A.; Balčiauskienė, L. Atlas of Lithuanian Mammals, Amphibians and Reptiles, 2nd ed.; Akstis: Vilnius, Lithuania, 1999; 120p. [Google Scholar]
- Lietuvos Žinduolių Atlasas. Available online: http://www.gamtostyrimai.lt/lt/users/viewGroup/id.24/pageId.26 (accessed on 13 July 2020).
- Medžiojamųjų Žvėrių Apskaita. Available online: https://am.lrv.lt/lt/veiklos-sritys-1/gamtos-apsauga/medziokle/medziojamuju-zveriu-apskaita (accessed on 13 July 2020).
- Aebischer, N.J. Fifty-year trends in UK hunting bags of birds and mammals, and calibrated estimation of national bag size, using GWCT’s National Gamebag Census. E. J. Wildl. Res. 2019, 65, 64. [Google Scholar] [CrossRef]
- Aubry, P.; Guillemain, M.; Sorrenti, M. Increasing the trust in hunting bag statistics: Why random selection of hunters is so important. Ecol. Indic. 2020, 117, 106522. [Google Scholar] [CrossRef]
- Kawata, Y.; Ozoliņš, J.; Baumanis, J. Analysis of wildlife population dynamics using a connected scatter plot: Latvian wild animals as an example. Res. Opin. Anim. Vet. Sci. 2013, 3, 50–59. [Google Scholar]
- Nielsen, M.R.; Treue, T. Hunting for the Benefits of Joint Forest Management in the Eastern Afromontane Biodiversity Hotspot: Effects on Bushmeat Hunters and Wildlife in the Udzungwa Mountains. World Dev. 2012, 40, 1224–1239. [Google Scholar] [CrossRef]
- Anson, M.J.P.; Fabozzi, F.J.; Jones, F.J. The Handbook of Traditional and Alternative Investment Vehicles: Investment Characteristics and Strategies; John Wiley & Sons, Ltd.: Hoboken, New York, NY, USA, 2010; 528p. [Google Scholar]
- Compound Annual Growth Rate—CAGR. Available online: https://www.investopedia.com/terms/c/cagr.asp#what-is-compound-annual-growth-rate--cagr (accessed on 15 June 2020).
- TIBCO Software Inc. Data Science Textbook. Available online: https://docs.tibco.com/data-science/textbook (accessed on 15 March 2020).
- Official Statistics Portal. Available online: https://osp.stat.gov.lt/web/guest/statistiniu-rodikliu-analize?region=10#/ (accessed on 11 July 2020).
- Resident Population, Area and Population Density by County and Municipality at the Beginning of the Year. Available online: https://osp.stat.gov.lt/statistiniu-rodikliu-analize?hash=d471efd9-a240-4ee8-96cf-15b708f0658f#/ (accessed on 11 July 2020).
- Žemulis, F. Medžioklė Tarybiniais Laikais ir Dabar. 2012. Available online: https://www.delfi.lt/grynas/aplinka/medziokle-tarybiniais-laikais-ir-dabar.d?id=57145619 (accessed on 3 August 2020).
- Ribikauskas, V. Žvėrių Gausos Reguliavimas. Available online: https://www.visainfo.lt/zveriu-gausos-reguliavimas-92462 (accessed on 11 May 2020).
- Įsakymas dėl Medžioklėtvarkos Projektų Rengimo, Derinimo, Teikimo Tvirtinti ir Tvirtinimo Tvarkos Aprašo Patvirtinimo. Available online: https://e-seimas.lrs.lt/rs/legalact/TAD/TAIS.252979/ (accessed on 11 May 2020).
- Balčiauskas, L. Game survey as a mean of sustainable population management. In Proceedings of the International Symposium “Rational Management of Cervids in Forest Habitats”, Šiauliai, Lithuania, 28–30 January 2004; Inforastras: Vilnius, Lithuania, 2004; pp. 40–49. [Google Scholar]
- Dėl Medžioklės Tvarkymo Lietuvos Respublikoje. Available online: https://e-seimas.lrs.lt/portal/legalAct/lt/TAD/TAIS.15594/JrvAQzlwKy (accessed on 11 May 2020).
- Dėl Medžioklės Lietuvos Respublikoje Nuostatų Patvirtinimo. Available online: https://e-seimas.lrs.lt/portal/legalActEditions/lt/TAD/TAIS.99217 (accessed on 11 May 2020).
- Dėl Medžioklės Lietuvos Respublikos Teritorijoje Taisyklių Patvirtinimo. Available online: https://e-seimas.lrs.lt/portal/legalActEditions/lt/TAD/TAIS.104124?faces-redirect=true (accessed on 11 May 2020).
- Lietuvos Respublikos medžioklės įstatymas. Available online: https://e-seimas.lrs.lt/portal/legalAct/lt/TAD/TAIS.169653/asr (accessed on 11 May 2020).
- On the Law on Hunting. Available online: https://www.lrkt.lt/en/court-acts/search/170/ta1306/content (accessed on 11 May 2020).
- Dėl Medžioklėtvarkos Projektų Rengimo, Aptarimo ir Derinimo Tvarkos Aprašo Patvirtinimo. Available online: https://e-seimas.lrs.lt/portal/legalAct/lt/TAD/TAIS.252979?jfwid=-6und1xt5i (accessed on 11 May 2020).
- Lietuvos Respublikos Aplinkos Ministras. 2018 m. Gegužės 7 d. Įsakymas Nr. D1-365 “Dėl Lietuvos Respublikos Aplinkos Ministro 2000 m. Birželio 27 d. Įsakymo Nr. 258 “Dėl Medžioklės Lietuvos Respublikos Teritorijoje Taisyklių Patvirtinimo” Pakeitimo”. Available online: https://www.e-tar.lt/portal/legalAct.html?documentId=9379426051dd11e884cbc4327e55f3ca (accessed on 11 May 2020).
- Lietuvos Respublikos Aplinkos Ministras. 2020 m. Gegužės 8 d. Įsakymas Nr. D1-268 “Dėl Lietuvos Respublikos Aplinkos Ministro 2000 m. Birželio 27 d. Įsakymo Nr. 258 “Dėl Medžioklės Lietuvos Respublikos Teritorijoje Taisyklių Patvirtinimo” Pakeitimo”. Available online: https://e-seimas.lrs.lt/portal/legalAct/lt/TAD/977100c2910911eaa51db668f0092944 (accessed on 11 May 2020).
- Lavsund, S.; Nygrén, T.; Solberg, E.J. Status of moose populations and challenges to moose management in Fennoscandia. Alces 2003, 39, 109–130. [Google Scholar]
- Andersen, R.; Lund, E.; Solberg, E.J.; Saether, B.E. Ungulates and their management in Norway. In European Ungulates and Their Management in the 21st Century; Apollonio, M., Andersen, R., Putman, R., Eds.; Cambridge University Press: New York, NY, USA, 2010; pp. 14–36. [Google Scholar]
- Sandström, C.; Wennberg DiGasper, S.; Öhman, K. Conflict resolution through ecosystem-based management: The case of Swedish moose management. Int. J. Commons 2013, 7, 549–570. [Google Scholar] [CrossRef]
- Johansson, M.; Dressel, S.; Ericsson, G.; Sjölander-Lindqvist, A.; Sandström, C. How stakeholder representatives cope with collaboration in the Swedish moose management system. Hum. Dimens. Wildl. 2020, 25, 154–170. [Google Scholar] [CrossRef]
- Sjölander-Lindqvist, A.; Sandström, C. Shaking Hands. Balancing Tensions in the Swedish Forested Landscape. Conserv. Soc. 2019, 17, 319–330. [Google Scholar] [CrossRef]
- Dressel, S.; Ericsson, G.; Sandström, C. Mapping social-ecological systems to understand the challenges underlying wildlife management. Environ. Sci. Policy 2018, 84, 105–112. [Google Scholar] [CrossRef]
- Bergman, M.; Åkerberg, S. Moose hunting, forestry, and wolves in Sweden. Alces 2006, 42, 13–23. [Google Scholar]
- Gunnarsdotter, Y. What happens in a Swedish rural community when the local moose hunt meets hunting tourism? In Tourism and the Consumption of Wildlife; Lovelock, B., Ed.; Routledge: London, UK, 2007; pp. 182–195. [Google Scholar]
- Boman, M.; Mattsson, L.; Ericsson, G.; Kriström, B. Moose hunting values in Sweden now and two decades ago: The Swedish hunters revisited. Environ. Resour. Econ. 2011, 50, 515–530. [Google Scholar] [CrossRef]
- Bjärstig, T.; Sandström, C.; Lindqvist, S.; Kvastegård, E. Partnerships implementing ecosystem-based moose management in Sweden. Int. J. Biodivers. Sci. Ecosyst. Serv. Manag. 2014, 10, 228–239. [Google Scholar] [CrossRef]
- Falleth, E.I.; Hovik, S. Local government and nature conservation in Norway: Decentralization as a strategy in environmental policy. Local Environ. 2009, 14, 221–231. [Google Scholar] [CrossRef]
- Hongslo, E.; Hovik, S.; Zachrisson, A.; Kristine, A.; Lundberg, A. Decentralization of conservation management in Norway and Sweden—Different translations of an international trend. Soc. Nat. Resour. 2015, 29, 998–1014. [Google Scholar] [CrossRef] [Green Version]
- Hoffman, M.; Flø, B.E. Reconciling local control with appropriate scale in Norwegian moose management. J. Environ. Pol. Plan. 2017, 19, 183–196. [Google Scholar] [CrossRef]
- Regulations on the Management of Deer Antlers. Available online: https://lovdata.no/dokument/SF/forskrift/2016-01-08-12 (accessed on 10 July 2020).
- Luoma, A. Moose Hunting in Finland: Management of a Heavily Harvested Population. Academic Dissertation. University of Helsinki, Helsinki, Completed in 2002. Available online: https://helda.helsinki.fi/bitstream/handle/10138/22172/moosehun.pdf?sequence=2 (accessed on 12 June 2020).
- Selby, A.; Petäjistö, L.; Koskela, T. Threats to the sustainability of moose management in Finland. Alces 2005, 41, 63–74. [Google Scholar]
- Horne, P.; Petäjistö, L. Preferences for alternative moose management regimes among Finnish landowners: A choice experiment approach. Land Econ. 2003, 79, 472–482. [Google Scholar] [CrossRef]
- Helle, P.; Ikonen, K.; Kantola, A. Wildlife monitoring in Finland: Online information for game administration, hunters, and the wider public. Can. J. For. Res. 2016, 46, 1491–1496. [Google Scholar] [CrossRef]
- Hiedanpää, J.; Pellikka, J. Adapting moose hunting: A case study on fragmented hunting grounds around Nuuksio National Park in Helsinki metropolitan area, Finland. Eur. J. Wildl. Res. 2015, 61, 303–312. [Google Scholar] [CrossRef]
- Wawrzyniak, P.; Jędrzejewski, W.; Jędrzejewska, B.; Borowik, T. Ungulates and their management in Poland. In European Ungulates and Their Management in the 21st Century; Apollonio, M., Andersen, R., Putman, R., Eds.; Cambridge University Press: New York, NY, USA, 2010; pp. 223–242. [Google Scholar]
- Leśnictwo. 2017. Available online: https://stat.gov.pl/obszary-tematyczne/rolnictwo-lesnictwo/lesnictwo/lesnictwo-2017,1,13.html (accessed on 14 August 2020).
- Borowik, T.; Ratkiewicz, M.; Maślanko, W.; Duda, N.; Rode, P.; Kowalczyk, R. Living on the edge–The predicted impact of renewed hunting on moose in national parks in Poland. Basic Appl. Ecol. 2018, 30, 87–95. [Google Scholar] [CrossRef]
- Dziki-Michalska, K.; Tajchman, K.; Budzyńska, M. Increase in the moose (Alces alces L. 1758) population size in Poland: Causes and consequences. Anim. Sci. 2019, 58, 203–214. [Google Scholar]
- Nasiadka, P. Łoś a Sprawa Polska [Moose and the Polish Case]; Brać Łowiecka: Warszawa, Poland, 2018; pp. 54–56. [Google Scholar]
- Leśnictwo. 2019. Available online: https://stat.gov.pl/obszary-tematyczne/roczniki-statystyczne/roczniki-statystyczne/rocznik-statystyczny-lesnictwa-2019,13,2.html (accessed on 15 August 2020).
- Tönisson, J.; (Estonian Hunters’ Society, Tallinn, Estonia). Personal communication, 2020.
- Wildlife and Forest. Available online: https://www.keskkonnaagentuur.ee/en/wildlife-and-forest (accessed on 22 July 2019).
- Filippov, M. Too many Moose. Available online: https://news.postimees.ee/1282732/too-many-moose (accessed on 16 August 2020).
- Hunting Act. Available online: https://www.riigiteataja.ee/en/eli/ee/525062014008/consolide (accessed on 20 July 2020).
- Gaross, V. The situation with moose in Latvia. Balt. For. 1997, 3, 58–60. [Google Scholar]
- Moose (Alces alces) Number Dynamics in Latvia. Available online: https://www.zm.gov.lv/public/files/CMS_Static_Page_Doc/00/00/00/85/02/Alnudinamika.jpg (accessed on 15 August 2020).
- Roberts, P. Deer, Moose & Forestry in Latvia. Available online: https://archnetwork.org/deer-moose-forestry-in-latvia/ (accessed on 15 July 2020).
- BNN. State Audit: Records of Hunted Species in Latvia Is Imprecise. Available online: https://bnn-news.com/state-audit-records-of-hunted-species-in-latvia-is-imprecise-215047 (accessed on 8 August 2020).
- Bagrade, G.; Ozoliņš, J.; (Latvian State Forest Research Institute “Silava”, Salaspils, Latvia). Personal communication, 2020.
- Chapron, G.; Kaczensky, P.; Linnell, J.D.C.; von Arx, M.; Huber, D.; Andren, H.; Lopez-Bao, J.V.; Adamec, M.; Alvares, F.; Anders, O.; et al. Recovery of large carnivores in Europe’s modern human-dominated landscapes. Science 2014, 346, 1517–1519. [Google Scholar] [CrossRef] [PubMed] [Green Version]
- Found, R. Managing large herbivores in protected areas. Glob. J. Ecol. 2016, 1, 1–11. [Google Scholar] [CrossRef] [Green Version]
- European Non-Wood Forest Products Network. European elk: Alces alces alces. Available online: https://nwfps.sumins.hr/nwfp/european-elk/ (accessed on 1 April 2020).
- Angelstam, P.; Pedersen, S.; Manton, M.; Garrido, P.; Naumov, V.; Elbakidze, M. Green infrastructure maintenance is more than land cover: Large herbivores limit recruitment of key-stone tree species in Sweden. Landsc. Urban. Plan. 2017, 167, 368–377. [Google Scholar] [CrossRef]
- Ramirez, J.I.; Jansen, P.A.; Poorter, L. Effects of wild ungulates on the regeneration, structure and functioning of temperate forests: A semi-quantitative review. For. Ecol. Manag. 2018, 424, 406–419. [Google Scholar] [CrossRef]
- Katona, K.; Coetsee, C. Impacts of Browsing and Grazing Ungulates on Faunal Biodiversity. In The Ecology of Browsing and Grazing II. Ecological Studies (Analysis and Synthesis); Gordon, I., Prins, H., Eds.; Springer: Cham, Switzerland, 2019; pp. 277–300. [Google Scholar]
- Ezebilo, E.E.; Sandström, C.; Ericsson, G. Browsing damage by moose in Swedish forests: Assessments by hunters and foresters. Scand. J. For. Res. 2012, 27, 659–668. [Google Scholar] [CrossRef]
- Gicquel, M.; Sand, H.; Månsson, J.; Wallgren, M.; Wikenros, C. Does recolonization of wolves affect moose browsing damage on young Scots pine? For. Ecol. Manag. 2020, 473, 118298. [Google Scholar] [CrossRef]
- Lindmark, M.; Sunnerheim, K.; Jonsson, B.G. Natural browsing repellent to protect Scots pine Pinus sylvestris from European moose Alces alces. For. Ecol. Manag. 2020, 474, 118347. [Google Scholar] [CrossRef]
- Pedersen, S.; Angelstam, P.; Manton, M. Macroecological Research in Boreal Forest Reveals the Effects of Moose on Economically and Ecologically Important Tree Species. Известия высших учебных заведений Леснoй журнал 2018, 4, 9–18. [Google Scholar]
- Neumann, W.; Ericsson, G. Influence of hunting on movements of moose near roads. J. Wildl. Manag. 2018, 82, 918–928. [Google Scholar] [CrossRef]
- Wierzchowski, J.; Kučas, A.; Balčiauskas, L. Application of least-cost movement modeling in planning wildlife mitigation measures along transport corridors: Case study of forests and moose in Lithuania. Forests 2019, 10, 831. [Google Scholar] [CrossRef] [Green Version]
- Kučas, A.; Balčiauskas, L. Temporal patterns of ungulate-vehicle collisions in Lithuania. J. Environ. Manag. 2020, 273, 111172. [Google Scholar] [CrossRef]
- Laliberté, J.; St-Laurent, M.H. In the wrong place at the wrong time: Moose and deer movement patterns influence wildlife-vehicle collision risk. Accid. Anal. Prev. 2020, 135, 105365. [Google Scholar] [CrossRef]
- Gordon, I.J.; Hester, A.J.; Festa-Bianchet, M. The management of wild large herbivores to meet economic, conservation and environmental objectives. J. Appl. Ecol. 2004, 41, 1021–1031. [Google Scholar] [CrossRef]
- Grima, N.; Fisher, B.; Ricketts, T.H.; Sonter, L.J. Who benefits from ecosystem services? Analysing recreational moose hunting in Vermont, USA. Oryx 2019, 53, 707–715. [Google Scholar] [CrossRef]
- Apollonio, M.; Belkin, V.V.; Borkowski, J.; Borodin, O.I.; Borowik, T.; Cagnacci, F.; Danilkin, A.A.; Danilov, P.I.; Faybich, A.; Ferretti, F.; et al. Challenges and science-based implications for modern management and conservation of European ungulate populations. Mammal Res. 2017, 62, 209–217. [Google Scholar] [CrossRef] [Green Version]
- Kuzyk, G.; Hatter, I.; Marshall, S.; Procter, C.; Cadsand, B.; Lirette, D.; Schindler, H.; Bridger, M.; Stent, P.; Walker, A.; et al. Moose population dynamics during 20 years of declining harvest in British Columbia. Alces 2018, 54, 101–119. [Google Scholar]
- Cromsigt, J.P.; Kuijper, D.P.; Adam, M.; Beschta, R.L.; Churski, M.; Eycott, A.; Kerley, G.I.; Mysterud, A.; Schmidt, K.; West, K. Hunting for fear: Innovating management of human–wildlife conflicts. J. Appl. Ecol. 2013, 50, 544–549. [Google Scholar] [CrossRef]
- Fynn, R.W.S.; Augustine, D.J.; Fuhlendorf, S.D. Managing Browsing and Grazing Ungulates. In The Ecology of Browsing and Grazing II. Ecological Studies (Analysis and Synthesis); Gordon, I., Prins, H., Eds.; Springer: Cham, Switzerland, 2019; pp. 321–338. [Google Scholar]
Publisher’s Note: MDPI stays neutral with regard to jurisdictional claims in published maps and institutional affiliations. |
Figure 1.
Study area. Forest area is shown by green color, main roads—by red lines and numbers A1–A18, county boundaries—by blue lines. Inset shows location of Lithuania.
Figure 1.
Study area. Forest area is shown by green color, main roads—by red lines and numbers A1–A18, county boundaries—by blue lines. Inset shows location of Lithuania.

Figure 2.
Moose population, hunting bag (a) and bag-to-population ratio (b) changes in Lithuania, 1962–2020.
Figure 2.
Moose population, hunting bag (a) and bag-to-population ratio (b) changes in Lithuania, 1962–2020.

Figure 3.
Connected scatterplots of moose population (a) and bag (b) changes in 1962–2020. Different scales confirm that bag changes are of a higher amplitude, and thus underwent strong regulation. The years provided are those of I(t + 1).
Figure 3.
Connected scatterplots of moose population (a) and bag (b) changes in 1962–2020. Different scales confirm that bag changes are of a higher amplitude, and thus underwent strong regulation. The years provided are those of I(t + 1).

Figure 4.
Changes in moose hunting bag in relation to population changes (a). I(t) of hunting bag presented on the vertical and I(t) of population on the horizontal axis. Outlier years are shown in red font. Removing outliers confirms linearity of relation (b).
Figure 4.
Changes in moose hunting bag in relation to population changes (a). I(t) of hunting bag presented on the vertical and I(t) of population on the horizontal axis. Outlier years are shown in red font. Removing outliers confirms linearity of relation (b).

Figure 5.
Trends of relative population increase in the counties of Lithuania, 1993–2020. Population sizes in 1993 were defined as 100.
Figure 5.
Trends of relative population increase in the counties of Lithuania, 1993–2020. Population sizes in 1993 were defined as 100.

Figure 6.
Comparison of the stability of population and bag size increments using the MAVI.


Table 1.
Compound annual growth rate (in %) of moose population, hunting bag and bag-to-population ratio in Lithuania, 1962–2020. Periods are assigned according to the most expressed changes. Arrows denote direction of change.
Table 1.
Compound annual growth rate (in %) of moose population, hunting bag and bag-to-population ratio in Lithuania, 1962–2020. Periods are assigned according to the most expressed changes. Arrows denote direction of change.
| Period | 1962–73↑ | 1973–77↓ | 1978–89→ | 1989–95↓ | 1996–2004→ | 2006–20↑ |
| Population growth | 13.79 | −7.79 | 1.04 | −15.27 | 2.84 | 10.56 |
| Period | 1962–1975↑ | 1976–1978↓ | 1979–1989↑ | 1990–1993↓ | 1994–2012→ | 2013–2019↑ |
| Hunting bag | 45.0 | −24.33 | 6.69 | −30.98 | 4.66 | 25.11 |
| Period | 1962–1976↑ | 1976–1978↓ | 1979–1989↑ | 1990–2008↓ | 2009–2019↑ | |
| Bag/pop ratio | 28.43 | −20.45 | 5.91 | −14.01 | 17.11 | |
Table 2.
Relative increase in moose density and hunting bag density (individuals per 1000 ha of forest area) in the counties of Lithuania.
Table 2.
Relative increase in moose density and hunting bag density (individuals per 1000 ha of forest area) in the counties of Lithuania.
| Density, Times | Density, CAGR * | Bag, Times | Bag, CAGR | |||||||||
|---|---|---|---|---|---|---|---|---|---|---|---|---|
| County | 1 ** | 2 | 3 | 1 | 2 | 3 | 4 | 5 | 6 | 4 | 5 | 6 |
| Alytaus | 1.65 | 6.56 | 4.44 | 6.45 | 6.95 | 9.77 | 1.10 | 4.36 | 4.44 | 3.11 | 6.61 | 9.77 |
| Kauno | 2.23 | 9.14 | 6.32 | 10.54 | 8.22 | 12.21 | 1.56 | 6.41 | 6.32 | 16.08 | 8.41 | 12.21 |
| Klaipėdos | 1.34 | 6.21 | 7.03 | 3.73 | 6.74 | 12.96 | 1.44 | 6.68 | 7.03 | 12.97 | 8.61 | 12.96 |
| Marijampolės | 0.90 | 4.93 | 6.56 | −1.28 | 5.86 | 12.48 | 1.07 | 5.85 | 6.56 | 2.33 | 7.99 | 12.48 |
| Panevėžio | 1.02 | 3.12 | 3.42 | 0.24 | 4.15 | 7.99 | 1.23 | 3.77 | 3.42 | 7.13 | 5.94 | 7.99 |
| Šiaulių | 0.84 | 7.04 | 9.37 | −2.09 | 7.22 | 15.01 | 1.26 | 10.53 | 9.37 | 8.07 | 10.78 | 15.01 |
| Tauragės | 0.97 | 3.15 | 4.69 | −0.36 | 4.18 | 10.15 | 1.06 | 3.44 | 4.69 | 2.04 | 5.52 | 10.15 |
| Telšių | 2.51 | 11.07 | 6.53 | 12.21 | 8.97 | 12.45 | 1.70 | 7.50 | 6.53 | 19.43 | 9.16 | 12.45 |
| Utenos | 2.45 | 6.13 | 3.11 | 16.07 | 6.69 | 7.34 | 2.05 | 5.13 | 3.11 | 26.94 | 7.36 | 7.34 |
| Vilniaus | 2.36 | 9.15 | 5.07 | 11.32 | 8.23 | 10.68 | 1.46 | 5.66 | 5.07 | 13.41 | 7.83 | 10.68 |
* CAGR—Compound annual growth rate; ** Periods compared: 1—1993 to 2000, 2—1993 to 2020, 3—2005 to 2020, 4—1998 to 2000, 5—1998 to 2019, 6—2005 to 2019.
Table 3.
County-related environmental data and moose population densities: AREA—area, km2 [32], FOR %—forest percentage from the area in 2018, FI1%—increase in forest percentage from 1990 to 2018, FI2%—increase in forest percentage from 2014 to 2018, WETL%—wetland percentage from the area, WATER%—waterbody percentage from the area, HD—human population density per km2, all as for 2018. All data sources are listed in 2.1.
| County | AREA | FOR% | FI1% | FI2% | WETL% | WATER% | HD |
|---|---|---|---|---|---|---|---|
| Alytaus | 5418 | 49.5 | 2.8 | 0.4 | 1.13 | 1.94 | 25.5 |
| Kauno | 8086 | 29.7 | 1.7 | 0 | 0.14 | 2.26 | 69.9 |
| Klaipėdos | 5222 | 26.6 | 2.0 | 0.1 | 1.16 | 10.29 * | 60.8 |
| Marijampolės | 4466 | 22 | 1.7 | 0 | 0.43 | 0.95 | 31.6 |
| Panevėžio | 7878 | 28.7 | 1.8 | 0.5 | 0.67 | 0.82 | 27.8 |
| Šiaulių | 8537 | 28.1 | 1.8 | 0.5 | 0.81 | 0.88 | 31.1 |
| Tauragės | 4408 | 33.2 | 2.5 | 0.1 | 0.42 | 1.03 | 21.7 |
| Telšių | 4350 | 36.7 | 3.0 | 0.4 | 0.73 | 1.19 | 30.8 |
| Utenos | 7191 | 34.7 | 4.3 | 0.4 | 1.01 | 5.48 | 18.0 |
| Vilniaus | 9730 | 44.3 | 4.5 | 0.3 | 1.72 | 4.05 | 82.8 |
* Area of the Curonian Lagoon is included for Klaipėdos county.
© 2020 by the authors. Licensee MDPI, Basel, Switzerland. This article is an open access article distributed under the terms and conditions of the Creative Commons Attribution (CC BY) license (http://creativecommons.org/licenses/by/4.0/).
Share and Cite
MDPI and ACS Style
Balčiauskas, L.; Kawata, Y.; Balčiauskienė, L. Moose Management Strategies under Changing Legal and Institutional Frameworks. Sustainability 2020, 12, 8482. https://0-doi-org.brum.beds.ac.uk/10.3390/su12208482
AMA Style
Balčiauskas L, Kawata Y, Balčiauskienė L. Moose Management Strategies under Changing Legal and Institutional Frameworks. Sustainability. 2020; 12(20):8482. https://0-doi-org.brum.beds.ac.uk/10.3390/su12208482
Chicago/Turabian StyleBalčiauskas, Linas, Yukichika Kawata, and Laima Balčiauskienė. 2020. "Moose Management Strategies under Changing Legal and Institutional Frameworks" Sustainability 12, no. 20: 8482. https://0-doi-org.brum.beds.ac.uk/10.3390/su12208482
Note that from the first issue of 2016, this journal uses article numbers instead of page numbers. See further details here.