Energy Generation Performance of Window-Type Dye-Sensitized Solar Cells by Color and Transmittance


1
Graduate School, Chonnam National University, Gwangju 61186, Korea
2
School of Architecture, Chonnam National University, Gwangju 61186, Korea
*
Author to whom correspondence should be addressed.
Sustainability 2020, 12(21), 8961; https://0-doi-org.brum.beds.ac.uk/10.3390/su12218961
Submission received: 10 September 2020
/
Revised: 19 October 2020
/
Accepted: 26 October 2020
/
Published: 28 October 2020
(This article belongs to the Special Issue Integration and Control of Renewable Energy and Power Electronics for Future Power Systems)
Abstract
:Previous research has shown Dye-Sensitized Solar Cells (DSSCs) to have excellent applicability for building exterior materials and windows, because they can be controlled in terms of Visible Light Transmittance (VLT) and color, and thus have good variability. However, windows with solar cells may not show ideal energy generation efficiency. This depends on a variety of factors, such as window composition, shadow, and light scattering. In this paper, through mock-up tests, the energy generation of DSSCs with various transmittances and colors was measured. Red, Green, and Blue (RGB)-based DSSCs of 7, 10, and 20% VLT were used, and Pmax values were measured for solar radiation for comparison. As a result of the comparison, performance estimates were made for each color and VLT when used as a window. In this study, the electrical energy generated by DSSCs was measured in an environment applied to a real window, not a virtual environment. Therefore, the study is meaningful, in that data that can estimate performance when applying various types of DSSCs in a real-world window environment were created.
1. Introduction
1.1. Background and Purpose of the Study
New and renewable energies are divided into eleven types that comprise hydrogen energy, fuel cell, coal liquefied gasification energy, heavy residue gasification energy, solar energy, wind power, bio energy, waste energy, geothermal power, hydro power, and marine energy [1]. According to a statistical survey by the Korean Statistical Information Service (KOSIS), since 2010, the generation rate of new and renewable energy has grown rapidly from 1.24%, to 8.88% in 2018, and during the same period, solar energy production grew from 166,200 to 1,997,100 toe—a 1200% growth [2]. Solar energy is growing rapidly compared to the 187% growth rate of waste energy (9,084,200 toe, 50.93%), which has the highest rate of new and renewable energy. Therefore, analysis shows that solar energy will lead the new and renewable energy market in the future.
The rapid growth of solar energy is to be more emphasized, because it is easier to install than other new and renewable energy sources, and is obtained in the form of electric energy. Due to these advantages, the applicability of solar energy is being tested in various fields, such as construction and automobiles. In particular, in the field of construction, a significant amount of development has been made through Building Integrated Photovoltaic System (BIPV) technology. BIPV in its early stages was developed as a system that applied solar cells to rooftops and roofs, and developed cells to be installed on walls. Recently, additional attempts have been made to apply the technology to curtain walls and windows to enable viewing and ensure its flexible development. In accordance with this research flow, curtain walls and windows using various solar cells have recently been studied, and Table 1 shows that they can be classified according to the generation of solar cells:
The first-generation solar cell is a module using crystalline silicon, and can be classified into single crystal, polycrystalline, and Heterojunction with Intrinsic Thin-layer (HIT). In general, when applied to curtain walls and windows, natural light flows into the room through empty spaces created between modules by installing a single crystal silicon solar cell on the glass part. Solar cells in the range of the second-generation include Cadmium–Tellurium (Cd–Te) solar cells, Copper Indium Gallium Selenide (CIGS) solar cells, and Amorphous Silicon (a–Si) solar cells [6]. Among them, there are attempts to apply a–Si solar cells to curtain walls and windows. a–Si solar cells have been shown to decrease the main light rate when viewed from the inside and outside, but to maintain the light at an appropriate level, and decrease the frequency of occurrence of unpleasant bright spots [7]. The Dye-Sensitized Solar Cell (DSSC), perovskite solar cell, and organic solar cell are classified as third-generation solar cells, and steady attempts to apply them to curtain walls and windows have been made [6].
In particular, DSSC is a material that has attracted attention, because it has excellent window applicability, in that compared to other solar cells, color and control transparency can freely be implemented. Aesthetic and architectural environment studies are being conducted to ensure that DSSC can be properly applied to buildings. Jo addressed the aesthetic factors of elevation of the solar cells of each generation, and analyzed the importance of each elevation through the Analytic Hierarchy Process (AHP) [8]. Oh analyzed the indoor light performance of an office building for the application type of DSSCs having a visible light transmittance of 20%, and used simulation as an analysis method [9]. In addition, Kim measured the performance of DSSCs’ indoor color environment, and the shape perception of various colors and visible light transmittance [10]. Research on the energy generation performance of DSSCs is also being actively conducted. Most studies have been conducted to improve the performance of DSSCs, such as studies to improve its performance using nickel oxide nanostructures [11], and studies on its efficiency according to the amount of dye, and the effect of light scattering [12]. However, in the case of DSSCs applied to buildings, it is difficult to exert the theoretical efficiency because it is affected by various factors, such as the composition of windows, and the scattering of light. There is a lack of research on power generation efficiency when actually applied to architectural windows. Therefore, this study aims to measure the power generation efficiency when applying DSSCs of various colors to real architectural windows that can be used in architecture.
1.2. Method Analysis of Previous Research
1.2.1. Precedent DSSCs Efficiency Research on Building Application
The study of the efficiency of DSSCs applied to buildings has been conducted through simulations that consider the visible light transmittance of windows and doors. Kim (2010) used the regression equation to derive Equation (1) for power generation performance by the solar cell permeability of DSSCs [13]. This equation was derived through a monographic study for evaluating the minimum transmittance and unpleasant glare of windows that were previously studied [14,15].
Y = −0.0267489(X) + 8.18587
Y: Power Generation Efficiency; X: Visible Light Transmittance.
Kim analyzed the lighting efficiency by azimuth for blue and red DSSCs windows through simulation, but no study on energy efficiency was performed [16]. Poh Khai conducted energy analysis according to the transmittance of BIPV, and performed simulation under various climatic conditions [17]. Park conducted simulations based on the properties of the specimens derived from the KS L 2514 test [18]. This research was conducted through the DesignBuilder program, and compared the overall building energy performance when applying Low-E glass, and Red, Green, Blue, and Yellow DSSCs.
While studies based on VLT were conducted in the early stages, in recent years, overall energy comparison and evaluation of various colors has been conducted. In addition, by considering the overall energy performance, such as lighting and power generation efficiency, a more advanced study was conducted at the same time by comparison with Low-E glass. However, most of the studies were evaluated by relying on simulation techniques, so there is a lack of data on actual use.
1.2.2. Mock-Up Test Prior Research
The test to measure the power generation efficiency of a solar cell by constructing a mock-up is to measure the actual power generation efficiency of a solar cell, or to compare and analyze a control group. S. M. Lee constructed a mock-up with a hexagonal plane and a dome structure that allowed the installation of solar cells in multiple directions [19]. Through this, a comparative analysis of power generation efficiency of each crystalline silicon solar cell and an a–Si solar cell by installation angle and orientation was performed. Through the regression equation, the power generation efficiency equation was derived for angle and bearing. H.M. Lee also measured the efficiency of DSSCs through a mock-up configuration [20]. The efficiency was measured by division into a vertical window and an inclined window. At the same time, the efficiency of a single crystal solar cell was also measured. Based on this, the power generation efficiency of the solar cell was monitored for two years, and its monthly data were collected. Table 2 shows the mock-up structure established in the row study.
Analysis of the power generation efficiency of solar cells through mock-up has the advantage of providing more practical data for the actual construction of applied solar cell than simulation analysis allows. In addition, even factors that were not reflected in the simulation are reflected, so it can be utilized to provide more accurate and specific data. However, there is also the disadvantage that it is more expensive and time-consuming than simulation analysis. Moreover, once the mock-up is configured, various problems occur, because it is difficult to change the composition of the specimen as well. S. M. Lee judged some solar cells to be defective, so their data were missing [19]; and likewise, H. M. Lee was unable to measure data in some periods [20]. Therefore, in this study, the test mock-up was established for the purpose of identifying and analyzing errors, and comparative analysis was conducted of the data measured through the test.
2. Research Analysis Framework
2.1. Method and Scope of Research
The theoretical power generation efficiency of DSSCs are known to be less than 11% [21]. However, the efficiency of DSSCs applied to windows appear different to the theoretical values, because of the composition of windows, light scattering, etc. In this study, the power generation performance was measured when various DSSCs were applied to windows, and the mock-up test was used. To derive a direct relationship between solar radiation and power generation, pyranometer and solar cell tester were installed. Measurement was carried out through equipment that was capable of monitoring electricity generated simultaneously with solar radiation measurement.
Analysis of the relationship between solar radiation and the DSSCs applied to windows was conducted using the measured data. In addition, a study was conducted by quantifying and comparing the performance differences based on the analysis contents by color and VLT.
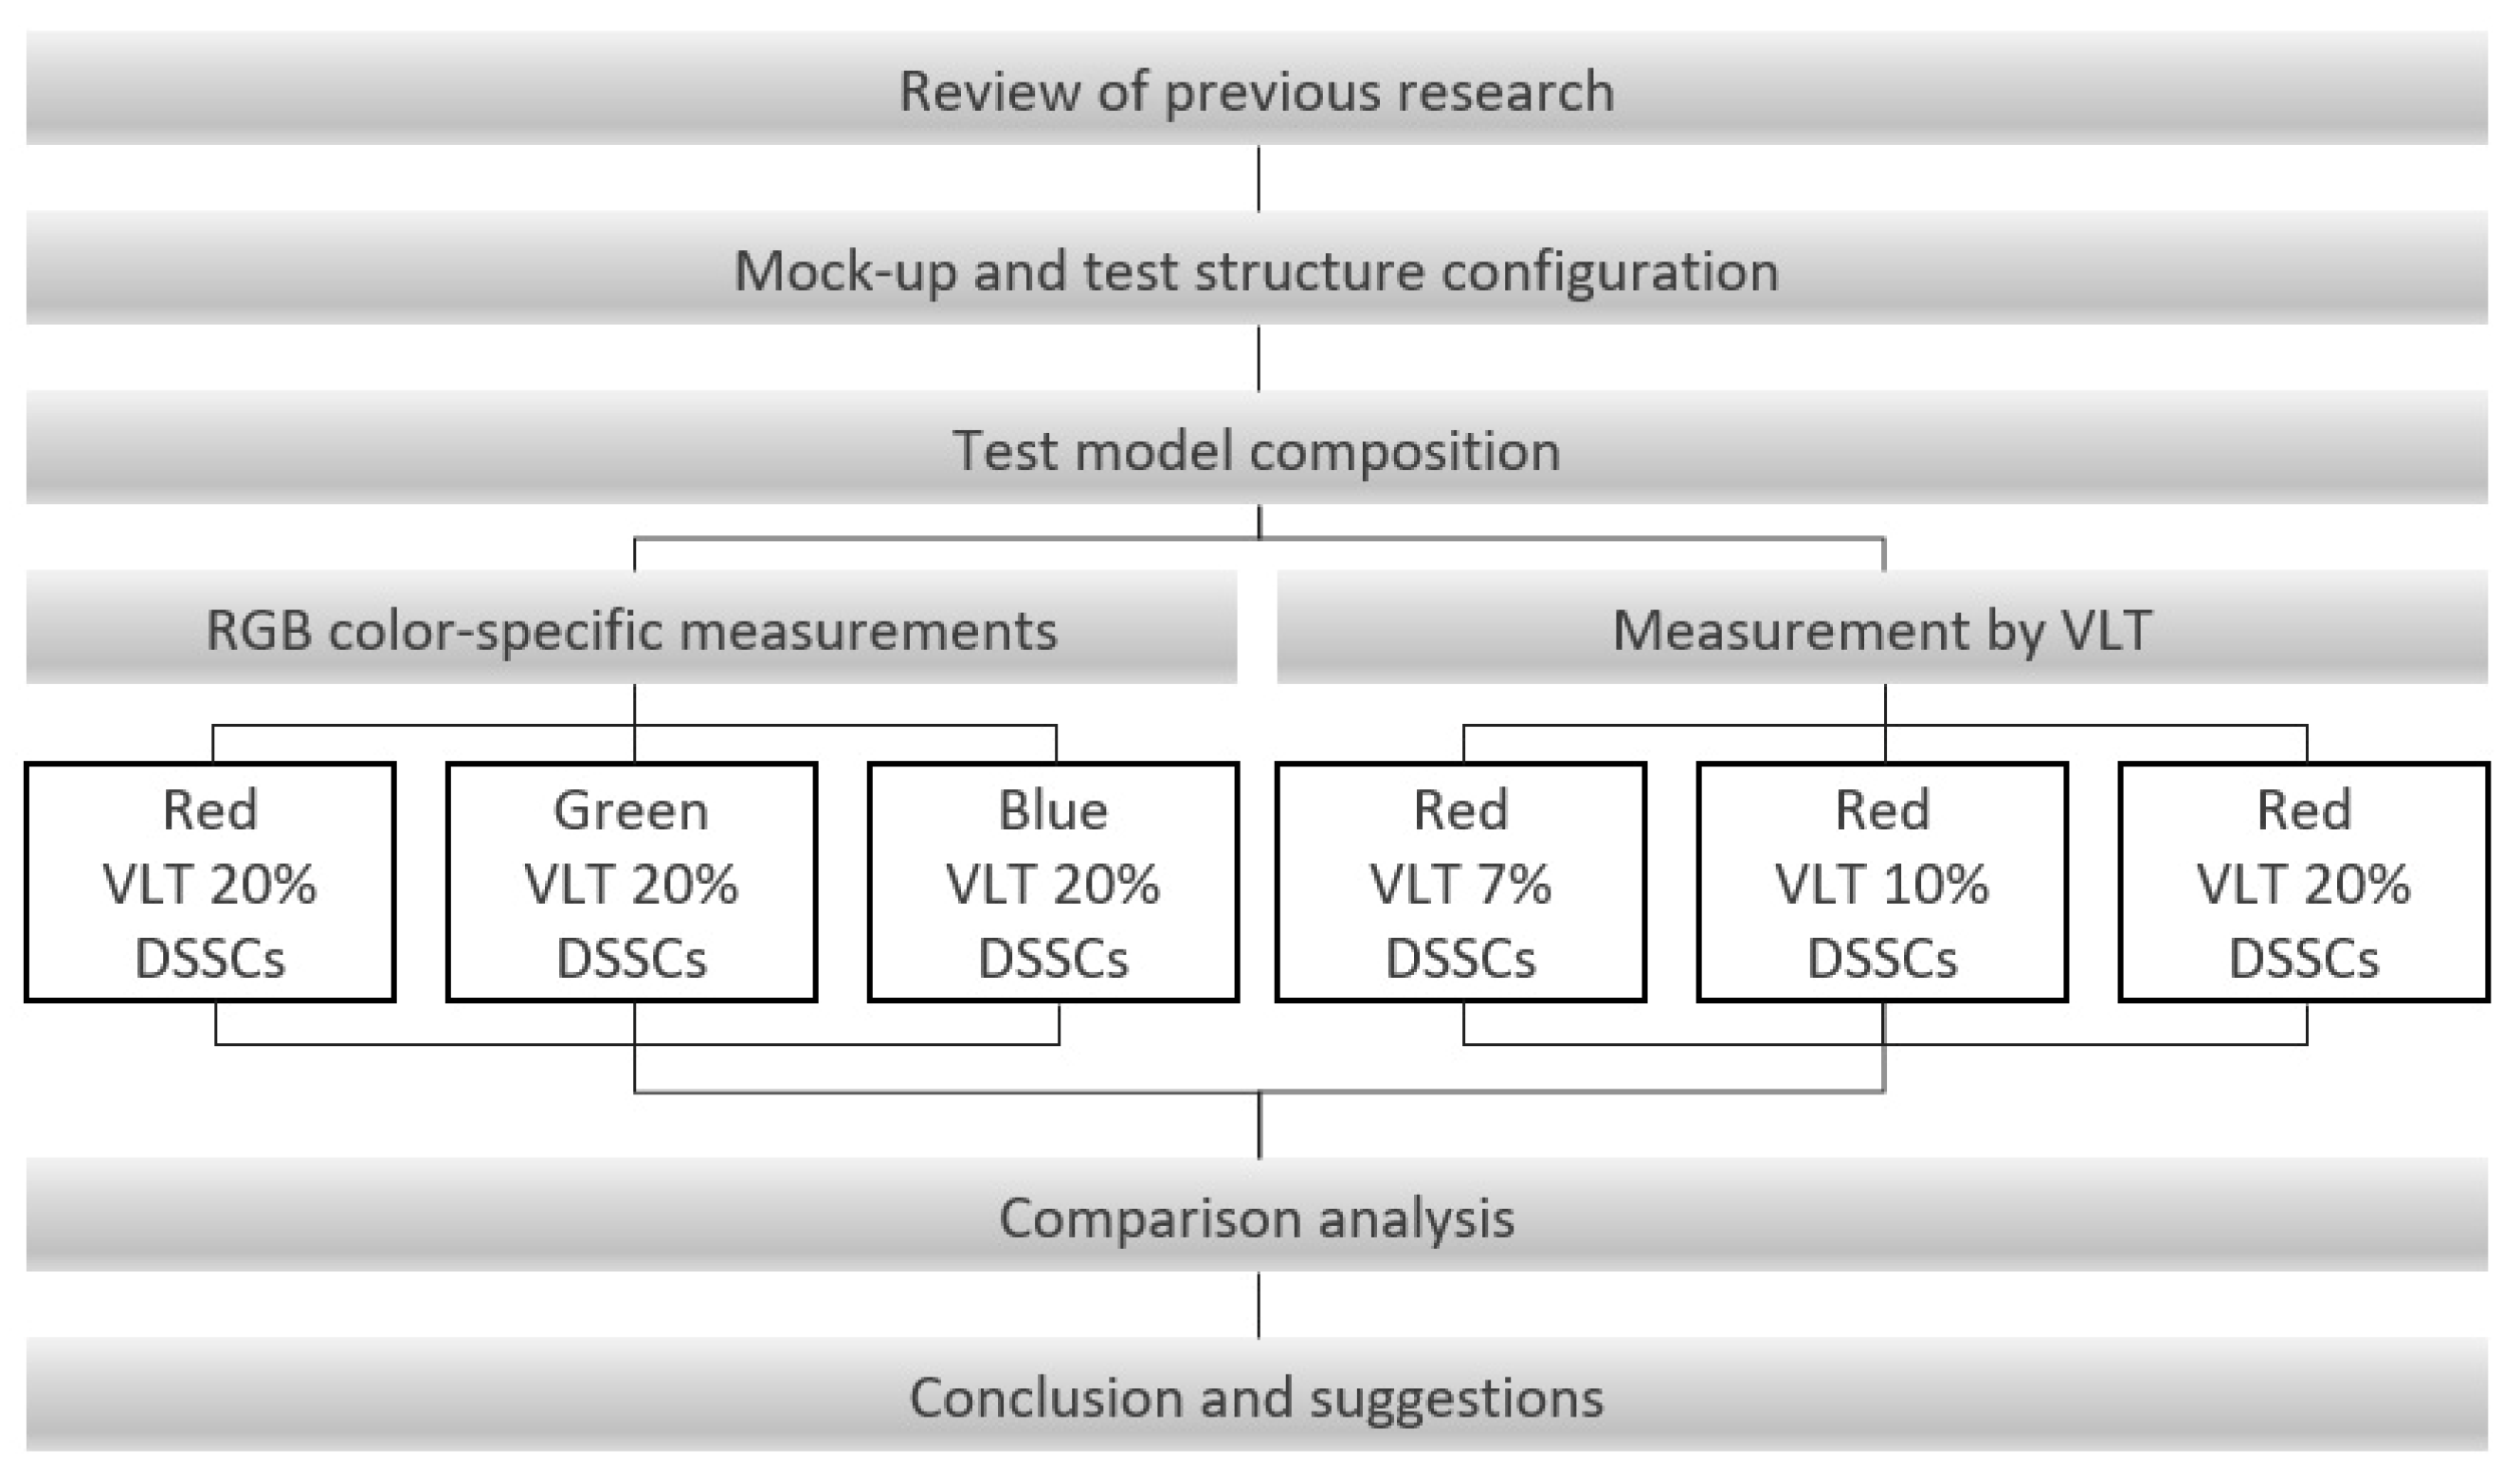
The power generation of red, green, and blue DSSCs with the same VLT were compared, then 7, 10, and 20% VLT were compared for cells of the same color. DSSCs have durability problems, such as deterioration and damage. Therefore, a double-glazed structure that can primarily absorb shocks, rather than directly exposing DSSCs to the outside, can increase the service life. The test body was composed of double-glazed structure. The research flow is shown in Figure 1.
2.2. Test Configuration
2.2.1. Specimen Configuration
The DSSCs used for the test consisted of five types. Red DSSCs with VLTs of 7, 10, and 20% (RD07, RD10, and RD20, respectively) were configured for each VLT. Red, Green, and Blue DSSCs with VLT 20% (RD20, GD20, and BD20, respectively) were constructed to measure the efficiency of each RGB color. All sizes were of 965 mm by 624 mm dimensions, and Table 3 shows the information registered in the product catalog. The specifications of the solar cell show that the difference in the range of Voc is not large. On the other hand, they show the difference in Isc to be large, and the performance of DSSCs was therefore determined.
2.2.2. DSSCs Test Mock-Up Configuration
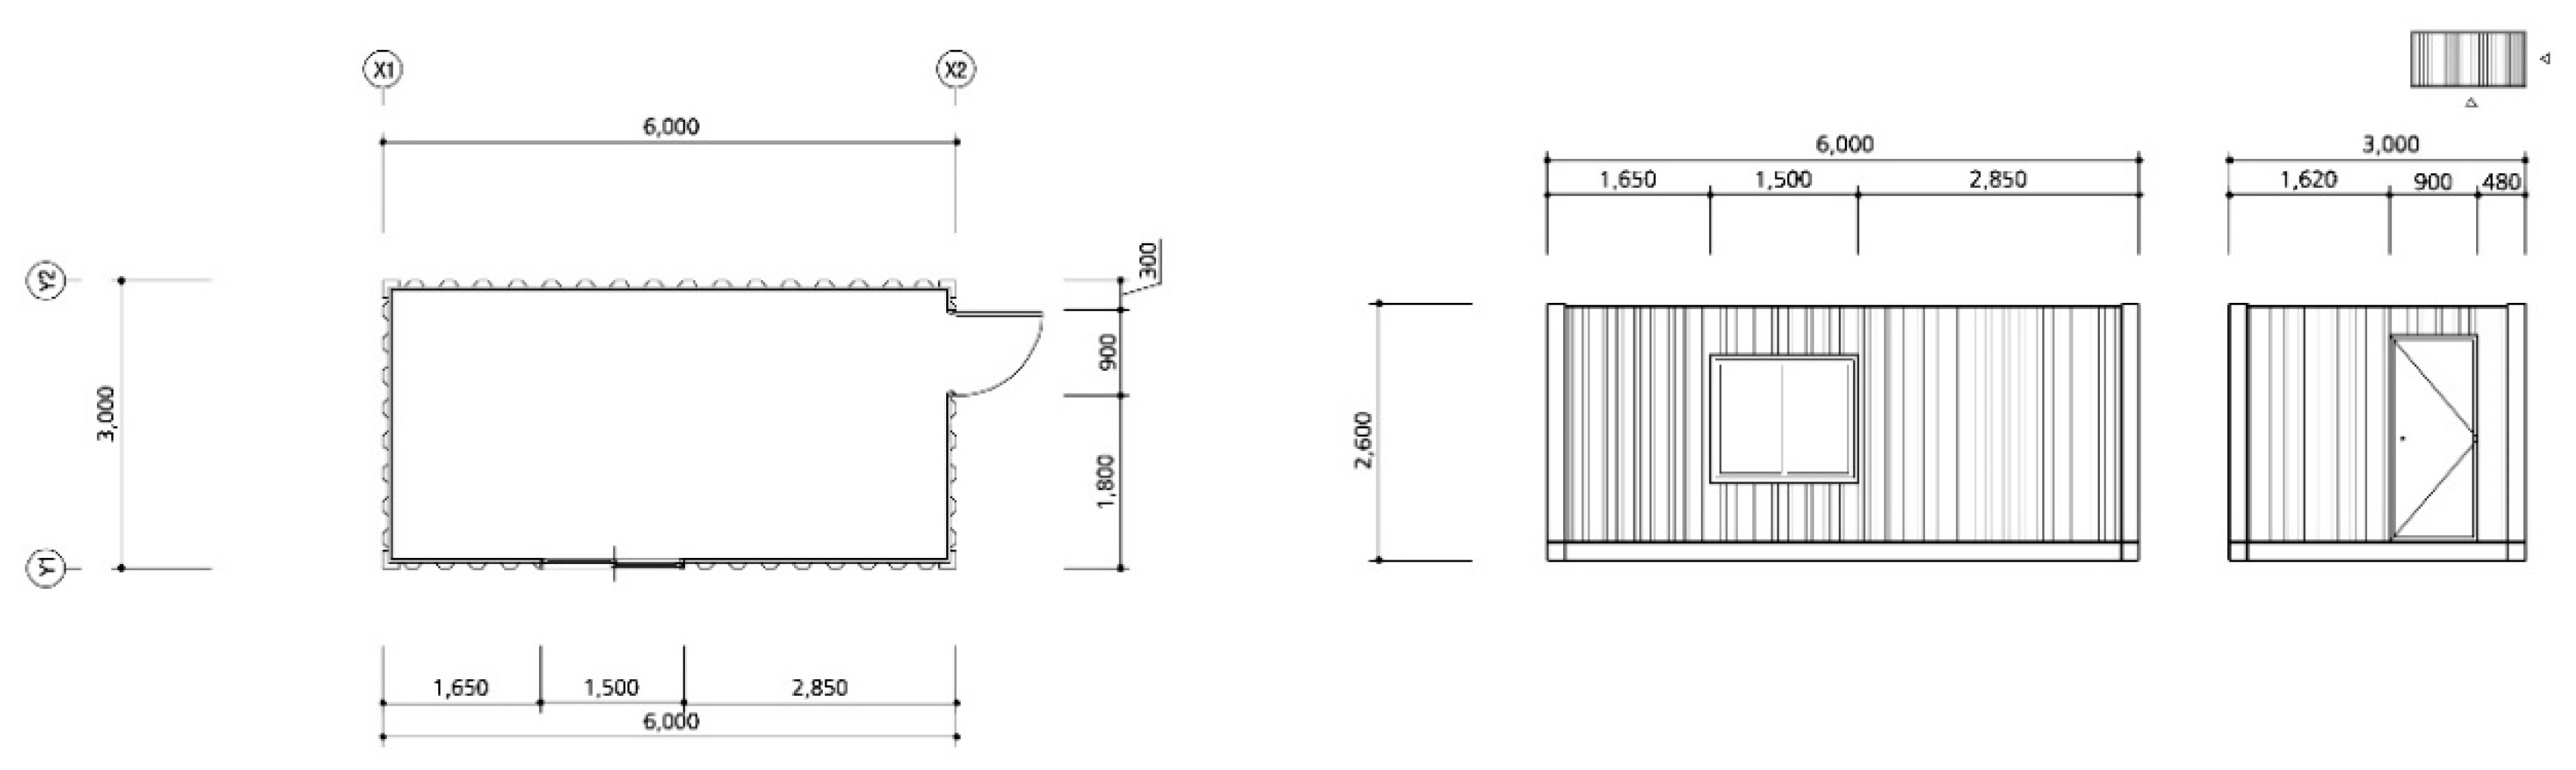
The DSSCs test mock-up was constructed using a container with insulation applied to simulate the indoor building environment. A window of 1500 mm by 1200 mm dimensions was constructed on the front, and the DSSCs module was installed on the back of the window to create a situation similar to that of a double-layer window, as seen in Figure 2.
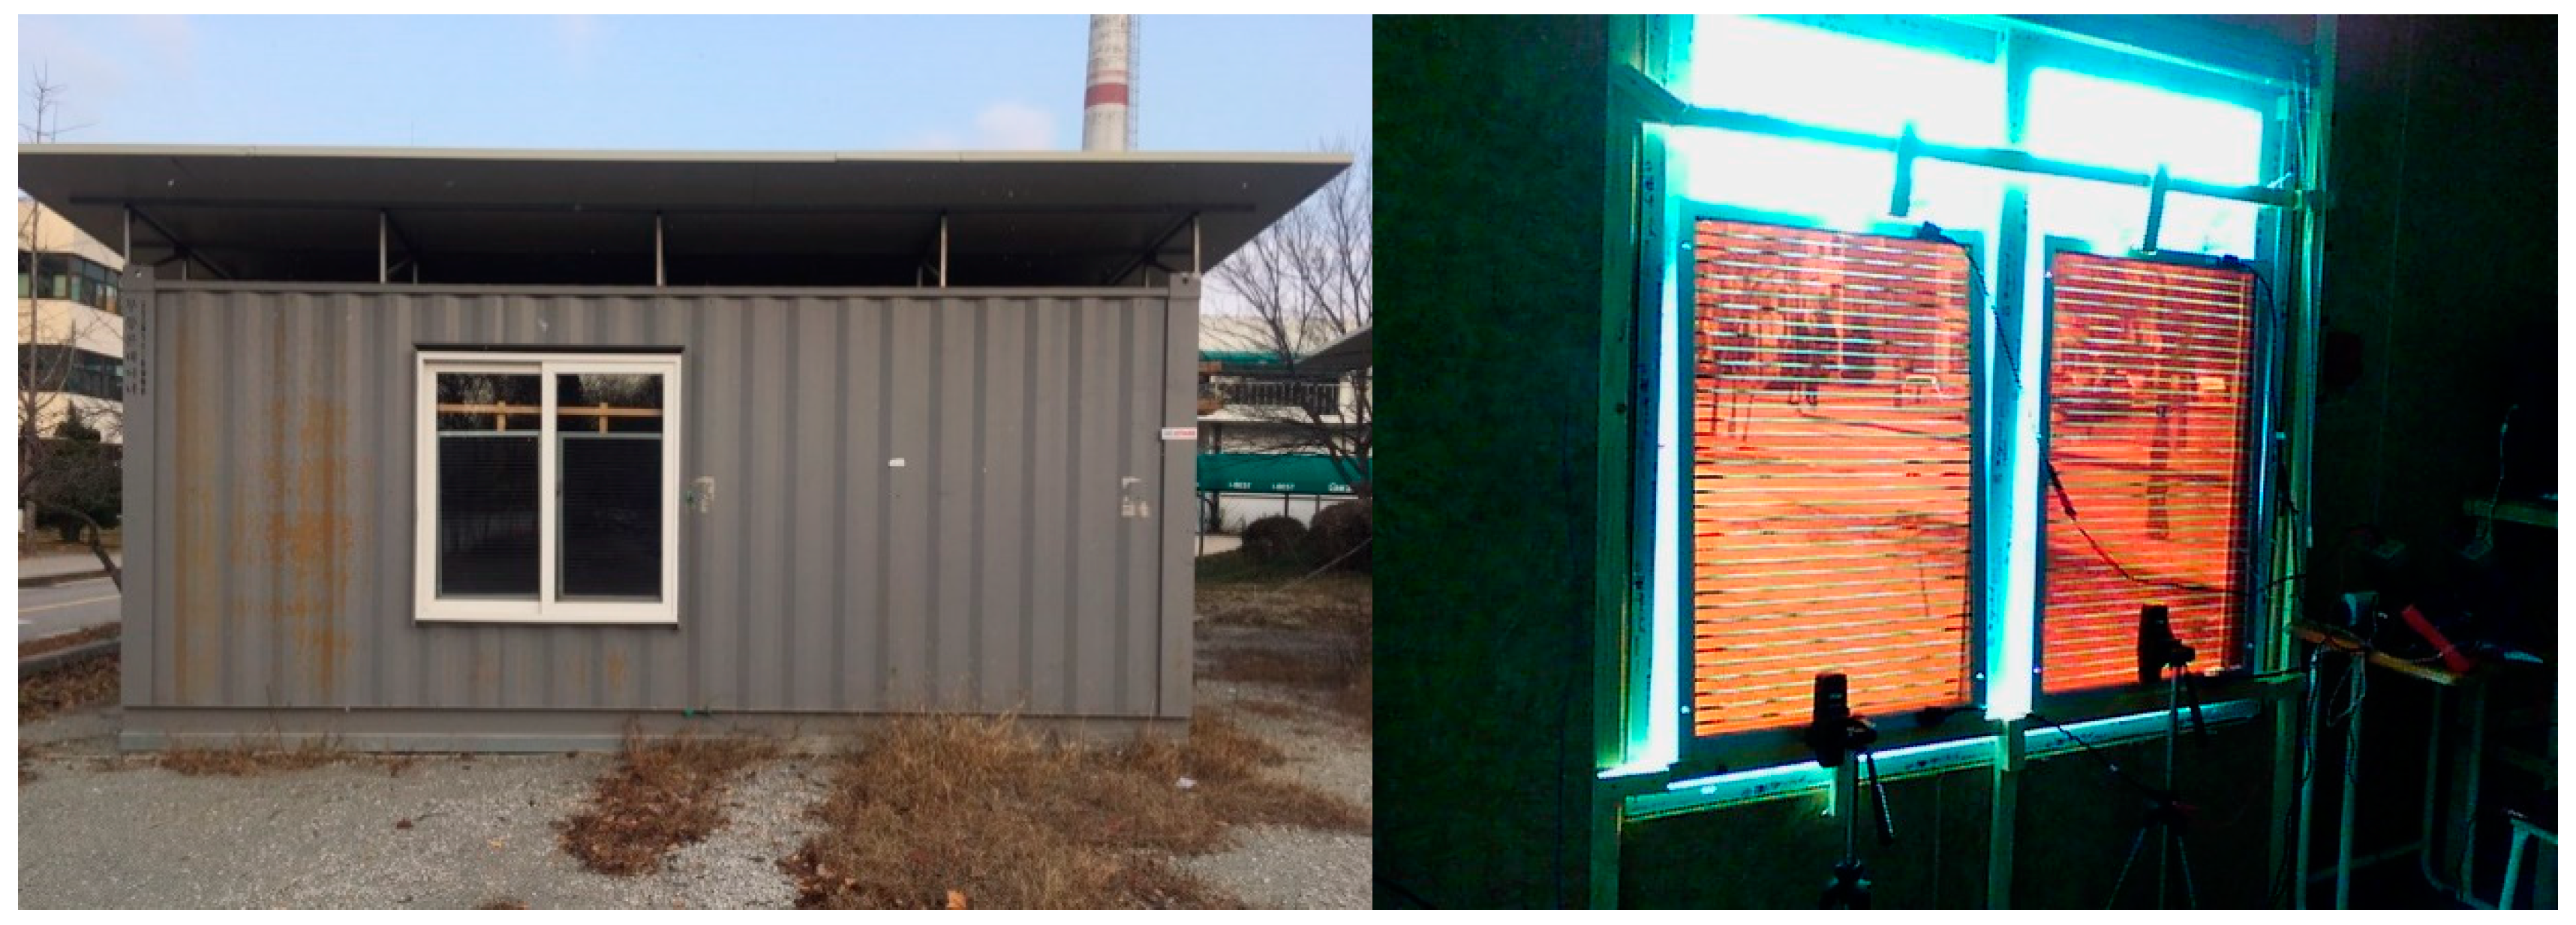
In addition, a sensor capable of measuring the amount of solar radiation was installed between the DSSCs and the window, and a device capable of comparing and analyzing the amount of power generation compared to the amount of solar radiation was constructed. To fix the DSSCs, a fixing frame was specially manufactured, as shown in Figure 3. Although it is known that in the Northern Hemisphere, the highest insolation can be obtained for the south elevation of the building, the DSSCs test mock-up was arranged based on the southeast trend that could obtain the highest insolation in a limited place. Owing to this reason, the DSSCs test mock-up had a difference of 20 degrees compared to the South Side. Choi analyzed that there was a 7% decrease in solar radiation in the case of the southeast side, which shows a 20-degree difference from the south side [22].
3. Test Progress and Analysis
3.1. Preliminary Test
Previous studies found that the energy generation efficiency of solar cells is proportional to the amount of solar radiation incident on the panel [19], and our test was conducted based on this theory. DSSCs have been reported to show power generation efficiency decreases with increasing outdoor temperature, and the cell stabilizing at temperatures below 35 °C [23]. Other studies have analyzed that the power generation efficiency of DSSCs increases as the amount of clouds increases [24].
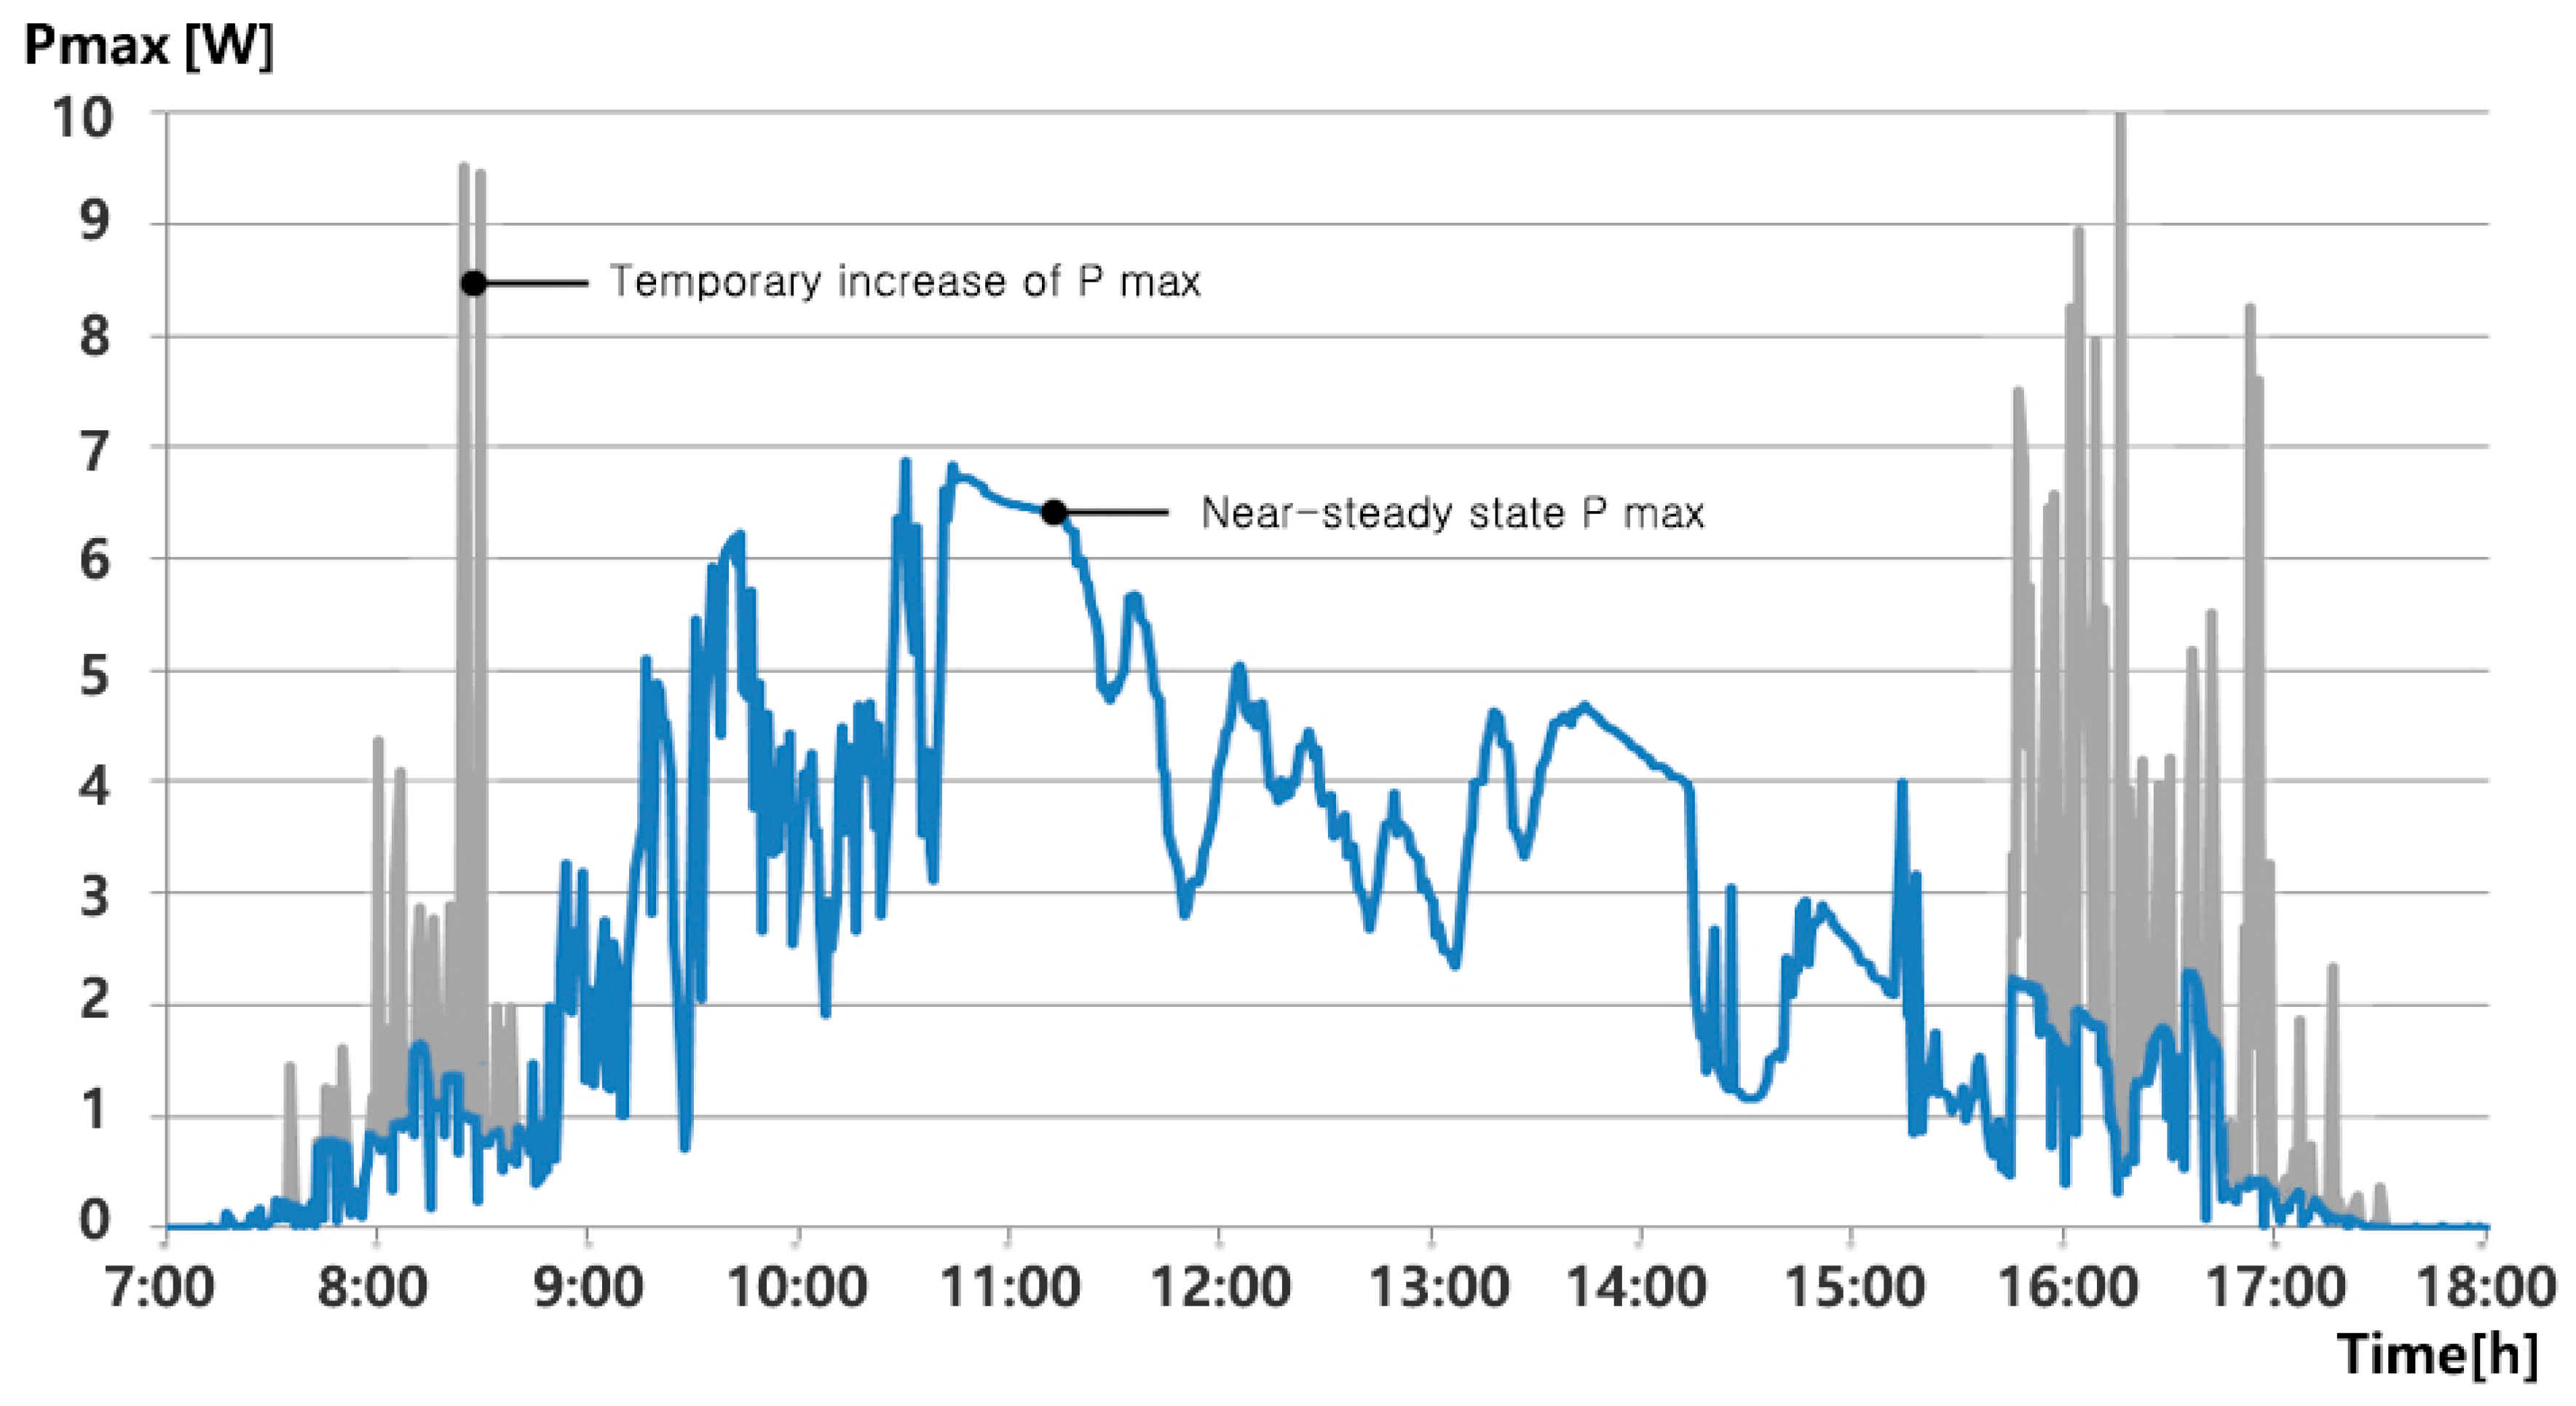
Our study was conducted based on the theory that the amount of power generated by DSSC is proportional to the amount of solar radiation incident on the panel [19]. Several preliminary tests were conducted while keeping the temperature below 35 °C. When the incident solar energy was very weak, it was confirmed that Pmax temporarily increased, as shown in Figure 4. At this time, the open-circuit voltage was measured constantly, but both Imax and Vmax were temporarily increased and measured. This was presumed to be due to the influence of a short-circuit current through which a large current flows, or a structural problem of the measuring device, and was judged to be unsuitable for data analysis. Therefore, in this test, the temporarily increased Pmax was excluded to compare the power generation performance of DSSCs in near-steady conditions.
3.2. RGB DSSCs Test
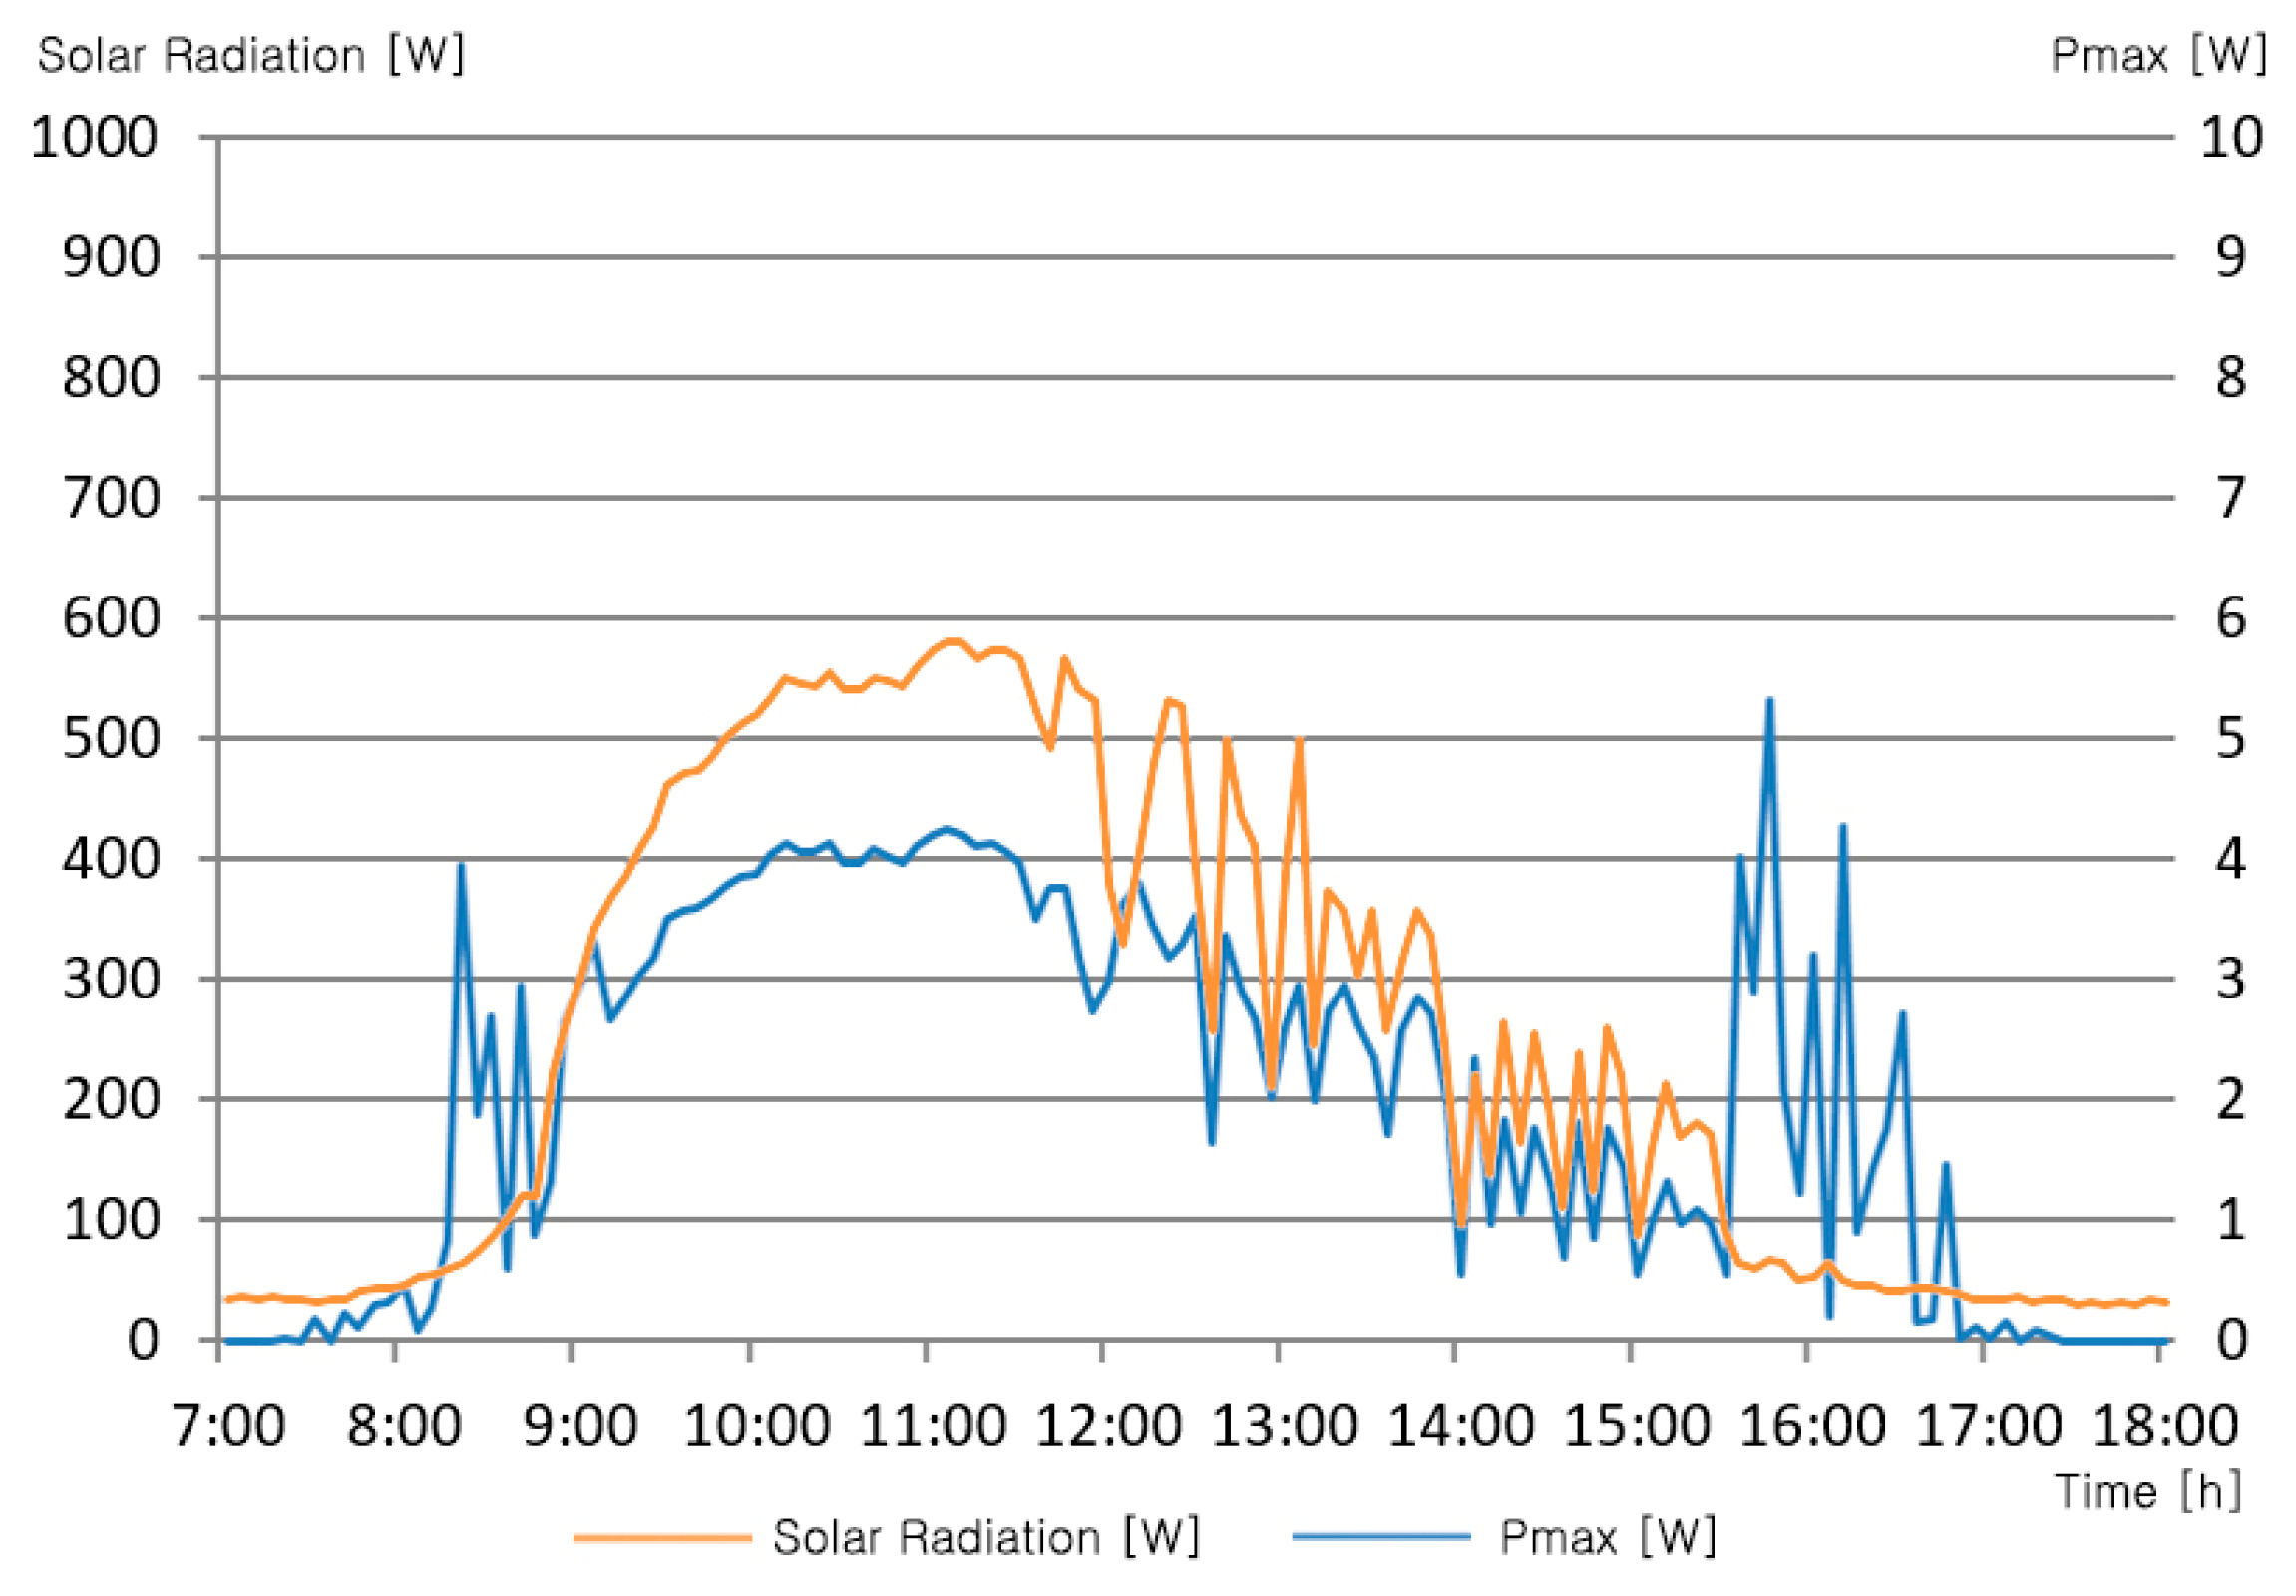
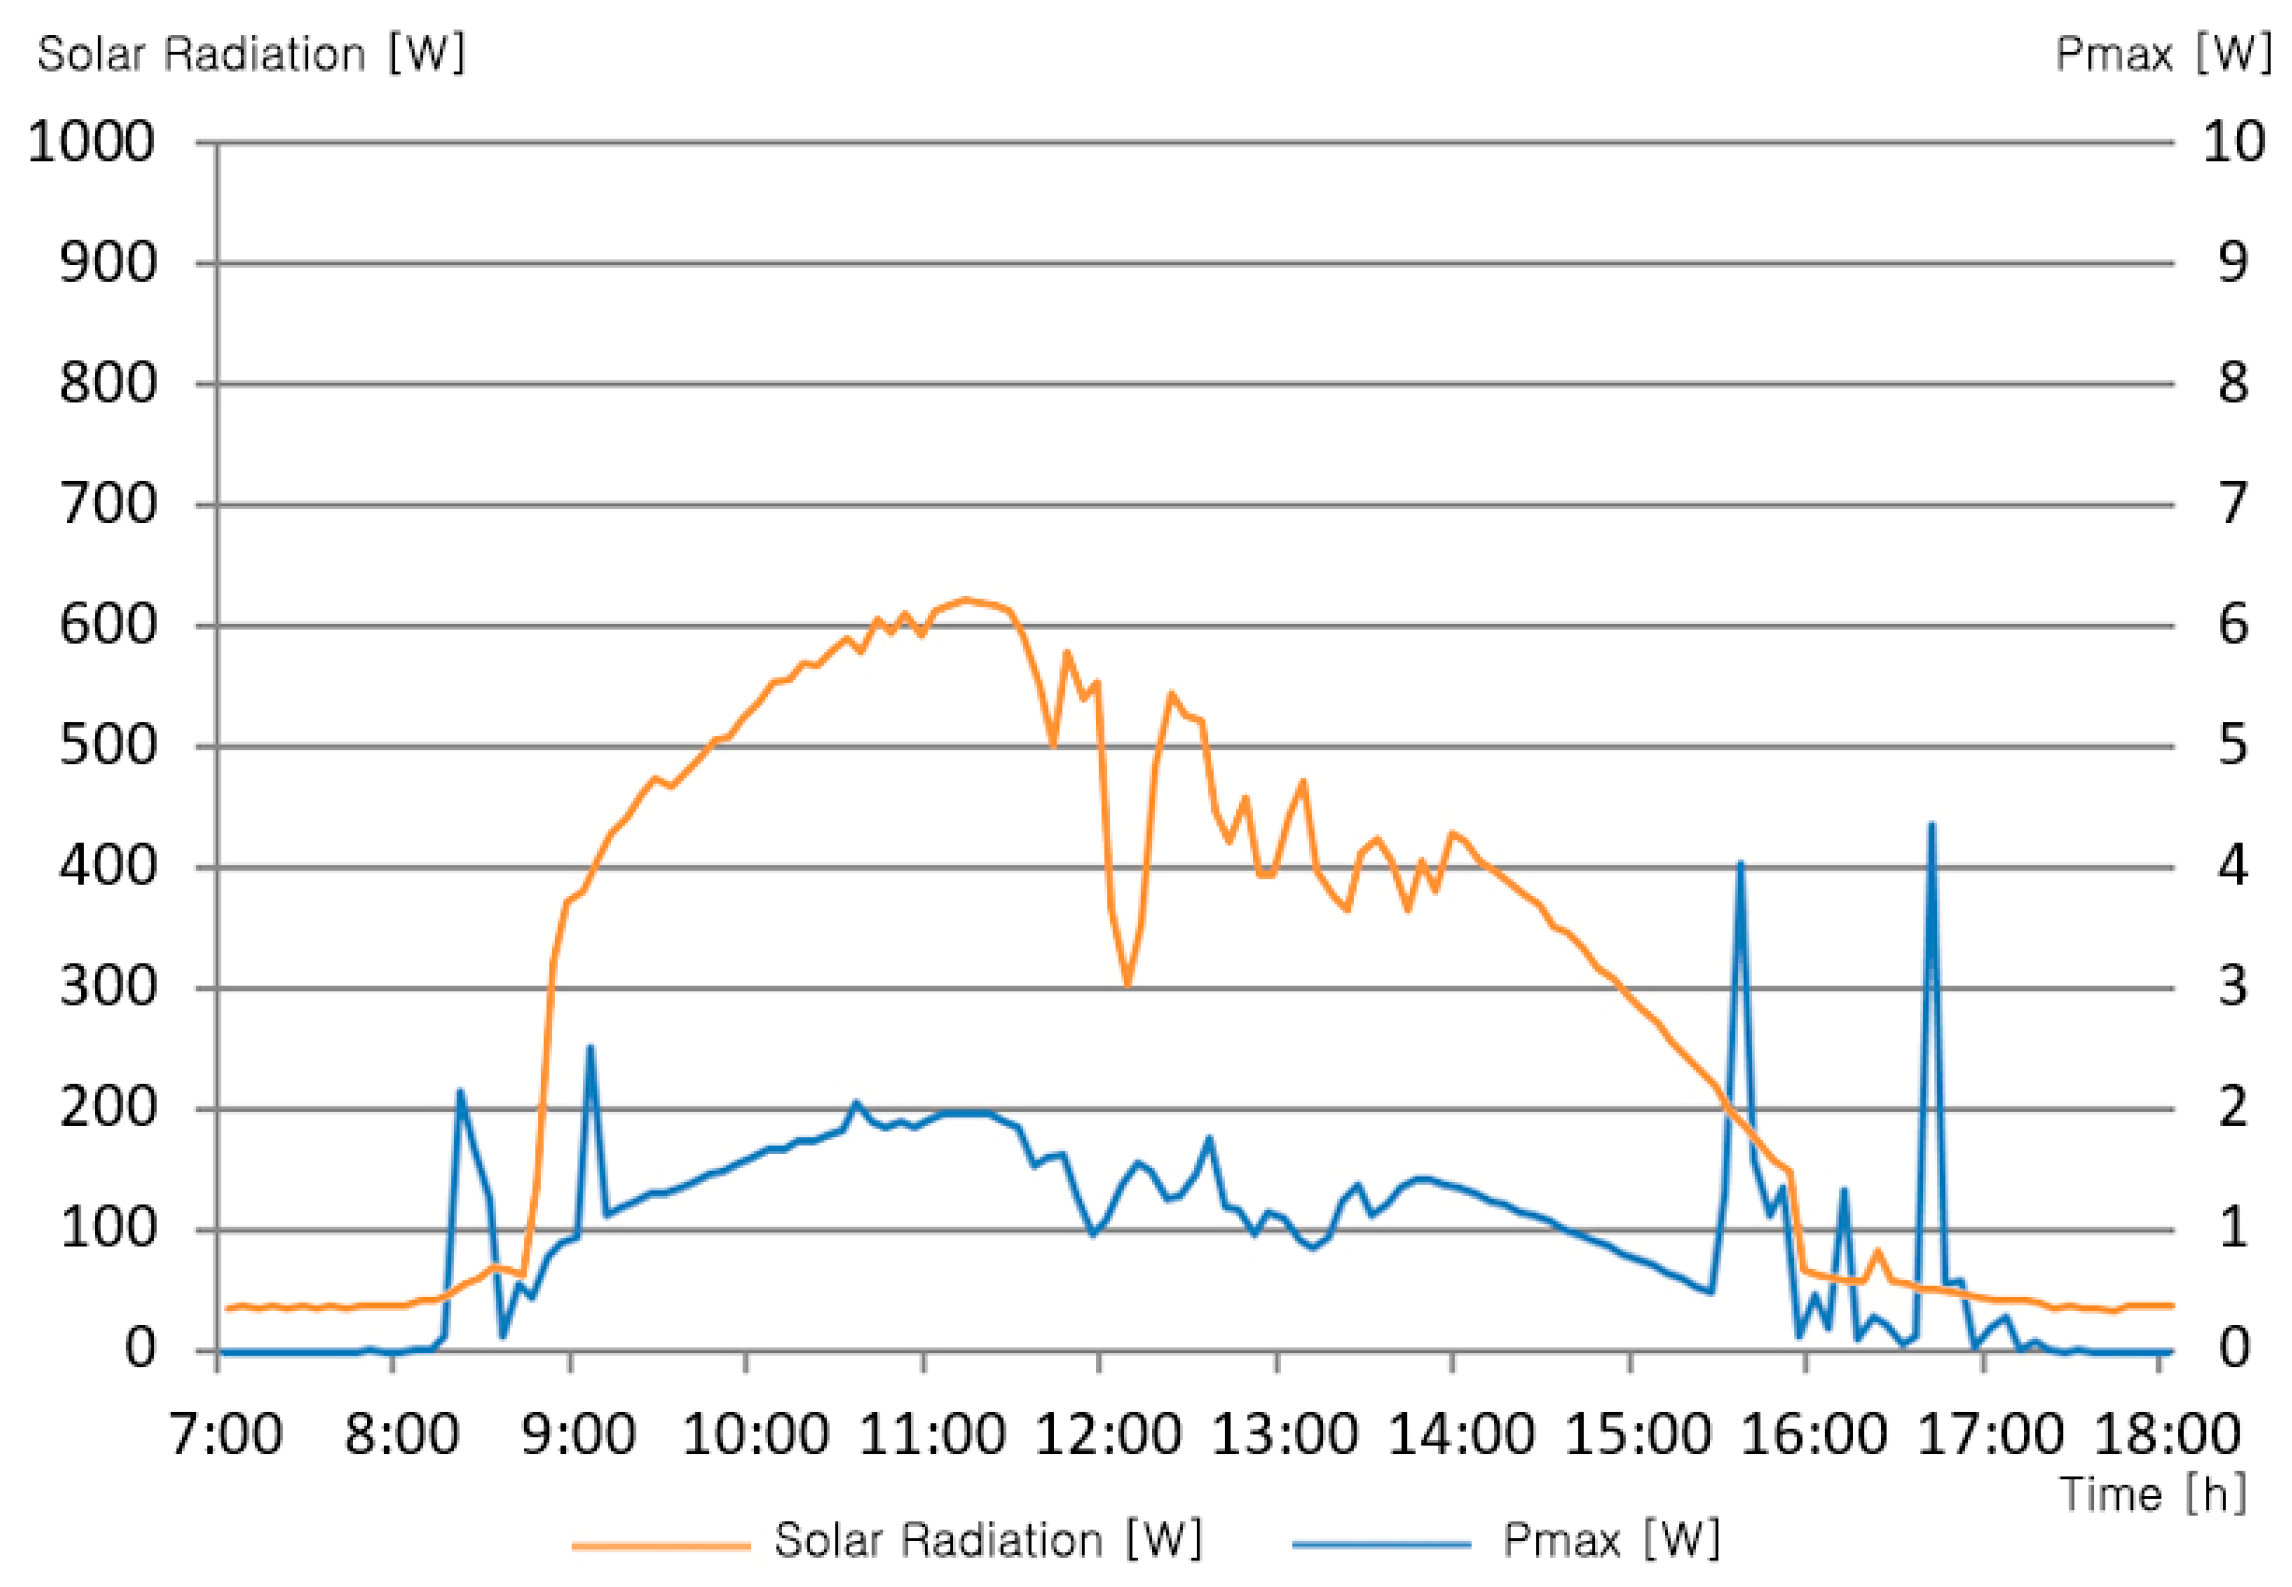
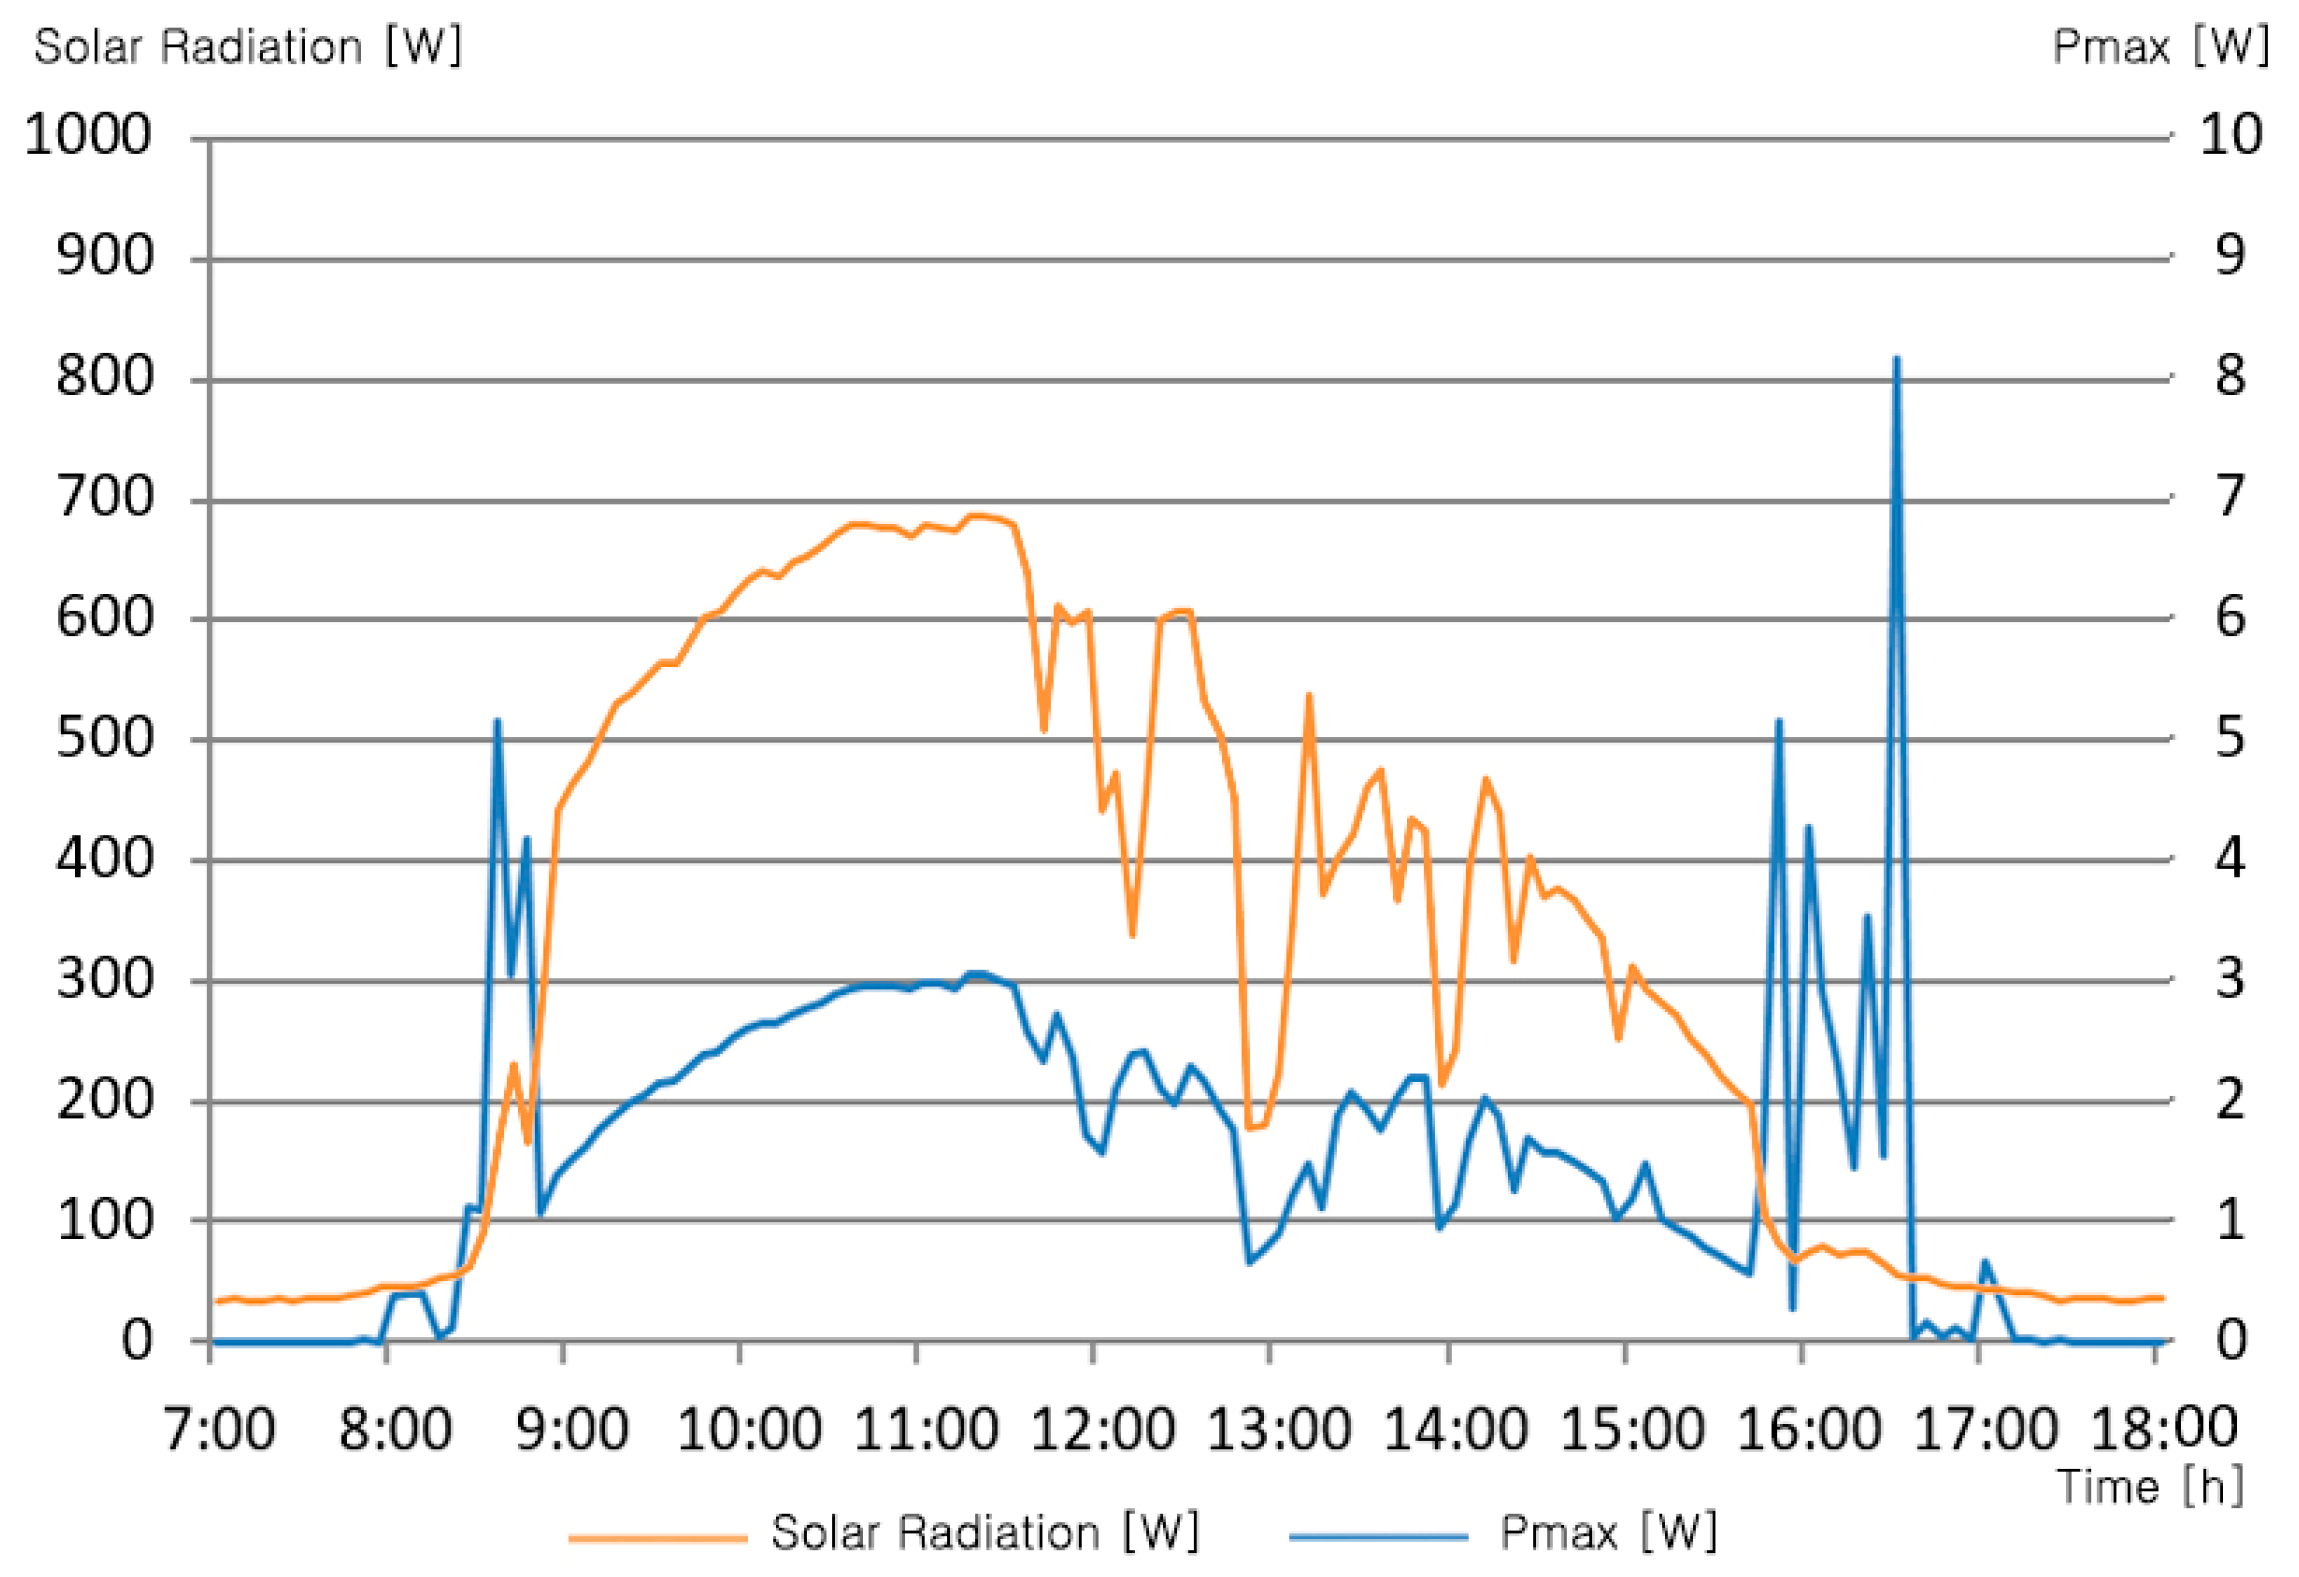
RGB tests were conducted for three adjacent days. The VLT 20% product line was used, and it was measured in the order of red, blue, and green. Overall, the cloudiness remained low for three days during the test. RD20 product showed the best performance, with a daily power output of 23.02 W.h, as seen in Figure 5. Between 9:00 and 15:00 when power generation is stable, the maximum value of Pmax was measured as 4.25 W. The average of Vmax for the same time was 14.06 V, which showed a slight difference from the actual performance of the product. BD20 product showed the lowest performance, with a daily power output of 11.08 W.h. For the same range between 9:00 and 15:00 h, the maximum value of Pmax was measured as 2.07 W, as shown in Figure 6. The Vmax average was 14.31 V. The GD20 product has a daily power output of 17.57 W.h, as summarized in Figure 7. Between 9:00 and 15:00 when power generation was stable, the maximum value of Pmax was measured as 3.06 W. The Vmax average for the same time was 16.68 V.
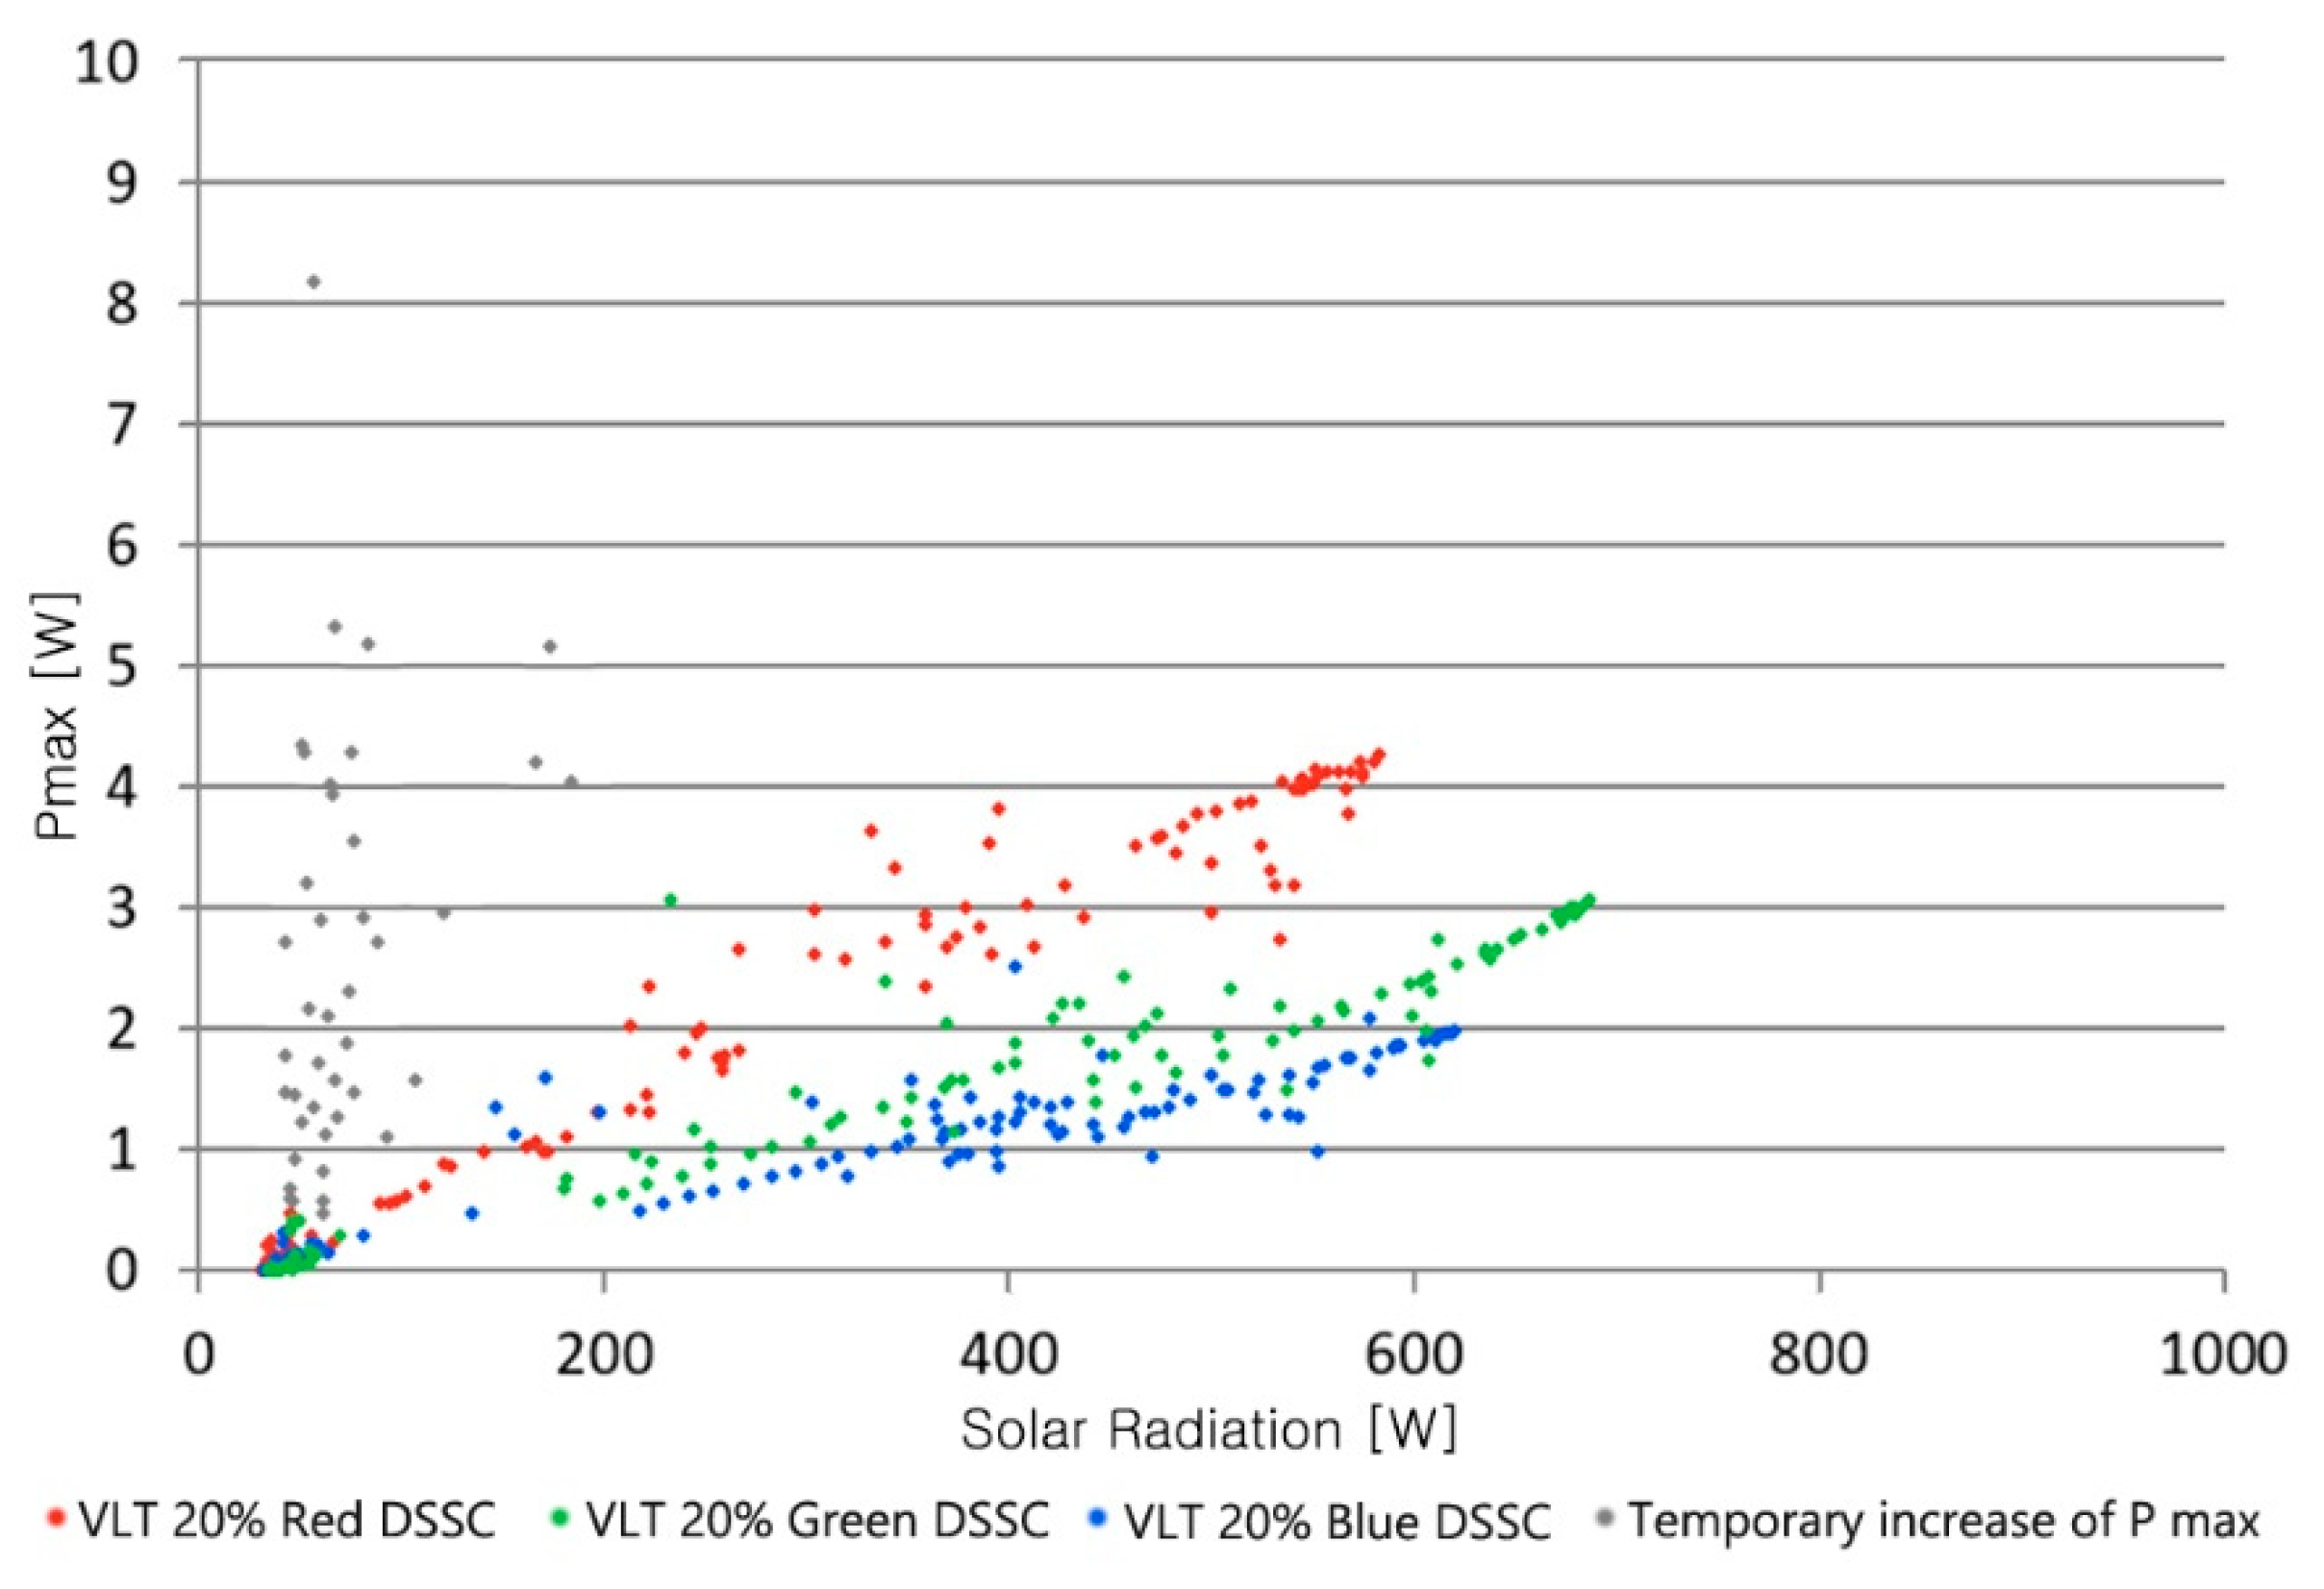
Since it is impossible to directly compare the production power reflecting the different solar conditions, Pmax was compared to the incident solar radiation. Figure 8 shows the result of the comparison of Pmax to the amount of incident insolation. When the value due to the temporary increase in Pmax was excluded, it was confirmed that the value of Pmax according to the amount of insolation had a certain slope. The power generation efficiency was found to be in the order red > green > blue. RD20 in the dimensions of 965 mm by 624 mm was found to have a Pmax of about 0.75 W for 100 W of solar radiation. BD20 was found to have a Pmax of about 0.32 W for 100 W of solar radiation. GD20 was found to have a Pmax of about 0.42 W for 100 W of solar radiation. The power generation efficiency of RD20 was about 1.25%, BD20 was about 0.53%, and GD20 was about 0.70%. Based on the RD20, the BD20 showed approximately 43% performance, while the GD20 showed approximately 56% performance.
3.3. VLT DSSCs Test
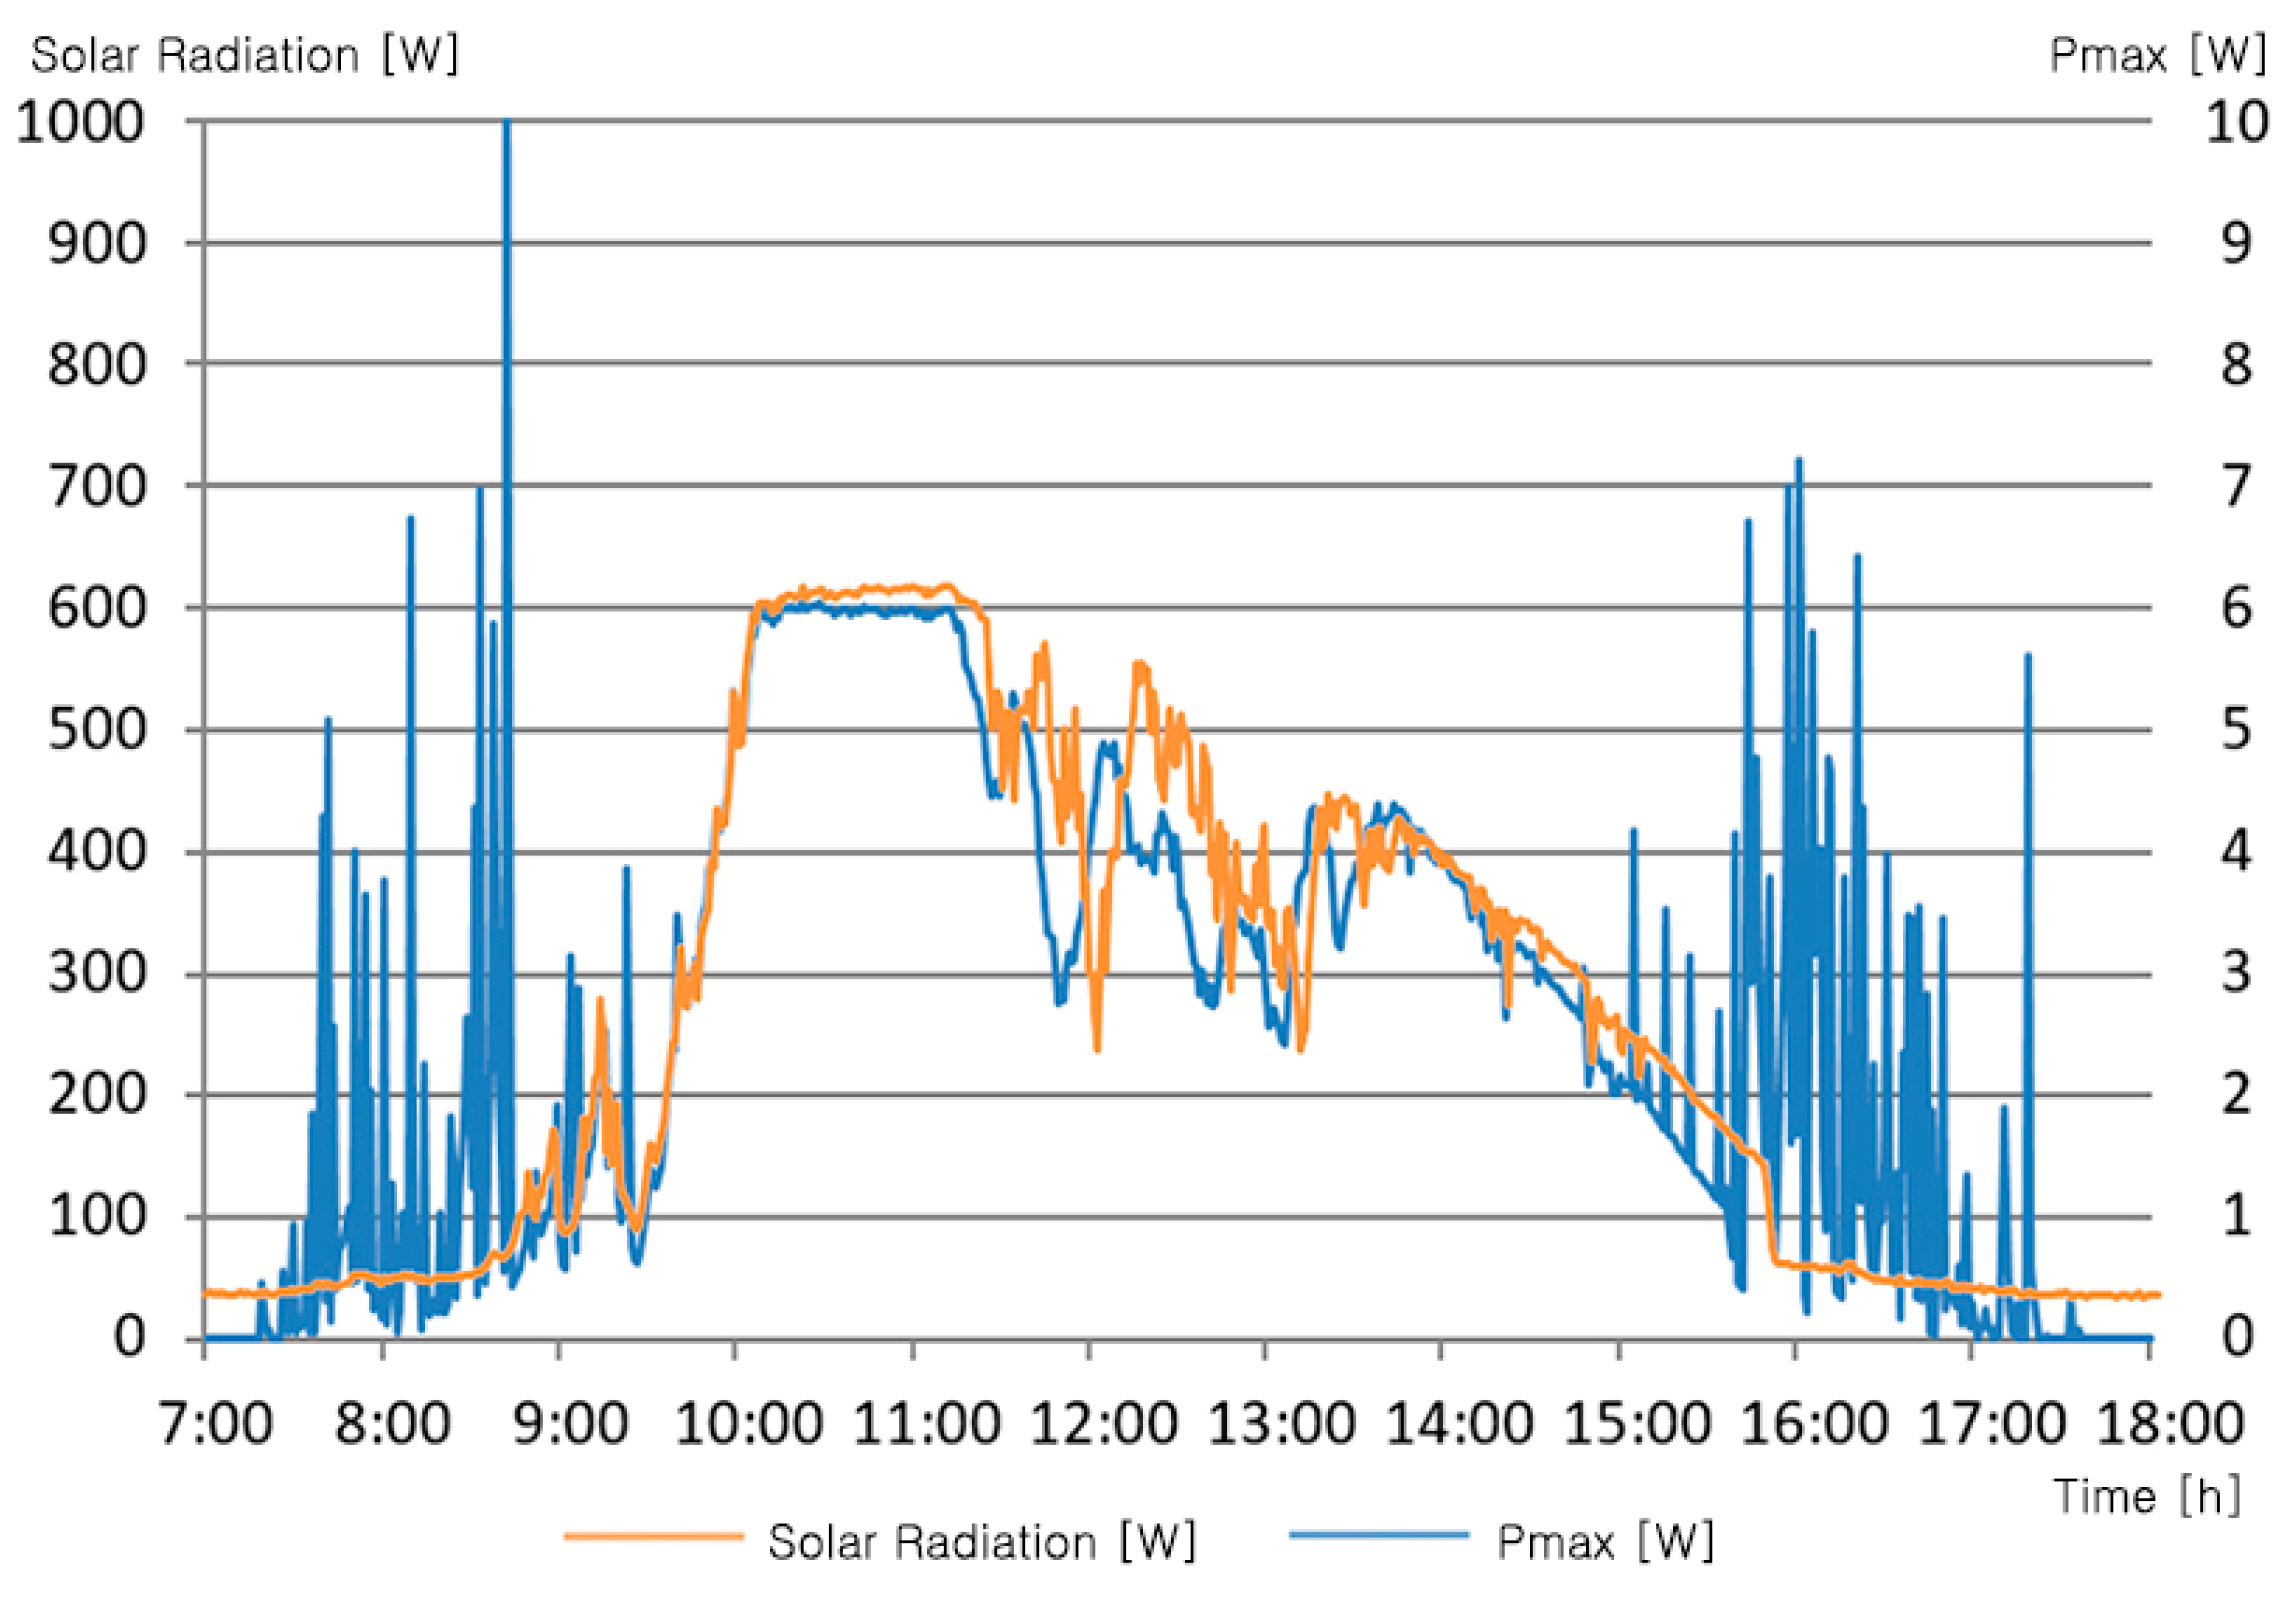
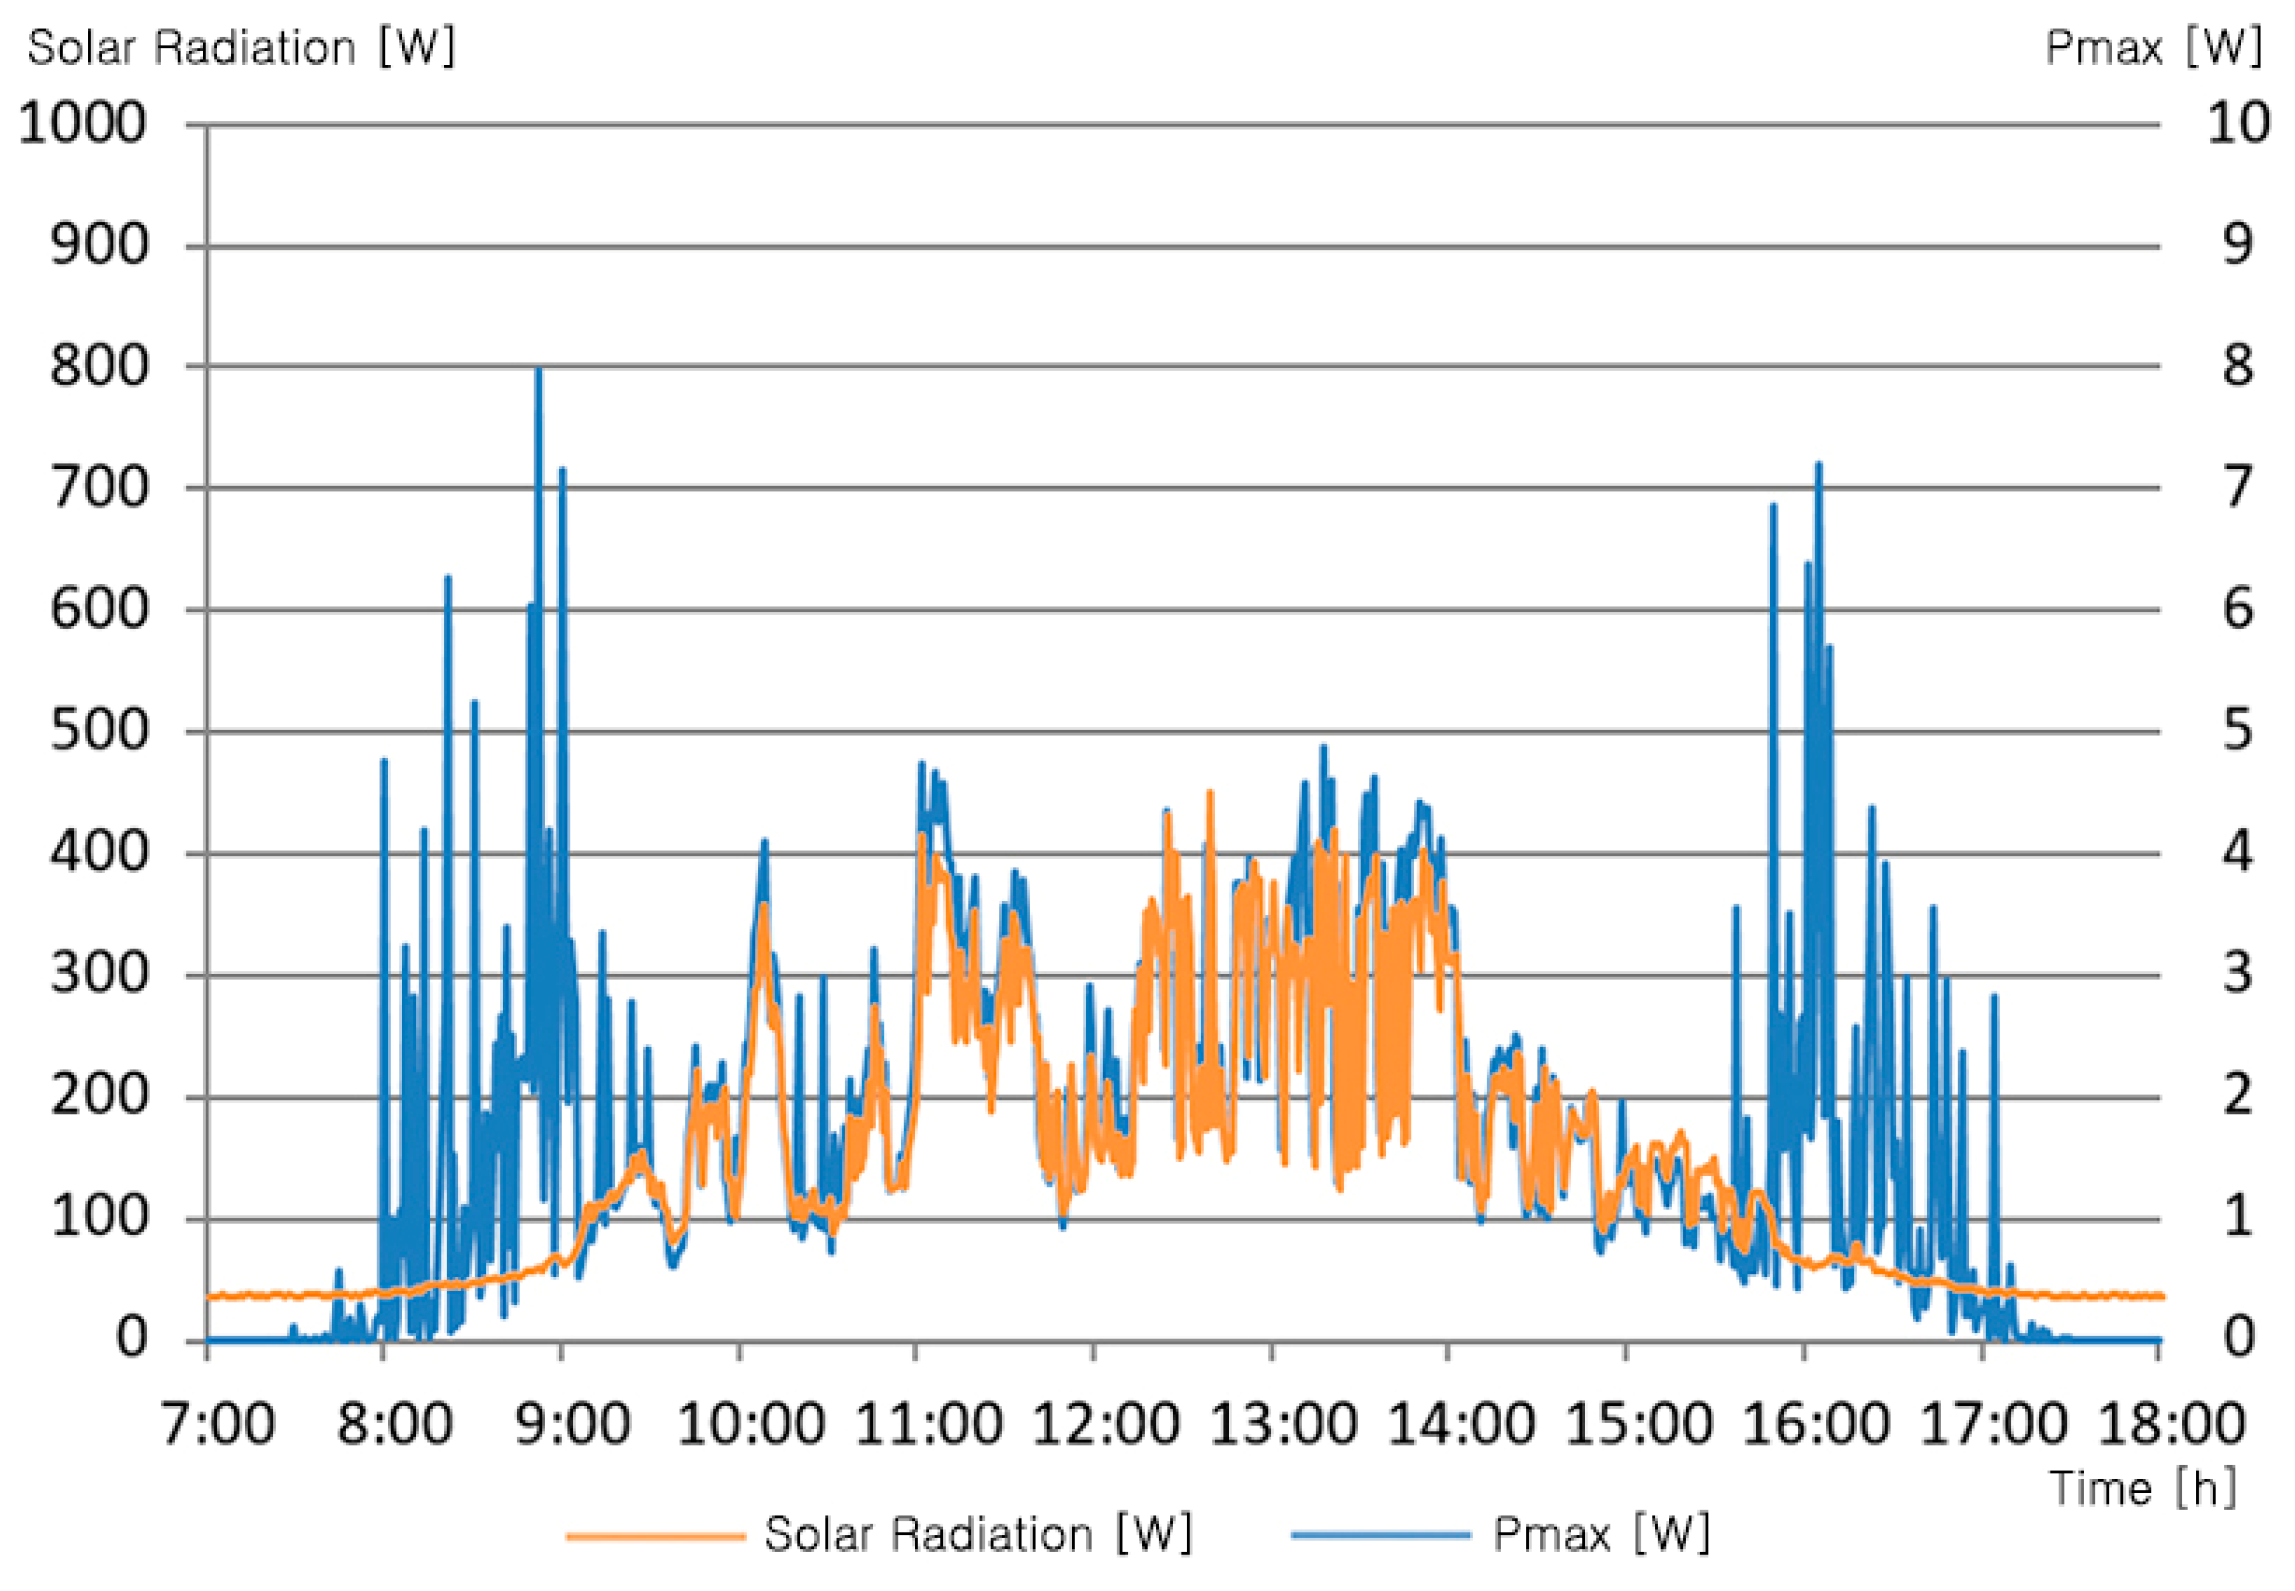
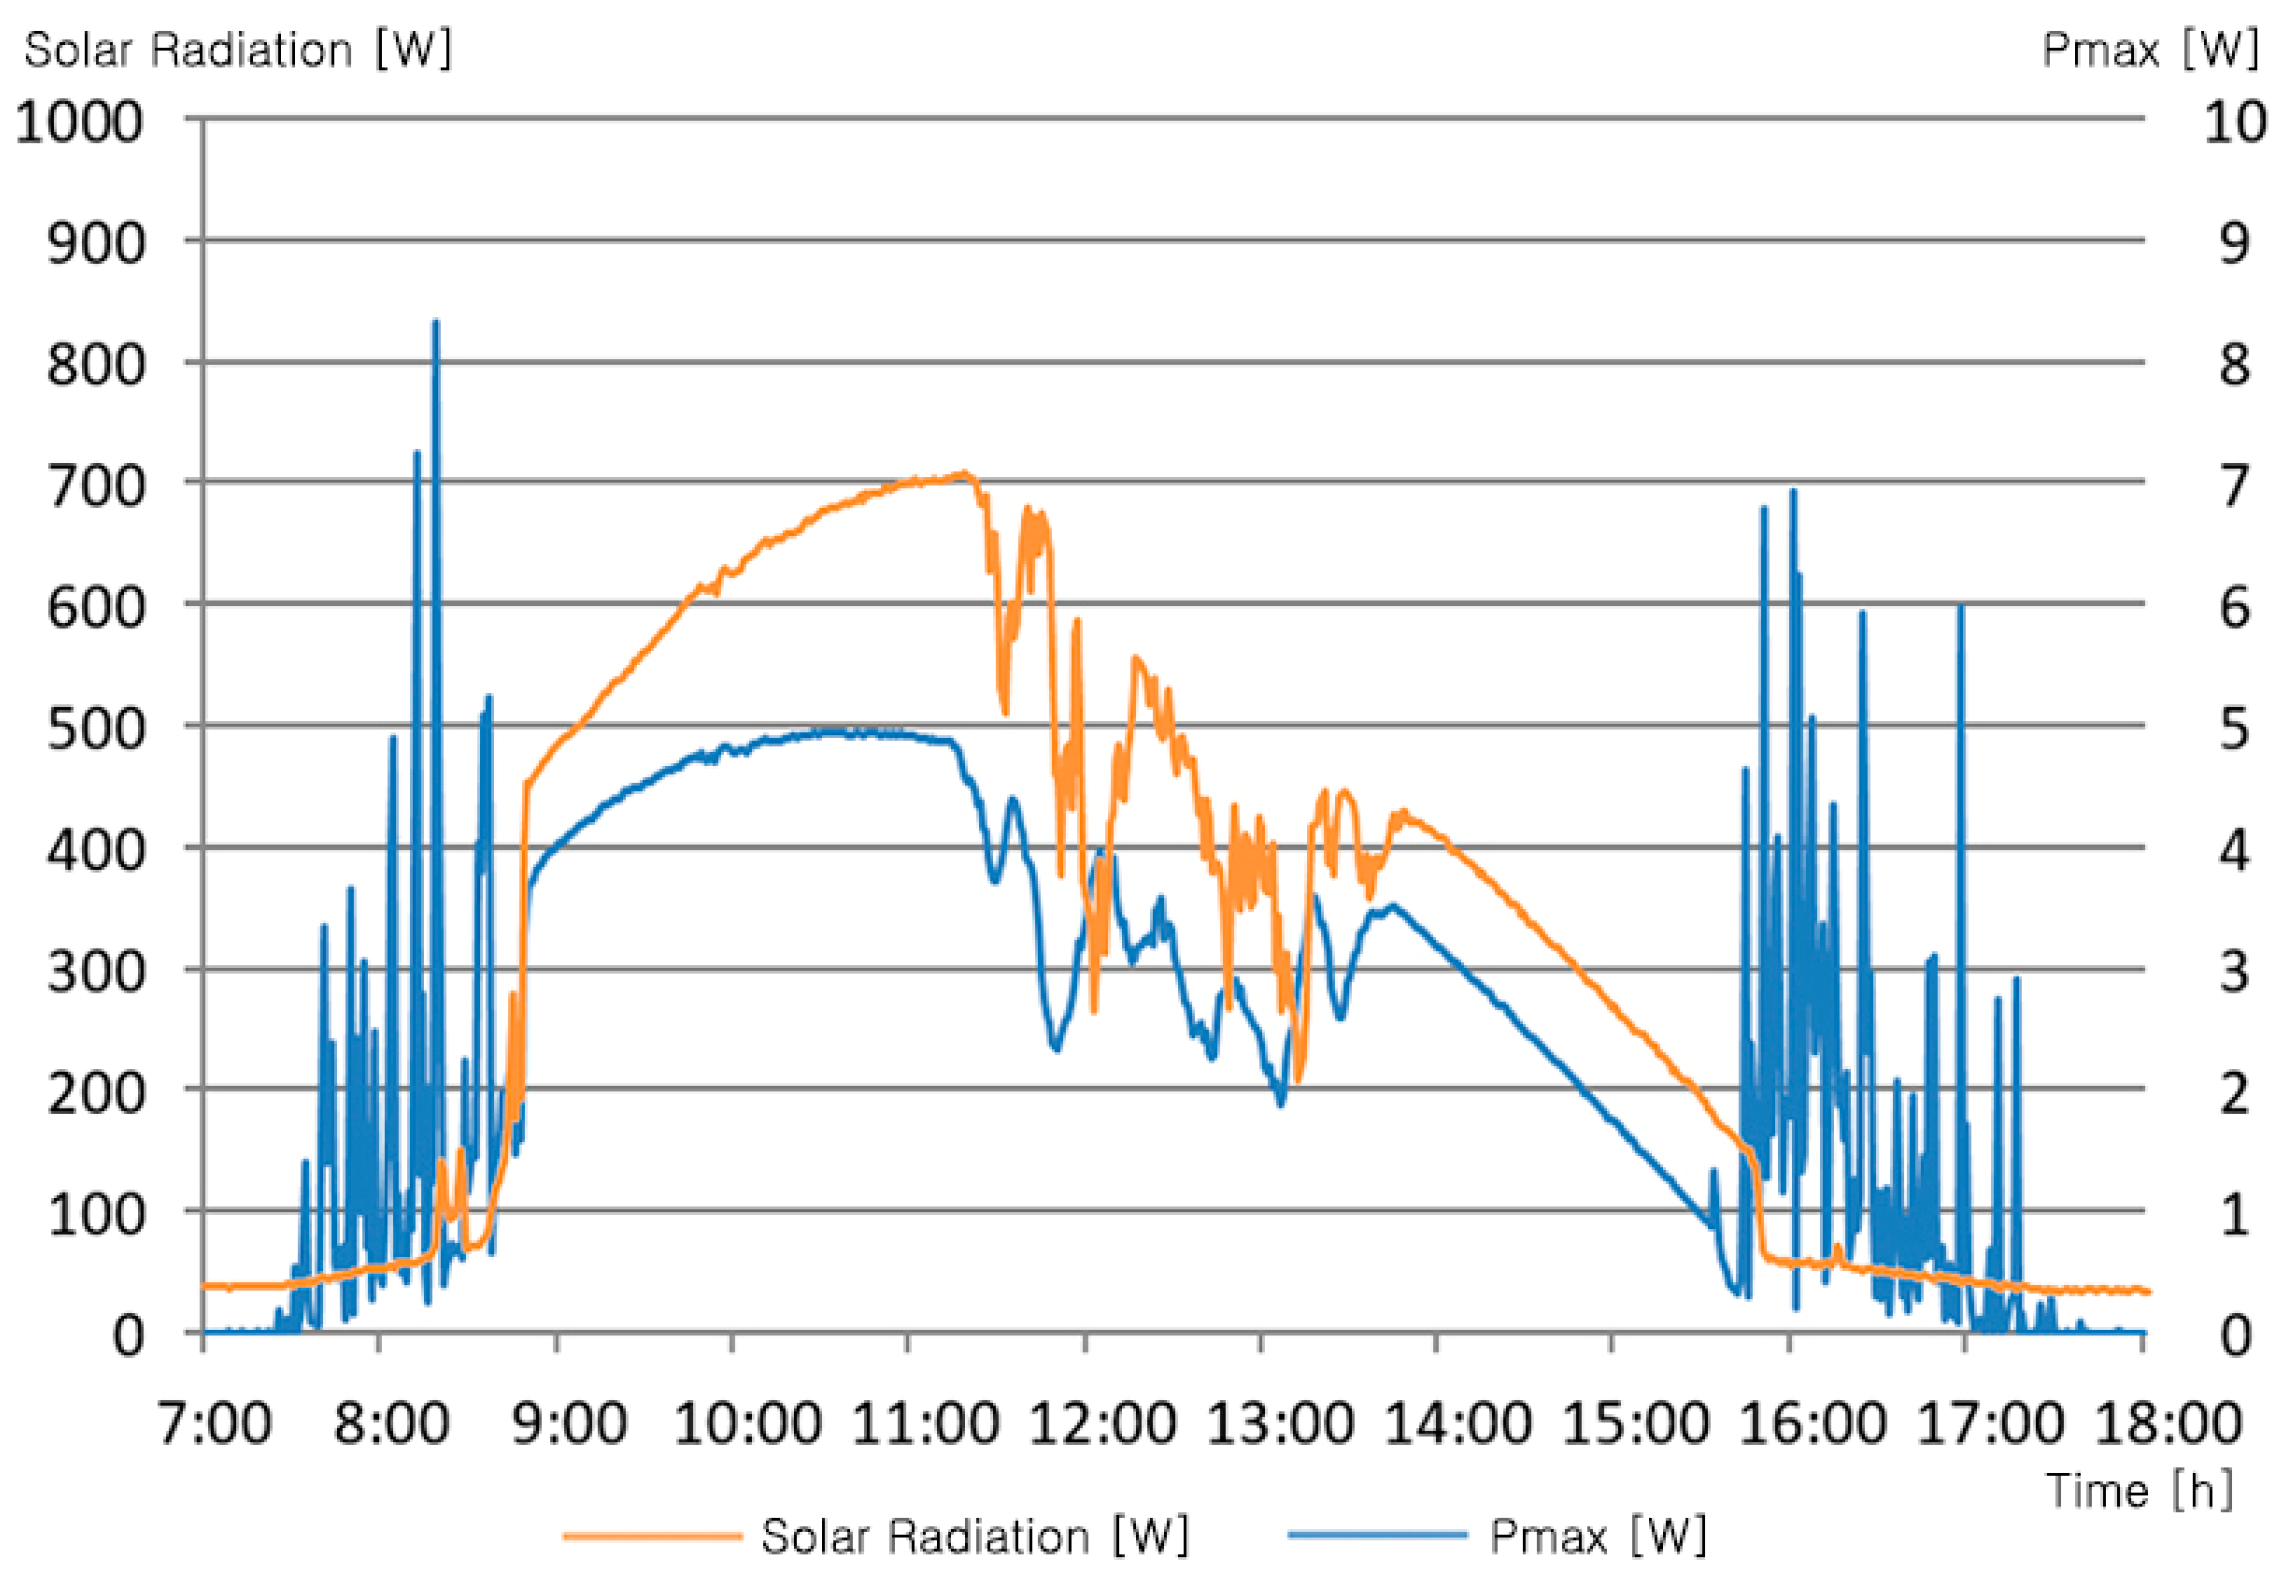
VLT tests were conducted for adjacent days. The red product line was used, and measurements were repeatedly made on VLT (7, 10, and 20%). RD07 product recorded 30.07 W.h of power per day. Experiment hours between 9:00 and 15:00 when power production was stable showed the maximum value of Pmax to be measured as 6.08 W, as shown in Figure 9. During the same time, the Vmax average was measured to be 17.5 V. RD10 product recorded a daily power output of 19.06 W.h. For the same hours, the maximum value of Pmax was measured as 4.88 W, and the Vmax average was measured as 17.67 V, as summarized in Figure 10. RD20 product showed a daily power output of 28.05 W.h. During the same hours, the maximum value of Pmax was measured to be 4.95 W, and the Vmax average was measured to be 13.87 V, as seen in Figure 11.
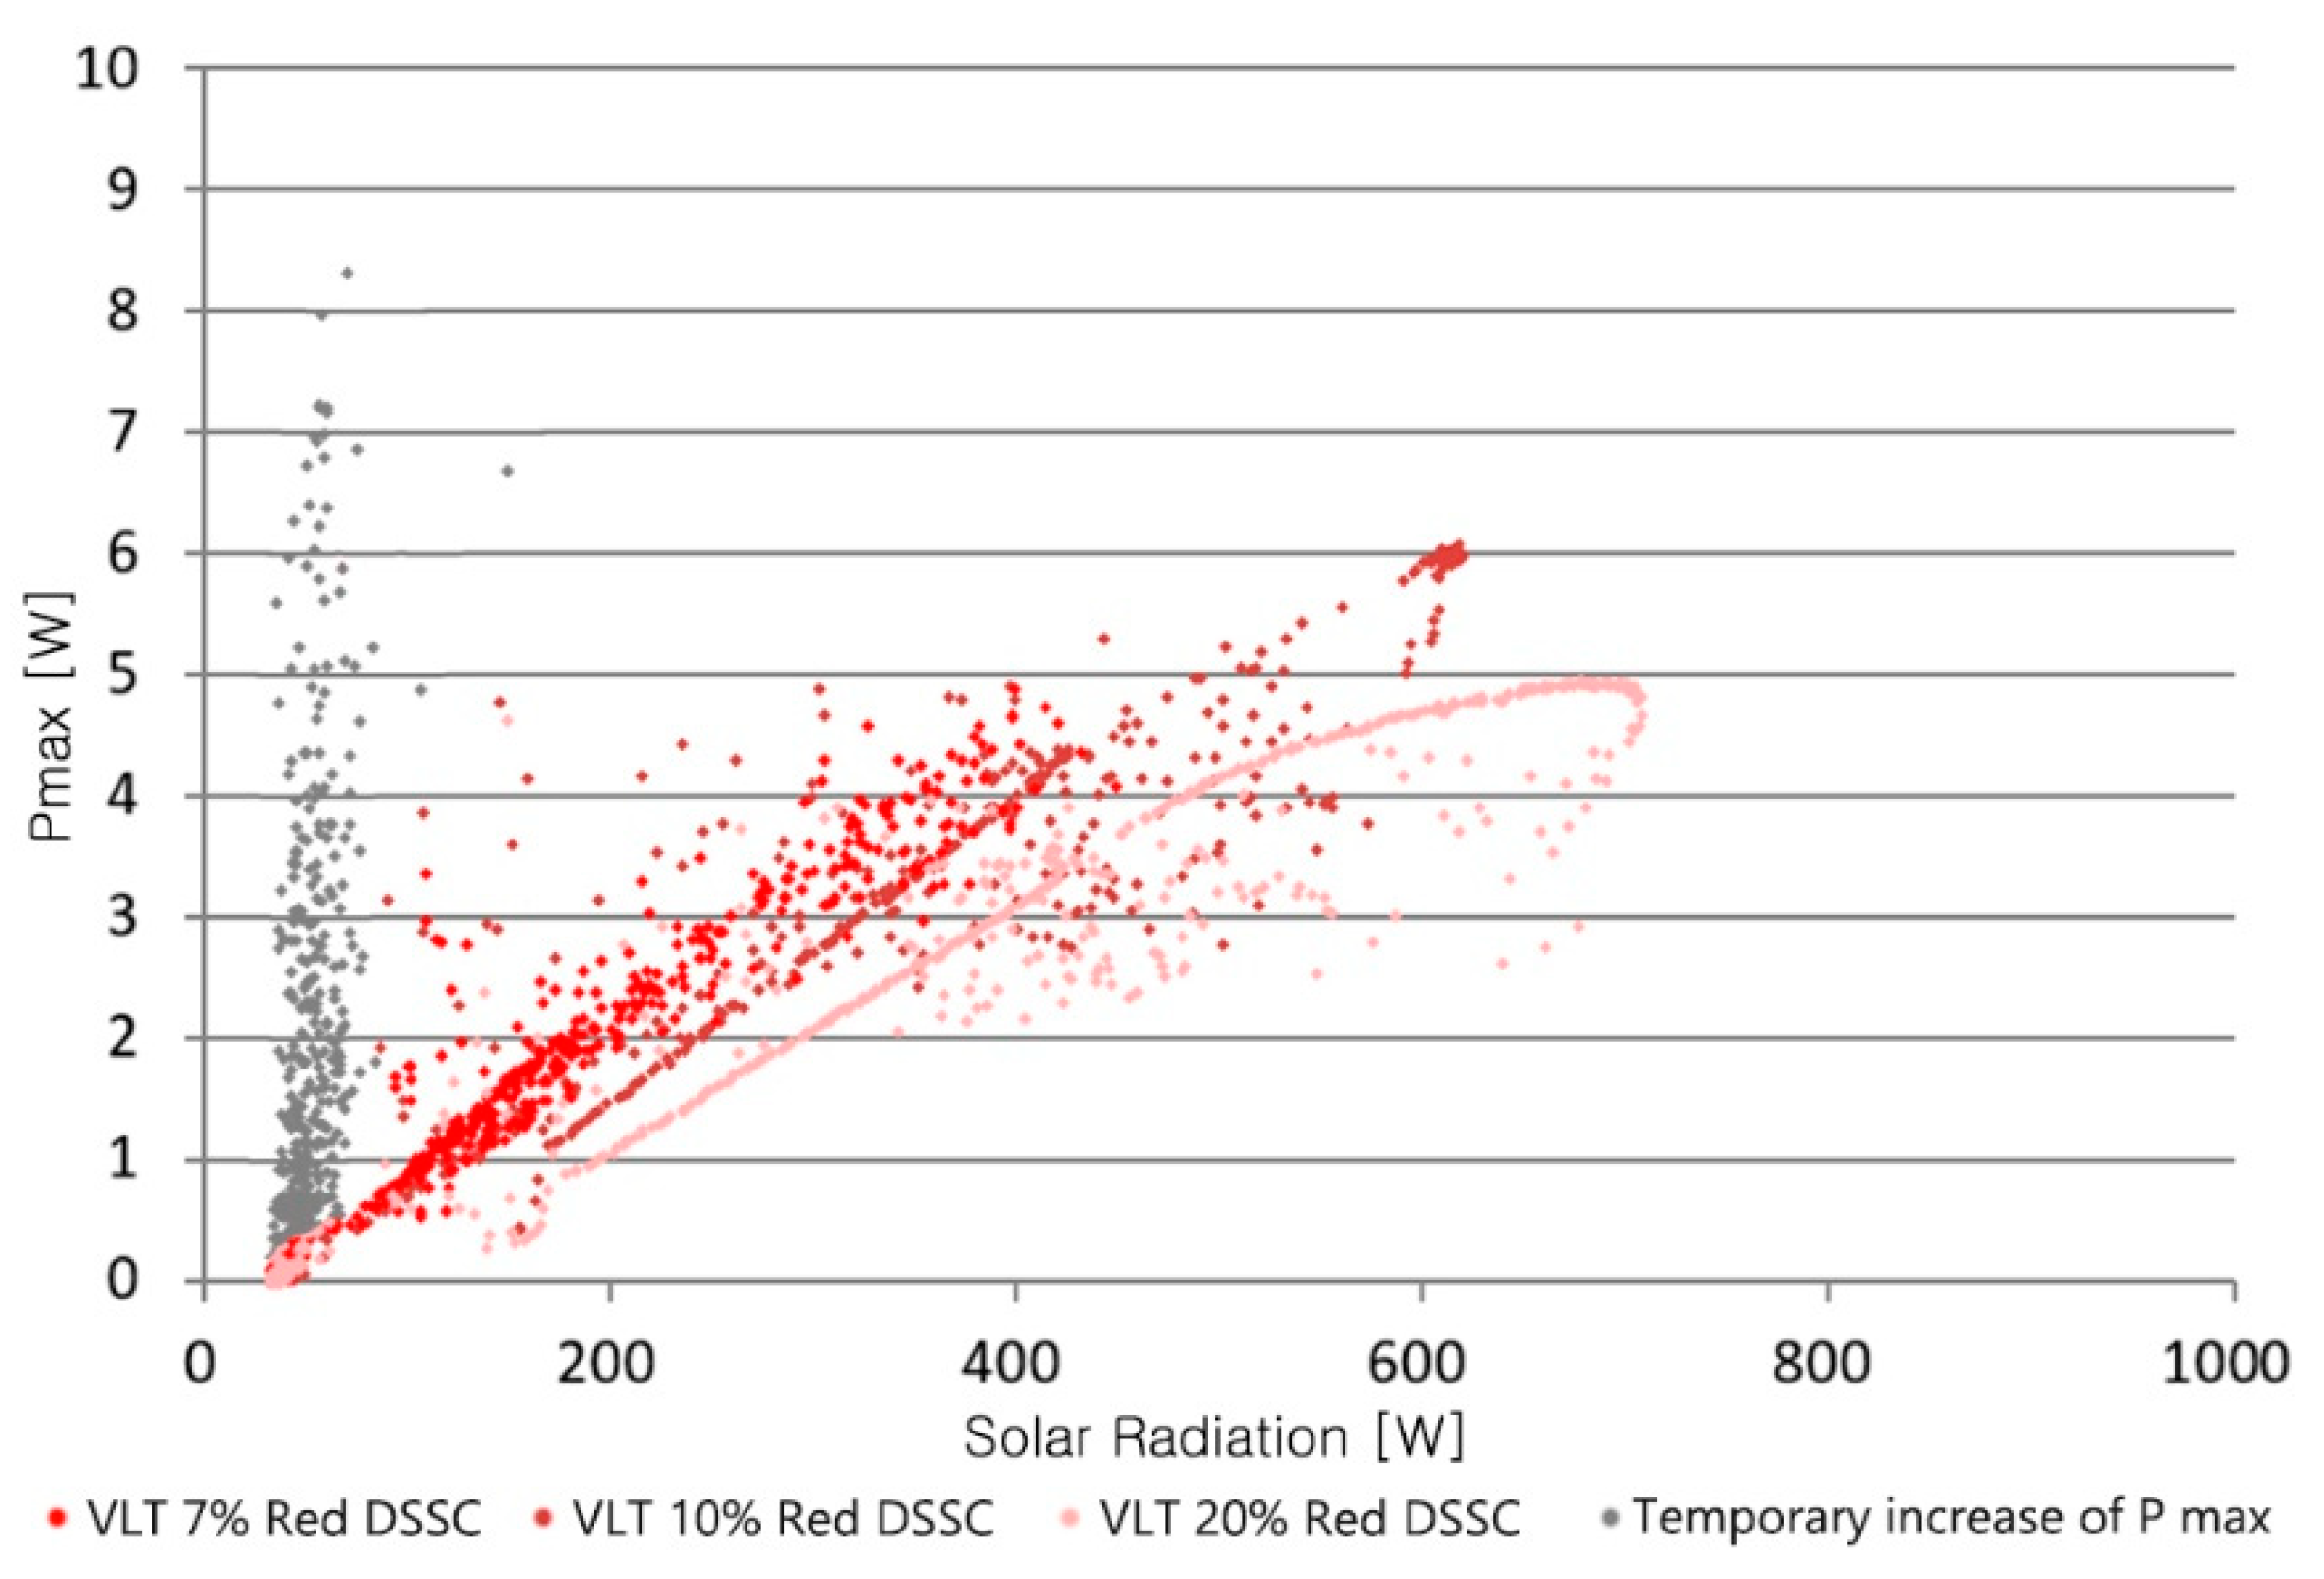
Since it is impossible to directly compare the production power reflecting the different solar conditions, Pmax was compared to the incident solar radiation. Figure 12 shows the sum of Pmax compared to the incident solar radiation. The power generation efficiency was found to be in the order VLT 7% > VLT 10% > VLT 20%. RD07 with dimensions of 965 mm by 624 mm was found to have a Pmax of about 1.18 W for 100 W of solar radiation. RD10 was found to have a Pmax of about 1.00 W for 100 W of solar radiation. In comparison, RD20 was found to have a Pmax of about 0.75 W for 100 W of solar radiation. The power generation efficiency of RD07 was about 1.96%, RD10 was about 1.66%, and RD20 was about 1.25%. Based on the RD20, RD07 showed about 157% performance, while RD10 recorded about 133% performance. As the VLT was lowered, the power generation efficiency significantly increased.
4. Conclusions
This study was conducted to measure the performance that could be exhibited in a real building for windows with various types of DSSCs. Mock-up was constructed, and data for RGB-based DSSCs with VLT 20% and Red DSSCs with VLT (7, 10, and 20%) were collected. The conclusions through this process were as follows. In this process, when the incident solar energy is low, the power generation efficiency of DSSCs temporarily increases. Because it was predicted to be a phenomenon caused by a short-circuit current or a structural problem of the measuring device, the analysis was performed with the temporary increase data excluded in this study. The research results are, therefore: First, it was confirmed that the amount of energy generated by DSSCs is proportional to the amount of insolation, and has a constant slope. Second, through the comparative test for each RGB, the power generation efficiency data of DSSCs applied to building windows was collected. It was found that power generation performance was excellent in the order red > green > blue. The green color was analyzed to show 56% performance compared to the red color, while the blue color showed 43% performance compared to the red color. Third, through the comparative test for each VLT, generation efficiency data collection of DSSCs applied to building windows was performed. The lower the VLT, the higher the power generation efficiency, while the lower the VLT, the greater the change in power generation. DSSCs with VLT 7% showed 157% performance over DSSCs with VLT 20%, and DSSCs with VLT 10% showed 133% performance over DSSCs with VLT 20%.
This study still has limitations because it was conducted based on limited conditions and test groups. Because of this reason, the analysis was conducted except for the temporary Pmax rising section. According to Figure 8 and Figure 12, it was found that when the amount of insolation is above a certain level, the value of Pmax increases proportionally with a certain slope as the insolation increases. Based on this, RGB and VLT comparison tests of the DSSCs were conducted.
DSSCs currently being produced have better power generation efficiency as the VLT lowers, and the power generation efficiency is good in the order Red > Green > Blue. Through this study, when applied to windows, it was also found to be the same, but the power generation efficiency was measured to be very low, about 1%. This study only compared the window photovoltaic power generation efficiency for color and VLT, so the cause of the decrease in power generation efficiency could not be analyzed. However, it was analyzed that the double-glazed window structure has a great influence on the power generation efficiency of DSSCs. To analyze the cause, it is necessary to analyze the power generation efficiency according to the type of window of the first layer, and the power generation efficiency according to the size of the hollow layer, when using double-glazed windows. This is currently being prepared for research.
This study has many limitations, but it is meaningful, in that it provided a basis for predicting the power generation of windows applied with DSSCs in real buildings based on annual insolation, and presented numerically. DSSCs are attracting attention as windows, because compared to existing solar cells, they can realize free VLT and color. However, when used as a double-glazed window, it has been found that the efficiency is greatly reduced. In particular, it was confirmed that the power generation efficiency of green and blue colors, which are advantageous for windows, is very low. Therefore, in order for DSSCs to be properly applied to buildings, research on appropriate window structures and improvement of power generation efficiency of green and blue colors is necessary, rather than simply improving module performance. At the same time, if the production cost of DSSCs is reduced and durability is secured, DSSCs, which can cover large façade areas, can be expected to produce a moderate amount of electricity in an economically sustainable way.
Data were collected based on the RGB color, which is the three primary colors of color, and data were collected for VLT (7, 10, and 20%). Because it is difficult to calculate the equation through the three test groups, more diverse VLT tests are needed. Therefore, follow-up studies are needed, and a regression equation should be derived based on more test groups. The significance of the study is that it has laid the foundation for quantitatively predicting the amount of electricity generated by the window-applied DSSC to the actual building based on the annual insolation. In addition, the research is meaningful in that it presents the direction for efficient use of DSSCs.
Author Contributions
J.-H.K. and S.-H.H. designed the simulation settings; J.-H.K. performed the evaluations; J.-H.K. and S.-H.H. analyzed the data; S.-H.H. verified the analysis results; J.-H.K. and S.-H.H. wrote the paper. All authors have read and agreed to the published version of the manuscript.
Funding
This research was funded by National Research Foundation of Korea (Project No.: NRF-2018M3C1B9088457).
Acknowledgments
This research was supported by a grant from Future Leading Technology R&D Program.
Conflicts of Interest
The authors declare no conflict of interest.
References
- New and Renewable/Green Energy Policy, Ministry of Trade, Industry and Energy of Korea: UCL. Available online: https://www.motie.go.kr/motie/py/fe/fe2/greenenergy2/greenenergy.jsp (accessed on 28 October 2020).
- New and Renewable Energy Supply Performance Survey: Energy Generation, KOIS, Korea Energy Agency (1995–2018): URL. Available online: http://kosis.kr/statHtml/statHtml.do?orgId=337&tblId=DT_337N_A002&vw_cd=MT_ZTITLE&list_id=337_33701_2&seqNo=&lang_mode=ko&language=kor&obj_var_id=&itm_id=&conn_path=MT_ZTITLE (accessed on 28 October 2020).
- HYPEBAE. Available online: https://hypebae.com/2018/5/balenciaga-new-flagship-store-miami-design-district (accessed on 28 October 2020).
- REAL. Available online: http://real.hanbat.ac.kr/ (accessed on 28 October 2020).
- Juan Bisquert’s Blog. Available online: https://juanbisquert.wordpress.com/2014/04/08/dye-solar-cell-facade-at-swisstech-covention-center-at-epfl-by-solaronix/ (accessed on 28 October 2020).
- Kim, J. A Study on Perovskite Solar Cell Characteristics of Photoelectrode Fabrication. Master’s Thesis, Gachon University, Gyeonggi-do, Korea, February 2017. [Google Scholar]
- Jeong, W. Visual Environment Assessment of Office Space Daylighted by Transparent BIPV Window System. Master’s Thesis, Hanbat National University, Daejeon, Korea, February 2013. [Google Scholar]
- Jo, H.; Han, S. An evaluation for the building aesthetics applied with facade-integrated solar cells based on analytical hierarchy process. Korea Inst. Ecol. Archit. Environ. J. 2018, 18, 21–27. [Google Scholar]
- Oh, M.; Yoon, J.; Lee, J.; Lee, J. A study on the optimal window-floor ratio considering glazing type for application of dye-sensitized solar cell in office building. Korean Sol. Energy Soc. 2010, 30, 303–308. [Google Scholar]
- Kim, J.; Han, S. A quantification procedure for interior performance of architectural openings associated with dye-sensitized solar cells. Sustainability 2019, 11, 6461. [Google Scholar] [CrossRef] [Green Version]
- Tsai, C.H.; Lin, C.M.; Liu, Y.C. Increasing the efficiency of dye-sensitized solar cells by adding nickel oxide nanoparticles to titanium dioxide working electrodes. Coatings 2020, 10, 195. [Google Scholar] [CrossRef] [Green Version]
- Huang, W.Y.; Hsieh, T.L. Dyes amount and light scattering influence on the photocurrent enhancement of titanium dioxide hierarchically structured photoanodes for dye-sensitized solar cells. Coatings 2020, 10, 13. [Google Scholar] [CrossRef] [Green Version]
- Kim, B. The energy performance analysis of dye sensitized solar cell installed in office building. Archit. Inst. Korea 2010, 26, 289–296. [Google Scholar]
- Boyce, P.; Eklund, N.; Mangum, S.; Saalfield, C.; Tang, L. Minimum acceptable transmittance of glazing. Light. Res. Technol. 1995, 27, 145–152. [Google Scholar] [CrossRef]
- Lee, J.S.; Kim, B.S. Development of the nomo-graph for evaluation on discomfort glare of windows. Sol. Energy 2007, 81, 799–808. [Google Scholar] [CrossRef]
- Kim, H.; Yoon, J. Domain for DSSC(Dye-Sensitized Solar Cell) window by analysis of daylighting performance and preferred color. Archit. Inst. Korea 2012, 18, 275–282. [Google Scholar]
- Ng, P.K.; Mithraratne, N.; Kua, H.W. Energy analysis of semi-transparent BIPV in Singapore buildings. Energy Build. 2013, 66, 274–281. [Google Scholar] [CrossRef]
- Park, B.; Choi, E.; Choi, Y.; Moon, J. Analysis of energy performance of DSSC BIPV applied to office building. Korea Inst. Ecol. Archit. Environ. J. 2019, 19, 134–135. [Google Scholar]
- Lee, S. Development of BIPV Power Generation Prediction Algorithm for Mock-Up Analysis. Ph.D. Thesis, University of Soeul, Soeul, Korea, February 2017. [Google Scholar]
- Lee, H.M.; Yoon, J.H. Power performance analysis of a transparent DSSC BIPV window based on 2 year measurement data in a full-scale mock-up. Appl. Energy 2018, 225, 1013–1021. [Google Scholar] [CrossRef]
- Kim, J.-H.; Han, S.-H. Analysis of standardized factor coefficient for building aesthetics by types of colored BIPV: Focused on the color factor. KIEAE J. 2020, 20, 135–141. [Google Scholar] [CrossRef]
- Choi, Y.; Kim, Y.; Kim, H.; Sin, M. A study on changes to the azimuth angle and tilt of a photovoltaic array and its influence on solar radiation. Korean Inst. Illum. Electr. Install. Eng. 2011, 2011, 337–338. [Google Scholar]
- Mehmood, U.; Malik, M.I.; Khan, A.U.H.; Hussein, I.A.; Harrabi, K.; Al-Ahmed, A. Effect of outdoor temperature on the power-conversion efficiency of newly synthesized organic photosensitizer based dye-sensitized solar cells. Mater. Lett. 2018, 220, 222–225. [Google Scholar] [CrossRef]
- Lee, H.; Yang, Y.; Yoon, J. The study on the power generation measurement of DSSC BIPV window according to cloud cover & irradiation. Korean Sol. Energy Soc. 2016, 36, 13. [Google Scholar]
Figure 1.
Research Flow.

Figure 2.
Mock-up Plans.

Figure 3.
Mock-up and Module Configuration for Monitoring.

Figure 4.
Temporary Abnormal Efficiency Status.

Figure 5.
Solar Radiation and Pmax Value of RD20.

Figure 6.
Solar Radiation and Pmax Value of BD20.

Figure 7.
Solar Radiation and Pmax Value of GD20.

Figure 8.
Comparative Solar Radiation and Pmax Values among RD20, GD20, and BD20.

Figure 9.
Solar Radiation and Pmax Value of RD07.

Figure 10.
Solar Radiation and Pmax Value of RD10.

Figure 11.
Solar Radiation and Pmax Value of RD20.

Figure 12.
Solar Radiation and Pmax Graph (VLT).


Table 1.
Application Cases of Colored Building Integrated Photovoltaic Systems (BIPV).
| 1st Generation PV | 2nd Generation PV | 3rd Generation PV |
|---|---|---|
 |  |  |
| Balenciaga Store, Miami, Florida, USA [3] | Solar Cube, Hanbat National University, Daejeon, Korea [4] | Swiss Tech Convention Center, Ecblens, Swiss [5] |
Table 2.
Case Mock-up Structures Presented by Previous Research.
| S. M. Lee’s Study (2017) | H. M. Lee’s Study (2018) |
|---|---|
 |  |
| Mock-up with Crystalline and Amorphous Solar Cell [18] | Mock-up with Dye-Sensitized Solar cell [19] |
Table 3.
Type and Profile of the Dye-Sensitized Solar Cells (DSSCs) for Evaluation.
| Type | Color/VLT | Vmp | Imp | Voc | Isc |
|---|---|---|---|---|---|
 RD07 | Red/7% | 16 V | 1.1 A | ~25 V | 1.3 A |
 RD10 | Red/10% | 16 V | 0.9 A | ~25 V | 1.0 A |
 RD20 | Red/20% | 16 V | 0.7 A | ~25 V | 0.85 A |
 GD20 | Green/20% | 13~17 V | 0.2~0.4 A | ~23 V | 0.2~0.4 A |
 BD20 | Blue/20% | 13~17 V | 0.2~0.4 A | ~23 V | 0.2~0.4 A |
Publisher’s Note: MDPI stays neutral with regard to jurisdictional claims in published maps and institutional affiliations. |
© 2020 by the authors. Licensee MDPI, Basel, Switzerland. This article is an open access article distributed under the terms and conditions of the Creative Commons Attribution (CC BY) license (http://creativecommons.org/licenses/by/4.0/).
Share and Cite
MDPI and ACS Style
Kim, J.-H.; Han, S.-H. Energy Generation Performance of Window-Type Dye-Sensitized Solar Cells by Color and Transmittance. Sustainability 2020, 12, 8961. https://0-doi-org.brum.beds.ac.uk/10.3390/su12218961
AMA Style
Kim J-H, Han S-H. Energy Generation Performance of Window-Type Dye-Sensitized Solar Cells by Color and Transmittance. Sustainability. 2020; 12(21):8961. https://0-doi-org.brum.beds.ac.uk/10.3390/su12218961
Chicago/Turabian StyleKim, Jae-Hyang, and Seung-Hoon Han. 2020. "Energy Generation Performance of Window-Type Dye-Sensitized Solar Cells by Color and Transmittance" Sustainability 12, no. 21: 8961. https://0-doi-org.brum.beds.ac.uk/10.3390/su12218961
Note that from the first issue of 2016, this journal uses article numbers instead of page numbers. See further details here.