Understanding Regional Risk Factors for Cancer: A Cluster Analysis of Lifestyle, Environment and Socio-Economic Status in Poland


Abstract
:1. Introduction
- Invest in human resources by increasing medical staff and improving the quality of oncological training and education;
- Reduce cancer incidence through investments in education and primary prevention related to cancer disease (i.e., promotion of healthy lifestyles to curb cancer-risk behaviours);
- Improve the effectiveness of secondary prevention through larger investments in screening;
- Invest in bench sciences and healthcare innovation in order to introduce effective diagnostic and therapeutic solutions;
- Fund improvements within the oncological care system in order to improve organization and processes whilst also providing patients with access to the highest quality of comprehensive, diagnostic and therapeutic care along the “patient path”.
2. Cancer Risk Factors in Poland
2.1. Lifestyle
2.2. Air Quality
2.3. Socio-Economic Factors
3. Research Questions, Data and Methods
3.1. Research Questions
- Are clusters distinguishable when internal factors (lifestyle and socio-economic status) are combined with external factors (environment) into a single spatial analysis?
- What are the implications of spatial cluster analysis of cancer-risk factors for health policy interventions in Poland?
3.2. Data
3.3. Methods
4. Results
4.1. Cluster Analysis
4.2. Multiple Linear Regression Model of Cancer Morbidity
5. Discussion
6. Conclusions
Author Contributions
Funding
Conflicts of Interest
Abbreviations
| BMI | body mass index |
| household_income | net household income, monthly |
| PM10 | particulate matter with a diameter between 2.5 μm and 10 μm |
| PM2.5 | fine particulate matter with a diameter of 2.5 μm or less |
| WHO | World Health Organization |
| NCDs | non-communicable diseases |
| SES | socio-economic status |
| BaP | Benzoapyrene |
| SD | Social Diagnosis |
| PLN | Polish zloty |
References
- World Health Organization Cancer. Available online: https://www.who.int/news-room/fact-sheets/detail/cancer (accessed on 5 October 2019).
- Mendis, S.; World Health Organization. Global Status Report on Noncommunicable Diseases 2014; WHO: Geneva, Switzerland, 2014; ISBN 978-92-4-156485-4. [Google Scholar]
- World Health Organization. Global Status Report on Noncommunicable Diseases: 2010; World Health Organization: Geneva, Switzerland, 2011; ISBN 978-92-4-156422-9. [Google Scholar]
- National Cancer Institute Cancer Statistics. Available online: https://www.cancer.gov/about-cancer/understanding/statistics (accessed on 22 December 2019).
- Blue Ribbon Panel Report. Cancer Moonshoot. 2016; p. 74. Available online: https://www.cancer.gov/research/key-initiatives/moonshot-cancer-initiative/blue-ribbon-panel/blue-ribbon-panel-report-2016.pdf (accessed on 31 October 2020).
- World Health Organization Global Action Plan for the Prevention and Control of NCDs. 2013–2020. Available online: http://www.who.int/nmh/events/ncd_action_plan/en/ (accessed on 6 September 2019).
- European Commission Communication from the Commission on European Action against Cancer. Available online: http://ec.europa.eu/health/ph_information/dissemination/diseases/docs/com_2009_291.en.pdf (accessed on 29 December 2019).
- Albreht, T.; Martin-Moreno, J.M.; Jelenc, M.; Gorgojo, L.; Harris, M. European Guide for Quality National Cancer Control Programmes; National Institute of Public Health: Ljubljana, Slovenia, 2015; ISBN 978-961-6911-60-3.
- European Commission. Towards a Mission-Oriented Research and Innovation Policy in the European Union—An ESIR Memorandum; Publications Office of the European Union: Luxembourg, 2017. [Google Scholar] [CrossRef]
- Mazzucato, M. Mission-Oriented Research & Innovation in the European Union: A Problem-Solving Approach to Fuel Innovation-Led Growth; Publications Office of the European Union: Luxembourg, 2018; ISBN 978-92-79-79918-1. [Google Scholar]
- Didkowska, J.; Wojciechowska, U.; Czaderny, K.; Olasek, P.; Ciuba, A. Nowotwory złośliwe w Polsce w 2017 roku | Cancer in Poland in 2017; Warszawa, Poland. 2019. Available online: http://onkologia.org.pl/wp-content/uploads/Nowotwory_2017.pdf (accessed on 31 October 2020).
- Didkowska, J. Prognozy rozwoju chorób nowotworowych w Polsce (Forecasts of the development of cancer diseases in Poland). In Zachorowalność i umieralność na nowotwory a sytuacja demograficzna Polski; Rządowa Rada Ludnościowa: Warsaw, Poland, 2014. [Google Scholar]
- Ministerstwo Zdrowia Projekt uchwały Rady Ministrów w sprawie przyjęcia Narodowej Strategii Onkologicznej na lata 2020–2030 [Draft of resolution of the Cabinet regarding the adoption of the National Oncology Strategy for 2020–2030]. Available online: https://www.gov.pl/web/zdrowie/projekt-uchwaly-rady-ministrow-w-sprawie-przyjecia-narodowej-strategii-onkologicznej-na-lata-2020-2030 (accessed on 29 December 2019).
- Polak, M.; Genowska, A.; Szafraniec, K.; Fryc, J.; Jamiołkowski, J.; Pająk, A. Area-Based Socio-Economic Inequalities in Mortality from Lung Cancer and Respiratory Diseases. Int. J. Environ. Res. Public Health 2019, 16, 1791. [Google Scholar] [CrossRef] [PubMed] [Green Version]
- Orlewska, K.; Sliwczynski, A.; Orlewska, E. An ecological study of the link between the risk of most frequent types of cancer in Poland and socioeconomic variables. Int. J. Public Health 2018, 63, 777–786. [Google Scholar] [CrossRef] [PubMed] [Green Version]
- Comba, P.; Bianchi, F.; Fazzo, L.; Martina, L.; Menegozzo, M.; Minichilli, F.; Mitis, F.; Musmeci, L.; Pizzuti, R.; Santoro, M.; et al. Cancer mortality in an area of Campania (Italy) characterized by multiple toxic dumping sites. Ann. N. Y. Acad. Sci. 2006, 1076, 449–461. [Google Scholar] [CrossRef] [PubMed] [Green Version]
- Peretti-Watel, P.; Fressard, L.; Bocquier, A.; Verger, P. Perceptions of cancer risk factors and socioeconomic status. A French study. Prev. Med. Rep. 2016, 3, 171–176. [Google Scholar] [CrossRef] [PubMed] [Green Version]
- World Health Organization. World Health Statistics 2019: Monitoring Health for the SDGs. Available online: http://www.who.int/gho/publications/world_health_statistics/2019/en/ (accessed on 6 September 2019).
- Kubik, A.K.; Parkin, D.M.; Plesko, I.; Zatonski, W.; Kramarova, E.; Möhner, M.; Friedl, H.P.; Juhasz, L.; Tzvetansky, C.G.; Reissigova, J. Patterns of cigarette sales and lung cancer mortality in some central and eastern European countries, 1960–1989. Cancer 1995, 75, 2452–2460. [Google Scholar] [CrossRef]
- Tyczyński, J. Lung cancer mortality and tobacco smoking in Poland—Will we observe further changes in mortality in light of recent smoking patterns? Nowotw. J. Oncol. 2004, 54, 333–341. [Google Scholar]
- Zatoński, W.; Jha, P. The Health Transformation in Eastern Europe after 1990: A Second Look; M. Skłodowska-Curie Memorial Cancer Center and Institute of Oncology: Warsaw, Poland, 2000. [Google Scholar]
- National Cancer Institute Cancer Disparities. Available online: https://www.cancer.gov/about-cancer/understanding/disparities (accessed on 22 December 2019).
- Arminger, G.; Clogg, C.C.; Sobel, M.E. (Eds.) Handbook of Statistical Modeling for the Social and Behavioral Sciences; Springer: Berlin/Heidelberg, Germany, 1995; ISBN 978-0-306-44805-8. [Google Scholar]
- Collins, L.M.; Lanza, S.T. Latent Class and Latent Transition Analysis: With Applications in the Social, Behavioral, and Health Sciences | Wiley. Available online: https://0-www-wiley-com.brum.beds.ac.uk/en-us/Latent+Class+and+Latent+Transition+Analysis%3A+With+Applications+in+the+Social%2C+Behavioral%2C+and+Health+Sciences-p-9780470228395 (accessed on 22 December 2019).
- Courtney, K.E.; Polich, J. Binge drinking in young adults: Data, definitions, and determinants. Psychol. Bull. 2009, 135, 142–156. [Google Scholar] [CrossRef]
- Kuper, H.; Boffetta, P.; Adami, H.-O. Tobacco use and cancer causation: Association by tumour type. J. Intern. Med. 2002, 252, 206–224. [Google Scholar] [CrossRef] [Green Version]
- Gallaway, M.S.; Henley, S.J.; Steele, C.B.; Momin, B.; Thomas, C.C.; Jamal, A.; Trivers, K.F.; Singh, S.D.; Stewart, S.L. Surveillance for Cancers Associated with Tobacco Use - United States, 2010–2014. MMWR Surveill Summ 2018, 67, 1–42. [Google Scholar] [CrossRef]
- Office of the Surgeon General (US); Office on Smoking and Health (US). The Health Consequences of Smoking: A Report of the Surgeon General; Reports of the Surgeon General; Centers for Disease Control and Prevention (US): Atlanta, GA, USA, 2004.
- Krajowy Rejestr Nowotworów [National Cancer Registry]. Raporty. 2018. Available online: http://onkologia.org.pl/raporty/ (accessed on 31 October 2020).
- Kushi, L.H.; Doyle, C.; McCullough, M.; Rock, C.L.; Demark-Wahnefried, W.; Bandera, E.V.; Gapstur, S.; Patel, A.V.; Andrews, K.; Gansler, T.; et al. American Cancer Society Guidelines on nutrition and physical activity for cancer prevention: Reducing the risk of cancer with healthy food choices and physical activity. CA Cancer J. Clin. 2012, 62, 30–67. [Google Scholar] [CrossRef] [Green Version]
- Vainio, H.; Kaaks, R.; Bianchini, F. Weight control and physical activity in cancer prevention: International evaluation of the evidence. Eur. J. Cancer Prev. 2002, 11 (Suppl. 2), S94–S100. [Google Scholar]
- Calle, E.E.; Rodriguez, C.; Walker-Thurmond, K.; Thun, M.J. Overweight, obesity, and mortality from cancer in a prospectively studied cohort of U.S. adults. N. Engl. J. Med. 2003, 348, 1625–1638. [Google Scholar] [CrossRef] [PubMed] [Green Version]
- Berrington de Gonzalez, A.; Sweetland, S.; Spencer, E. A meta-analysis of obesity and the risk of pancreatic cancer. Br. J. Cancer 2003, 89, 519–523. [Google Scholar] [CrossRef] [PubMed] [Green Version]
- Patel, A.V.; Rodriguez, C.; Bernstein, L.; Chao, A.; Thun, M.J.; Calle, E.E. Obesity, recreational physical activity, and risk of pancreatic cancer in a large U.S. Cohort. Cancer Epidemiol. Biomarkers Prev. 2005, 14, 459–466. [Google Scholar] [CrossRef] [PubMed] [Green Version]
- Lindblad, M.; Rodríguez, L.A.G.; Lagergren, J. Body mass, tobacco and alcohol and risk of esophageal, gastric cardia, and gastric non-cardia adenocarcinoma among men and women in a nested case-control study. Cancer Causes Control 2005, 16, 285–294. [Google Scholar] [CrossRef]
- Amling, C.L.; Riffenburgh, R.H.; Sun, L.; Moul, J.W.; Lance, R.S.; Kusuda, L.; Sexton, W.J.; Soderdahl, D.W.; Donahue, T.F.; Foley, J.P.; et al. Pathologic variables and recurrence rates as related to obesity and race in men with prostate cancer undergoing radical prostatectomy. J. Clin. Oncol. 2004, 22, 439–445. [Google Scholar] [CrossRef] [PubMed]
- Freedland, S.J.; Terris, M.K.; Platz, E.A.; Presti, J.C. Body mass index as a predictor of prostate cancer: Development versus detection on biopsy. Urology 2005, 66, 108–113. [Google Scholar] [CrossRef] [PubMed]
- Patel, A.V.; Callel, E.E.; Bernstein, L.; Wu, A.H.; Thun, M.J. Recreational physical activity and risk of postmenopausal breast cancer in a large cohort of US women. Cancer Causes Control 2003, 14, 519–529. [Google Scholar] [CrossRef]
- Dodd, L.J.; Al-Nakeeb, Y.; Nevill, A.; Forshaw, M.J. Lifestyle risk factors of students: A cluster analytical approach. Prev. Med. 2010, 51, 73–77. [Google Scholar] [CrossRef]
- El Ansari, W.; Stock, C.; John, J.; Deeny, P.; Phillips, C.; Snelgrove, S.; Adetunji, H.; Hu, X.; Parke, S.; Stoate, M.; et al. Health promoting behaviours and lifestyle characteristics of students at seven universities in the UK. Cent. Eur. J. Public Health 2011, 19, 197–204. [Google Scholar] [CrossRef] [Green Version]
- Laska, M.N.; Pasch, K.E.; Lust, K.; Story, M.; Ehlinger, E. Latent class analysis of lifestyle characteristics and health risk behaviors among college youth. Prev. Sci. 2009, 10, 376–386. [Google Scholar] [CrossRef] [PubMed] [Green Version]
- American College of Health Association. The American College Health Association National College Health Assessment (ACHA-NCHA), Spring 2003 Reference Group report. J. Am. Coll. Health 2005, 53, 199–210. [Google Scholar]
- Mays, D.; Peshkin, B.N.; Sharff, M.E.; Walker, L.R.; Abraham, A.A.; Hawkins, K.; Tercyak, K.P. Correlates of Adherence to a Telephone-Based Multiple Health Behavior Change Cancer Preventive Intervention for Teens: The Healthy for Life Program (HELP). Health Educ. Behav. 2012, 39, 18–26. [Google Scholar] [CrossRef] [PubMed] [Green Version]
- Rebholz, C.E.; Rueegg, C.S.; Michel, G.; Ammann, R.A.; von der Weid, N.X.; Kuehni, C.E.; Spycher, B.D. Clustering of health behaviours in adult survivors of childhood cancer and the general population. Br. J. Cancer 2012, 107, 234–242. [Google Scholar] [CrossRef] [PubMed] [Green Version]
- Hill, K.G.; White, H.R.; Chung, I.J.; Hawkins, J.D.; Catalano, R.F. Early adult outcomes of adolescent binge drinking: Person- and variable-centered analyses of binge drinking trajectories. Alcohol. Clin. Exp. Res. 2000, 24, 892–901. [Google Scholar] [CrossRef] [PubMed]
- Elliott, M.; Arbogast, K.; Durbin, D. A Latent Class Analysis of Injury Patterns Among Rear-Seated, Seat-Belted Children. J. Trauma Inj. Infect. Crit. Care 2006, 61, 1244–1248. [Google Scholar] [CrossRef] [PubMed]
- Moreno-Gómez, C.; Romaguera-Bosch, D.; Tauler-Riera, P.; Bennasar-Veny, M.; Pericas-Beltran, J.; Martinez-Andreu, S.; Aguilo-Pons, A. Clustering of lifestyle factors in Spanish university students: The relationship between smoking, alcohol consumption, physical activity and diet quality. Public Health Nutr. 2012, 15, 2131–2139. [Google Scholar] [CrossRef] [Green Version]
- European Environment Agency Air Quality in Europe. 2018. Available online: https://www.eea.europa.eu/publications/air-quality-in-europe-2018 (accessed on 6 September 2019).
- Hemminki, K.; Pershagen, G. Cancer risk of air pollution: Epidemiological evidence. Environ. Health Perspect. 1994, 102, 187–192. [Google Scholar]
- Briggs, D. Environmental pollution and the global burden of disease. Br. Med. Bull. 2003, 68, 1–24. [Google Scholar] [CrossRef] [Green Version]
- Homaei Shandiz, F.; Hadizadeh Talasaz, Z. The relationship between breast cancer and air pollution: Review article. Rev. Clin. Med. 2017, 4, 136–139. [Google Scholar] [CrossRef]
- Jędrak, J.; Konduracka, E.; Badyda, A.J.; Dąbrowiecki, P. Wpływ zanieczyszczeń powietrza na zdrowie [Impact of air pollution on health]; Krakowski Alarm Smogowy: Kraków, Poland, 2017; Available online: https://depot.ceon.pl/bitstream/handle/123456789/15434/ksi%c4%85%c5%bcka%20o%20zdrowiu.pdf?sequence=1&isAllowed=y (accessed on 31 October 2020).
- World Health Organization Ambient (Outdoor) Air Pollution. Available online: https://www.who.int/news-room/fact-sheets/detail/ambient-(outdoor)-air-quality-and-health (accessed on 3 March 2020).
- Deuchert, E.; Cabus, S.; Tafreschi, D. A Short Note on Economic Development and Socioeconomic Inequality in Female Body Weight. Health Econ. 2014, 23, 861–869. [Google Scholar] [CrossRef] [PubMed] [Green Version]
- Fichera, E.; Gathergood, J. Do Wealth Shocks Affect Health? New Evidence from the Housing Boom. Health Econ. 2016, 25, 57–69. [Google Scholar] [CrossRef] [PubMed] [Green Version]
- Goding Sauer, A.; Siegel, R.L.; Jemal, A.; Fedewa, S.A. Current Prevalence of Major Cancer Risk Factors and Screening Test Use in the United States: Disparities by Education and Race/Ethnicity. Cancer Epidemiol. Biomark. Prev. 2019, 28, 629–642. [Google Scholar] [CrossRef] [PubMed] [Green Version]
- Hagen, T.P.; Häkkinen, U.; Iversen, T.; Klitkou, S.T.; Moger, T.A. Socio-economic Inequality in the Use of Procedures and Mortality among AMI Patients: Quantifying the Effects along Different Paths. Health Econ. 2015, 24, 102–115. [Google Scholar] [CrossRef] [PubMed]
- Link, B.G.; Phelan, J. Social Conditions as Fundamental Causes of Disease. J. Health Soc. Behav. 1995, 80–94. [Google Scholar] [CrossRef] [Green Version]
- Brodszky, V.; Beretzky, Z.; Baji, P.; Rencz, F.; Péntek, M.; Rotar, A.; Tachkov, K.; Mayer, S.; Simon, J.; Niewada, M.; et al. Cost-of-illness studies in nine Central and Eastern European countries. Eur. J. Health Econ. 2019, 20, 155–172. [Google Scholar] [CrossRef] [Green Version]
- Adler, N.E.; Newman, K. Socioeconomic Disparities in Health: Pathways and Policies. Health Aff. 2002, 21, 60–76. [Google Scholar] [CrossRef] [PubMed]
- Hemminki, K.; Li, X. Level of Education and the Risk of Cancer in Sweden. Cancer Epidemiol. Biomark. Prev. 2003, 12, 796–802. [Google Scholar]
- O’Connor, J.M.; Sedghi, T.; Dhodapkar, M.; Kane, M.J.; Gross, C.P. Factors Associated With Cancer Disparities Among Low-, Medium-, and High-Income US Counties. JAMA Netw. Open 2018, 1, e183146. [Google Scholar] [CrossRef] [Green Version]
- Withrow, D.R.; Berrington de González, A.; Spillane, S.; Freedman, N.D.; Best, A.F.; Chen, Y.; Shiels, M.S. Trends in Mortality Due to Cancer in the United States by Age and County-Level Income, 1999–2015. J. Natl. Cancer Inst. 2019, 111, 863–866. [Google Scholar] [CrossRef] [PubMed]
- Tanaka, R.; Matsuzaka, M.; Sasaki, Y. Influence of Income on Cancer Incidence and Death among Patients in Aomori, Japan. Asian Pac. J. Cancer Prev. 2018, 19, 3193–3202. [Google Scholar] [CrossRef] [Green Version]
- Kim, J.-M.; Kim, H.-M.; Jung, B.-Y.; Park, E.-C.; Cho, W.-H.; Lee, S.-G. The Association between Cancer Incidence and Family Income: Analysis of Korean National Health Insurance Cancer Registration Data. Asian Pac. J. Cancer Prev. 2012, 13, 1371–1376. [Google Scholar] [CrossRef] [Green Version]
- Chief Inspectorate for Environmental Protection Local Dataset about Pollution. Available online: http://powietrze.gios.gov.pl/pjp/archives?lang=en (accessed on 5 October 2019).
- Czapiński, J.; Panek, T. Social Diagnosis—Objective and Subjective Quality of Life in Poland. Available online: http://www.diagnoza.com/ (accessed on 5 October 2019).
- European Commission. Commission Regulation(EU) No 31/2011 of 17 January 2011 Amending Annexes to Regulation (EC) No 1059/2003 of the European Parliament and of the Council on the Establishment of a Common Classification of Territorial Units for Statistics (NUTS); Official Journal of the European Union: Brussels, Belgium, 2011; Volume 31, Available online: https://eur-lex.europa.eu/legal-content/EN/TXT/PDF/?uri=CELEX:32011R0031&from=EN (accessed on 31 October 2020).
- Główny Inspektor Ochrony Środowiska [Central Environmental Protection Inspectorate] Poziomy dopuszczalne zanieczyszczeń w powietrzu ze względu na ochronę zdrowia ludzi i ochronę roślin, terminy ich osiągnięcia oraz okresy, dla których uśrednia się wyniki pomiarów—GIOŚ [Admissible Levels of Pollutants in the Air Due to the Protection of Human Health and Plant Protection, Deadlines for Their Achievement and Periods for Which Measurement Results Are Averaged]. Available online: https://powietrze.gios.gov.pl/pjp/content/annual_assessment_air_acceptable_level (accessed on 5 October 2019).
- World Health Organization Air Quality Guidelines Global Update. 2005. Available online: https://apps.who.int/iris/handle/10665/107823 (accessed on 12 October 2020).
- Ward, J.H., Jr. Hierarchical Grouping to Optimize an Objective Function. J. Am. Stat. Assoc. 1963, 58, 236–244. [Google Scholar] [CrossRef]
- Henry, D.; Dymnicki, A.B.; Mohatt, N.; Allen, J.; Kelly, J.G. Clustering Methods with Qualitative Data: A Mixed Methods Approach for Prevention Research with Small Samples. Prev. Sci. 2015, 16, 1007–1016. [Google Scholar] [CrossRef] [PubMed] [Green Version]
- Ketchen, D.J.; Shook, C.L. The Application of Cluster Analysis in Strategic Management Research: An Analysis and Critique. Strateg. Manag. J. 1996, 17, 441–458. [Google Scholar] [CrossRef]
- Caruso, G.; Gattone, S.A.; Fortuna, F.; Di Battista, T. Cluster Analysis for mixed data: An application to credit risk evaluation. Socio Econ. Plan. Sci. 2020, 100850. [Google Scholar] [CrossRef]
- Caruso, G.; Gattone, S.A.; Balzanella, A.; Di Battista, T. Cluster Analysis: An Application to a Real Mixed-Type Data Set. In Models and Theories in Social Systems; Flaut, C., Hošková-Mayerová, Š., Flaut, D., Eds.; Studies in Systems, Decision and Control; Springer International Publishing: Cham, Switzerland, 2019; pp. 525–533. ISBN 978-3-030-00084-4. [Google Scholar]
- Milligan, G.W.; Cooper, M.C. A study of standardization of variables in cluster analysis. J. Classif. 1988, 5, 181–204. [Google Scholar] [CrossRef]
- Standardization in Cluster Analysis. Available online: https://community.alteryx.com/t5/Alteryx-Designer/Standardization-in-Cluster-Analysis/ta-p/302296 (accessed on 22 July 2020).
- R: A Package Providing Classes and Methods for Spatial Data. Available online: http://127.0.0.1:16776/library/sp/html/00sp.html (accessed on 21 July 2020).
- Cohen, J.; Cohen, P.; West, S.G.; Aiken, L.S. Applied Multiple Regression/Correlation Analysis for the Behavioral Sciences, 3rd ed.; Lawrence Erlbaum Associates Publishers: Mahwah, NJ, USA, 2003; ISBN 978-0-8058-2223-6. [Google Scholar]
- Krajowy Rejestr Nowotworów [National Cancer Registry] Zachorowania na nowotwory złośliwe w powiatach—Otwarte Dane [Cancer Incidence by Districts—open Data]. Available online: https://dane.gov.pl/pl/dataset/1793,zachorowania-na-nowotwory-zosliwe-w-powiatach (accessed on 12 October 2020).
- Brener, N.D.; Collins, J.L. Co-occurrence of health-risk behaviors among adolescents in the United States. J. Adolesc. Health 1998, 22, 209–213. [Google Scholar] [CrossRef]
- Elk, R.; Landrine, H. Cancer Disparities: Causes and Evidence-Based Solutions; Springer Publishing Company: Berlin/Heidelberg, Germany, 2012; ISBN 978-0-8261-0882-1. [Google Scholar]
- Merletti, F.; Galassi, C.; Spadea, T. The socioeconomic determinants of cancer. Environ. Health 2011, 10, S7. [Google Scholar] [CrossRef] [PubMed] [Green Version]
- Centers for Disease Control and Prevention What Are the Risk Factors for Lung Cancer? Available online: https://www.cdc.gov/cancer/lung/basic_info/risk_factors.htm (accessed on 22 December 2019).


| Variable | Mean | Std Dev | Minimum | Maximum |
|---|---|---|---|---|
| cigarettes_perday | 3.49 | 0.83 | 1.79 | 5.83 |
| Sport (% of responders) | 0.35 | 0.07 | 0.19 | 0.53 |
| Alcohol (% of responders) | 0.05 | 0.02 | 0.01 | 0.11 |
| BMI | 26.30 | 0.41 | 25.11 | 27.09 |
| household_income [PLN] | 3953.48 | 557.71 | 2971.14 | 6223.23 |
| years_of_edu | 11.98 | 0.87 | 10.41 | 15.08 |
| PM10_avg [µg/m3] | 32.73 | 6.19 | 20.92 | 52.05 |
| PM10_no_of_days | 53.69 | 22.21 | 17.41 | 128.00 |
| PM25_avg [µg/m3] | 23.59 | 5.142 | 13.33 | 35.76 |
| BaP_avg [µg/m3] | 4.42 | 2.09 | 0.94 | 10.41 |
| Cluster | Cigarettes_Perday | Sport | Alcohol | BMI | Household_Income | Years_of_Edu | PM10_Avg | PM10_No_of_Days | PM25_Avg | BaP_ Avg |
|---|---|---|---|---|---|---|---|---|---|---|
| 1 | −1.85 | 1.76 | −0.17 | −2.83 | 1.07 | 2.86 | 3.11 | 3.34 | 2.36 | 1.54 |
| 2 | −0.13 | −0.18 | −0.32 | −0.07 | −0.21 | −0.24 | 0.17 | 0.16 | 0.16 | 0.14 |
| 3 | 0.01 | 0.59 | 1.40 | 0.87 | 0.04 | 0.46 | 1.77 | 1.69 | 1.40 | 1.64 |
| 4 | −0.28 | 1.90 | 0.89 | −1.53 | 2.00 | 2.36 | −0.70 | −0.67 | −0.69 | −1.01 |
| 5 | 0.68 | −0.51 | 0.17 | 0.70 | −0.18 | −0.50 | −1.20 | −1.18 | −1.22 | −0.88 |
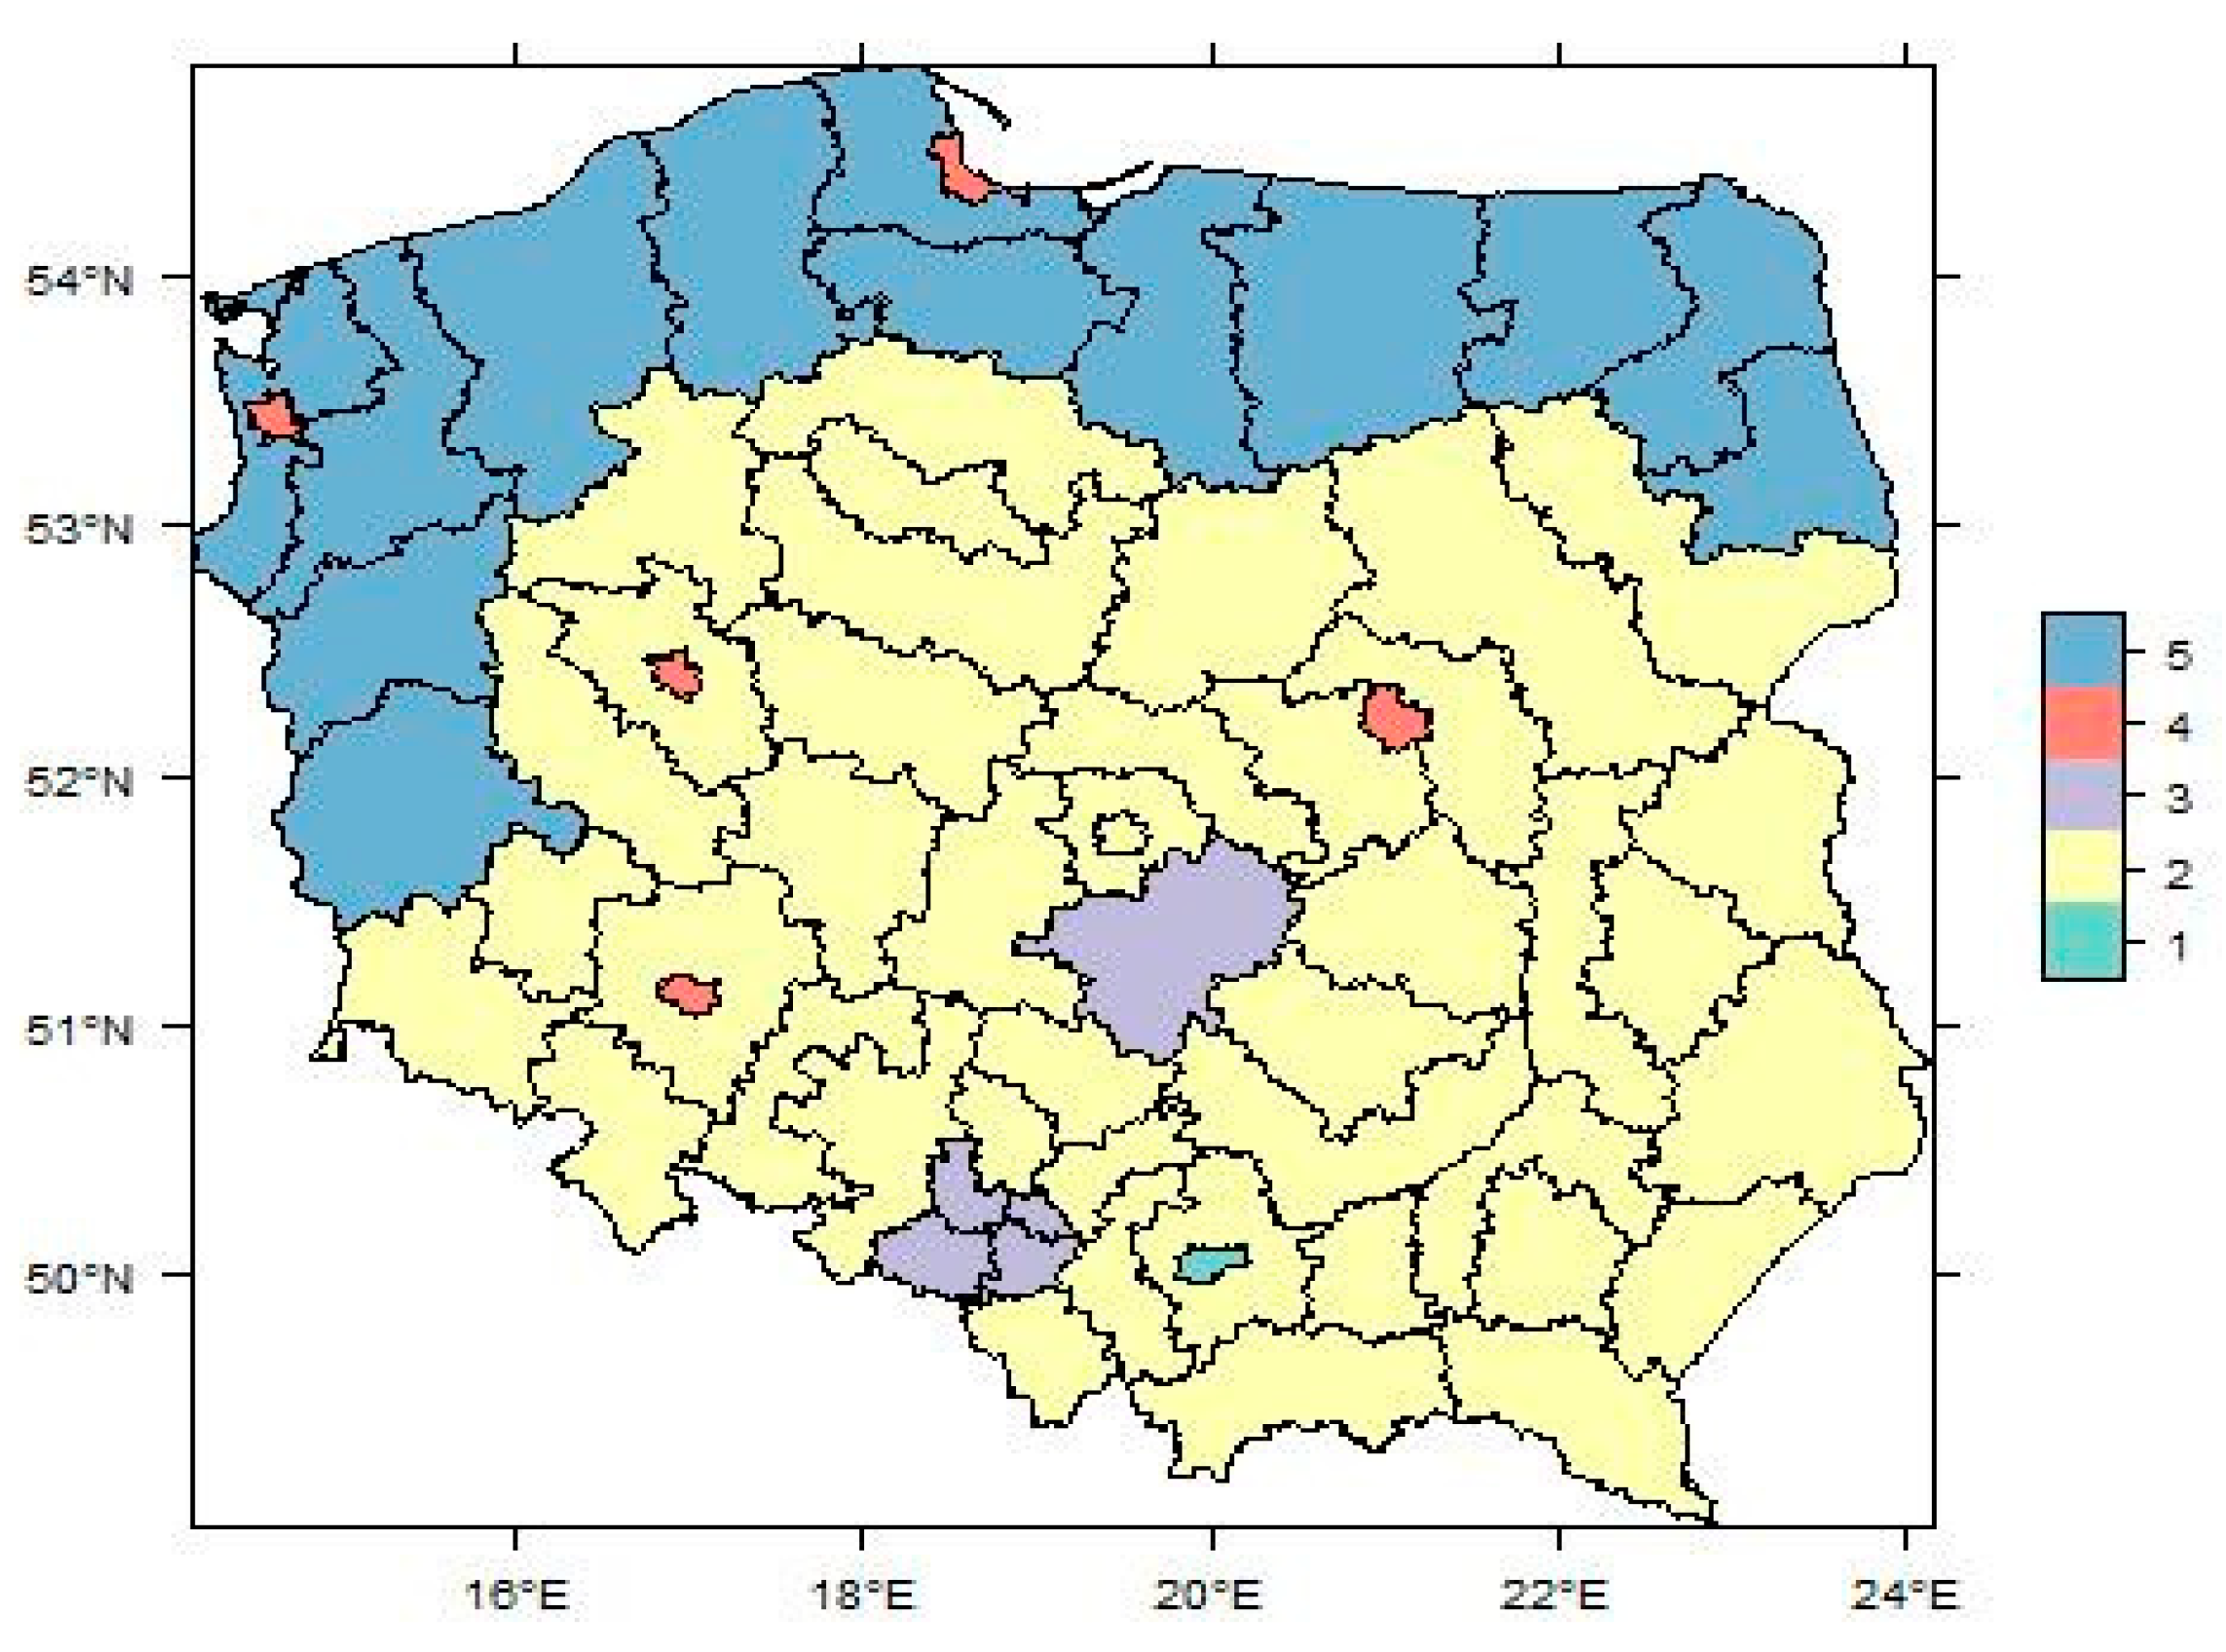
| Cluster | New Cases Per 100,000 |
|---|---|
| 1 (green)—Kraków | 487 |
| 2 (yellow)—neighbouring industrial areas | 407 |
| 3 (purple)—Silesia + Bełchatów (industrial areas) | 398 |
| 4 (red)—metropolitan area | 487 |
| 5 (blue)—northern part of Poland | 390 |
| National | 414 |
| Variable | Estimate | Std. Error | t Value | Pr(>|t|) |
|---|---|---|---|---|
| (Intercept) | 371.1916 | 656.5338 | 0.5654 | 0.5751 |
| cigarettes_perday | 11.562 | 10.9768 | 1.0533 | 0.2989 |
| BMI | −22.0325 | 21.342 | −1.0324 | 0.3084 |
| BaP_avg | 24.1219 | 6.3011 | 3.8282 | 0.0005 *** |
| PM25_avg | −4.1596 | 3.5321 | −1.1777 | 0.2463 |
| PM10_avg | −8.2597 | 5.6905 | −1.4515 | 0.1549 |
| PM10_no_of_days | 0.879 | 1.2331 | 0.7129 | 0.4803 |
| household_income | −0.0474 | 0.0184 | −2.5724 | 0.0141 * |
| years_of_edu | 89.2808 | 18.6942 | 4.7759 | 0.001 *** |
| Sport | −162.3632 | 155.2515 | −1.0458 | 0.3023 |
| Alcohol | −594.1154 | 431.0968 | −1.3781 | 0.1762 |
| Cluster | Cancer-Risk Factors—Focus Areas |
|---|---|
| 1 (green)—Kraków | air pollution—PM2.5, PM10, benzoapyrene |
| 2 (yellow)—neighbouring industrial areas | sports activity; air pollution—PM2.5, PM10, benzoapyrene; SES |
| 3 (purple)—Silesia + Bełchatów (industrial areas) | air pollution—benzoapyrene, PM2.5, PM10; alcohol; BMI |
| 4 (red)—metropolitan area | alcohol; air pollution—PM2.5, PM10, |
| 5 (blue)—northern part of Poland | smoking; sports activity; alcohol; BMI; SES |
Publisher’s Note: MDPI stays neutral with regard to jurisdictional claims in published maps and institutional affiliations. |
© 2020 by the authors. Licensee MDPI, Basel, Switzerland. This article is an open access article distributed under the terms and conditions of the Creative Commons Attribution (CC BY) license (http://creativecommons.org/licenses/by/4.0/).
Share and Cite
Majcherek, D.; Weresa, M.A.; Ciecierski, C. Understanding Regional Risk Factors for Cancer: A Cluster Analysis of Lifestyle, Environment and Socio-Economic Status in Poland. Sustainability 2020, 12, 9080. https://0-doi-org.brum.beds.ac.uk/10.3390/su12219080
Majcherek D, Weresa MA, Ciecierski C. Understanding Regional Risk Factors for Cancer: A Cluster Analysis of Lifestyle, Environment and Socio-Economic Status in Poland. Sustainability. 2020; 12(21):9080. https://0-doi-org.brum.beds.ac.uk/10.3390/su12219080
Chicago/Turabian StyleMajcherek, Dawid, Marzenna Anna Weresa, and Christina Ciecierski. 2020. "Understanding Regional Risk Factors for Cancer: A Cluster Analysis of Lifestyle, Environment and Socio-Economic Status in Poland" Sustainability 12, no. 21: 9080. https://0-doi-org.brum.beds.ac.uk/10.3390/su12219080