Styrene and Bioaerosol Removal from Waste Air with a Combined Biotrickling Filter and DBD–Plasma System


Abstract
:1. Introduction
2. Materials and Methods
2.1. Design of the Pilot-Scale Waste Air Treatment Plant
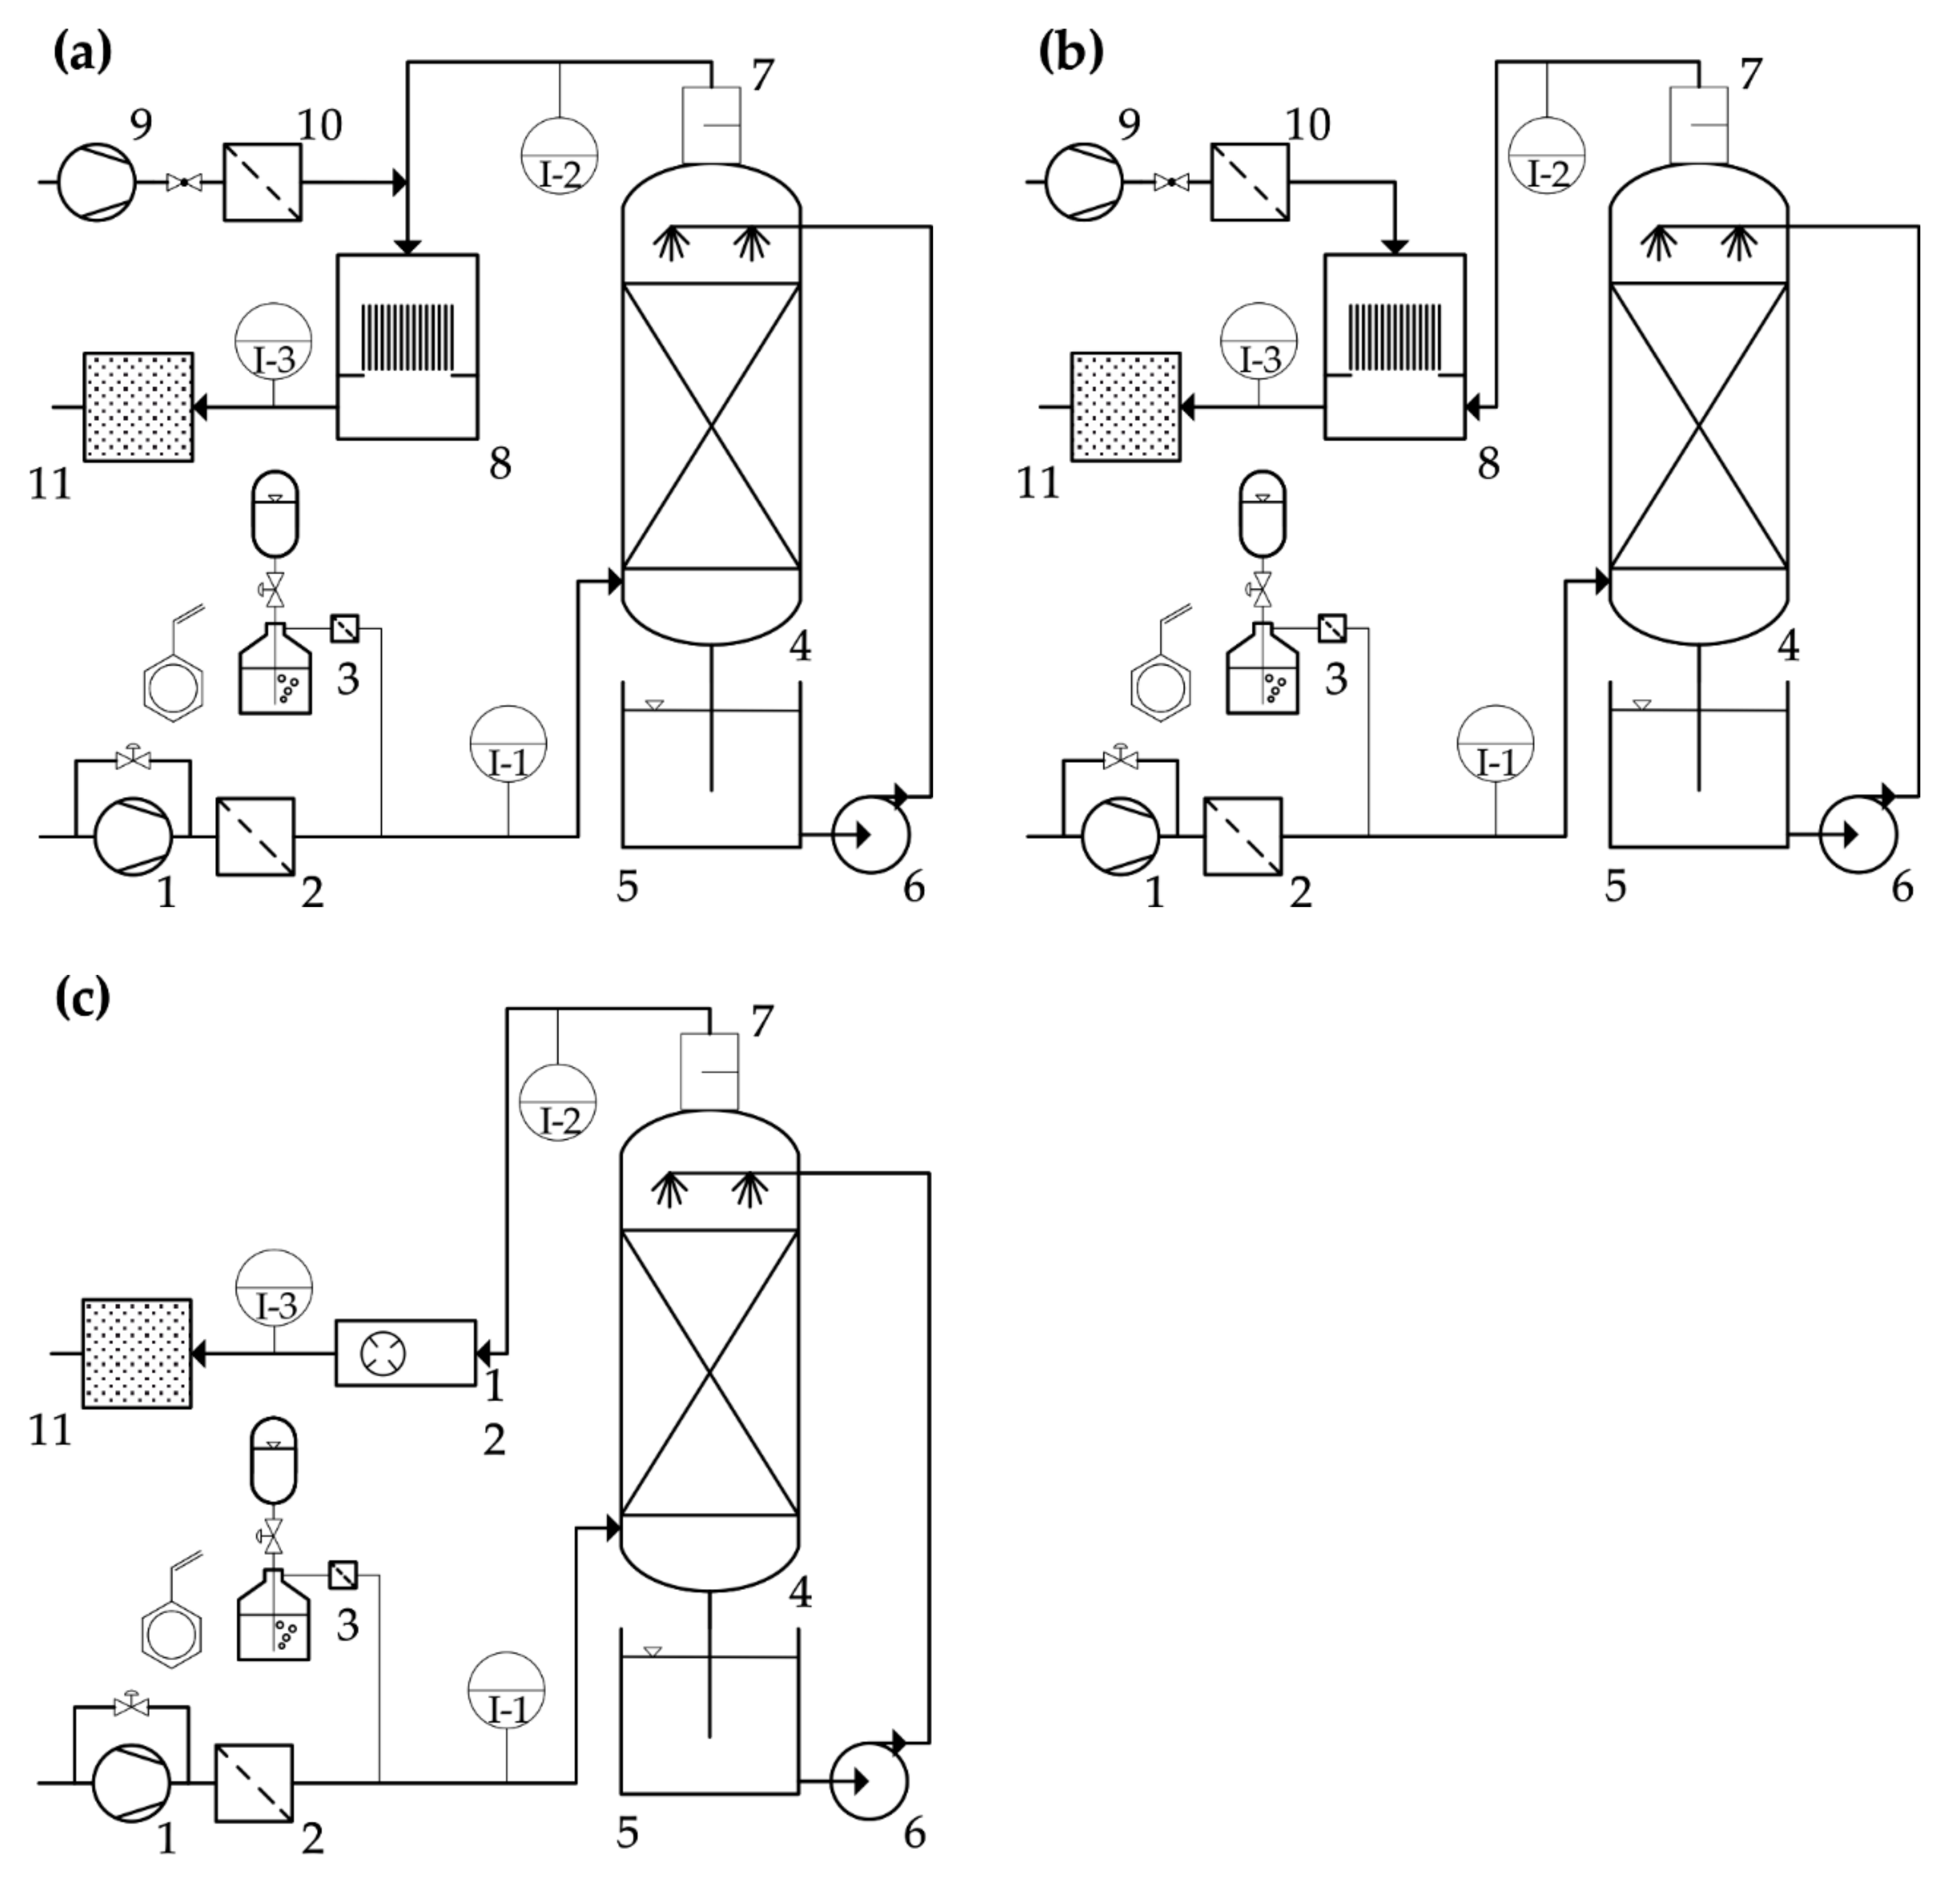
2.2. Plasma Generators
- (a)
- DBD inline mode: The air stream from the outlet of the biotrickling filter was converged with a diluting auxiliary air stream, provided by a second lateral channel blower, and prefiltered by an F9 folded filter (see above). The combined gas flow was connected via polypropylene (PP) piping (DN110) to the top flange of the DBD casing. A demister (type, PGM-4; length, 160 mm; material, PP knitted fabric; Anselm GmbH & Co. KG, Weißenburg, Germany) was installed in the piping, directly at the outlet of the BTF. The lateral channel blower, and therefore the auxiliary gas flow, could be regulated by a frequency converter. This strand could be shut off with a stop valve. The diluting gas stream was necessary to decrease humidity and secure stable plasma operation. This configuration created an inline mode of operation, where bioaerosols were conducted through the plasma generator, exposing microorganisms to the plasma, and emitted UV radiation.
- (b)
- DBD by-pass mode: The air stream from the outlet of the biotrickling filter was connected via PP piping (DN110) to a bottom flange of the DBD casing. The now-separate auxiliary gas flow was connected to the top flange of the DBD casing. This configuration created a by-pass mode of operation, by mixing ozone into the gas stream coming from the BTF. This prevented flashovers in the DBD itself, which may have been caused by wet air at a relative humidity of 35 and above.
- (c)
- Corona inline mode: The corona plasma generator was built in a square flow channel (diameter, 250 mm; length, 700 mm) with flanges, allowing it to be directly connected to the piping after the demister. This configuration created an inline mode of operation. By the nature of the plasma generation, higher relative humidity is tolerated. The generator was powered by a 400 W fixed output power supply; thus, the ozone output was fixed. In contrast to the large surface discharge of the DBD, the corona plasma occurs only at four spikes, arranged in a circle on an electrode ring.
2.3. Microbiology
2.4. Analytics and Calculations
2.5. Simulation Software
2.6. Chemicals
3. Results and Discussion
3.1. BTF
3.1.1. Influence of EBRT, Nitrogen Addition, Irrigation Density on Removal Efficiency, and Starvation Period
3.1.2. Influence of Nitrogen Source on Removal Efficiency
3.1.3. Pressure Loss and Clogging Events
3.1.4. Trickling Filter Fly Infestation
3.2. DBD–Plasma Operation
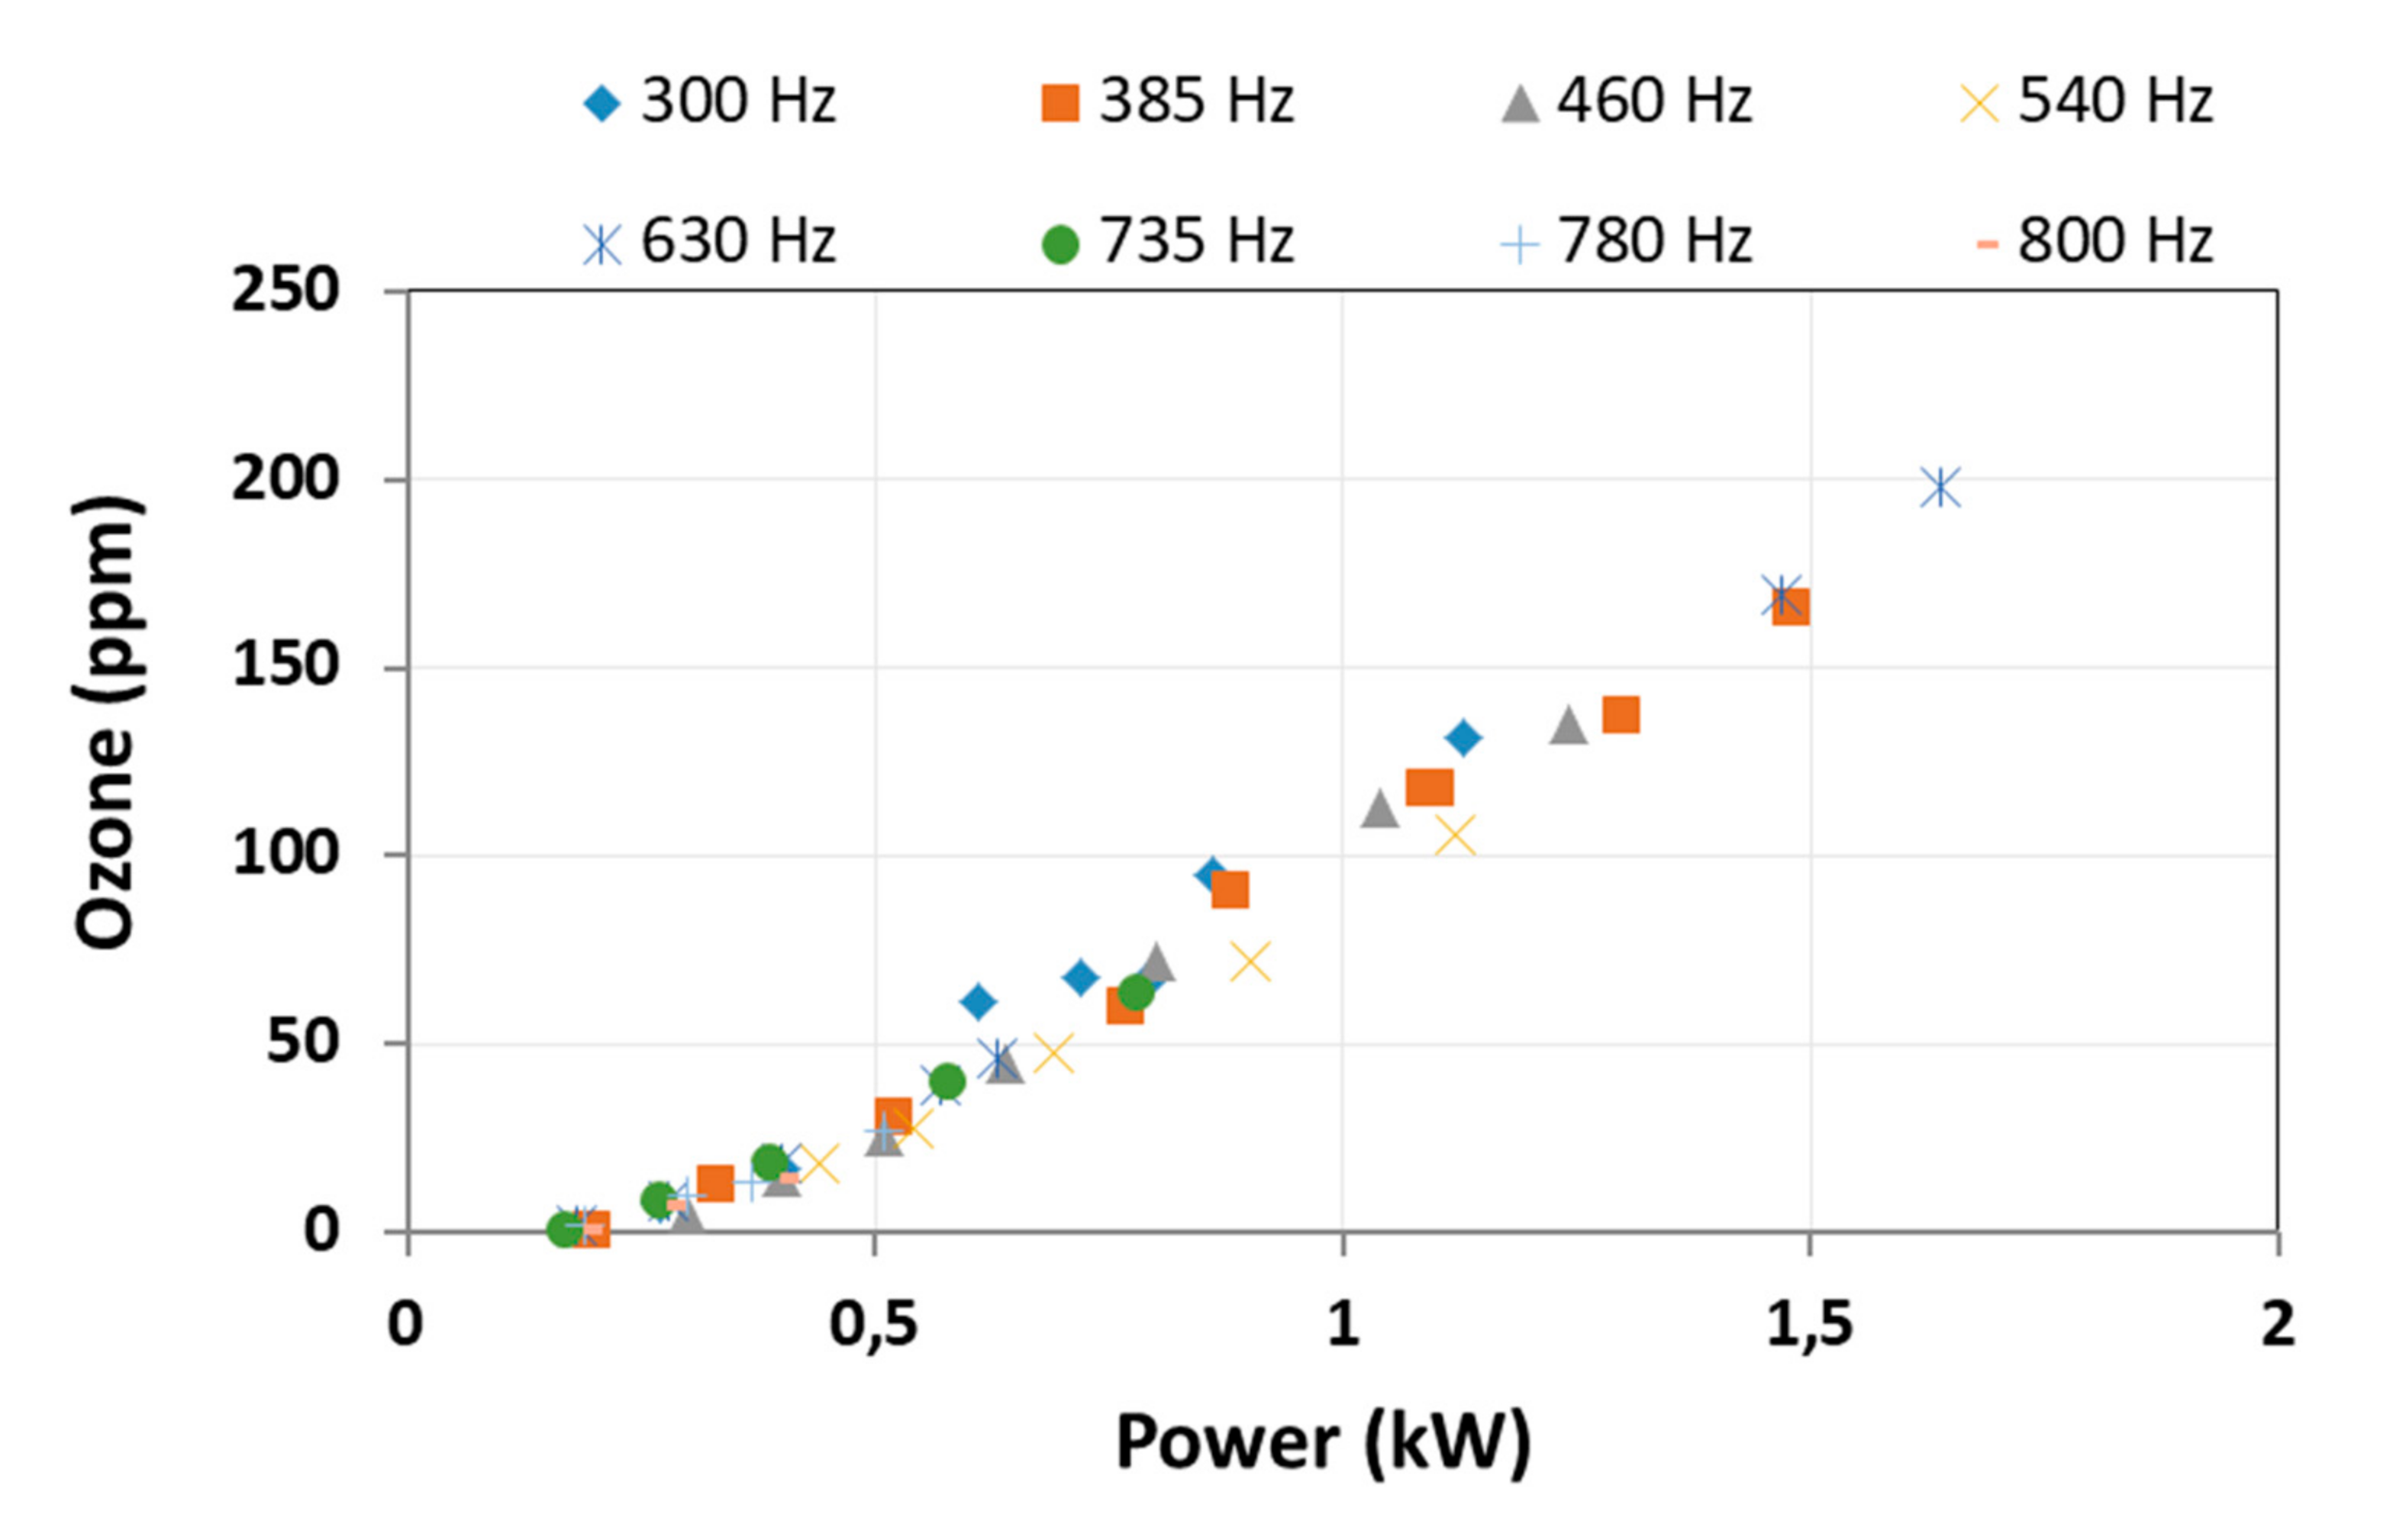
3.2.1. Ozone Output
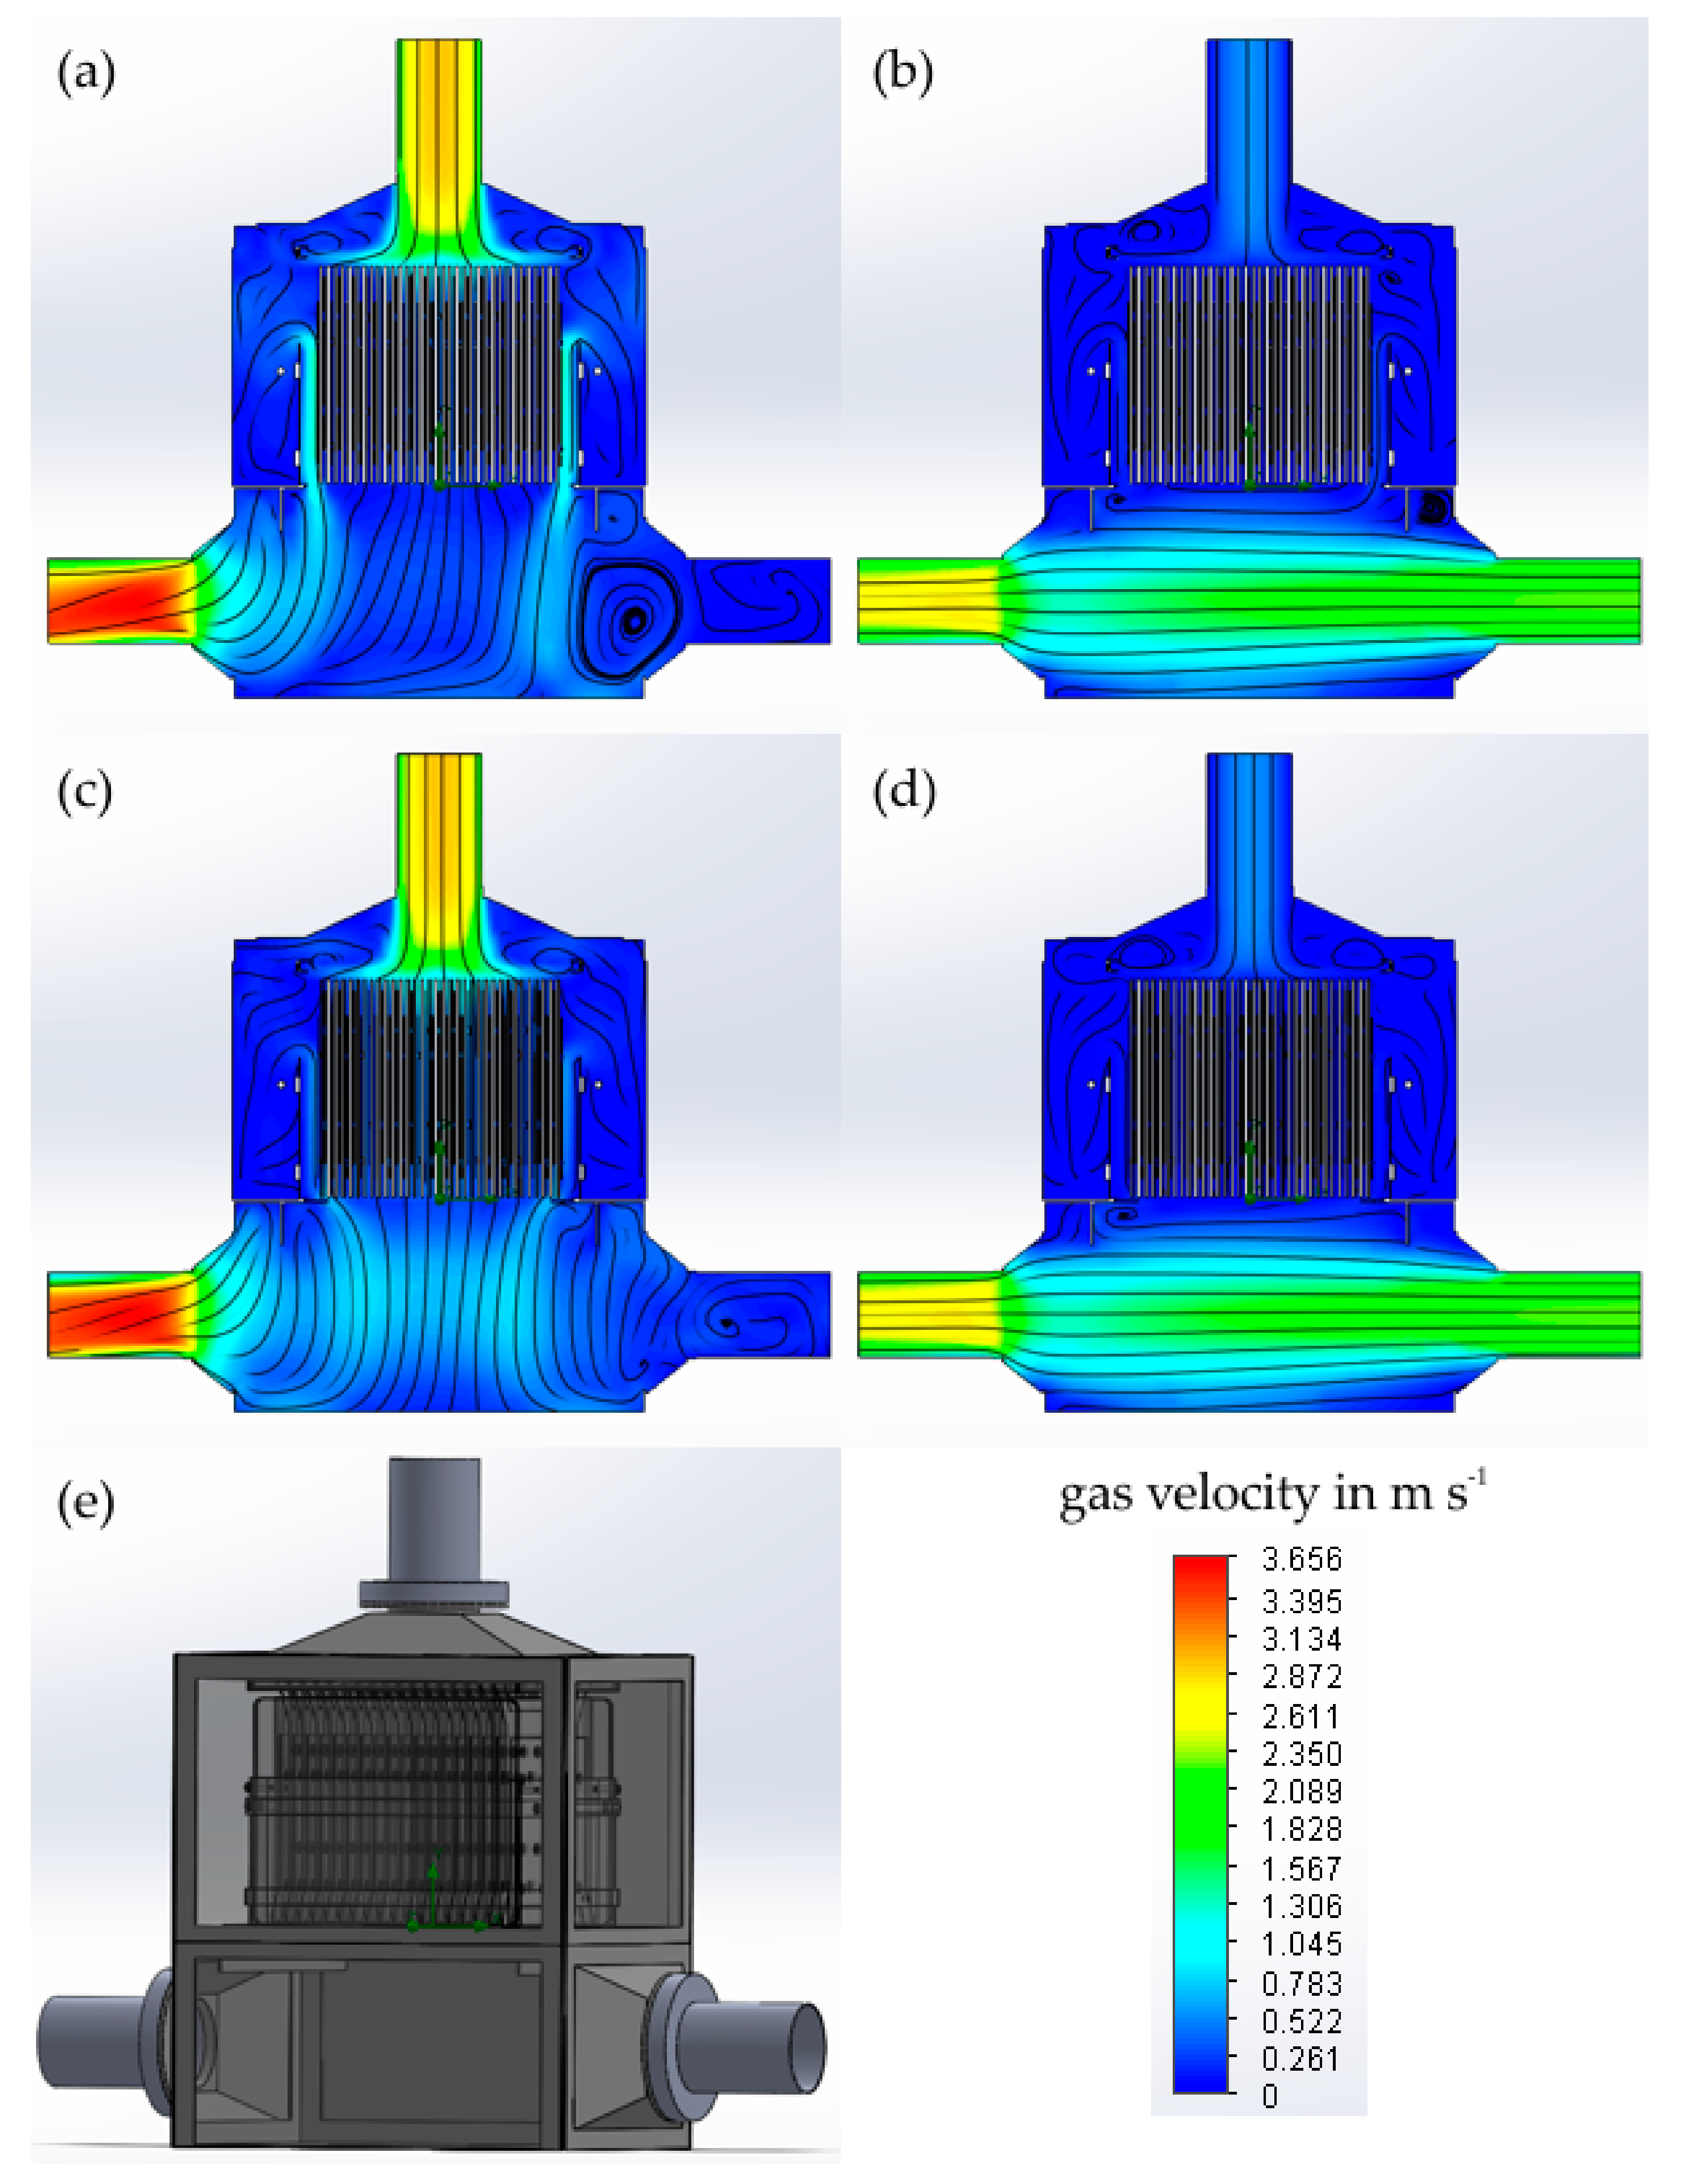
3.2.2. Hydraulic Flow Assessment of the Plasma Module
3.2.3. DBD for VOC Abatement
3.3. Bioaerosols: Monitoring and Reduction
3.3.1. Demister
3.3.2. Sterilization: DBD–Plasma
3.3.3. Sterilization: Corona Plasma
3.4. Synergistic Effects of the Combined System
3.5. Summary of Results
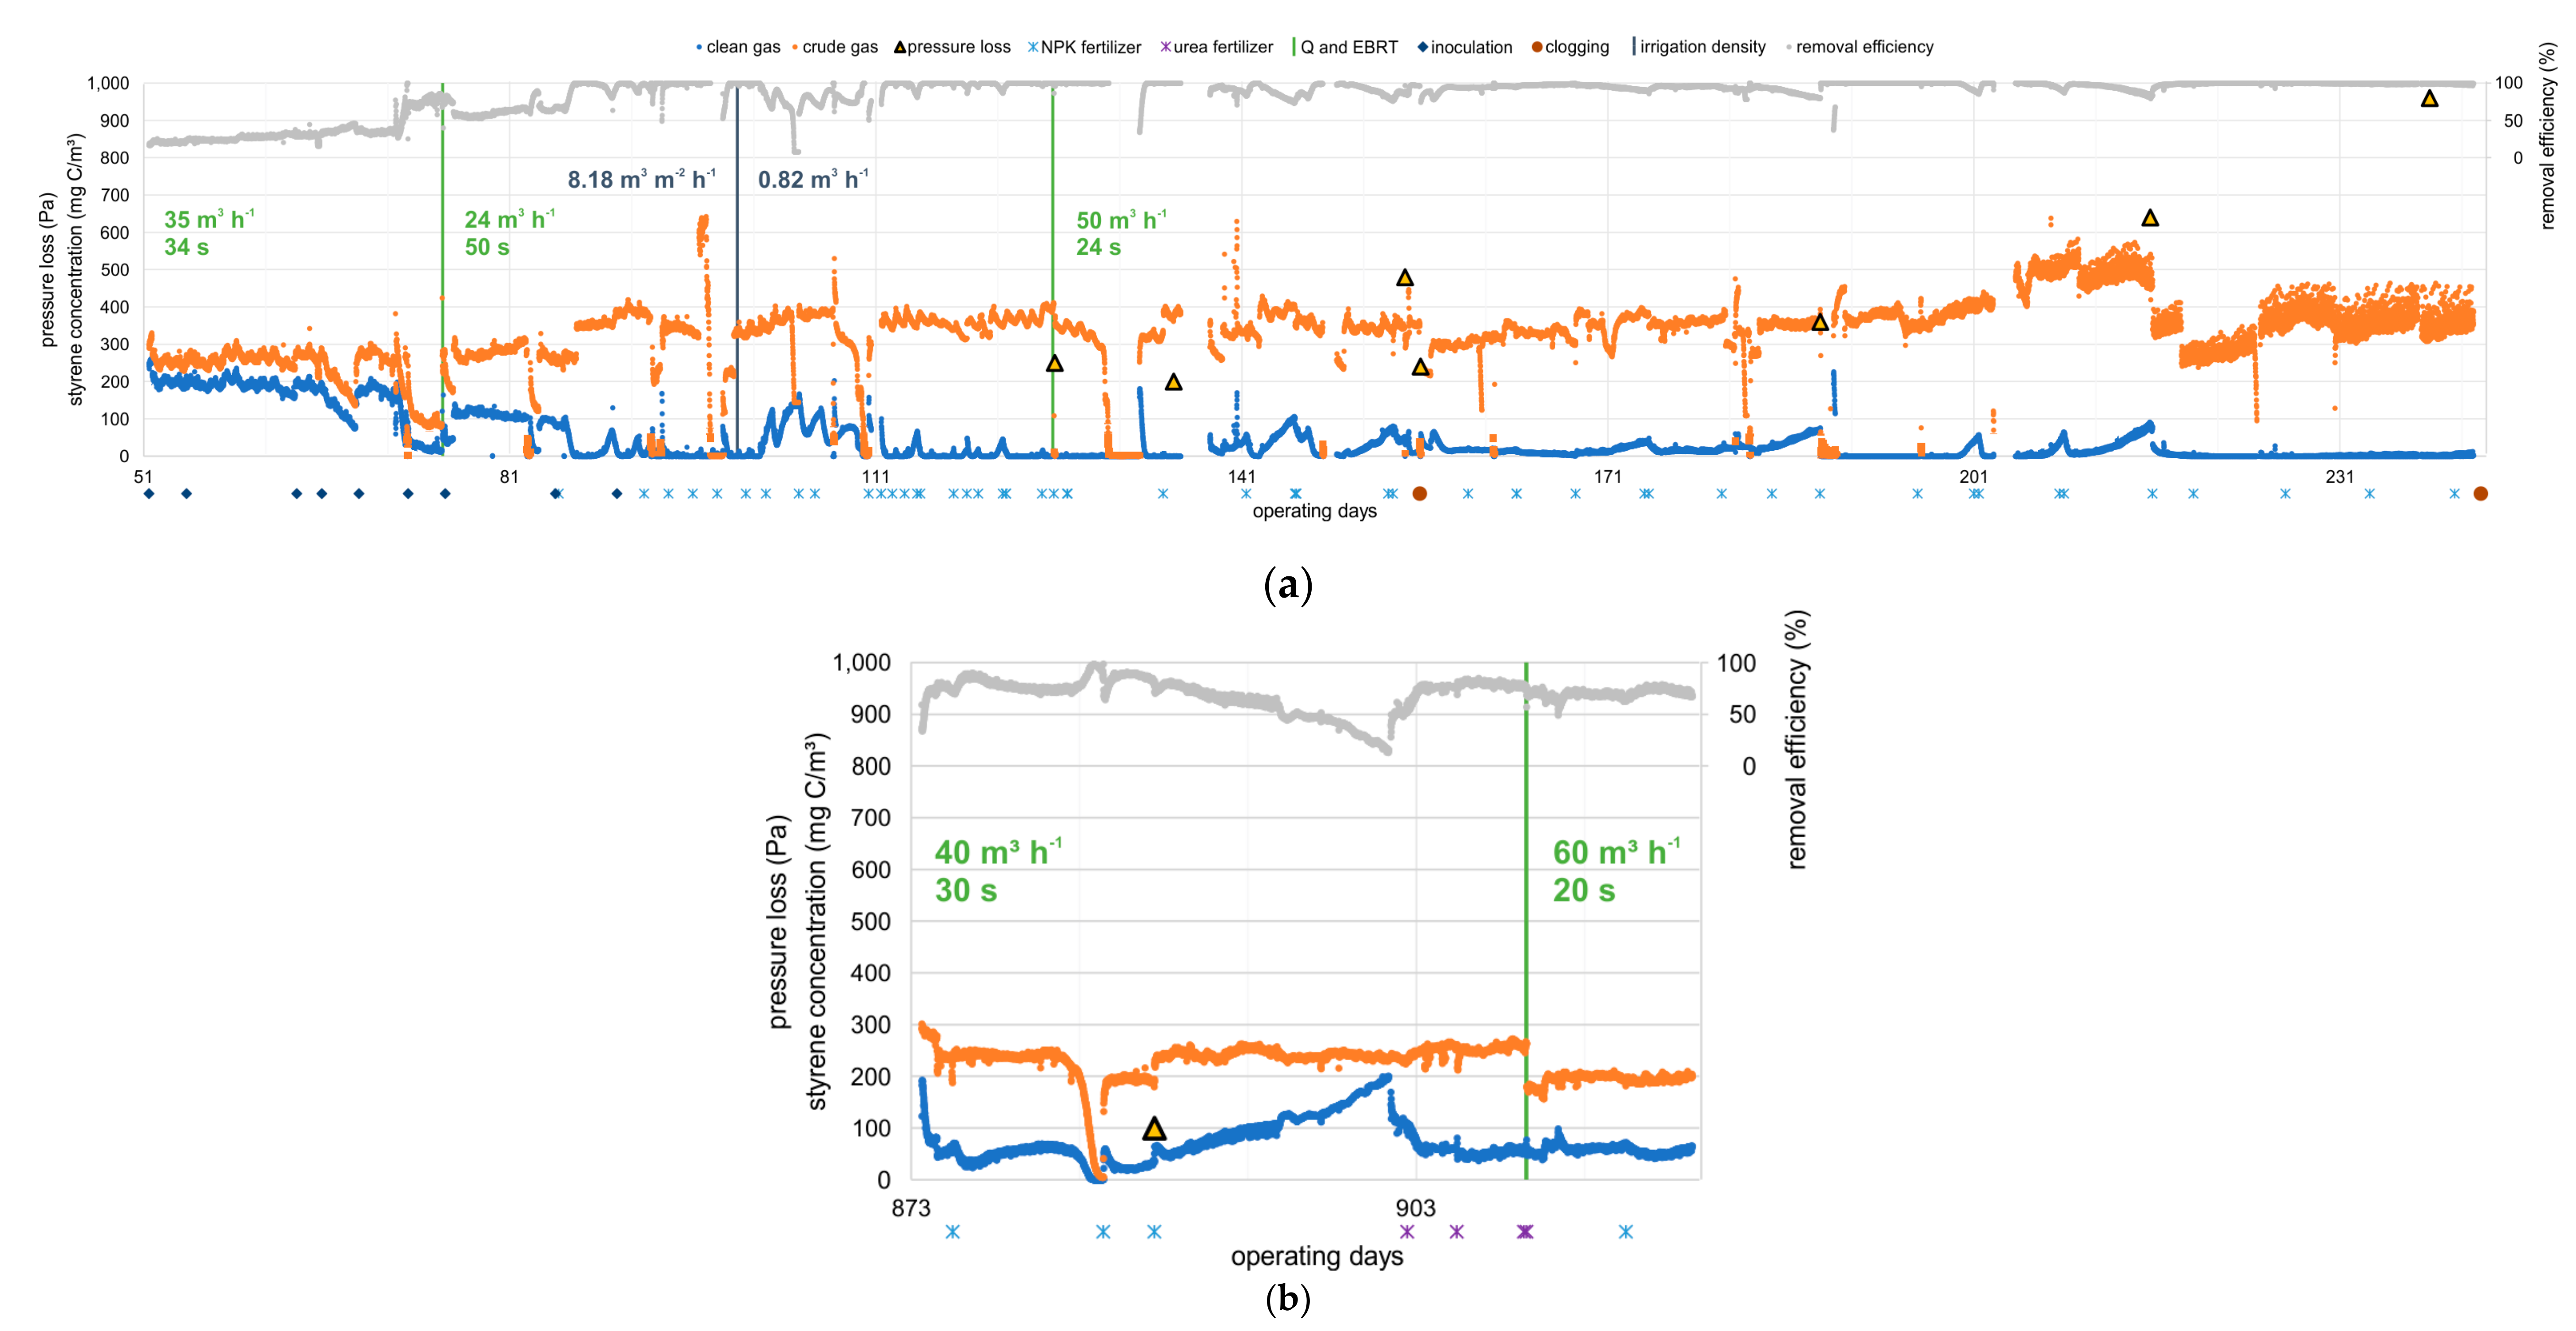
- At an inlet concentration of about 340–360 mg C m−3, equivalent to 370–390 mg m−3 of styrene, efficiencies of 96–98% at EBRT of 24–50 s and elimination rates of 25.9–50.1 g C m−3 h−1 and 28.1–54.3 g styrene m−3 h−1 were achieved, respectively. In comparison to the literature data shown in Table 1, the elimination efficiency in the present study is higher by a factor of 1.5–5.5 than results of other studies handling similar process conditions and the absence of solubilizers. Only Song et al. (2012) achieved a comparable elimination efficiency of 56.9 g m−3 h−1 at 250 mg m−3, an EBRT of 30 s, and RE of 87%.
- Variations in the irrigation density in the range of 0.153–1.02 m3 m−2 h−1, and thus differences in the thickness of the aqueous film covering the biofilm, showed no effect on the elimination efficiencies detected. Therefore, there was no limitation in the transport kinetics, but a limitation in the degradation kinetics.
- The limitation in the degradation kinetics is also illustrated by an increase in RE after the addition of nitrogenous fertilizers. As an example, RE increased from 65% to almost 100% at day 85 after fertilizer application. Furthermore, RE nearly doubled using fertilizers with ammonium as a nitrogen source compared to urea, since the transformation of urea to ammonia by urease is not necessary.
- Starvation periods due to weekend shutdowns were well tolerated by the system, and the efficiencies after start-up increased to almost total conversion within a few hours.
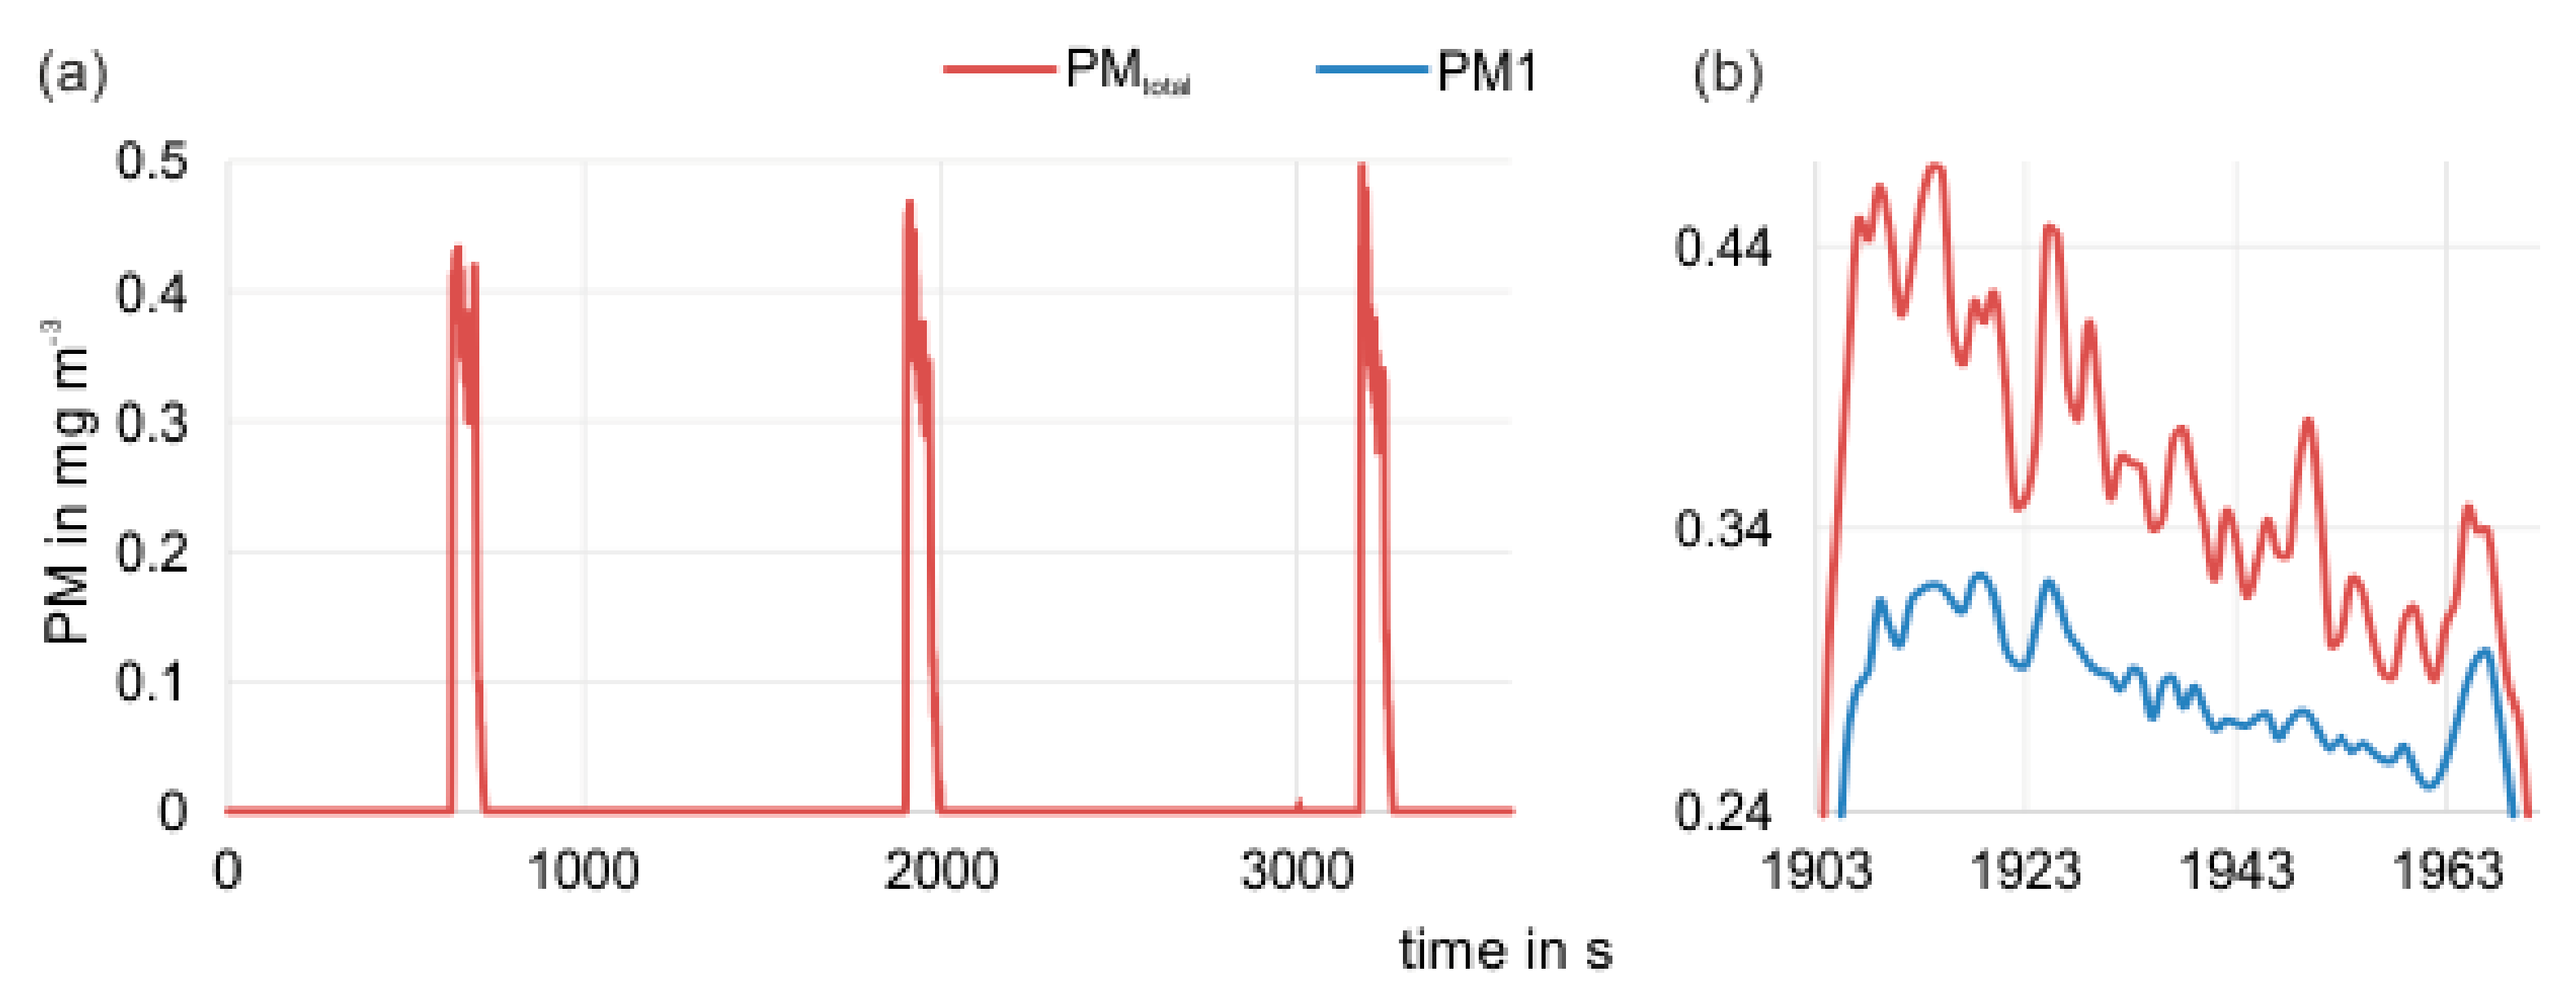
- During operation of the BTF, germ emissions occurred almost exclusively during the irrigation interval and a short after-run phase of approx. 35 s. As expected, the germ emissions increased with increasing gas flows.
- The germ emissions can be reduced energy-efficiently by 2–3 log units during irrigation intervals, or nearly completely during interim phases by using a suitably designed demister. The removal efficiency of the demister strongly depends on its maintenance condition. Automation in cleaning can be realized by periodical high-pressure flushing with water, or an exchange of the demister unit and ex-situ regeneration for organic polymer models. Demisters made out of stainless steel might be equipped with a heater to periodically burn off biomass and vaporize locked-in water.
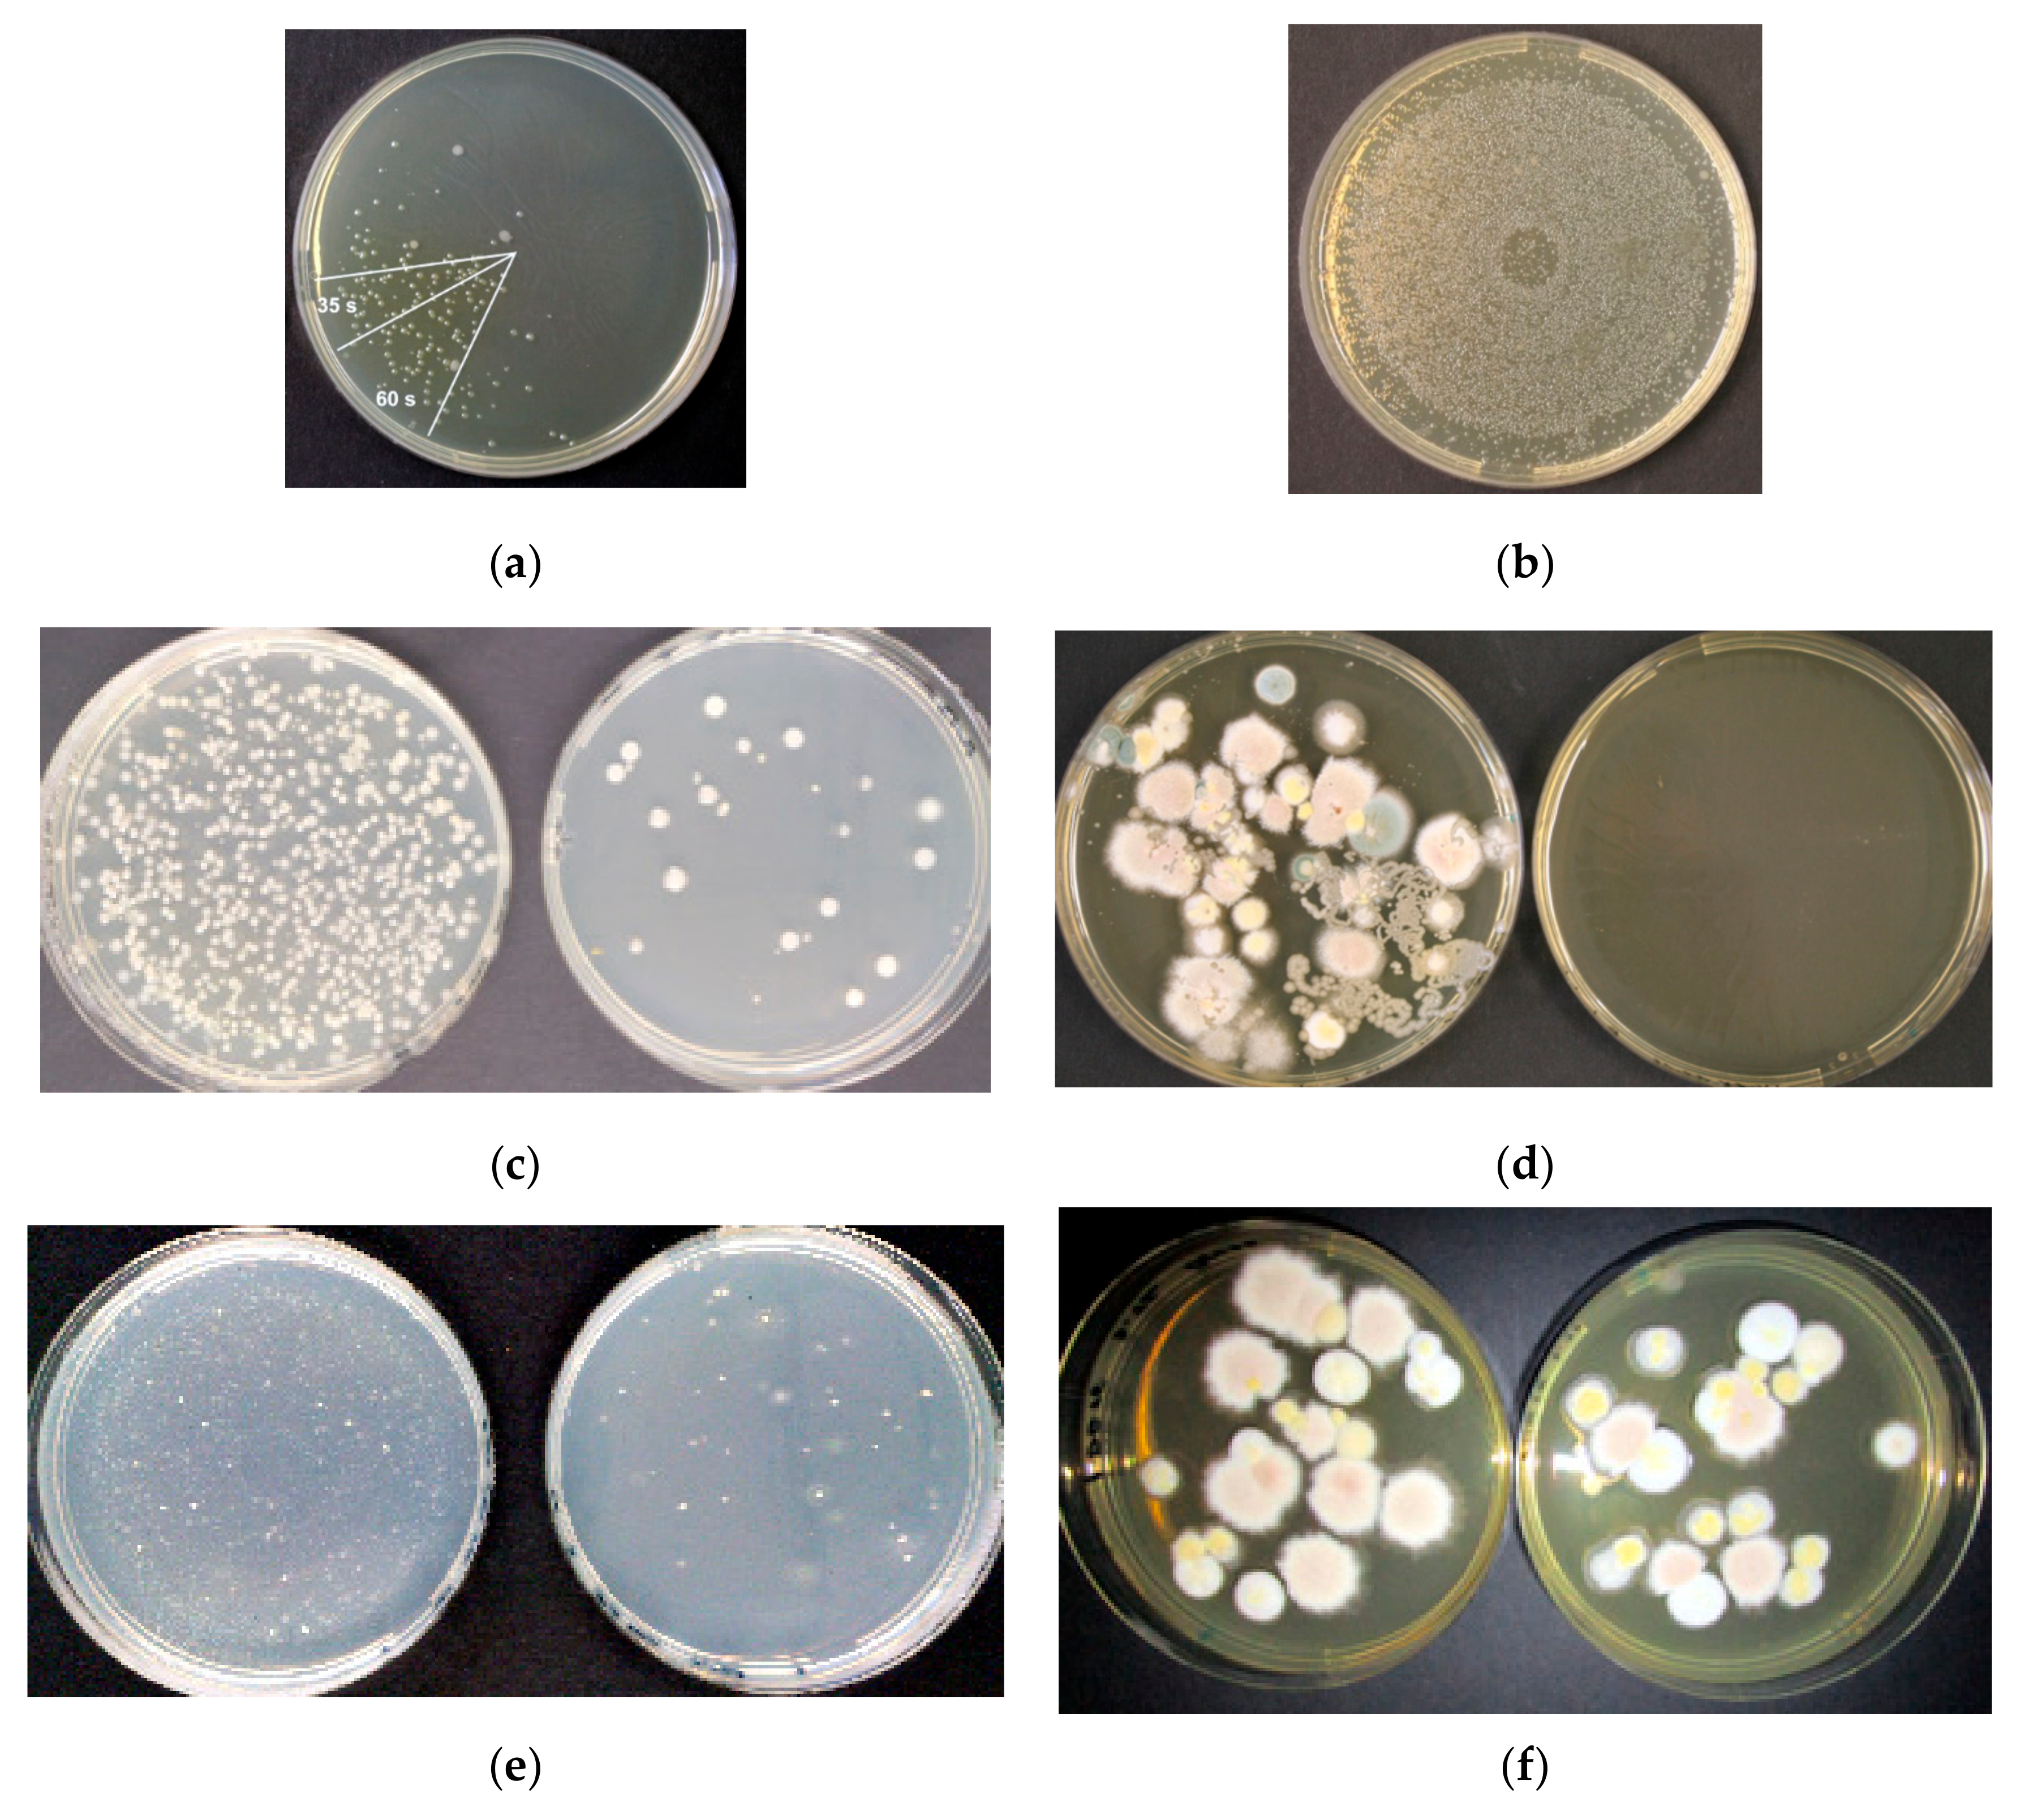
- As expected, the downstream NTP stage achieved a further reduction in germ emissions by 1–4 log units, depending on the SIE values of the test.
- Under comparable operating conditions, the sterilization efficiency in by-pass operation was about 0.9–1.5 log stages lower than at inline operation.
- Due to the high efficiency of the BTF stage it was not necessary to use the DBD for VOC abatement.
- At comparable conditions, the efficiency of the corona discharge was significantly lower than that of the DBD. For example, at an SIE value of 8 kWh 1000 m−3 total elimination of fungal emissions was observed in the DBD, while only 10% of the emissions were removed by corona discharge.
- Flow simulations showed optimization potentials for a significant improvement of the contact between waste gas and plasma discharge, whereby used SIE-values can be lowered considerably in the future.
- SIE can be further decreased by a clocked operation of the DBD set during irrigation and a limited after-run period. Hence, SIE values can be decreased by 90% at minimum in the present operational conditions of the BTF.
4. Conclusions
Author Contributions
Funding
Acknowledgments
Conflicts of Interest
References
- Rezaei, M.; Moussavi, G.; Naddafi, K.; Johnson, M.S. Enhanced biodegradation of styrene vapors in the biotrickling filter inoculated with biosurfactant-generating bacteria under H2O2 stimulation. Sci. Total Environ. 2020, 704, 135325. [Google Scholar] [CrossRef] [PubMed]
- German Federal Environmental Agency. Zusammenfassung des Technical Support. Document (TSD) zu: Styrol. 2003. Available online: https://www.umweltbundesamt.de/sites/default/files/medien/515/dokumente/styrol.pdf (accessed on 2 November 2020).
- OECD. SIAM 4 SIDS Initial Assessment Profile of Styrene (CAS 100-42-5). 1996. Available online: https://hpvchemicals.oecd.org/ui/handler.axd?id=17F54B62-0AED-473F-B210-B607AF65E8CF (accessed on 2 November 2020).
- HDIN Research. Styrene Monomer (SM) Production Capacity Reach to 36.7 Million Tons in 2018. Available online: https://www.hdinresearch.com/news/28 (accessed on 2 November 2020).
- Vyskocil, A.; Thuot, R.; Turcot, A.; Gérin, M.; Viau, C. Peak exposures to styrene in Quebec fibreglass reinforced plastic industry. Natl. Inst. Work. Life 2001, 10, 316–318. [Google Scholar]
- Webster, T.S.; Cox, H.H.J.; Deshusses, M.A. Resolving operational and performance problems encountered in the use of a pilot/full-scale biotrickling filter reactor. Environ. Prog. 1999, 18, 162–172. [Google Scholar] [CrossRef]
- Lackey, L.W.; Gamble, J.R.; Holt, M.T. Feasibility Testing of Biofiltration Technology for Remediating Air Contaminated by a Boat Manufacturing Facility. J. Air Waste Manag. Assoc. 1998, 48, 527–536. [Google Scholar] [CrossRef] [PubMed] [Green Version]
- Loy, J.; Flauger, M. Biological elimination of styrene contaminated waste gas with the Zander biotrickling technology. In Proceedings of the 89th Annual Meeting and Exhibition of Air and Waste Management Association, Nashville, TN, USA, 16–21 June 1996. [Google Scholar]
- Tischler, D. Microbial Styrene Degradation; Springer International Publishing: Cham, Switzerland, 2015; ISBN 978-3-319-24862-2. [Google Scholar]
- Mooney, A.; Ward, P.G.; O’Connor, K.E. Microbial degradation of styrene: Biochemistry, molecular genetics, and perspectives for biotechnological applications. Appl. Microbiol. Biotechnol. 2006, 72, 1. [Google Scholar] [CrossRef] [PubMed]
- Panke, S.; Witholt, B.; Schmid, A.; Wubbolts, M.G. Towards a Biocatalyst for (S)-Styrene Oxide Production: Characterization of the Styrene Degradation Pathway of Pseudomonas sp. Strain VLB120. Appl. Environ. Microbiol. 1998, 64, 2032–2043. [Google Scholar] [CrossRef] [Green Version]
- Oelschlägel, M.; Zimmerling, J.; Tischler, D. A Review: The Styrene Metabolizing Cascade of Side-Chain Oxygenation as Biotechnological Basis to Gain Various Valuable Compounds. Front. Microbiol. 2018, 9, 490. [Google Scholar] [CrossRef]
- Teufel, R.; Mascaraque, V.; Ismail, W.; Voss, M.; Perera, J.; Eisenreich, W.; Haehnel, W.; Fuchs, G. Bacterial phenylalanine and phenylacetate catabolic pathway revealed. Proc. Natl. Acad. Sci. USA 2010, 107, 14390–14395. [Google Scholar] [CrossRef] [Green Version]
- Fewson, C.A. Microbial metabolism of mandelate: A microcosm of diversity. FEMS Microbiol. Rev. 1988, 4, 85–110. [Google Scholar] [CrossRef]
- Jorio, H.; Bibeau, L.; Heitz, M. Biofiltration of Air Contaminated by Styrene: Effect of Nitrogen Supply, Gas Flow Rate, and Inlet Concentration. Environ. Sci. Technol. 2000, 34, 1764–1771. [Google Scholar] [CrossRef]
- San-Valero, P.; Álvarez-Hornos, J.; Ferrero, P.; Penya-Roja, J.M.; Marzal, P.; Gabaldón, C. Evaluation of Parallel-Series Configurations of Two-Phase Partitioning Biotrickling Filtration and Biotrickling Filtration for Treating Styrene Gas-Phase Emissions. Sustainability 2020, 12, 6740. [Google Scholar] [CrossRef]
- Song, T.; Yang, C.; Zeng, G.; Yu, G.; Xu, C. Effect of surfactant on styrene removal from waste gas streams in biotrickling filters. J. Chem. Technol. Biotechnol. 2012, 87, 785–790. [Google Scholar] [CrossRef]
- San-Valero, P.; Gabaldón, C.; Penya-Roja, J.M.; Quijano, G. Enhanced styrene removal in a two-phase partitioning bioreactor operated as a biotrickling filter: Towards full-scale applications. Chem. Eng. J. 2017, 309, 588–595. [Google Scholar] [CrossRef] [Green Version]
- Zamir, S.M.; Babatabar, S.; Shojaosadati, S.A. Styrene vapor biodegradation in single- and two-liquid phase biotrickling filters using Ralstonia eutropha. Chem. Eng. J. 2015, 268, 21–27. [Google Scholar] [CrossRef]
- Clothiaux, E.J.; Koropchak, J.A.; Moore, R.R. Decomposition of an organophosphorus material in a silent electrical discharge. Plasma Chem. Plasma Process. 1984, 4, 15–20. [Google Scholar] [CrossRef]
- Fraser, M.E.; Sheinson, R.S. Electric discharge-induced oxidation of hydrogen cyanide. Plasma Chem. Plasma Process. 1986, 6, 27–38. [Google Scholar] [CrossRef]
- Dobslaw, D.; Schulz, A.; Helbich, S.; Dobslaw, C.; Engesser, K.-H. VOC removal and odor abatement by a low-cost plasma enhanced biotrickling filter process. J. Environ. Chem. Eng. 2017, 5, 5501–5511. [Google Scholar] [CrossRef]
- Dobslaw, D.; Ortlinghaus, O.; Dobslaw, C. A combined process of non-thermal plasma and a low-cost mineral adsorber for VOC removal and odor abatement in emissions of organic waste treatment plants. J. Environ. Chem. Eng. 2018, 6, 2281–2289. [Google Scholar] [CrossRef]
- Fang, H.J.; Hou, H.Q.; Xia, L.Y.; Shu, X.H.; Zhang, R.X. A combined plasma photolysis (CPP) method for removal of CS2 from gas streams at atmospheric pressure. Chemosphere 2007, 69, 1734–1739. [Google Scholar] [CrossRef] [PubMed]
- Morgan, N.N. Atmospheric pressure dielectric barrier discharge chemical and biological applications. Int. J. Phys. Sci. 2009, 4, 885–892. [Google Scholar]
- Schiavon, M.; Schiorlin, M.; Torretta, V.; Brandenburg, R.; Ragazzi, M. Non-thermal plasma assisting the biofiltration of volatile organic compounds. J. Clean. Prod. 2017, 148, 498–508. [Google Scholar] [CrossRef]
- Mizuno, A. Industrial applications of atmospheric non-thermal plasma in environmental remediation. Plasma Phys. Control. Fusion 2007, 49, A1–A15. [Google Scholar] [CrossRef]
- Müller, S.; Zahn, R.-J. Air Pollution Control by Non-Thermal Plasma. Contrib. Plasma Phys. 2007, 47, 520–529. [Google Scholar] [CrossRef]
- Preis, S.; Klauson, D.; Gregor, A. Potential of electric discharge plasma methods in abatement of volatile organic compounds originating from the food industry. J. Environ. Manag. 2013, 114, 125–138. [Google Scholar] [CrossRef]
- Liang, Y.; Wu, Y.; Sun, K.; Chen, Q.; Shen, F.; Zhang, J.; Yao, M.; Zhu, T.; Fang, J. Rapid inactivation of biological species in the air using atmospheric pressure nonthermal plasma. Environ. Sci. Technol. 2012, 46, 3360–3368. [Google Scholar] [CrossRef]
- Korachi, M.; Turan, Z.; Şentürk, K.; Şahin, F.; Aslan, N. An investigation into the biocidal effect of high voltage AC/DC atmospheric corona discharges on bacteria, yeasts, fungi and algae. J. Electrost. 2009, 67, 678–685. [Google Scholar] [CrossRef]
- Moreau, M.; Orange, N.; Feuilloley, M.G.J. Non-thermal plasma technologies: New tools for bio-decontamination. Biotechnol. Adv. 2008, 26, 610–617. [Google Scholar] [CrossRef]
- Subrahmanyam, C.; Magureanu, M.; Renken, A.; Kiwi-Minsker, L. Catalytic abatement of volatile organic compounds assisted by non-thermal plasma. Appl. Catal. B Environ. 2006, 65, 150–156. [Google Scholar] [CrossRef] [Green Version]
- Heller, L.C.; Edelblute, C.M.; Mattson, A.M.; Hao, X.; Kolb, J.F. Inactivation of bacterial opportunistic skin pathogens by nonthermal DC-operated afterglow atmospheric plasma. Lett. Appl. Microbiol. 2012, 54, 126–132. [Google Scholar] [CrossRef] [Green Version]
- Steinberg, I.; Rohde, C.; Bockreis, A.; Jager, J. Increase of the purification efficiency of biofilters by the use of a complementary ionisation step. Waste Manag. 2005, 25, 375–381. [Google Scholar] [CrossRef] [PubMed]
- Rafflenbeul, R. Nichtthermische Plasmaanlagen (NTP) zur Luftreinhaltung in der Abfallwirtschaft. Müll und Abfall 1998. [Google Scholar] [CrossRef]
- Schiavon, M.; Scapinello, M.; Tosi, P.; Ragazzi, M.; Torretta, V.; Rada, E.C. Potential of non-thermal plasmas for helping the biodegradation of volatile organic compounds (VOCs) released by waste management plants. J. Clean. Prod. 2015, 104, 211–219. [Google Scholar] [CrossRef]
- Wei, Z.S.; Li, H.Q.; He, J.C.; Ye, Q.H.; Huang, Q.R.; Luo, Y.W. Removal of dimethyl sulfide by the combination of non-thermal plasma and biological process. Bioresour. Technol. 2013, 146, 451–456. [Google Scholar] [CrossRef] [Green Version]
- Jiang, L.; Li, H.; Chen, J.; Zhang, D.; Cao, S.; Ye, J. Combination of non-thermal plasma and biotrickling filter for chlorobenzene removal. J. Chem. Technol. Biotechnol. 2016, 91, 3079–3087. [Google Scholar] [CrossRef]
- Jiang, L.; Li, S.; Cheng, Z.; Chen, J.; Nie, G. Treatment of 1,2-dichloroethane and n -hexane in a combined system of non-thermal plasma catalysis reactor coupled with a biotrickling filter. J. Chem. Technol. Biotechnol. 2018, 93, 127–137. [Google Scholar] [CrossRef]
- Karatum, O.; Deshusses, M.A. A comparative study of dilute VOCs treatment in a non-thermal plasma reactor. Chem. Eng. J. 2016, 294, 308–315. [Google Scholar] [CrossRef]
- Kim, H.; Han, B.; Hong, W.; Ryu, J.; Kim, Y. A New Combination System Using Biotrickling Filtration and Nonthermal Plasma for the Treatment of Volatile Organic Compounds. Environ. Eng. Sci. 2009, 26, 1289–1297. [Google Scholar] [CrossRef]
- Jiang, L.; Zhu, R.; Mao, Y.; Chen, J.; Zhang, L. Conversion characteristics and production evaluation of styrene/o-xylene mixtures removed by DBD pretreatment. Int. J. Environ. Res. Public Health 2015, 12, 1334–1350. [Google Scholar] [CrossRef] [Green Version]
- Zhu, R.; Mao, Y.; Jiang, L.; Chen, J. Performance of chlorobenzene removal in a nonthermal plasma catalysis reactor and evaluation of its byproducts. Chem. Eng. J. 2015, 279, 463–471. [Google Scholar] [CrossRef]
- Mäule, J.; Reiser, M.; Kranert, M. Neue Techniken zur Abgasreinigung in der Abfallwirtschaft durch Nichtthermische Plasmatechnologie: Verfahrenskombination aus Biofilter und NTP-Technologie. Abschlussbericht zum DBU-Forschungsvorhaben 17988; No. 17988; Universität Stuttgart: Stuttgart, Germany, 2005. [Google Scholar]
- Hołub, M.; Brandenburg, R.; Grosch, H.; Weinmann, S.; Hansel, B. Plasma Supported Odour Removal from Waste Air in Water Treatment Plants: An Industrial Case Study. Aerosol Air Qual. Res. 2014, 14, 697–707. [Google Scholar] [CrossRef] [Green Version]
- Gąszczak, A.; Bartelmus, G.; Burghardt, A.; Rotkegel, A.; Sarzyński, R. Experiments and modelling of a biotrickling filter (BTF) for removal of styrene from airstreams. J. Chem. Technol. Biotechnol. 2018, 93, 2659–2670. [Google Scholar] [CrossRef]
- San-Valero, P.; Dorado, A.D.; Martínez-Soria, V.; Gabaldón, C. Biotrickling filter modeling for styrene abatement. Part 1: Model development, calibration and validation on an industrial scale. Chemosphere 2018, 191, 1066–1074. [Google Scholar] [CrossRef]
- Runye, Z.; Christian, K.; Zhuowei, C.; Lichao, L.; Jianming, Y.; Jianmeng, C. Styrene removal in a biotrickling filter and a combined UV–biotrickling filter: Steady- and transient-state performance and microbial analysis. Chem. Eng. J. 2015, 275, 168–178. [Google Scholar] [CrossRef]
- Sun, Z.; Yang, B.; Wang, L.; Ding, C.; Li, Z. Toluene-styrene secondary acclimation improved the styrene removal ability of biotrickling filter. Chem. Speciat. Bioavailab. 2017, 29, 54–59. [Google Scholar] [CrossRef] [Green Version]
- Chuang, F.-J.; Chou, M.-S.; Chang, H.-Y. Biotrickling filtration of airborne styrene: A comparison of filtration media. J. Air Waste Manag. Assoc. 2018, 68, 369–376. [Google Scholar] [CrossRef]
- Álvarez-Hornos, F.J.; Martínez-Soria, V.; Marzal, P.; Izquierdo, M.; Gabaldón, C. Performance and feasibility of biotrickling filtration in the control of styrene industrial air emissions. Int. Biodeterior. Biodegrad. 2017, 119, 329–335. [Google Scholar] [CrossRef] [Green Version]
- Rene, E.R.; Veiga, M.C.; Kennes, C. Biodegradation of gas-phase styrene using the fungus Sporothrix variecibatus: Impact of pollutant load and transient operation. Chemosphere 2010, 79, 221–227. [Google Scholar] [CrossRef] [Green Version]
- Bak, A.; Kozik, V.; Dybal, P.; Sulowicz, S.; Kasperczyk, D.; Kus, S.; Barbusinski, K. Abatement robustness of volatile organic compounds using compact trickle-bed bioreactor: Biotreatment of styrene, ethanol and dimethyl sulfide mixture in contaminated airstream. Int. Biodeterior. Biodegrad. 2017, 119, 316–328. [Google Scholar] [CrossRef]
- Rene, E.R.; Montes, M.; Veiga, M.C.; Kennes, C. Styrene removal from polluted air in one and two-liquid phase biotrickling filter: Steady and transient-state performance and pressure drop control. Bioresour. Technol. 2011, 102, 6791–6800. [Google Scholar] [CrossRef] [PubMed] [Green Version]
- Sempere, F.; Martínez-Soria, V.; Palau, J.; Penya-Roja, J.-M.; San-Valero, P.; Gabaldón, C. Effects of nitrogen source and empty bed residence time on the removal of styrene gaseous emissions by biotrickling filtration. Bioprocess. Biosyst. Eng. 2011, 34, 859–867. [Google Scholar] [CrossRef] [PubMed]
- Kim, D.; Cai, Z.; Sorial, G.A. Evaluation of trickle-bed air biofilter performance under periodic stressed operating conditions as a function of styrene loading. J. Air Waste Manag. Assoc. 2005, 55, 200–209. [Google Scholar] [CrossRef] [Green Version]
- Kraakman, N.; van Groenestijn, J.W.; Koers, B.; Heslinga, D.C. Mededelingen Faculteit Lanbouwkundige en Toegepaste Biologische Wetenschapper. Univ. Gent Belg. 1997, 62, 1535–1541. [Google Scholar]
- Cox, H.H.J.; Magielsen, F.J.; Doddema, H.J.; Harder, W. Influence of the water content and water activity on styrene degradation by Exophiala jeanselmei in biofilters. Appl. Microbiol. Biotechnol. 1996, 45, 851–856. [Google Scholar] [CrossRef]
- Arnold, M.; Reittu, A.; Wright, A. von; Martikainen, P.J.; Suihko, M.L. Bacterial degradation of styrene in waste gases using a peat filter. Appl. Microbiol. Biotechnol. 1997, 48, 738–744. [Google Scholar] [CrossRef]
- Hartmans, S.; Tramper, J.; Bont, J.d. Biological waste air treatment. In Proceedings of the 5th European Congress on Biotechnology; Muncksgaard International Publisher: Kopenhagen, Denmark; 1990. [Google Scholar]
- Windsperger, A.; Buchner, R.; Stefan, K. k.A. Reinigung lösemittelhaltiger Abluft mit Biofiltern—Teil 1: Laboruntersuchungen und Ergebnisse aus verschiedenen Industriezweigen. Staub-Reinhalt. Der Luft 1990, 50, 465–470. [Google Scholar]
- Togna, A.P.; Folsom, B.R. Removal of styrene from air using bench-scale biofiler and biotrickling filter reactors. In Proceedings of the 85th Annual Meeting of Air and Waste Management Association, Kansas City, MO, USA, 21–26 June 1992. [Google Scholar]
- Fortschritte in der Biofiltertechnologie. Vortrag und Poster Anlässlich des Internationalen Kongresses “Geruchsstoffemissionen-Probleme und Lösungsmöglichkeiten”, Ljubiljana, Slowenien; Sabo, F., Pelic-Sabo, M., Wurmthaler, J., Mössinger, M., Eds.; VDI Verlag: Düsseldorf, Germany, 1993. [Google Scholar]
- Cox, H.H.J.; Moerman, R.E.; van Baalen, S.; van Heiningen, W.N.M.; Doddema, H.J.; Harder, W. Performance of a styrene-degrading biofilter containing the yeast Exophiala jeanselmei. Biotechnol. Bioeng. 1997, 53, 259–266. [Google Scholar] [CrossRef]
- Woiski, C.; Dobslaw, D.; Engesser, K.-H. Isolation and characterization of 2-butoxyethanol degrading bacterial strains. Biodegradation 2020, 31, 153–169. [Google Scholar] [CrossRef] [PubMed]
- Kommission Reinhaltung der Luft im VDI und DIN—Normenausschuss KRdL. Messen von Partikeln—Staubmessung in Strömenden Gasen. Gravimetrische Bestimmung der Staubbeladung; Beuth Verlag GmbH: Berlin, Germany, 2006. [Google Scholar]
- DeMore, W.B.; Patapoff, M. Comparison of ozone determinations by ultraviolet photometry and gas-phase titration. Environ. Sci. Technol. 1976, 10, 897–899. [Google Scholar] [CrossRef]
- Araya, P.; Chamy, R.; Mota, M.; Alves, M. Biodegradability and toxicity of styrene in the anaerobic digestion process. Biotechnol. Lett. 2000, 22, 1477–1481. [Google Scholar] [CrossRef] [Green Version]
- Grbić-Galić, D.; Churchman-Eisel, N.; Mraković, I. Microbial transformation of styrene by anaerobic consortia. J. Appl. Bacteriol. 1990, 69, 247–260. [Google Scholar] [CrossRef]
- Dobslaw, D.; Woiski, C.; Winkler, F.; Engesser, K.-H.; Dobslaw, C. Prevention of clogging in a polyurethane foam packed biotrickling filter treating emissions of 2-butoxyethanol. J. Clean. Prod. 2018, 200, 609–621. [Google Scholar] [CrossRef]
- Wojtowicz, J.A. Ozone. In Kirk-Othmer Encyclopedia of Chemical Technology; Othmer, K., Ed.; John Wiley & Sons, Inc.: Hoboken, NJ, USA, 2000; ISBN 9780471238966. [Google Scholar]


| Bioreactor | Cin | EBRT | RE | EC | Reference |
|---|---|---|---|---|---|
| BTF | 0.2–1.0 g∙m−3 | 41–62 | 78–94 | 26.1–70.7 | [47] |
| BTF | 55–312 mg C∙m−3 | 15–30 | ≈ 90 | 7.0–31.7C | [48] |
| BTF | 2–4 g∙m−3 | 30–70 | 27.2–61.8 | 63.6–130.6 | [49] |
| BTF without silicon oil BTF with silicon oil BTF without silicon oil | 55–323 mg C∙m−3 | 15 | 18–64 | 8.3–32.3C | [18] |
| 15 | 57–89 | 11.6–43.9C | |||
| 30 | 87–97 | 19.4–21.6C | |||
| BTF | 195–2112 mg∙m−3 | 28–113 | 72.3–100 | 26.8–48.6 | [50] |
| BTF | 161–2390 mg∙m−3 | 21 | 83–98.7 | 170–300 | [51] |
| BTF | 107 mg∙m−3 | 31 | 93 | 11.6 | [52] |
| BTF without silicon oil BTF with silicon oil | 330 mg C∙m−3 | 20 | 69–79 | 38–42C | [16] |
| 64–68 | 35–41C | ||||
| BTF with solubilizer | 120–760 ppm | 60 | 72–100 | 30.7–139 | [1] |
| BTF without H2O2 BTF with H2O2 | 260 ppm 263 ppm | 15 | 11 | 28 | [1] |
| 15 | 94 | 250 | |||
| BTF without X-100 BTF with X-100 | 250 mg∙m−3 | 7.5–30 | 50–87 82–96 | 56.8–100.9 62.7–165.4 | [17] |
| BTF | 0.13–14 g∙m−3 | 20–91 | 50–90 | 83–336 | [53] |
| BTF without silicon oil BTF with silicon oil | 0.8–3.3 g∙m−3 | 60 | 28–100 68–100 | 29–70 29–110 | [19] |
| BTF | 0.24–1.99 g∙m−3 | 40–135 | 9.4–100 | 36.8–85 | [54] |
| BTF without silicon oil | 1.7–8.0 g∙m−3 | 20–91 | 24–100 | 0–172.8 | [55] |
| BTF with silicon oil | 0.8–23.8 g∙m−3 | 41–100 | 0–670 | ||
| BTF with urea | 167–2000 mg C∙m−3 | 60 | 88.3 | 57.6C | [56] |
| BTF with nitrate | 56.8 | 37.5C | |||
| BTF with nitrate | 50–330 ppm | 45–121 | 57–100 | 9.80–24.5 | [57] |
| BF with ammonia | 840–920 mg∙m−3 | 63.6 | 95.6–98.6 | 52.4–58.2 | [15] |
| BF with ammonia | 840–920 mg∙m−3 | 42.4 | 80.5–89.9 | 91.2–103.5 | |
| BF with ammonia | 920–1020 mg∙m−3 | 21.2 | 88.9–62.3 | 73.6–116.2 | |
| BF with nitrate | 500–3390 mg∙m−3 | 127 | 65.1–100 | 14.5–50.4 | |
| BF | 0.1–0.9 g∙m−3 | 9–18 | 90 | 22–27 | [58] |
| BF | 678 mg∙m−3 | 30 | 96–98 | 79 | [59] |
| BF | 50–1200 mg∙m−3 | 58–108 | 20–98 | 3–30 | [60] |
| BF | 100–600 mg∙m−3 | 27–108 | - | ≤50 | [61] |
| BF | 700–3600 mg∙m−3 | 22–100 | 50–100 | 10–120 | [62] |
| BF | 55–550 mg∙m−3 | 30 | 95–100 | 6.6–63 | [63] |
| BF | 45 mg∙m−3 | 10 | >80 | 12.8–16 | [64] |
| BF | 0.1–2.4 g∙m−3 | 25–93 | 9.4–100 | 17.3–76 | [65] |
| Cin | EBRT | RE | EC | Bioreactor/N-Source | Reference |
|---|---|---|---|---|---|
| 361 | 50 | 98 | 25.9 | BTF/NPK | this study |
| 344 | 24 | 96 | 50.1 | BTF/NPK | this study |
| 252 | 30 | 78 | 23.8 | BTF/urea | this study |
| 195 | 20 | 70 | 24.7 | BTF/urea and subsequent NPK | this study |
| Q1 | Q2 | SIE | EBRT | O3 Output | Pre DBD I-2 | Post DBD I-3 | η |
|---|---|---|---|---|---|---|---|
| bacteria | |||||||
| 50 | 23.5 | 5.9 | 0.46 | 74 | 6209 ± 452 | 723 ± 48 | 88.34 |
| 60 | 23.5 | 8.4 | 0.40 | 166 | 7986 ± 481 | 254 ± 26 | 96.82 |
| 50 | 23.5 | 10.4 | 0.46 | 184 | 6180 ± 546 | 123 ± 12 | 98.01 |
| 50 | 23.5 | 20.7 | 0.46 | 443 | 6125 ± 431 | 0 * | 100 |
| fungi | |||||||
| 50 | 23.5 | 10.4 | 0.46 | 184 | 3801 ± 242 | 81 ± 13 | 97.86 |
| 50 | 23.5 | 20.7 | 0.46 | 443 | 3626 ± 255 | 0 * | 100 |
| Q1 | Q2 | SIE | Pre DBD I-2 | Post DBD I-3 | η |
|---|---|---|---|---|---|
| bacteria | |||||
| 40 | 8.9 | 8.18 | 4383 ± 458 | 1027 ± 24 | 76.57 |
| 50 | 8.9 | 6.79 | 6357 ± 482 | 2578 ± 61 | 59.44 |
| 60 | 8.9 | 5.81 | 8188 ± 490 | 4610 ± 73 | 43.70 |
| 40 | 11.4 | 7.78 | 4616 ± 483 | 1159 ± 20 | 74.89 |
| 60 | 11.4 | 5.60 | 8071 ± 533 | 4308 ± 81 | 46.62 |
| fungi | |||||
| 50 | 8.9 | 6.79 | 4975 ± 290 | 1915 ± 47 | 61.50 |
| Treatment | Advantages | Disadvantages |
|---|---|---|
| Biotrickling filter | Low operational costs Durability of package material Ease of process control (pH, salinity, nutrients, absorbed VOC) Compact construction Easy elimination of microbial intermediates | Potential accumulation of extended biomass (Clogging) Lack of adsorptive effects to increase the bioavailability of waste gas compounds More complex structure (compared to biofilter) Temporary generation of elutriation water Germ emissions Remaining contamination of waste gas with VOCs, odor and germs |
| Non-thermal plasma (NTP) | High efficiency in germ reduction and odor abatement Partial/total oxidation of VOCs Short start-up/shut-down times Low pressure loss Intermittent operation possible | High energy demand Sensitivity against dust and high moisture Limited operational stability |
| Combined process | Low operational costs Ease of process control Compact construction Effective elimination of VOCs, odor and germ emissions Re-use of processed air On-demand use of NTP, hence high energy efficiency | More complex structure Increased energy demand |
Publisher’s Note: MDPI stays neutral with regard to jurisdictional claims in published maps and institutional affiliations. |
© 2020 by the authors. Licensee MDPI, Basel, Switzerland. This article is an open access article distributed under the terms and conditions of the Creative Commons Attribution (CC BY) license (http://creativecommons.org/licenses/by/4.0/).
Share and Cite
Helbich, S.; Dobslaw, D.; Schulz, A.; Engesser, K.-H. Styrene and Bioaerosol Removal from Waste Air with a Combined Biotrickling Filter and DBD–Plasma System. Sustainability 2020, 12, 9240. https://0-doi-org.brum.beds.ac.uk/10.3390/su12219240
Helbich S, Dobslaw D, Schulz A, Engesser K-H. Styrene and Bioaerosol Removal from Waste Air with a Combined Biotrickling Filter and DBD–Plasma System. Sustainability. 2020; 12(21):9240. https://0-doi-org.brum.beds.ac.uk/10.3390/su12219240
Chicago/Turabian StyleHelbich, Steffen, Daniel Dobslaw, Andreas Schulz, and Karl-Heinrich Engesser. 2020. "Styrene and Bioaerosol Removal from Waste Air with a Combined Biotrickling Filter and DBD–Plasma System" Sustainability 12, no. 21: 9240. https://0-doi-org.brum.beds.ac.uk/10.3390/su12219240