Article

How (Un)sustainable Environments Are Related to the Diffusion of COVID-19: The Relation between Coronavirus Disease 2019, Air Pollution, Wind Resource and Energy

CNR—National Research Council of Italy, Research Institute on Sustainable Economic Growth, Collegio Carlo Alberto, Via Real Collegio, 30-10024 Moncalieri (Torino), Italy
Sustainability 2020, 12(22), 9709; https://0-doi-org.brum.beds.ac.uk/10.3390/su12229709
Submission received: 6 October 2020 / Revised: 15 November 2020 / Accepted: 17 November 2020 / Published: 20 November 2020
(This article belongs to the Collection Sustainable Integrated Clean Environment for Human & Nature)

Abstract

:
The pandemic caused by novel coronavirus disease 2019 (COVID-19) is generating a high number of cases and deaths, with negative effects on public health and economic systems. One of the current questions in the contemporary environmental and sustainability debate is how high air pollution and reduced use of renewable energy can affect the diffusion of COVID-19. This study endeavors to explain the relation between days of air pollution, wind resources and energy, and the diffusion of COVID-19 to provide insights into sustainable policy to prevent future epidemics. The statistical analysis here focuses on a case study of Italy, one of the first countries to experience a rapid increase in confirmed cases and deaths. The results reveal two main findings: (1) cities with high wind speed and high wind energy production have a lower number of cases of COVID-19 in the context of a more sustainable environment; (2) cities located in hinterland zones with high air pollution, low wind speed and less wind energy production have a greater number of cases and total deaths. The results presented here suggest that the pandemic caused by novel coronavirus (SARS-CoV-2) and future epidemics similar to COVID-19 cannot be solved only with research in medicine but the solution also needs advanced capabilities and technologies for supporting sustainable development based on the reduction of air pollution and increase of production in renewable energy to improve air quality and as a consequence public health.

1. Introduction and Related Works

Within environmental and sustainability science, new and relatively unexplored topics are continually emerging, such as factors determining the diffusion of novel coronavirus disease 2019 (COVID-19), which generates a severe respiratory disorder and is causing the deaths of many individuals worldwide [1,2,3]. Manifold studies suggest a possible relation between unsustainable environments with high air pollution and the spread of COVID-19 [3,4,5]. In particular, populations living in regions with high levels of air pollution have a high probability of developing respiratory disorders because of the likely negative effects of particulate matter commingled with infective agents, such as SARS-CoV-2 [3,6,7,8,9]. In fact, scholars state that a high level of air pollution can increase the viral infectivity and lethality of the COVID-19 [10]. In addition, atmosphere with low wind prevents the dispersion of air pollutants, which seem to be one of the determinants of higher incidence of COVID-19 in some European regions, such as North Italy [11]. The study by van Doremalen et al. [12] revealed that in China, viral agents of SARS-CoV-2 may be suspended in the air for several minutes and this finding can explain higher number of cases and deaths related to COVID-19 in manifold countries, such as the USA, India, Brazil, Mexico, etc. [13]. In general, several studies present the hypothesis that atmospheric pollution associated with certain climatological factors (such as, high humidity and low wind speed) may support a longer permanence of viral particles in the air, fostering the rapid spread of COVID-19 within polluted regions [5,11,12,14,15]. In this context, Martorell-Marugán et al. [16] suggest new tools for supporting increased data analysis and statistical capabilities that allow users to explore trends and associations between critical environmental data and the spread of COVID-19 in society. In particular, Megahed and Ghoneim [17] argue that the COVID-19 pandemic has transformed the built environment because of the fear of infection; as a result, appropriate architecture and urbanism can reduce potential risks or stop the spread of infectious diseases by designing a healthy and sustainable built environment. In addition, Rainisch et al. [18] show that a lockdown strategy or combination of non-pharmaceutical interventions may reduce air pollution and negative effects on public health, lowering the demand for hospitalization and intensive care units. In other words, these scholars argue that strong containment and mitigation policies can improve air quality and mitigate the substantial morbidity and mortality caused by the COVID-19 pandemic [18].
In order to extend previous studies on critical aspects of the transmission dynamics of SARS-CoV-2 [3,4,5], the goal of this paper is to analyze the relation between cases, air pollution and unsustainable environments with low renewable wind energy production (and high air pollution) that can explain some vital relationships determining the spread of COVID-19 and negative effects on public health. This study has the potential to support long-term policies directed towards fostering sustainability by maintaining and sustaining environmental quality both at national and at global level through biological, eco-friendly methods and the dissemination of knowledge on various topics and technologies relating to renewable energy systems (such as wind energy technology) in order to reduce environmental pollution and biodegradation and foster bioremediation, which could be one of the strategies for preventing future epidemics similar to COVID-19. In fact, Ferrannini et al. [19] point out that industrial policy should facilitate sustainable structural change in modern economies towards human and social development by investing in renewable resources and by designing innovation policies directed to environmental benefits in the period post COVID-19 pandemic crisis.

2. Research Questions, Research Setting and Study Design

The research questions of this study are as follows:
What is the relation between cases of COVID-19, air pollution and unsustainable environments with low renewable wind energy production?
What is the impact of this relationship on the spread of COVID-19 and on public health?
In the context of these problems in environmental and sustainable sciences, this study focuses on a case study of Italy, one of the first countries to accumulate a high number of deaths from COVID-19. The sample is constituted by fifty-five cities that are provincial capitals in Italy (N = 55). Epidemiological data of COVID-19 are from Ministero della Salute [20]; data of air pollution are from Regional Agencies for Environmental Protection [21]; climatological information are from meteorological stations of the Italian provinces under study [22]. Data of the density of population are from the Italian National Institute of Statistics [23], and finally, data concerning the production of wind energy per Italian region are from an Italian transmission operator named Terna [24,25].
The measures for statistical analyses are as follows:
-
Air pollution. Total days exceeding the limits set for PM10 or for ozone in 2018 per Italian provincial capital. Days of air pollution are a major factor that affects the environment and public health [3,21]. Moreover, by using 2018 as the baseline year for air pollution data, we separate out the effects of COVID-19. Experimental results reveal that PM2.5 and PM10 have a strong correlation in atmospheric pollution [26,27].
-
Spread of COVID-19. Number of confirmed cases in March–April 2020 (during the first wave of this pandemic).
-
Climatological information. Average wind speed in km/h in February–March 2020.
-
Interpersonal contact. Population density of cities (individual/km2) in 2019.
-
Sustainable environment. Production of renewable wind energy with power in MegaWatt (MW) of overall wind farms in Italian regions in January 2020.
Descriptive statistics of measures just mentioned are performed by categorizing Italian provincial capitals into groups, as follows.
Renewable wind energy production is used to categorize:
-
cities with high wind energy production (seven regions in Italy have 94% of national production of wind energy);
-
cities with low wind energy production (regions that have 6% of national production of wind energy, a proxy for a less sustainable environment).
-
Days of air pollution is used to categorize:
-
Cities with high number of days of air pollution (>100 days per year exceeding the limits set for PM10 or for ozone);
-
Cities with low number of days of air pollution (≤100 days per year exceeding the limits set for PM10 or for ozone).
Correlation and regression analyses verify the relationships between the variables under study. In particular, regression analysis considers the number of cases across Italian provincial capitals (dependent variable y) as a linear function of the explanatory variable x of total days exceeding the limits set for PM10 (i.e., air pollution).
The specification of linear relationship is a log-log model:
logyt = α + β log xt−1 + u
α = constant; β = coefficient of regression; u = error term.
An alternative model (1) applies as explanatory variable the density of population per km2, considering the categorization of cities according to the days of air pollution and their location in regions with high or low intensity of wind energy production. The ordinary least squares (OLS) method is applied for estimating the unknown parameters of linear models (1). Statistical analyses are performed with the Statistics Software SPSS® version 26.

3. Results

The main results of the analysis are:
-
Regions with a high intensity of wind-based renewable energy and low air pollution experience lower spread of COVID-19 within society;
-
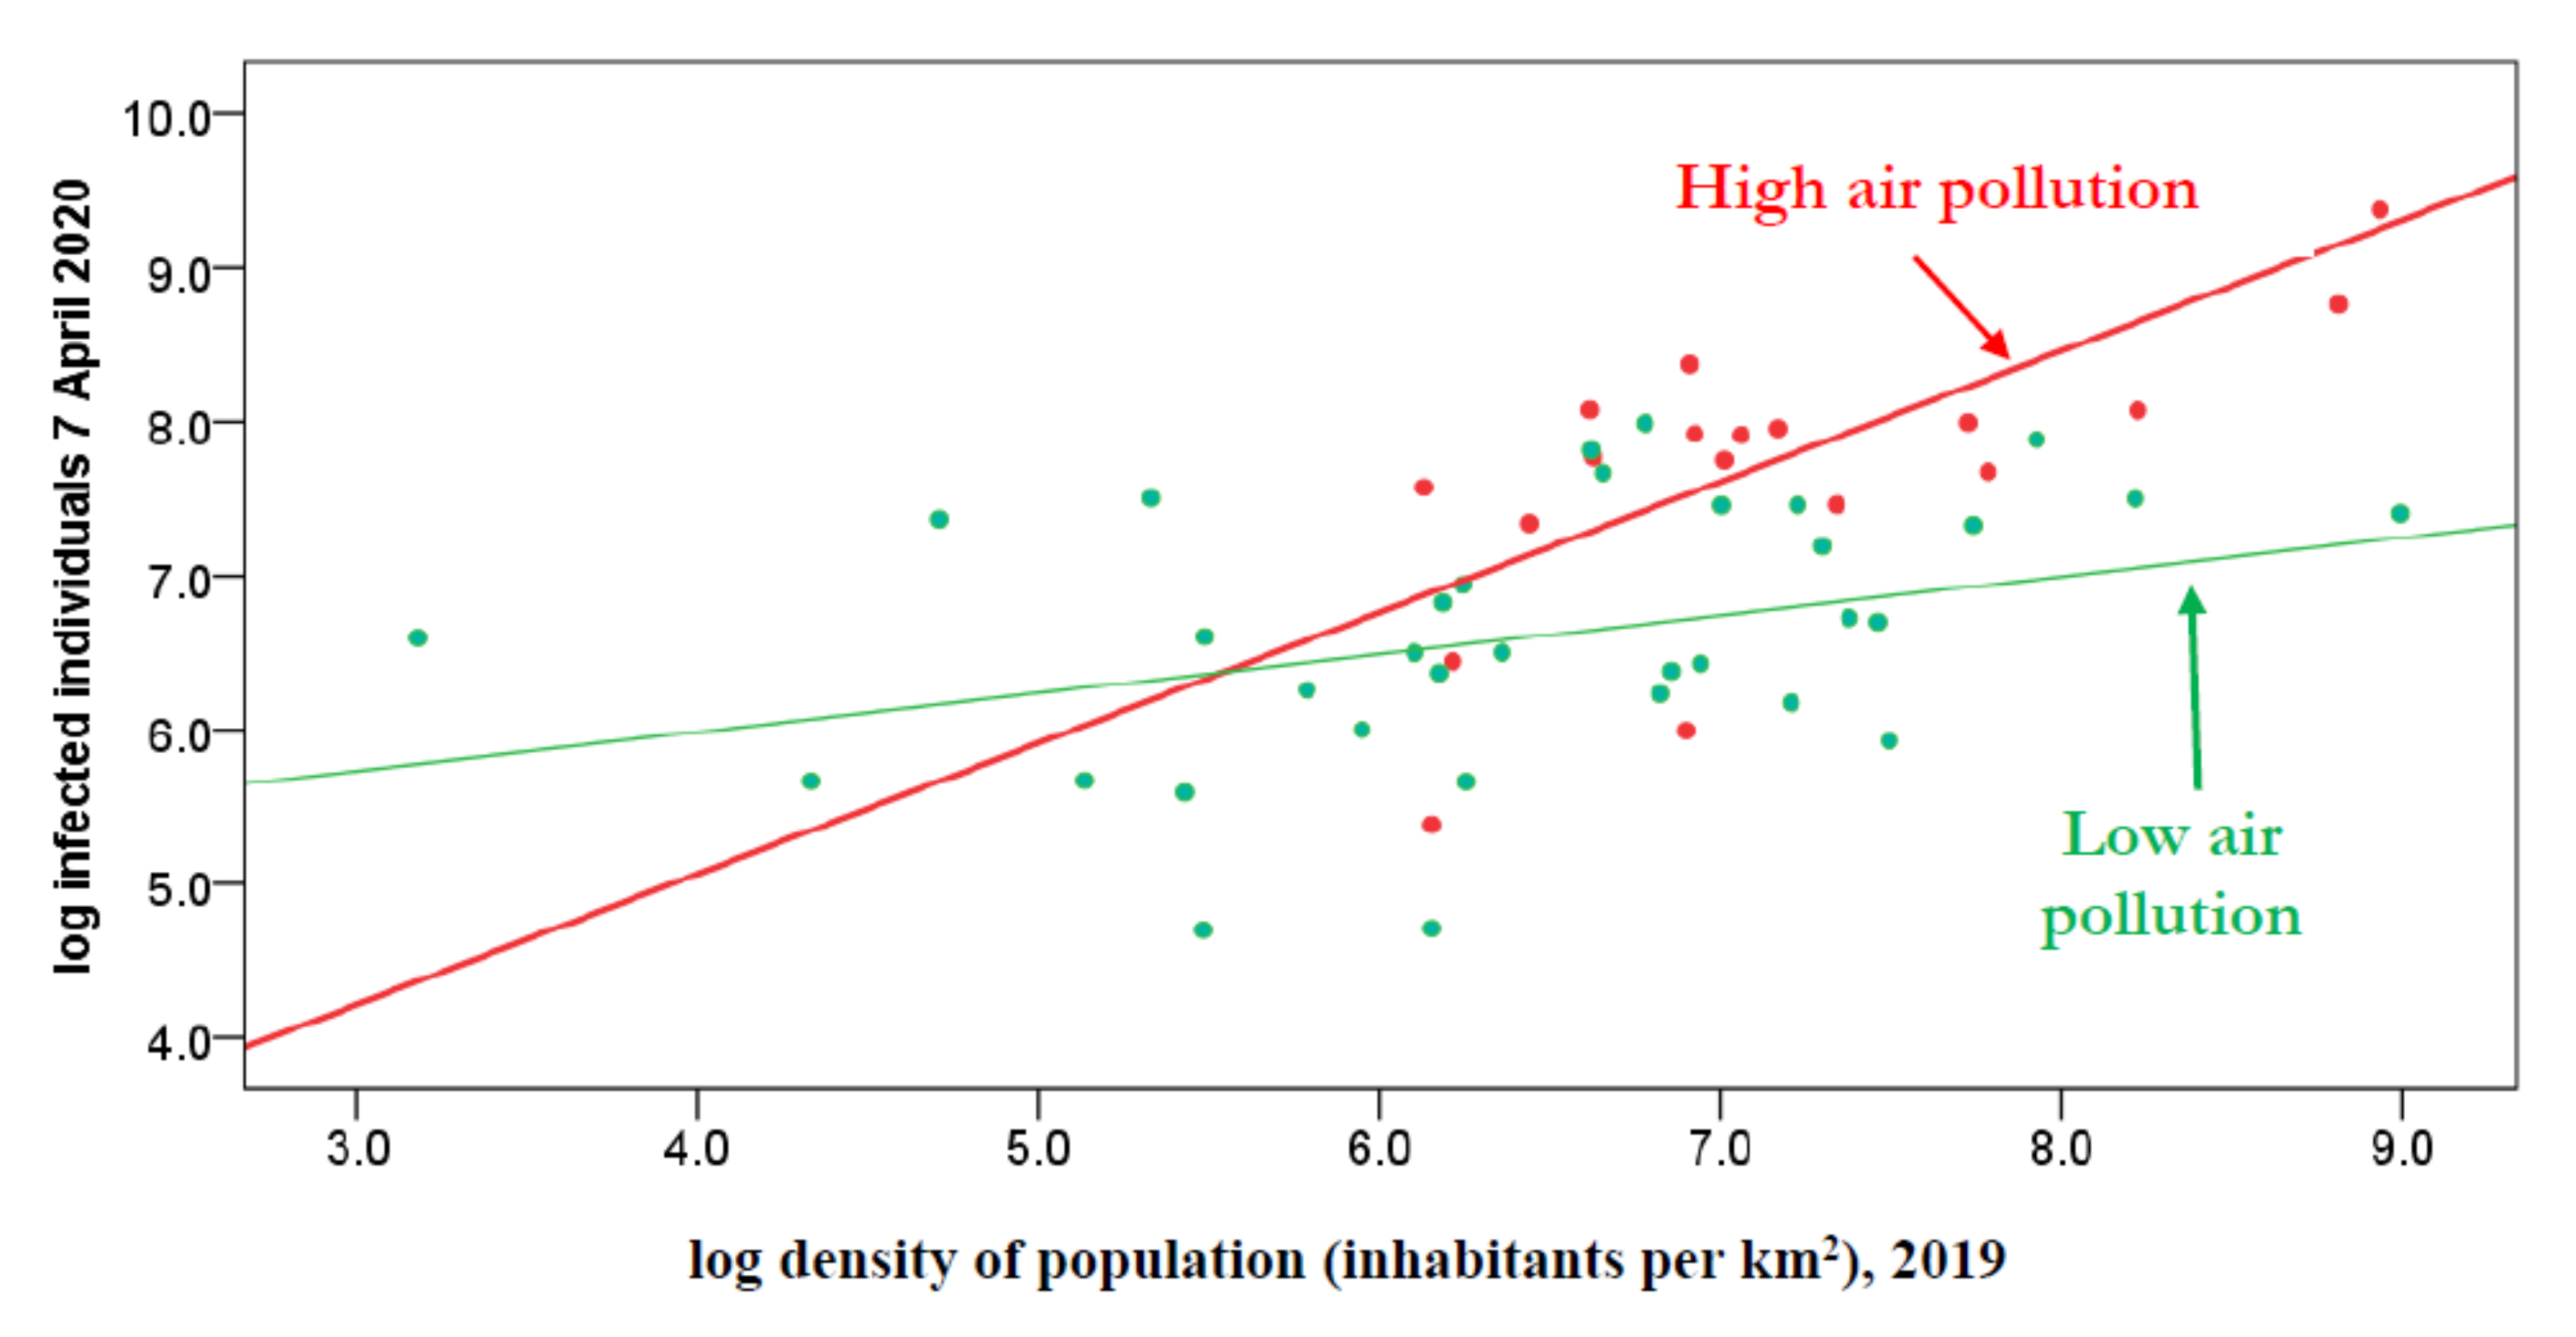
Cities with high air pollution and low production of wind energy have a very high number of cases in environments with high average density of population and low average speed of wind;
-
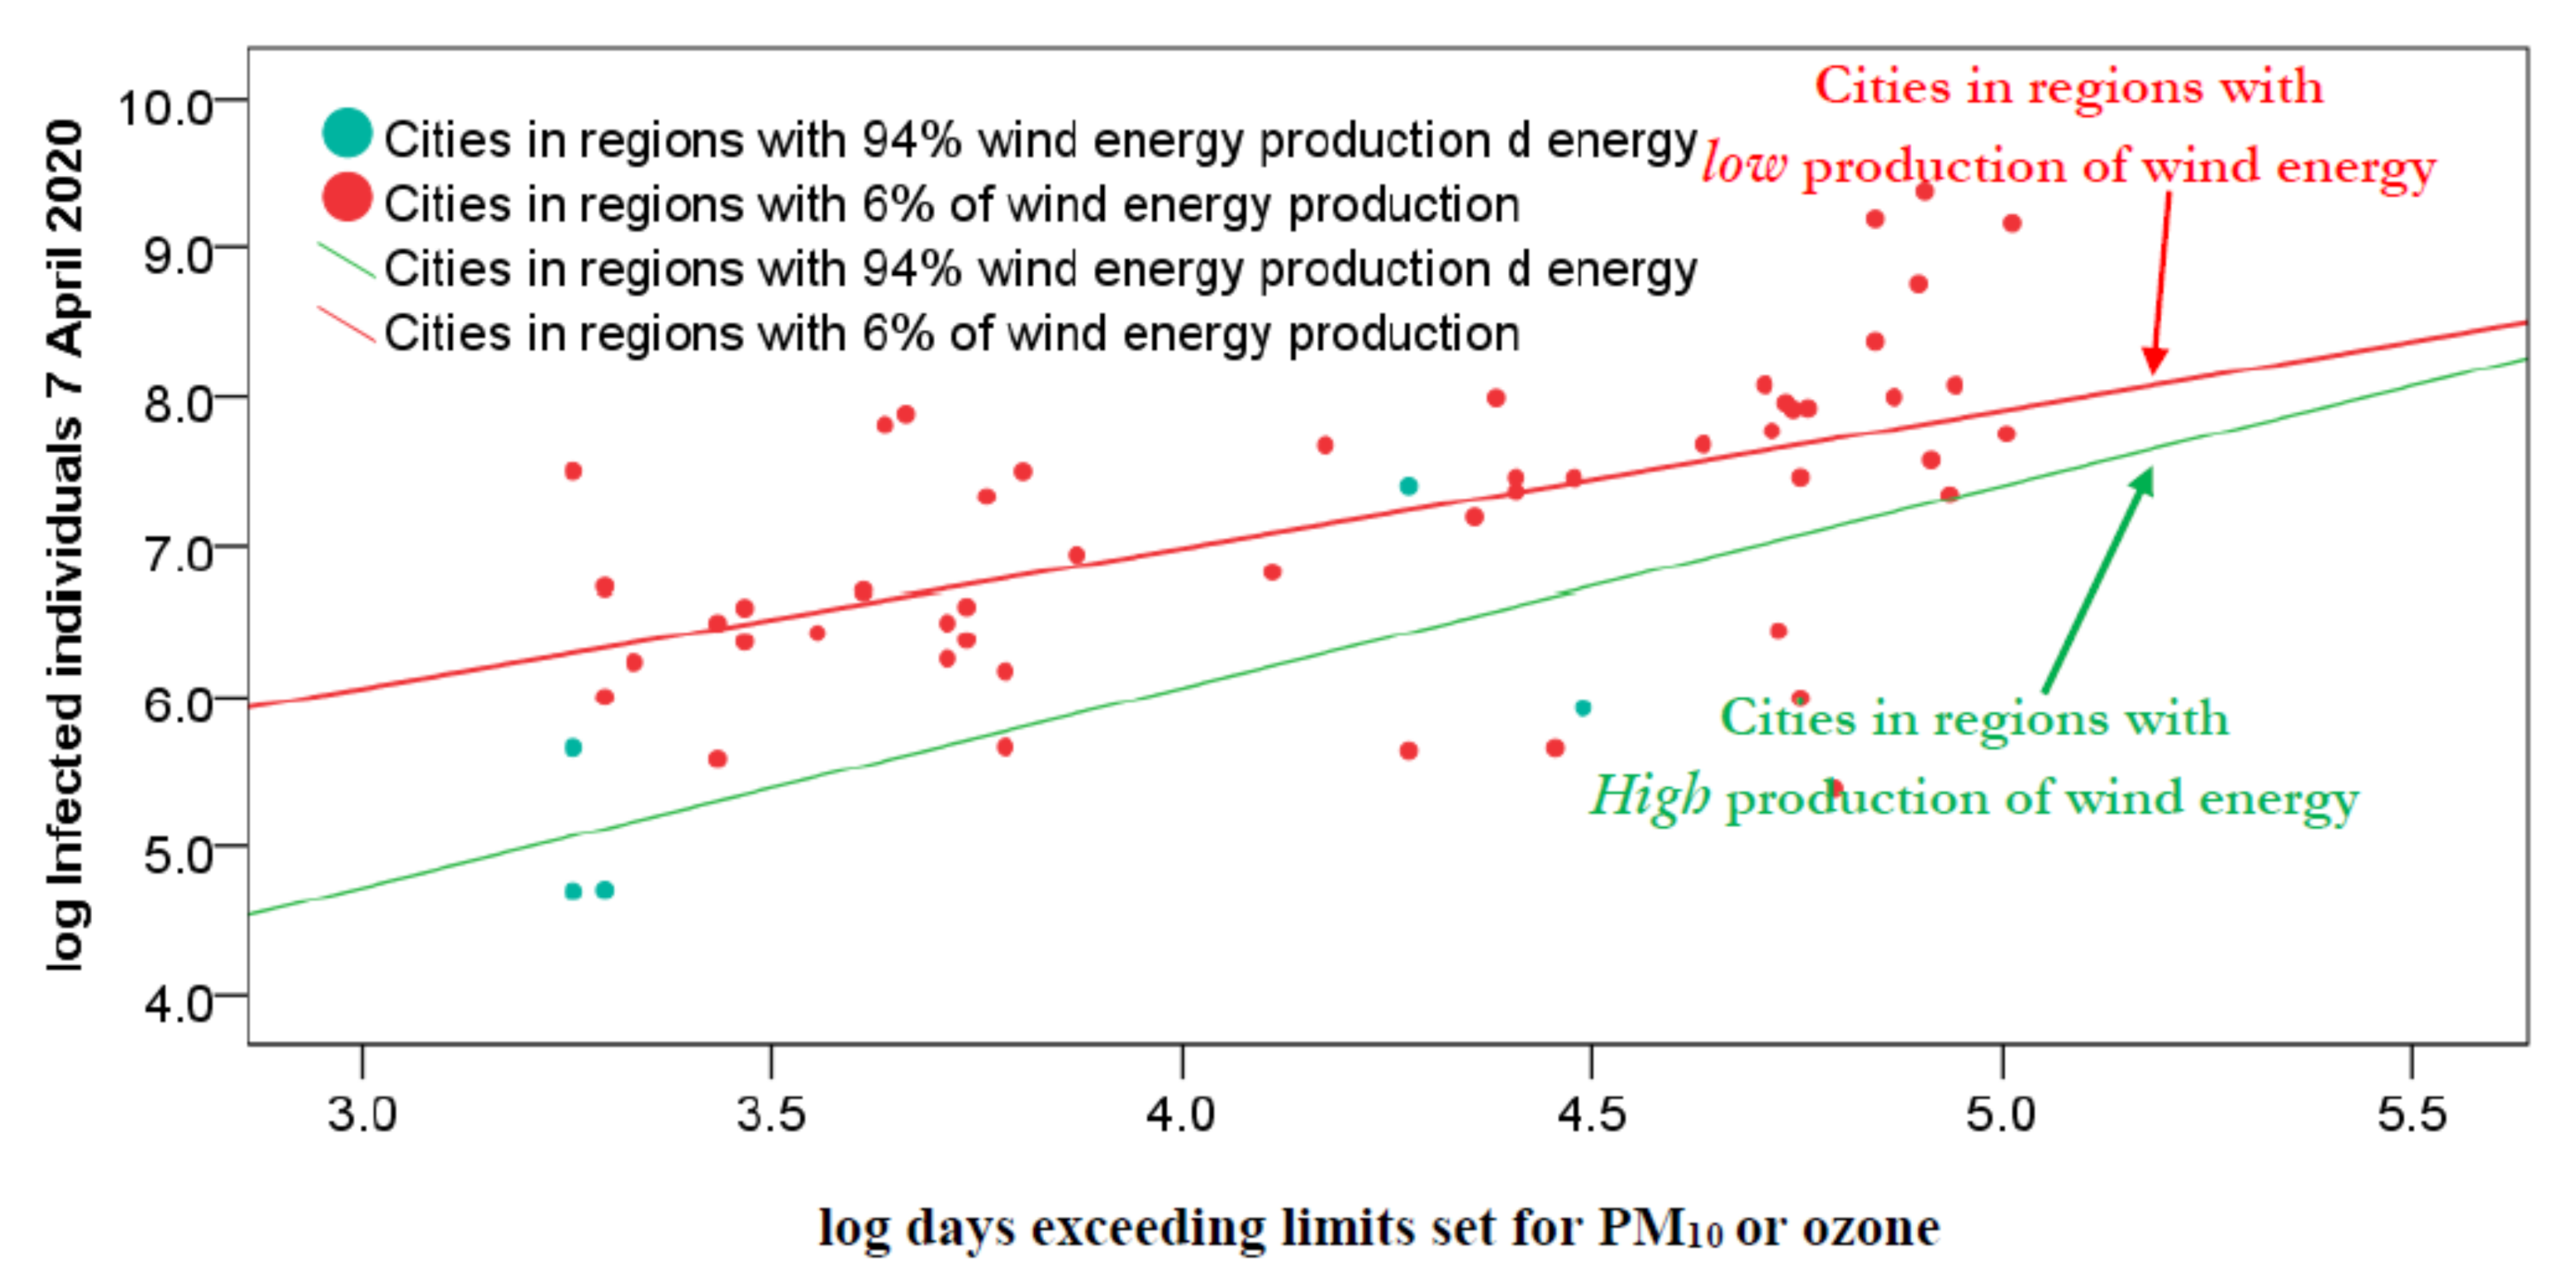
Cities in regions with lower levels of wind energy production demonstrate a high positive correlation between days of air pollution and cases of COVID-19;
-
In cities with little days of air pollution, an increase of 1% in the density of population, it increases the expected number of cases by around 0.25%, whereas in cities with many days of air pollution, an increase of 1% in the density of population, it increases the expected number of cases by around 0.85%;
-
The percentage of cases and total deaths weighted with population of Italian regions reveals that around 74.50% of cases and around 81% of deaths caused by COVID-19 in Italy occur in regions with many days of air pollution and with low production of renewable energy based on wind resources.
In particular, the findings of the statistical analyses are described in the following tables and figures. First of all, the wind energy production in Italy per region is shown in Table 1.
Table 1 shows that seven regions in Italy, mainly Southern regions (Molise, Puglia, Calabria, Basilicata, Campania, Sicilia and Sardegna), constitute 94% of the total wind energy production. These regions have at least 1 GigaWatt (GW) of power, with the Puglia region (South-East Italy) having the highest value of 2.5 GW. In particular, Italy had in January 2020 around 5645 wind farms, with almost 7000 wind turbines of various power sizes: above 10 MW (MegaWatt) of power, there were 313 plants for a total power of 9.07 GW. The most relevant power class ranges from 20 to 200 kW (kiloWatt), with 3956 systems having a total power of approximately 234 MW. As mentioned, the Puglia region generates the largest share of wind power in Italy—24.8% of the total, with 92 factories generating over 10 MW of power.
Table 2 shows that regions in Northern Italy mainly produce energy from thermal power stations using fossil fuels, liquefied natural gas coal and crude oil (average value is 48.33%).
The results in Table 3 suggest that cities in regions with high production of wind energy (94% of total) have a very low number of cases of COVID-19 (in March and April 2020, first wave of COVID-19), whereas cities located in regions with a low intensity of wind energy production (6% of total), within an unsustainable environment (in terms of low production of wind energy and many days of air pollution), have a very high number of cases. In fact, Table 3 also shows that cities in regions with low production of wind energy (6% of total) have higher number of days of air pollution than cities with a high production of wind energy (around 79 polluted days vs. 48 polluted days exceeding PM10 or ozone per year). This preliminary result suggests that regions with a high intensity of wind-based renewable energy and low air pollution also experience a lower spread of COVID-19 within society.
In order to confirm this result, Table 4 focuses on air pollution of cities: in particular, cities with high number of days of air pollution (greater than 100 days exceeding limits set for PM10 or ozone per year) and low production of wind energy accumulated a very high number of cases in March and April 2020, in environments with high average density of population and low average speed of wind (atmospheric stability) [11,14,28].
Table 5 shows results of variables under study considering cities with the same density of population: Italian provincial capitals with high average density of people per km2 (i.e., >1000 inhabitant/km2, mostly those bordering large urban conurbations, such as the cities of Brescia, Bergamo and Cremona, close to Milan, the second most populous city in Italy after Rome Capital) had higher numbers of COVID-19 cases. These cities, located in hinterland zones, have also high number of days of air pollution and low average wind speed (and, as a consequence, low production of renewable energy based on wind resources).
Table 6 shows that cities in regions with less than 6% wind energy production demonstrated a high positive correlation between days of air pollution and cases of COVID-19 on 17th March (r = 0.69, p-value < 0.01), 7th April (r = 0.55, p-value < 0.01) and 27th April 2020 (r = 0.36, p-value < 0.01). Instead, in regions with a high intensity of wind energy production, the results are not significant.

4. Discussion of a Likely Relation between Unsustainable Environments and the Spread of COVID-19

This study analyzed data on COVID-19 cases alongside factors associated with an unsustainable environment given by the level of atmospheric pollution and the production of renewable wind energy. Results suggest that environments with high air pollution and low production of renewable wind energy may have accelerated the spread of COVID-19 in Northern Italian cities, leading to a higher number of cases and deaths. In particular, cities with little wind and frequently high numbers of days of air pollution—exceeding safe levels of ozone or particulate matter—had higher numbers of COVID-19 cases and deaths [3,11,14].
In fact, Table 7 suggests that days of air pollution, in areas with low production of wind energy, can explain the number of cases of COVID-19 in society. In particular,
Cities in regions with 94% of wind energy production yield non-significant results because of the low number of statistical units in the sample under study;
Instead, in cities with a mere 6% of wind energy production, an increase of 1% in air pollution, measured by days exceeding the limits set for PM10, the expected number of cases increases by around 0.92% (p-value < 0.001).
Figure 1 shows a visual representation of regression lines: cities demonstrating higher production of renewable wind energy in Italy tend to have a low number of cases driven by days of air pollution. In order to confirm these findings, Table 8 considers cities with high and low number of days of air pollution.
Table 8 reveals that in cities with little days of air pollution, an increase of 1% in the density of population, it increases the expected number of cases by around 0.25% (p-value = 0.042), whereas, in cities with many days of air pollution, an increase of 1% in the density of population, it increases the expected number of cases by around 0.85% (p-value < 0.001). Figure 2 shows regression lines: regions with many days of air pollution generate an atmosphere rich in air pollutants that, associated with low wind speed, can commingle with viral agents and lead to poor air quality creating an habitat fostering a higher diffusion of COVID-19 [3,11,14,28]. Overall, then, empirical evidence here suggests a relation of association between the variables under study rather than a relation of dependence because of manifold confounding factors that influence both the dependent variables and independent variables.
In addition, if we consider regions with high/low number of days of air pollution, using arithmetic mean of days exceeding the limits set for PM10 or ozone in cities, the percentage of cases and total deaths weighted with the population of these regions reveals that around 74.50% of cases and around 81% of deaths from COVID-19 in Italy occur in regions with many days of air pollution and with low production of renewable energy based on wind resources.
These findings here provide valuable insight into the geo-environmental factors and types of energy resources and energy production that may affect the environment and may accelerate the spread of COVID-19 and similar infectious diseases within society. In short, the main results of the study, based on a case study of the COVID-19 outbreak in Italy, are that cities with high production of wind energy and a more sustainable environment, associated with low air pollution, experience reduced spread of COVID-19 and a lower number of deaths (during the first wave of COVID-19 pandemic). In fact, the results reveal that Italian cities in Southern regions with high production of wind energy and low air pollution (also for high speed of wind), which result in a cleaner environment and better air quality, likely explain a lower impact of COVID-19 in society. By contrast, cities in Northern Italy, with high air pollution and low wind speed (and, as a consequence, low wind energy production), experience the stagnation of air pollution in the atmosphere which, commingled with viral agents, can facilitate the spread of COVID-19 and similar infectious diseases [11]. Hence, COVID-19 experienced low spread in regions with low air pollution and high production of renewable (wind) energy (more sustainable environments). From the perspective of sustainable science, Xu et al. [29] found that winds significantly aid the dissipation of fine particulate matter (PM), and high concentrations of fine PM only persisted for a very short time and dissipated after several hours. The role of wind speed and direction, temperature and humidity is critical for urban ventilation and quality of air [30]. Considering the benefits of wind as resource that can reduce air pollution and, as a consequence, improve environmental sustainability, Gu et al. [31] argue that a strategy to enhance air quality in cities is improving the exchange of air between areas within and above the urban canopy with appropriate urban planning and management [17]. In fact, the health and economic benefits associated with national and local reduction of air pollution are now rarely contested [3]. In this context, Cui et al. [32] show that reductions in ambient air pollution can decrease mortality and related morbidity, with manifold economic benefits in society.
Overall, then, environments with little wind and high air pollution can sustain, in fall and winter seasons, the stagnation of air pollution, which, associated with viral agents, seems to have facilitated the spread of COVID-19 in regions, such as Northern Italy [3,11,14,28]. Regions have to apply long-term sustainable polices directed towards reducing air pollution and supporting the production of renewable energy [33]. Ibn-Mohammed et al. [34] suggest that the lessons learned from the COVID-19 pandemic should be used to support sustainable development goals directed towards more resilient and low-carbon economic systems. In particular, policymakers should support a sustainable model of development based on the circular economy in order to balance the complex equation of generating profit with minimal environmental harm [35,36,37]. DeWit et al. [38], to reduce the risk of exposure of Japanese cities to new infectious diseases [4], point out that the goal of protecting public health has to be associated with the promotion of accelerated decarbonization and a resilient and sustainable development. In fact, Sharifi and Khavarian-Garmsir [39] argue that the lessons learned from this health crisis for post-COVID urban planning should be directed towards improvements in air and water quality to create cities with more resilient and sustainable environments for the benefit of human society [17]. Finally, Wells ([40], p. 29) states that “the COVID 19 pandemic can act as a catalytic event in which the legitimacy and efficacy of existing economic and political structures will be challenged and reshaped, and hence is an opportunity to redefine the ecological burdens our activities create”. In this context, countries should introduce organizational, product and process innovations to support sustainable development for coping with future threats of novel infectious diseases, also through the expansion of sustainable technologies for resource-efficiency optimization and for renewable energy production, as well as for water purification, for material recycling and material recovery from complex products to enable low-impact production and/or use in the environment and society [41,42,43,44,45,46,47,48,49].

5. Conclusions and Outlook

The results here suggest that, among Italian provincial capitals, the number of COVID-19 cases was higher in unsustainable environments, i.e., cities with >100 days per year exceeding the limits set for PM10 or ozone and cities with a low average intensity of wind energy production. In fact, in hinterland cities (mostly those bordering large urban conurbations) with high air pollution coupled with low wind speed, the average number of cases in April 2020 more than doubled, and the same social and health issues are ongoing in the autumn–winter season of 2020–2021. The findings here also provide valuable insight into the understanding of geo-environmental and industrial factors that may accelerate the spread of COVID-19 in unsustainable environments. In this context, a proactive strategy to cope with future epidemics should concentrate on reducing the levels of air pollution in polluted cities with sustainable policies concerning traffic reduction, higher renewable energy production, increase of manufacturing processes with reduced energy, water and material footprints, as well as growing application of efficient materials and technologies for producing sustainable energy, devices and systems [4,42,50].
However, these conclusions are of course tentative because there are several challenges to such studies that can only capture certain aspects of the ongoing complex relations between atmospheric pollution, diffusion of viral infectivity, production of renewable energy and other factors of socioeconomic and environmental systems. Therefore, this study encourages further investigations into vital aspects of the spread of COVID-19 and other viral agents in highly industrialized areas to design appropriate sustainable policies that can reduce air pollution, improve air quality and control the spread of new waves of COVID-19 pandemic and novel infections similar to COVID-19, reducing the total impact on public health and also economic system [51,52,53]. To conclude, in the presence of regions with high air pollution and with low renewable (wind) energy production that deteriorate environment, damage public health and facilitate the spread of infectious diseases, a comprehensive strategy to prevent future epidemics similar to COVID-19 must be also designed by considering recommendations of sustainable and environmental sciences for cleaner production and higher utilization of energy from renewable resources and sustainable technologies for improving the environment, economic system and public health in the long run.

Funding

This research received no external funding.

Conflicts of Interest

The author declares that he has no known competing financial interests or personal relationships that could have appeared to influence the work reported in this paper. No funding was received for this study.

References

  1. Alwan, N.A.; Burgess, R.A.; Ashworth, S.; Beale, R.; Bhadelia, N.; Bogaert, D.; Dowd, J.; Eckerle, I.; Goldman, L.R.; Greenhalgh, T.; et al. Scientific consensus on the COVID-19 pandemic: We need to act now. Lancet 2020, 396, e71–e72. [Google Scholar] [CrossRef]
  2. Andersen, L.M.; Harden, S.R.; Sugg, M.M.; Runkle, J.D.; Lundquist, T.E. Analyzing the spatial determinants of local Covid-19 transmission in the United States. Sci. Total Environ. 2021, 754, 142396. [Google Scholar] [CrossRef]
  3. Coccia, M. Factors determining the diffusion of COVID-19 and suggested strategy to prevent future accelerated viral infectivity similar to COVID. Sci. Total Environ. 2020, 729, 138474. [Google Scholar] [CrossRef] [PubMed]
  4. Coccia, M. An index to quantify environmental risk of exposure to future epidemics of the COVID-19 and similar viral agents: Theory and practice. Environ. Res. 2020, 191, 110155. [Google Scholar] [CrossRef] [PubMed]
  5. Frontera, A.; Martin, C.; Vlachos, K.; Sgubin, G. Regional air pollution persistence links to COVID-19 infection zoning. J. Infect. 2020, 81, 318–356. [Google Scholar] [CrossRef]
  6. Anenberg, S.C.; Achakulwisut, P.; Brauer, M.; Moran, D.; Apte, J.S.; Henze, D.K. Particulate matter-attributable mortality and relationships with carbon dioxide in 250 urban areas worldwide. Sci. Rep. 2019, 9, 1–6. [Google Scholar] [CrossRef]
  7. Ash’Aari, Z.H.; Aris, A.Z.; Ezani, E.; Kamal, N.I.A.; Jaafar, N.; Jahaya, J.N.; Manan, S.A.; Saifuddin, M.F.U. Spatiotemporal Variations and Contributing Factors of Air Pollutant Concentrations in Malaysia during Movement Control Order due to Pandemic COVID-19. Aerosol Air Qual. Res. 2020, 20, 2047–2061. [Google Scholar] [CrossRef]
  8. He, H.; Shen, Y.; Jiang, C.; Li, T.; Guo, M.; Yao, L. Spatiotemporal Big Data for PM2.5 Exposure and Health Risk Assessment during COVID-19. Int. J. Environ. Res. Public Health 2020, 17, 7664. [Google Scholar] [CrossRef]
  9. Srivastava, A. COVID-19 and air pollution and meteorology-an intricate relationship: A review. Chemosphere 2021, 263, 128297. [Google Scholar] [CrossRef]
  10. Gupta, A.; Bherwani, H.; Gautam, S.; Anjum, S.; Musugu, K.; Kumar, N.; Anshul, A.; Kumar, R. Air pollution aggravating COVID-19 lethality? Exploration in Asian cities using statistical models. Environ. Dev. Sustain. 2020, 1–10. [Google Scholar] [CrossRef]
  11. Coccia, M. The effects of atmospheric stability with low wind speed and of air pollution on the accelerated transmission dynamics of COVID-19. Int. J. Environ. Stud. 2020, 1–27. [Google Scholar] [CrossRef]
  12. Van Doremalen, N.; Bushmaker, T.; Morris, D.; Holbrook, M.G.; Gamble, A.; Williamson, B.N.; Tamin, A.; Harcourt, J.L.; Thornburg, N.J.; Gerber, S.I.; et al. Aerosol and Surface Stability of SARS-CoV-2 as Compared with SARS-CoV-1. N. Engl. J. Med. 2020, 382, 1564–1567. [Google Scholar] [CrossRef] [PubMed]
  13. Center for System Science and Engineering at Johns Hopkins 2020. Coronavirus COVID-19 Global Cases. Available online: https://gisanddata.maps.arcgis.com/apps/opsdashboard/index.html#/bda7594740fd40299423467b48e9ecf6 (accessed on 4 October 2020).
  14. Coccia, M. How do low wind speeds and high levels of air pollution support the spread of COVID-19? Atmos. Pollut. Res. 2020. [Google Scholar] [CrossRef] [PubMed]
  15. Tzampoglou, P.; Loukidis, D. Investigation of the Importance of Climatic Factors in COVID-19 Worldwide Intensity. Int. J. Environ. Res. Public Health 2020, 17, 7730. [Google Scholar] [CrossRef]
  16. Martorell-Marugán, J.; Villatoro-García, J.A.; García-Moreno, A.; López-Domínguez, R.; Requena, F.; Merelo, J.J.; Lacasaña, M.; Luna, J.D.D.; Díaz-Mochón, J.J.; Lorente, J.A.; et al. DatAC: A visual analytics platform to explore climate and air quality indicators associated with the COVID-19 pandemic in Spain. Sci. Total Environ. 2021, 750, 141424. [Google Scholar] [CrossRef]
  17. Megahed, N.A.; Ghoneim, E.M. Antivirus-built environment: Lessons learned from Covid-19 pandemic. Sustain. Cities Soc. 2020, 61, 102350. [Google Scholar] [CrossRef]
  18. Rainisch, G.; Undurraga, E.A.; Chowell, G. A dynamic modeling tool for estimating healthcare demand from the COVID19 epidemic and evaluating population-wide interventions. Int. J. Infect. Dis. 2020, 96, 376–383. [Google Scholar] [CrossRef]
  19. Ferrannini, A.; Barbieri, E.; Biggeri, M.; Di Tommaso, M.R. Industrial policy for sustainable human development in the post-Covid19 era. World Dev. 2021, 137, 105215. [Google Scholar] [CrossRef]
  20. Ministero della Salute 2020. Covid-19—Situazione in Italia. Available online: http://www.salute.gov.it/portale/nuovocoronavirus/dettaglioContenutiNuovoCoronavirus.jsp?lingua=italiano&id=5351&area=nuovoCoronavirus&menu=vuoto (accessed on 1 April 2020).
  21. Legambiente 2019. Mal’aria 2019, il Rapporto Annuale Sull’Inquinamento Atmosferico Nelle Città Italiane. Available online: https://www.legambiente.it/malaria-2019-il-rapporto-annuale-annuale-sullinquinamento-atmosferico-nelle-citta-italiane/ (accessed on 28 March 2020).
  22. Il Meteo 2020. Medie e Totali Mensili. Available online: https://www.ilmeteo.it/portale/medie-climatiche (accessed on 28 March 2020).
  23. ISTAT 2020. The Italian National Institute of Statistics-Popolazione residente al 1 gennaio. Available online: http://dati.istat.it/Index.aspx?DataSetCode=DCIS_POPRES1 (accessed on 18 October 2020).
  24. Terna. Statistiche Regionali 2018; Terna SpA: Roma, Italy, 2018. [Google Scholar]
  25. Terna 2020. Fonte Rinnovabili. Wind Energy. Available online: https://www.terna.it/it/sistema-elettrico/dispacciamento/fonti-rinnovabili (accessed on 20 May 2020).
  26. Kong, L.; Xin, J.; Zhang, W.; Wang, Y. The empirical correlations between PM2.5, PM10 and AOD in the Beijing metropolitan region and the PM2.5, PM10 distributions retrieved by MODIS. Environ. Pollut. 2016, 216, 350–360. [Google Scholar] [CrossRef]
  27. Zhou, X.; Cao, Z.; Ma, Y.; Wang, L.; Wu, R.; Wang, W. Concentrations, correlations and chemical species of PM2.5/PM10 based on published data in China: Potential implications for the revised particulate standard. Chemosphere 2016, 144, 518–526. [Google Scholar] [CrossRef]
  28. Rashed, E.A.; Kodera, S.; Gomez-Tames, J.; Hirata, A. Influence of Absolute Humidity, Temperature and Population Density on COVID-19 Spread and Decay Durations: Multi-Prefecture Study in Japan. Int. J. Environ. Res. Public Health 2020, 17, 5354. [Google Scholar] [CrossRef] [PubMed]
  29. Xu, J.; Zhu, F.; Wang, S.; Zhao, X.; Zhang, M.; Ge, X.; Wang, J.; Tian, W.; Wang, L.; Yang, L.; et al. A preliminary study on wind tunnel simulations of the explosive growth and dissipation of fine particulate matter in ambient air. Atmos. Res. 2020, 235, 104635. [Google Scholar] [CrossRef]
  30. Yuan, M.; Song, Y.; Huang, Y.; Shen, H.; Li, T. Exploring the association between the built environment and remotely sensed PM2.5 concentrations in urban areas. J. Clean. Prod. 2019, 220, 1014–1023. [Google Scholar] [CrossRef]
  31. Gu, K.; Fang, Y.; Qian, Z.; Sun, Z.; Wang, A. Spatial planning for urban ventilation corridors by urban climatology. Ecosyst. Health Sustain. 2020, 6, 1747946. [Google Scholar] [CrossRef] [Green Version]
  32. Cui, L.; Zhou, J.; Peng, X.; Ruan, S.; Zhang, Y. Analyses of air pollution control measures and co-benefits in the heavily air-polluted Jinan city of China, 2013–2017. Sci. Rep. 2020, 10, 5423. [Google Scholar] [CrossRef]
  33. Wang, Z.; Zhu, Y. Do energy technology innovations contribute to CO2 emissions abatement? A spatial perspective. Sci. Total Environ. 2020, 726, 138574. [Google Scholar] [CrossRef]
  34. Ibn-Mohammed, T.; Mustapha, K.; Godsell, J.; Adamu, Z.; Babatunde, K.; Akintade, D.; Acquaye, A.; Fujii, H.; Ndiaye, M.; Yamoah, F.; et al. A critical analysis of the impacts of COVID-19 on the global economy and ecosystems and opportunities for circular economy strategies. Resour. Conserv. Recycl. 2021, 164, 105169. [Google Scholar] [CrossRef]
  35. Coccia, M. The relation between price setting in markets and asymmetries of systems of measurement of goods. J. Econ. Asymmetries 2016, 14, 168–178. [Google Scholar] [CrossRef]
  36. Coccia, M. Why do nations produce science advances and new technology? Technol. Soc. 2019, 59, 101124. [Google Scholar] [CrossRef]
  37. Coccia, M. Theories of Development. In Global Encyclopedia of Public Administration, Public Policy, and Governance; Springer Science and Business Media LLC.: Berlin/Heidelberg, Germany, 2019; pp. 1–7. [Google Scholar]
  38. Dewit, A.; Shaw, R.; Djalante, R. An integrated approach to sustainable development, National Resilience, and COVID-19 responses: The case of Japan. Int. J. Disaster Risk Reduct. 2020, 51, 101808. [Google Scholar] [CrossRef]
  39. Sharifi, A.; Khavarian-Garmsir, A.R. The COVID-19 pandemic: Impacts on cities and major lessons for urban planning, design, and management. Sci. Total Environ. 2020, 749, 142391. [Google Scholar] [CrossRef]
  40. Wells, P.; Abouarghoub, W.; Pettit, S.; Beresford, A. A socio-technical transitions perspective for assessing future sustainability following the COVID-19 pandemic. Sustain. Sci. Pract. Policy 2020, 16, 29–36. [Google Scholar] [CrossRef]
  41. Coccia, M. A taxonomy of public research bodies: A systemic approach1. Prometheus 2005, 23, 63–82. [Google Scholar] [CrossRef]
  42. Coccia, M. Measuring the impact of sustainable technological innovation. Int. J. Technol. Intell. Plan. 2009, 5, 276. [Google Scholar] [CrossRef]
  43. Coccia, M. Sources of technological innovation: Radical and incremental innovation problem-driven to support competitive advantage of firms. Technol. Anal. Strat. Manag. 2017, 29, 1048–1061. [Google Scholar] [CrossRef]
  44. Coccia, M. The Fishbone diagram to identify, systematize and analyze the sources of general purpose technologies. J. Adm. Soc. Sci. 2017, 4, 291–303. [Google Scholar] [CrossRef]
  45. Coccia, M. The origins of the economics of Innovation. J. Econ. Soc. Thought 2018, 5, 9–28. [Google Scholar] [CrossRef]
  46. Coccia, M. Sources of disruptive technologies for industrial change. Ind. Riv. Econ. Politica Ind. 2017, 38, 97–120. [Google Scholar] [CrossRef]
  47. Coccia, M. Varieties of capitalism’s theory of innovation and a conceptual integration with leadership-oriented executives: The relation between typologies of executive, technological and socioeconomic performances. Int. J. Public Sect. Perform. Manag. 2017, 3, 148–168. [Google Scholar] [CrossRef]
  48. Coccia, M. Theorem of not independence of any technological innovation. J. Econ. Bibliogr. 2018, 5, 29–35. [Google Scholar] [CrossRef]
  49. Coccia, M. Deep learning technology for improving cancer care in society: New directions in cancer imaging driven by artificial intelligence. Technol. Soc. 2020, 60, 101198. [Google Scholar] [CrossRef]
  50. Coccia, M. Comparative Critical Decisions in Management. Global Encyclopedia of Public Administration, Public Policy, and Governance; Farazmand, A., Ed.; Springer: Berlin/Heidelberg, Germany, 2020. [Google Scholar] [CrossRef]
  51. McLennan, A.K.; Hansen, A.K.K.; Ulijaszek, S.J. Health and medicine cannot solve COVID-19. Lancet 2020, 396, 599–600. [Google Scholar] [CrossRef]
  52. Ou, Y.; West, J.J.; Smith, S.J.; Nolte, C.G.; Loughlin, D.H. Air pollution control strategies directly limiting national health damages in the US. Nat. Commun. 2020, 11, 1–11. [Google Scholar] [CrossRef] [PubMed] [Green Version]
  53. Coccia, M. Scientific Data of the Principal Factors Determining the Diffusion of COVID-19 in Italy; Version 1; Mendeley Data; Mendeley-Elsevier: London, UK, 2020. [Google Scholar] [CrossRef]
Figure 1. Regression lines of log cases on log air pollution according to production of wind energy. Note: This result suggests that the spread of COVID-19 increases with air pollution in regions with low production of wind energy (in general, unsustainable environments).
Sustainability 12 09709 g001
Figure 2. Regression line of log cases on log population density, considering groups of cities with high or low number of days of air pollution. Note: This result reveals that the spread of COVID-19 is higher in cities with high air pollution.
Sustainability 12 09709 g002
Table 1. Wind energy production in Italy per region in January 2020 and energy production compared to demand in 2018.
Italian RegionsNumber Wind FarmsPower (MW)Total Deficit (−) or Surplus (+) of Energy Production (from Renewable and Traditional Resources) Compared to Demand in 2018 [24]
Abruzzo47264.23−17.6%
Basilicata14131300.12+10.6%
Calabria4181125.77+179.0%
Campania6191734.61−44.2%
Emilia Romagna7244.85−28.9%
Friuli Venezia Giulia50.01−5.50%
Lazio6970.94−22.0%
Liguria3356.83−15.7%
Lombardia100.05−34.6%
Marche5119.24−67.80
Molise79375.87+94.5%
Piemonte1823.82+12.8%
Puglia11762570.12+55.8%
Sardegna5951105.34+33.6%
Sicilia8841904.10−18.1%
Toscana126143.01−25.1%
Trentino Alto Adige100.39+66.9%
Umbria252.09−42.70
Valle d’Aosta52.59+208.3%
Veneto1813.43−48.1%
Source: [24,25], last report available.
Table 2. Main energy sources in Northern Italy, with low wind and solar energy, 2018.
Regions of North ItalyThermal Power Stations Using Fossil Fuels, Liquefied Natural Gas Coal and Crude Oil %Wind and Solar Farms %
Emilia Romagna60.27.3
Friuli Venezia Giulia72.15.2
Liguria76.53.7
Lombardia46.73.2
Piemonte74.06.6
Trentino Alto Adige20.36.1
Valle d’Aosta4.002.4
Veneto32.86.2
Arithmetic mean48.335.09
Stand. Deviation27.131.78
Source: [24], last report available.
Table 3. Descriptive statistics of Italian province capitals according to intensity of wind energy production.
Cities in Regions with 94% of Wind Energy Production N = 5Cities in Regions with 6% of Wind Energy Production N = 50
VariablesMeanStd. DeviationMeanStd. Deviation
Days exceeding limits set for PM10 or ozone, 201848.030.2779.4441.7
Cases, 17th March 202059.890.84475.58731.11
Cases, 7th April 2020505.6646.122119.682450.71
Cases, 27 April 2020708.2949.193067.673406.67
Density inhabitants/km2, 201921293384.11385.761489.31
Wind km/h, February–March 202014.65.458.13.08
Table 4. Descriptive statistics of Italian provincial capitals according to days of air pollution.
Cities with High Air Pollution: >100 Days Exceeding Limits Set for PM10 N = 20Cities with Low Air Pollution: <100 Days Exceeding Limits Set for PM10 N = 35
VariablesMeanStd. DeviationMeanStd. Deviation
Days exceeding limits set for PM10 or ozone, 2018125.2513.448.7721.37
Cases, 17th March 2020881.71010.97184.11202.76
Cases, 7th April 202036503238.821014.63768.91
Cases, 27 April 20204838.054549.411637.211292.26
Density inhabitants/km2, 20191981.41988.671151.571466.28
Wind km/h, February–March 20207.672.869.284.15
Table 5. Descriptive statistics of Italian provincial capitals according to density of population.
Density of Population
HIGH > 1000 Inhabitant/km2
N = 25 Cities
Density of Population
LOW < 1000 Inhabitant/km2
N = 30 Cities
VariablesMeanStd. DeviationMeanStd. Deviation
Days exceeding limits set for PM10 or ozone, 201891.2440.2464.3739.25
Cases, 17th March 2020665.08919.7248.37386.95
Cases, 7th April 20202967.443092.461144.21065.99
Cases, 27 April 20204195.424333.911727.551491.47
Density inhabitants/km2, 20192584.42000.63510.77282.11
Wind km/h, February–March 20207.992.799.284.41
Table 6. Correlation.
Cities in Regions with 94% of Wind Energy ProductionCities in Regions with 6% of Wind Energy Production
Log days exceeding limits set for PM10 or ozone, 2018Log days exceeding limits set for PM10 or ozone, 2018
Log cases
17th March 2020
Pearson Correlation0.810.69 **
Log cases
7th April 2020
Pearson Correlation0.740.55 **
Log cases
27th April 2020
Pearson Correlation0.690.36 **
Note: ** Correlation is significant at the 0.01 level (2-tailed).
Table 7. Parametric estimates of the relationship of log cases on log air pollution considering groups of cities in regions with high or low production of wind energy.
Cities in Regions with 94% of
Wind Energy Production
Cities in Regions with 6% of
Wind Energy Production
Constant α
(St. Err.)
0.70
(2.64)
3.39 ***
(0.85)
Coefficient β
(St. Err.)
1.34
(0.70)
0.92 ***
(0.20)
R2 (St. Err. of Estimate)0.55 (0.86)0.31 (0.82)
F3.6521.28 ***
Note: Explanatory variable: log days exceeding limits set for PM10 or ozone 2018; Dependent variable: log cases on 7th April 2020; *** p-value < 0.001.
Table 8. Parametric estimates of the relationship of log cases (7th April 2020) on log density of population (inhabitants/km2 in 2019), considering groups of cities with high and low number of days of air pollution.
Cities with Low Air PollutionCities with High Air Pollution
Constant α
(St. Err.)
4.976
(0.786)
1.670
(1.491)
Coefficient β
(St. Err.)
0.252 *
(0.120)
0.849 ***
(0.205)
R2 (St. Err. of Estimate)0.1190.488
F17.168 ***4.457 *
Note: Explanatory variable: log density of population (inhabitants/km2) in 2019; Dependent variable: log cases on 7th April 2020; *** p-value < 0.001; * p-value < 0.05.
Publisher’s Note: MDPI stays neutral with regard to jurisdictional claims in published maps and institutional affiliations.

