Article

Sustainability Potential Evaluation of Concrete with Steel Slag Aggregates by the LCA Method

by
Vojtěch Václavík
1,*,
Marcela Ondová
2,*,
Tomáš Dvorský
1,
Adriana Eštoková
2,
Martina Fabiánová
2 and
Lukáš Gola
1
1
Department of Environmental Engineering, Faculty of Mining and Geology, VSB—Technical University of Ostrava, 708 00 Ostrava, Czech Republic
2
Institute of Environmental Engineering, Faculty of Civil Engineering, Technical University of Kosice, 042 00 Kosice, Slovakia
*
Authors to whom correspondence should be addressed.
Sustainability 2020, 12(23), 9873; https://0-doi-org.brum.beds.ac.uk/10.3390/su12239873
Submission received: 20 October 2020 / Revised: 13 November 2020 / Accepted: 23 November 2020 / Published: 25 November 2020
(This article belongs to the Special Issue Sustainable Building Materials and Life Cycle Assessment (LCA))

Abstract

:
Sustainability in the construction industry refers to all resource-efficient and environmentally responsible processes throughout the life cycle of a structure. Green buildings may incorporate reused, recycled, or recovered materials in their construction. Concrete is as an important building material. Due to the implementation of by-products and waste from various industries into its structure, concrete represents a significant sustainable material. Steel slag has great potential for its reuse in concrete production. Despite its volume changes over time, steel slag can be applied in concrete as a cement replacement (normally) or as a substitute for natural aggregates (rarely). This paper focused on an investigation of concrete with steel slag as a substitute of natural gravel aggregate. Testing physical and mechanical properties of nontraditional concrete with steel slag as a substitute for natural aggregates of 4/8 mm and 8/16 mm fractions confirmed the possibility of using slag as a partial replacement of natural aggregate. Several samples of concrete with steel slag achieved even better mechanical parameters (e.g., compressive strength, frost resistance) than samples with natural aggregate. Moreover, a life cycle assessment (LCA) was performed within the system boundaries cradle-to-gate. The LCA results showed that replacements of natural aggregates significantly affected the utilization rate of nonrenewable raw materials and reduced the overall negative impacts of concrete on the environment up to 7%. The sustainability indicators (SUI), which considered the LCA data together with the technical parameters of concrete, were set to evaluate sustainability of the analyzed concretes. Based on the SUI results, replacing only one fraction of natural gravel aggregate in concrete was a more sustainable solution than replacing both fractions at once. These results confirmed the benefits of using waste to produce sustainable materials in construction industry.

1. Introduction

The term “sustainability” has become very popular in recent years. The sustainability challenges we face today are mainly related to environmental threats [1,2,3]. Many of these threats originated in the construction industry. The building sector consumes a lot of energy, produces a lot of pollutants and solid waste, consumes renewable as well as nonrenewable raw materials for the production of building materials, and consumes water throughout the building’s life cycle. According to the United Nations Environment Program (UNEP-SETAC) [4], the building sector consumes about 40% of the energy, 25% of the water, and 40% of the resources available on Earth, while producing 30% of greenhouse gases. However, compared to other industrial areas, the construction industry has the greatest potential to achieve a significant reduction in negative impacts using new technologies and also sustainable materials, such as with reused, recycled, or recovered materials content, or materials made using renewable resources [5]. For example, every tone of produced ordinary Portland cement releases an equivalent amount of carbon dioxide to the atmosphere. Reduction in carbon dioxide emissions and energy consumption can be achieved by introducing alternative, waste-based cements in concrete production [6]. Fly ashes and slags (e.g., blast furnace and steel slags) are among the major by-products from industrial production that can be used to replace the part of cement in the production of concrete. In addition to the environmental benefits, the waste-based concrete composites can acquire several improved technical properties. Many studies have indicated variousness and the positive role of the waste incorporated [7,8]. Steel slag is a product of the metallurgical process, where active molten slag is used to separate undesirable adulterants and excess carbon. The potential for use of blast furnace slag is huge, primarily including a cement replacement in the production of concrete [9] or a replacement for the natural aggregates in the concrete and mortar production [10,11,12]. Such concrete materials could be, in addition, more beneficial for the environment due their increased durability. Blast furnace slag is also used as a raw material for glass ceramics with higher flexural strength and resistance to acids and alkalis [13], or as a secondary raw material for the preparation of high-strength geopolymers [14]. Steel slag is currently used in highway construction, as an additive to asphalt mixtures, in sub-base layers of roads, as artificial gravel aggregate for backfills, and sub-base below buildings [15,16,17,18,19,20]. Moreover, the positive economic aspect is also significant. The attention on environmental, social, and economic parameters of buildings constitutes the three basic pillars of sustainability. In this study, economic and environmental factors were monitored. However, to achieve true sustainability, it is necessary to balance all these factors in equal harmony [21,22,23,24]. The evaluation of social factors will be the subject of further research.
Although the individual positive factors of slag concrete are known, a comprehensive scientific assessment is needed to quantify and compare the environmental impacts and benefits of such materials. Currently, the most popular environmental impact assessment tool is the “life cycle assessment” (LCA). LCA is an environmental approach that considers all the aspects of resource use and environmental releases associated with an industrial system. Specifically, it is a holistic view of environmental interactions that covers a range of activities, from the extraction of raw materials from the Earth and the production and distribution of energy, through the use, and reuse, and final disposal of a product [25].
The LCA method has been used in the construction industry for quite a long time and several LCA studies have been concerned also with the concrete environmental evaluation of cement replacement by slags. Kono et al. [26] and Palod [27] reported an improved environmental performance of tested concrete composites and mortars with steel slag replacement of cement. A cradle-to-gate LCA study by Tait [28] proved substantially lower CO2 emissions, a significant reduction of environmental impacts, and an increased scope for sustainability due to a higher replacement of Portland cement by slag as well. The authors also indicated an increased positive effect regarding waste scenarios [28]. However, a largely unexplored area is the use of steel slags as aggregate substitutes in concretes. This approach could also be an important factor in sustainability in the construction sector by saving raw materials resources.
The main aim of the presented paper was to analyze and compare the technical properties and environmental impacts of nontraditional concrete with steel slag as a substitute for natural aggregates of various fractions. Nontraditional concrete was designed in order to save natural resources of gravel aggregates, to protect the environment in connection to aggregate extraction, and to reduce the production costs during concrete production. Environmental impact assessments were performed using the LCA method, utilizing SimaPro software and the Ecoinvent database within the cradle-to-gate system boundaries.

2. Materials and Methods

The methodology of the experimental investigation is illustrated in the Figure 1.
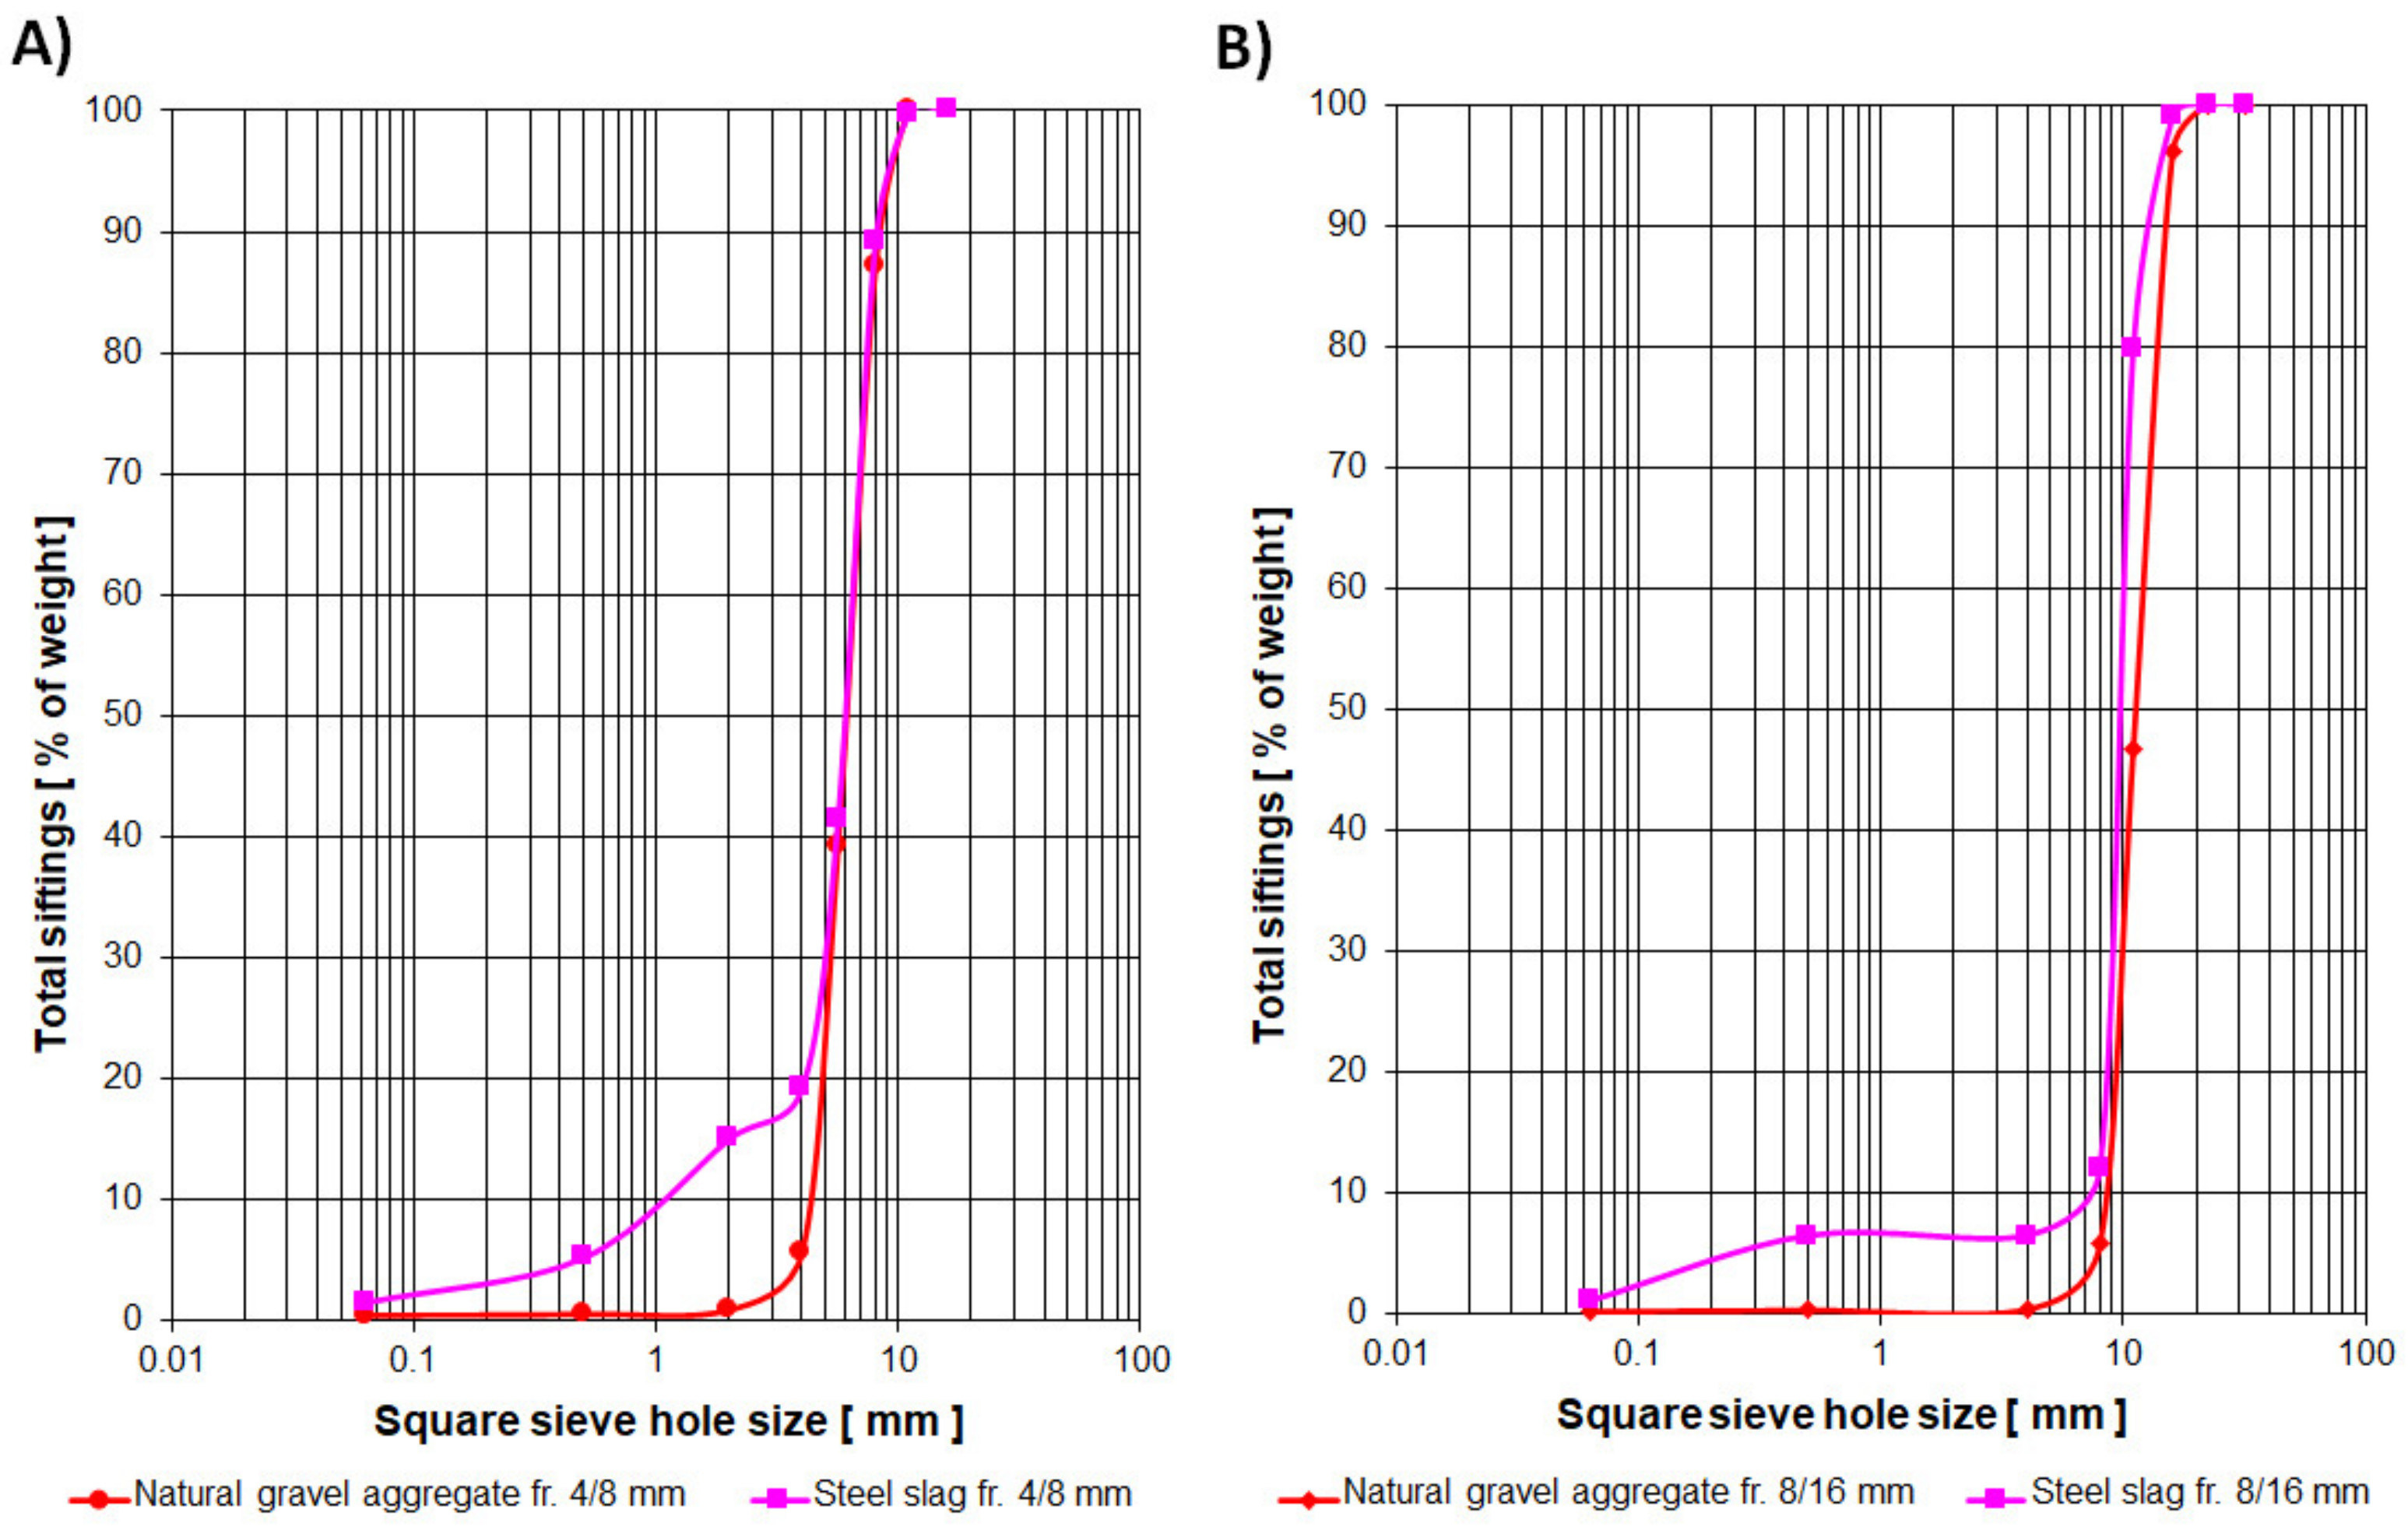
Four concrete mixtures were designed in order to perform an experimental research. The use of steel slag as the substitute of selected natural aggregate fractions was examined. The concrete samples with substitution of individual natural aggregate fractions (4/8 mm and 8/16 mm), as well as samples with a total substitute of both fractions mentioned, were tested.

2.1. Materials for Concrete Mixtures

2.1.1. Steel Slag

Steel slag fractions of 4/8 and 8/16 mm from Siemens-Martin furnaces stored on a heap, which had been produced by the Trinecke zelezarny, a.s., (Czech Republic) company, were used for the experiments. The chemical composition of steel slag, measured by X-ray fluorescence analysis (XRF), (Ametek, Kleve, Germany) is illustrated in Table 1. The basic chemical components of steel slag were solid solutions of orthosilicate with the oxides of iron, manganese, aluminum, and magnesium, bonded chemically to calcium oxide. The analyses of the steel slag input characteristics included the testing according to the European standards as follows: particle size analysis [29], shape index [30], crushing resistance [31], specific density and water absorption [32], particle density [33], loose bulk density [34], and determination of impurities [35].

2.1.2. Natural Gravel Aggregate

Natural gravel aggregates (NGA) of three fractions were used in the experiment: the finest fraction of dimensions 0/4 mm (Bohumín, Czech Republic) and the fractions of 4/8 and 8/16 mm (Valšov, Czech Republic). The properties of natural gravel aggregate, according to the particular standards as presented above, were tested. In addition, another parameters of natural gravel aggregates were analyzed such as the freeze–thaw resistance by both magnesium sulphate [36] and sodium sulphate tests [37], fine particle contents [38], and organic substances by colorimetric test [39].

2.1.3. Cement

Portland cement CEM I 42.5 R (Cement Hranice, a.s., Hranice, Czech Republic) was used as the binding component for the concrete samples preparation. The cement properties declared by the manufacturer are listed in Table 2.

2.1.4. Mixing Water

Tap water from the regional water supply network (Ostrava, Czech Republic) was used as mixing water to produce all concrete samples.

2.1.5. Additives

Superplasticizer MELMENT L10/40 based on melamine formaldehyde resin (SKW Tronsberg, Germany) was used in the concrete mixtures. The usual dosage is 0.4 to 1.4 L per 100 kg of cement; in our samples, the optimal amount was determined within the scope of the conclusive tests and was added to the mixing water.

2.2. Mixture Proportions of Concrete Samples

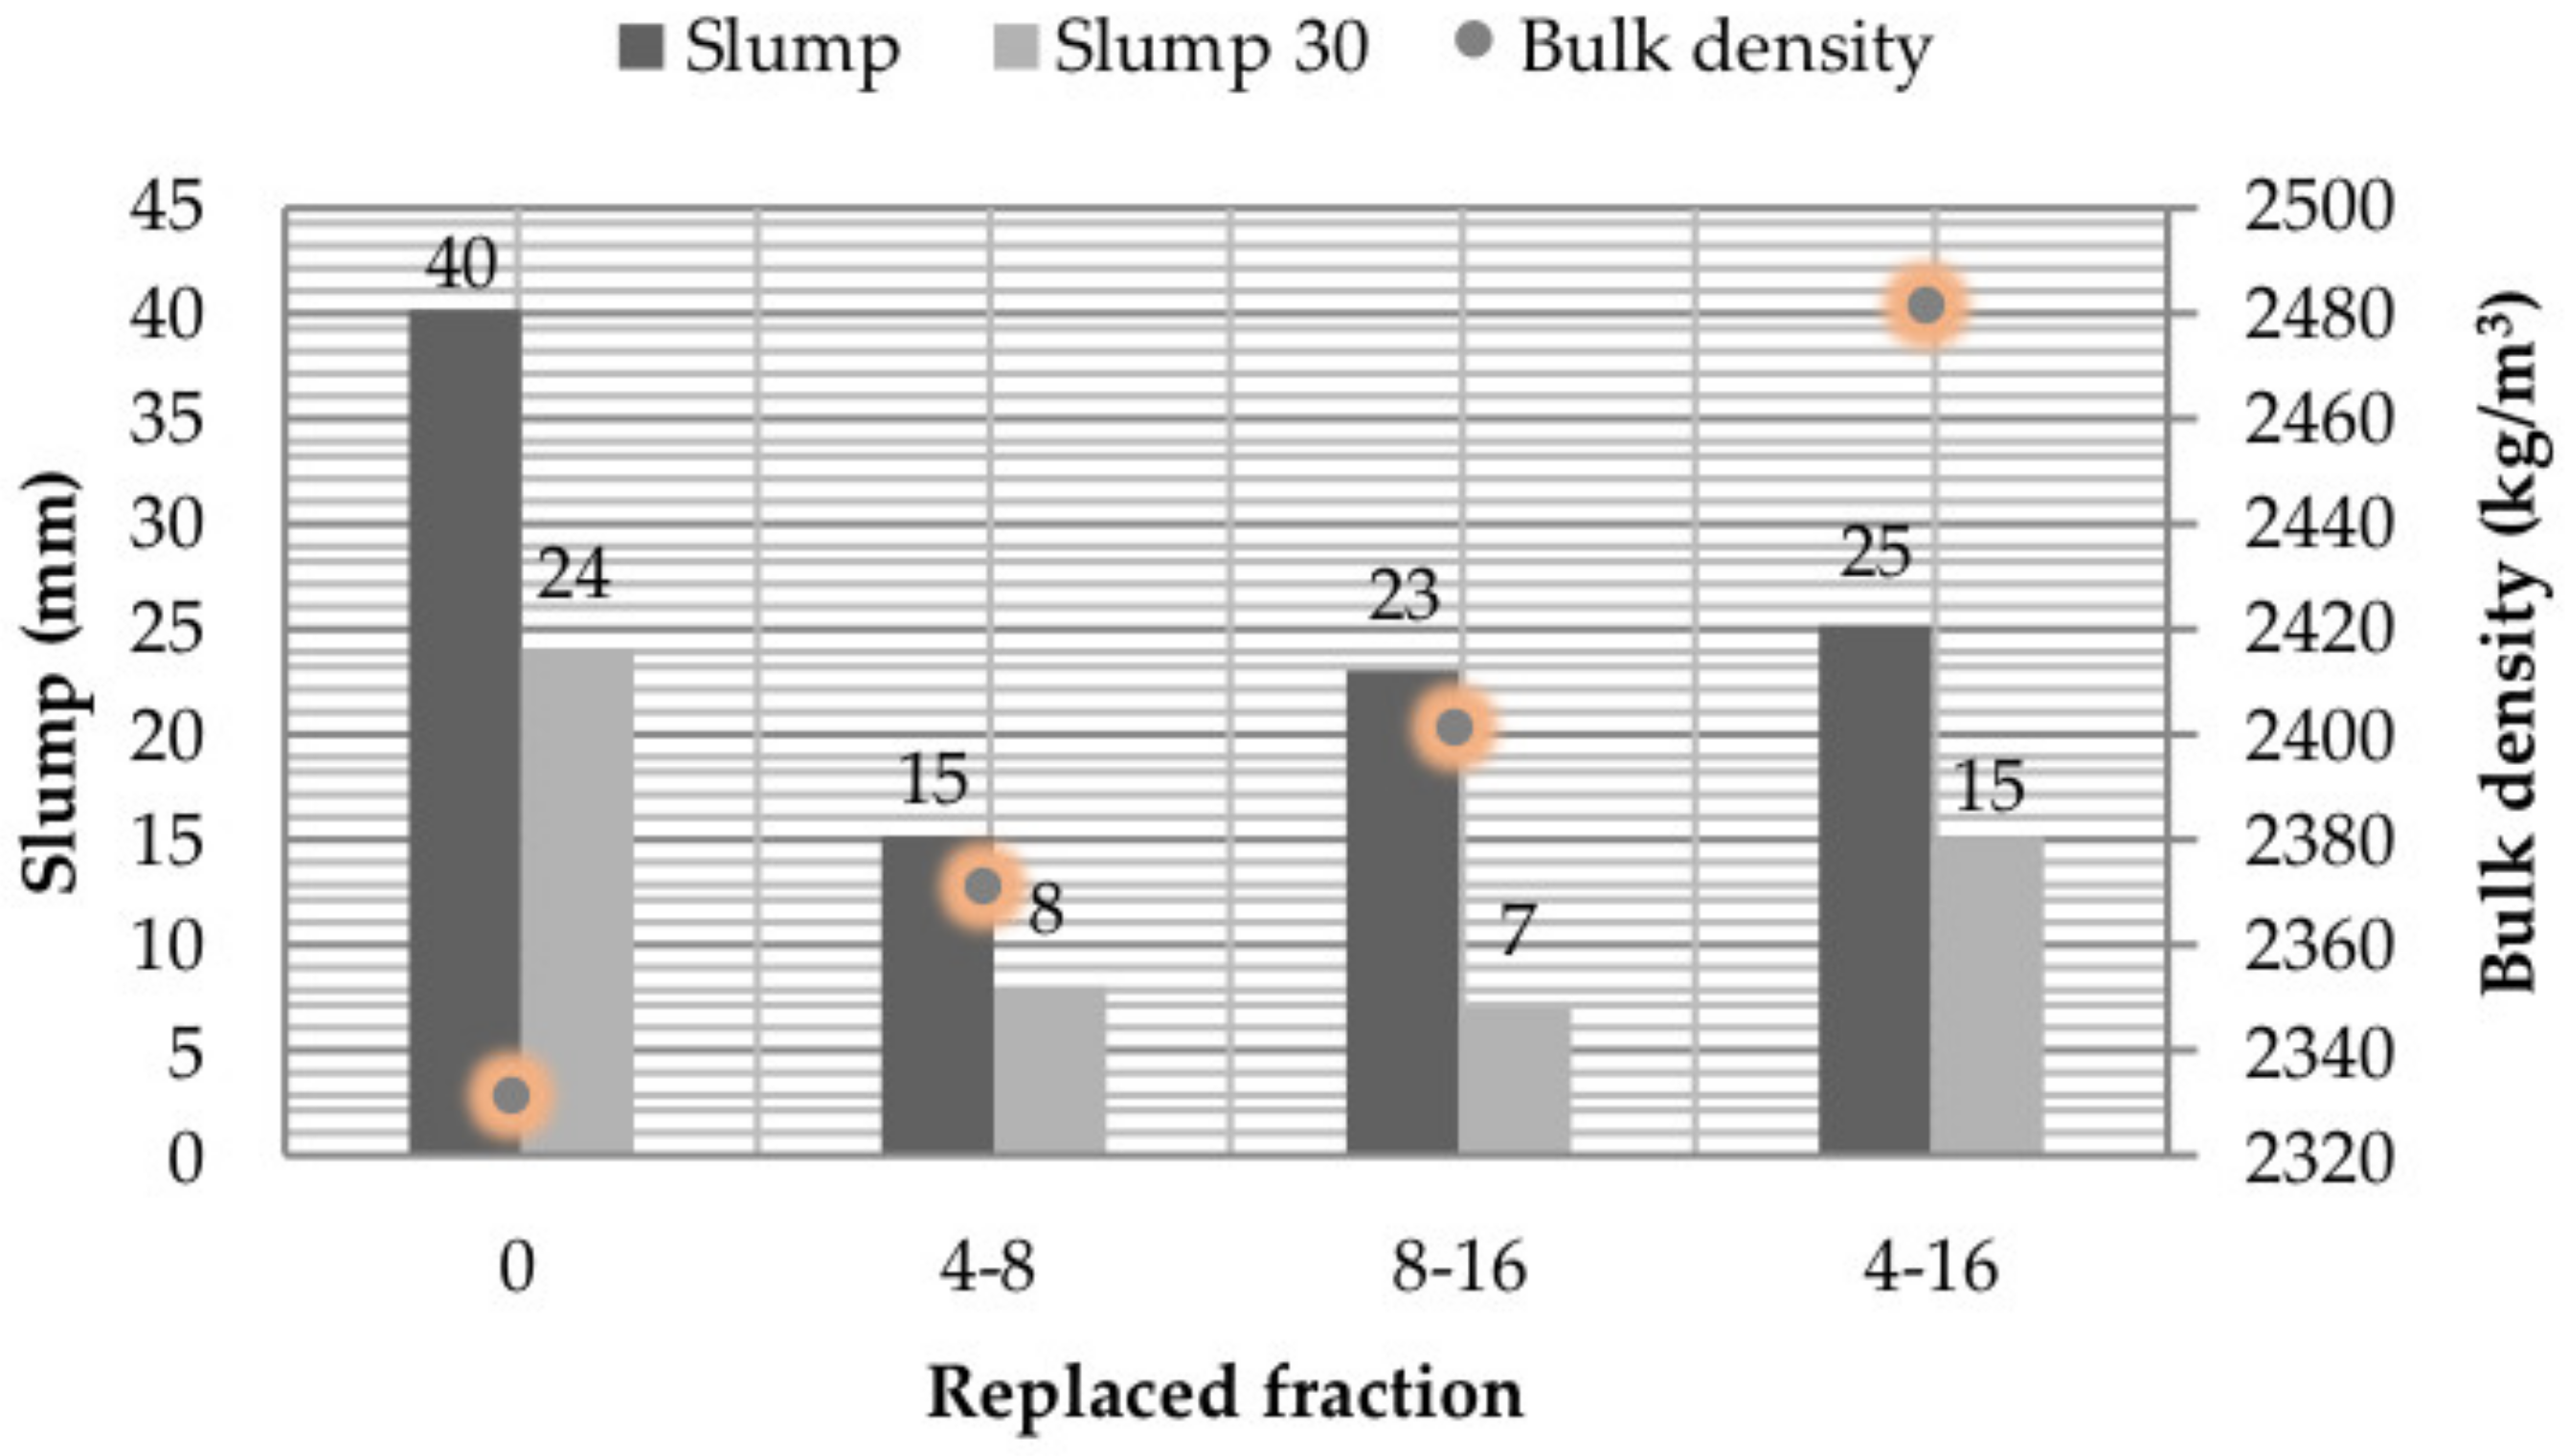
The basic composition of the tested mixtures consisted of the same amount of Portland cement—350 kg per m3 of fresh concrete, tap water, superplasticizer, and three fractions of aggregates. Water to cement ratio was equal to 0.55. A volume ratio of fine aggregates to coarse aggregates 0/4 mm:4/8 mm:8/16 mm was set to 4:3:3. The first mixture (CSS 0) was designed without any steel slag, only natural aggregates were incorporated, and thus the composition represented a reference concrete mixture. Nontraditional concrete with the replacement of natural aggregate with steel slag was designed in three variants. In the first variant, in the CSS 4/8 concrete mixture, only the middle fraction of natural gravel aggregates with dimensions of 4/8 mm was replaced by steel slag, the other two fractions were represented by natural aggregates. A substitution of a coarse fraction (8/16 mm) by the same fraction of steel slag was performed in the mixture CSS 8/16. A complete substitution of the fractions of 4/8 and 8/16 mm of natural aggregates by steel slag of the same sizes was performed in mixture CSS 4/16.
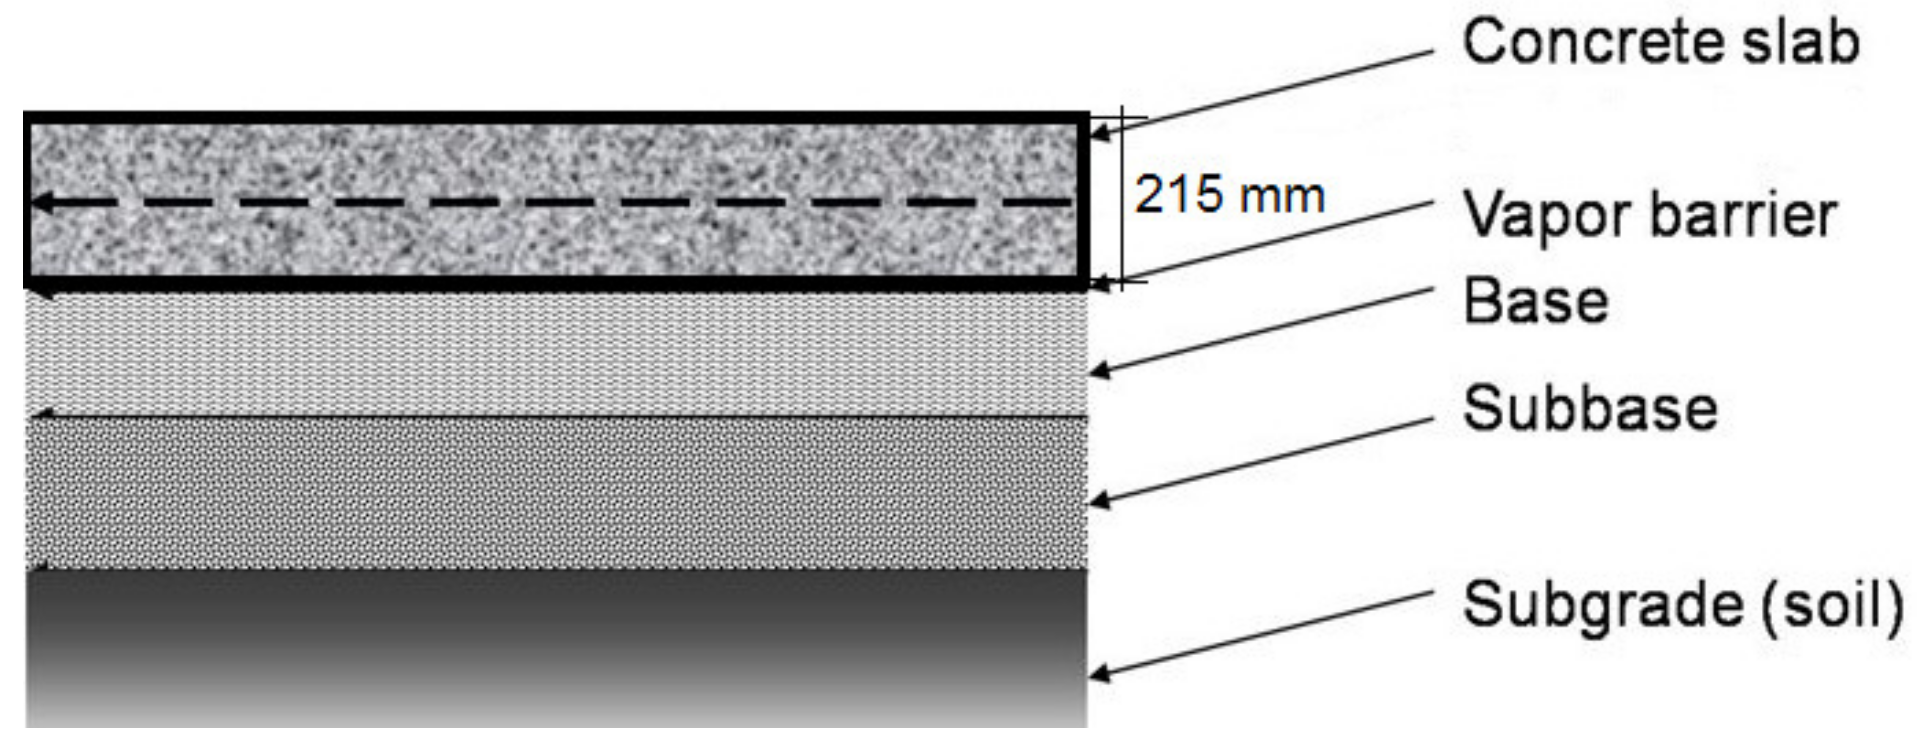
The cubic and prism concrete samples were prepared in a standard manner, the mixtures were cast in steel molds with sizes of 150 mm × 150 mm × 150 mm, and 100 mm × 100 mm × 400 mm, respectively, and compacted with a vibrating equipment. After 24 h, the concrete samples were demolded and cured in water at 20 °C for 28 days.

2.3. Testing the Properties of Fresh and Hardened Concrete Samples

Fresh concrete mixtures were tested in order to determine their consistency and density. A slump—Abrams—test, according to [
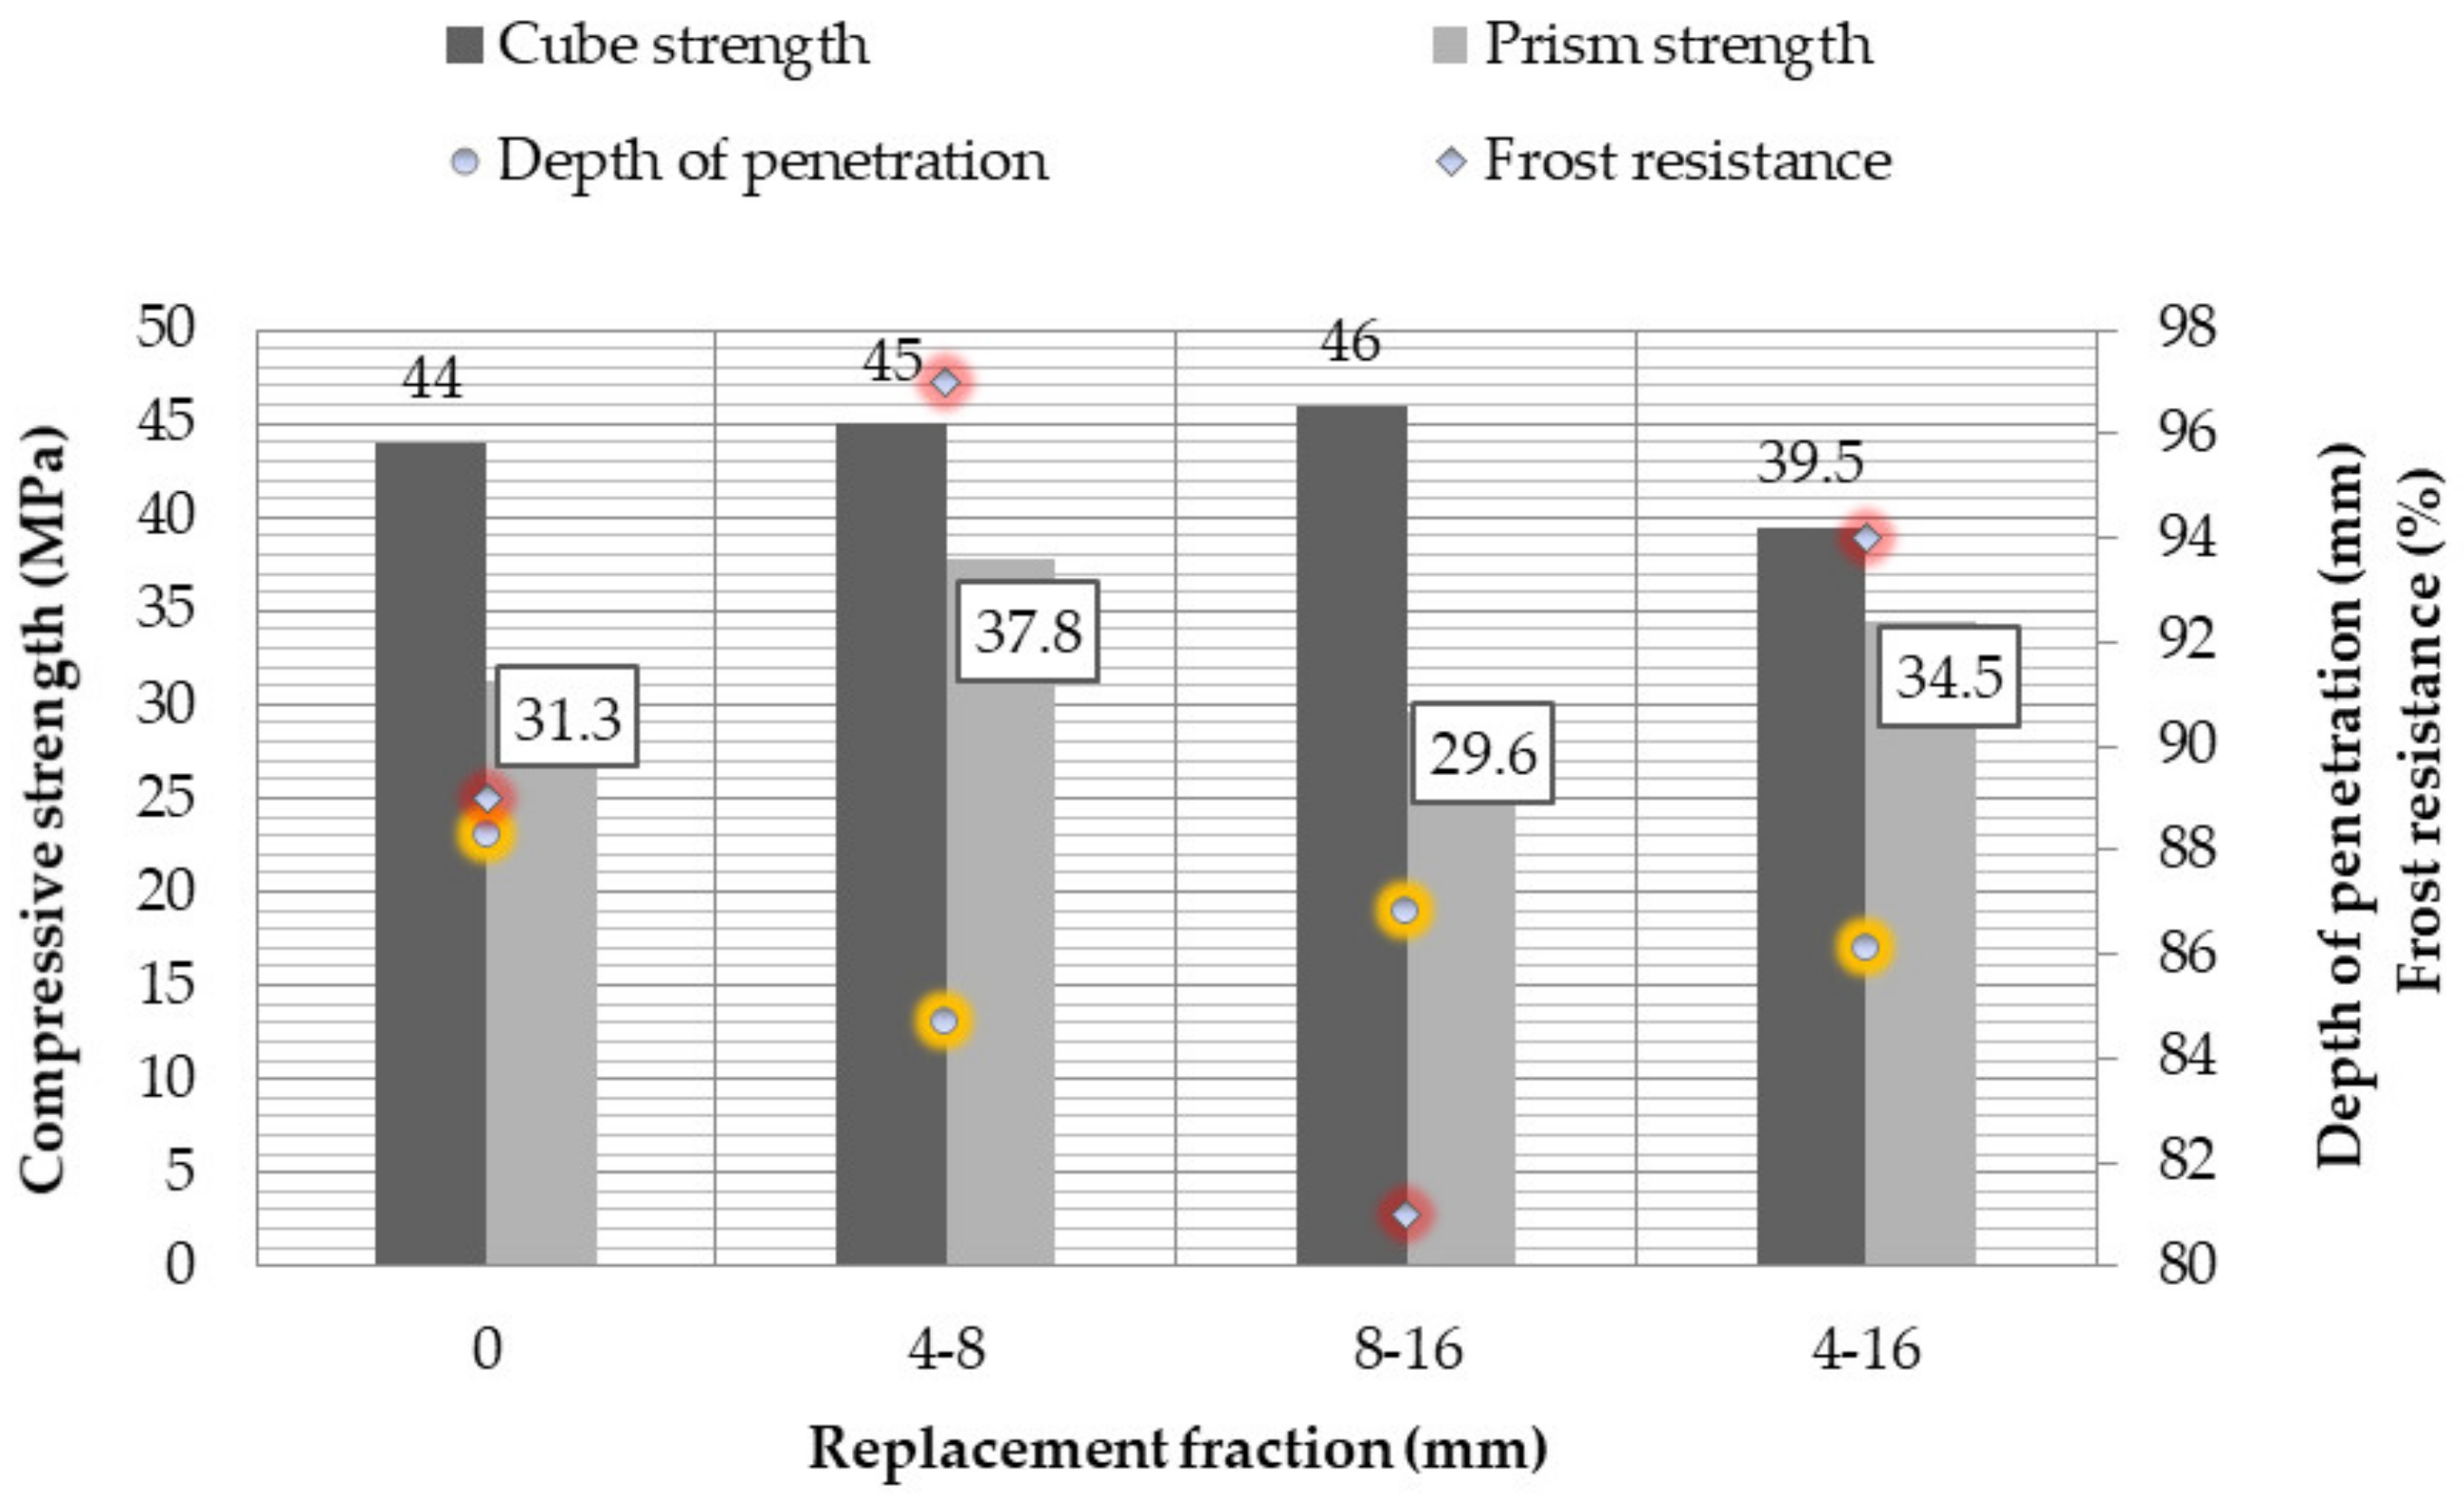
40], was performed on the prepared fresh concrete mixtures immediately after mixing and after 30 min. The testing of hardened concrete composites included determination of the compressive strength in compliance with the corresponding standards [41,42], flexural strength [43], depth of penetration of water under pressure [44], frost resistance test, and deformation properties of concrete by the static modulus of elasticity in compression [45].
The determination of compressive strength and depth of penetration were performed for all experimental mixtures after 28 days on the cubic specimens. Each set of the concrete specimens consisted of three cubic samples with the dimension of 150 mm per each experimental mixture.
Frost resistance of concrete samples was tested on two sets of concrete prism specimens (6 pcs of concrete prisms in total), which were subjected to 100 cycles of freezing. Freezing and de-freezing of the test specimens was performed in freezing cycles, during which the temperature of the freezing environment was within the range of −15 °C to 20 °C. One freezing cycle consisted of 4 h of freezing and 2 h of de-freezing. After the completion of the freezing stage (100 freezing cycles), the concrete specimens were surface-dried, and subsequently subjected to determination of their dimensions and weight. Afterwards, a flexural strength test and a test determining the strength in compression at the ends of the prisms were performed. Reference samples, i.e., prisms that had not been frozen, were tested to determine their dimensions, flexural strength, and strength at the ends of the prisms at the age of 28 days.
To determine the static modulus of elasticity, 2 sets of concrete prism specimens were tested. One set of test specimens (3 pieces) was used to determine the prism strength in compression and the other set (3 pieces) to determine the static modulus of elasticity in compression. The average value of prism strength in compression was applied to determine the tension used to measure the static modulus of elasticity.

2.4. Environmental Analysis

Environmental evaluation of the nontraditional concrete with steel slag as partial natural gravel aggregate replacement and the reference concretes without any slag addition was performed by using LCA SimaPro v8 software (PRé Consultants, Amersfoort, The Netherlands).
LCA methodology was standardized in ISO 14040 [46] and ISO 14044 [47] and consists of four principle steps: (1) goal and scope definition, (2) life cycle inventory (LCI), (3) life cycle impact assessment (LCIA), and (4) life cycle interpretation [48]. An important part of the 1st step of the LCA is the determination of system boundaries (interval/scope of assessment). System boundaries define the processes to be analyzed with regard to material and energy flows and emissions, thus they define and structure the technical system under assessment. This necessarily leads to a delimitation of the different processes of the system under examination [49]. The LCA analysis regarding the building materials is given in more detail in the EN 15804 standard [50]. The setting of system boundaries for material life cycle assessment is usually as follows: cradle to gate, cradle to gate with options, and cradle to grave. The functional unit (FU) is a key element of LCA, which has to be clearly defined, since it presents a quantified description of the performance requirements that the product system fulfils. It also expresses a measure of the function of the studied system and it provides a reference to which the inputs and outputs can be related [51]. The LCI inventory of inflows and outflows is to be performed over all processes that lie within the system boundaries. The quality requirements for gathered data can be defined and quality indicators can be established. Data quality requirements may address aspects such as time-, geographical-, and technology-related coverage of the included data [52]. Due to the fact they have a significant effect on the results of LCA, they have been increasingly discussed in regards to their precise definition over the years [53,54,55]. LCIA quantifies the overall impact of resource consumption and environmental emissions at different stages of a product life cycle [56]. This step consists of the mandatory elements, such as selection of impact categories, category indicators, and characterization models. Other optional LCIA elements—normalization, grouping, and weighting—may be conducted depending on the goal and scope of the LCA study [57]. The last step—the life cycle interpretation—is a systematic technique to identify, quantify, check, and evaluate information from the results of the LCI and/or the LCIA [55].
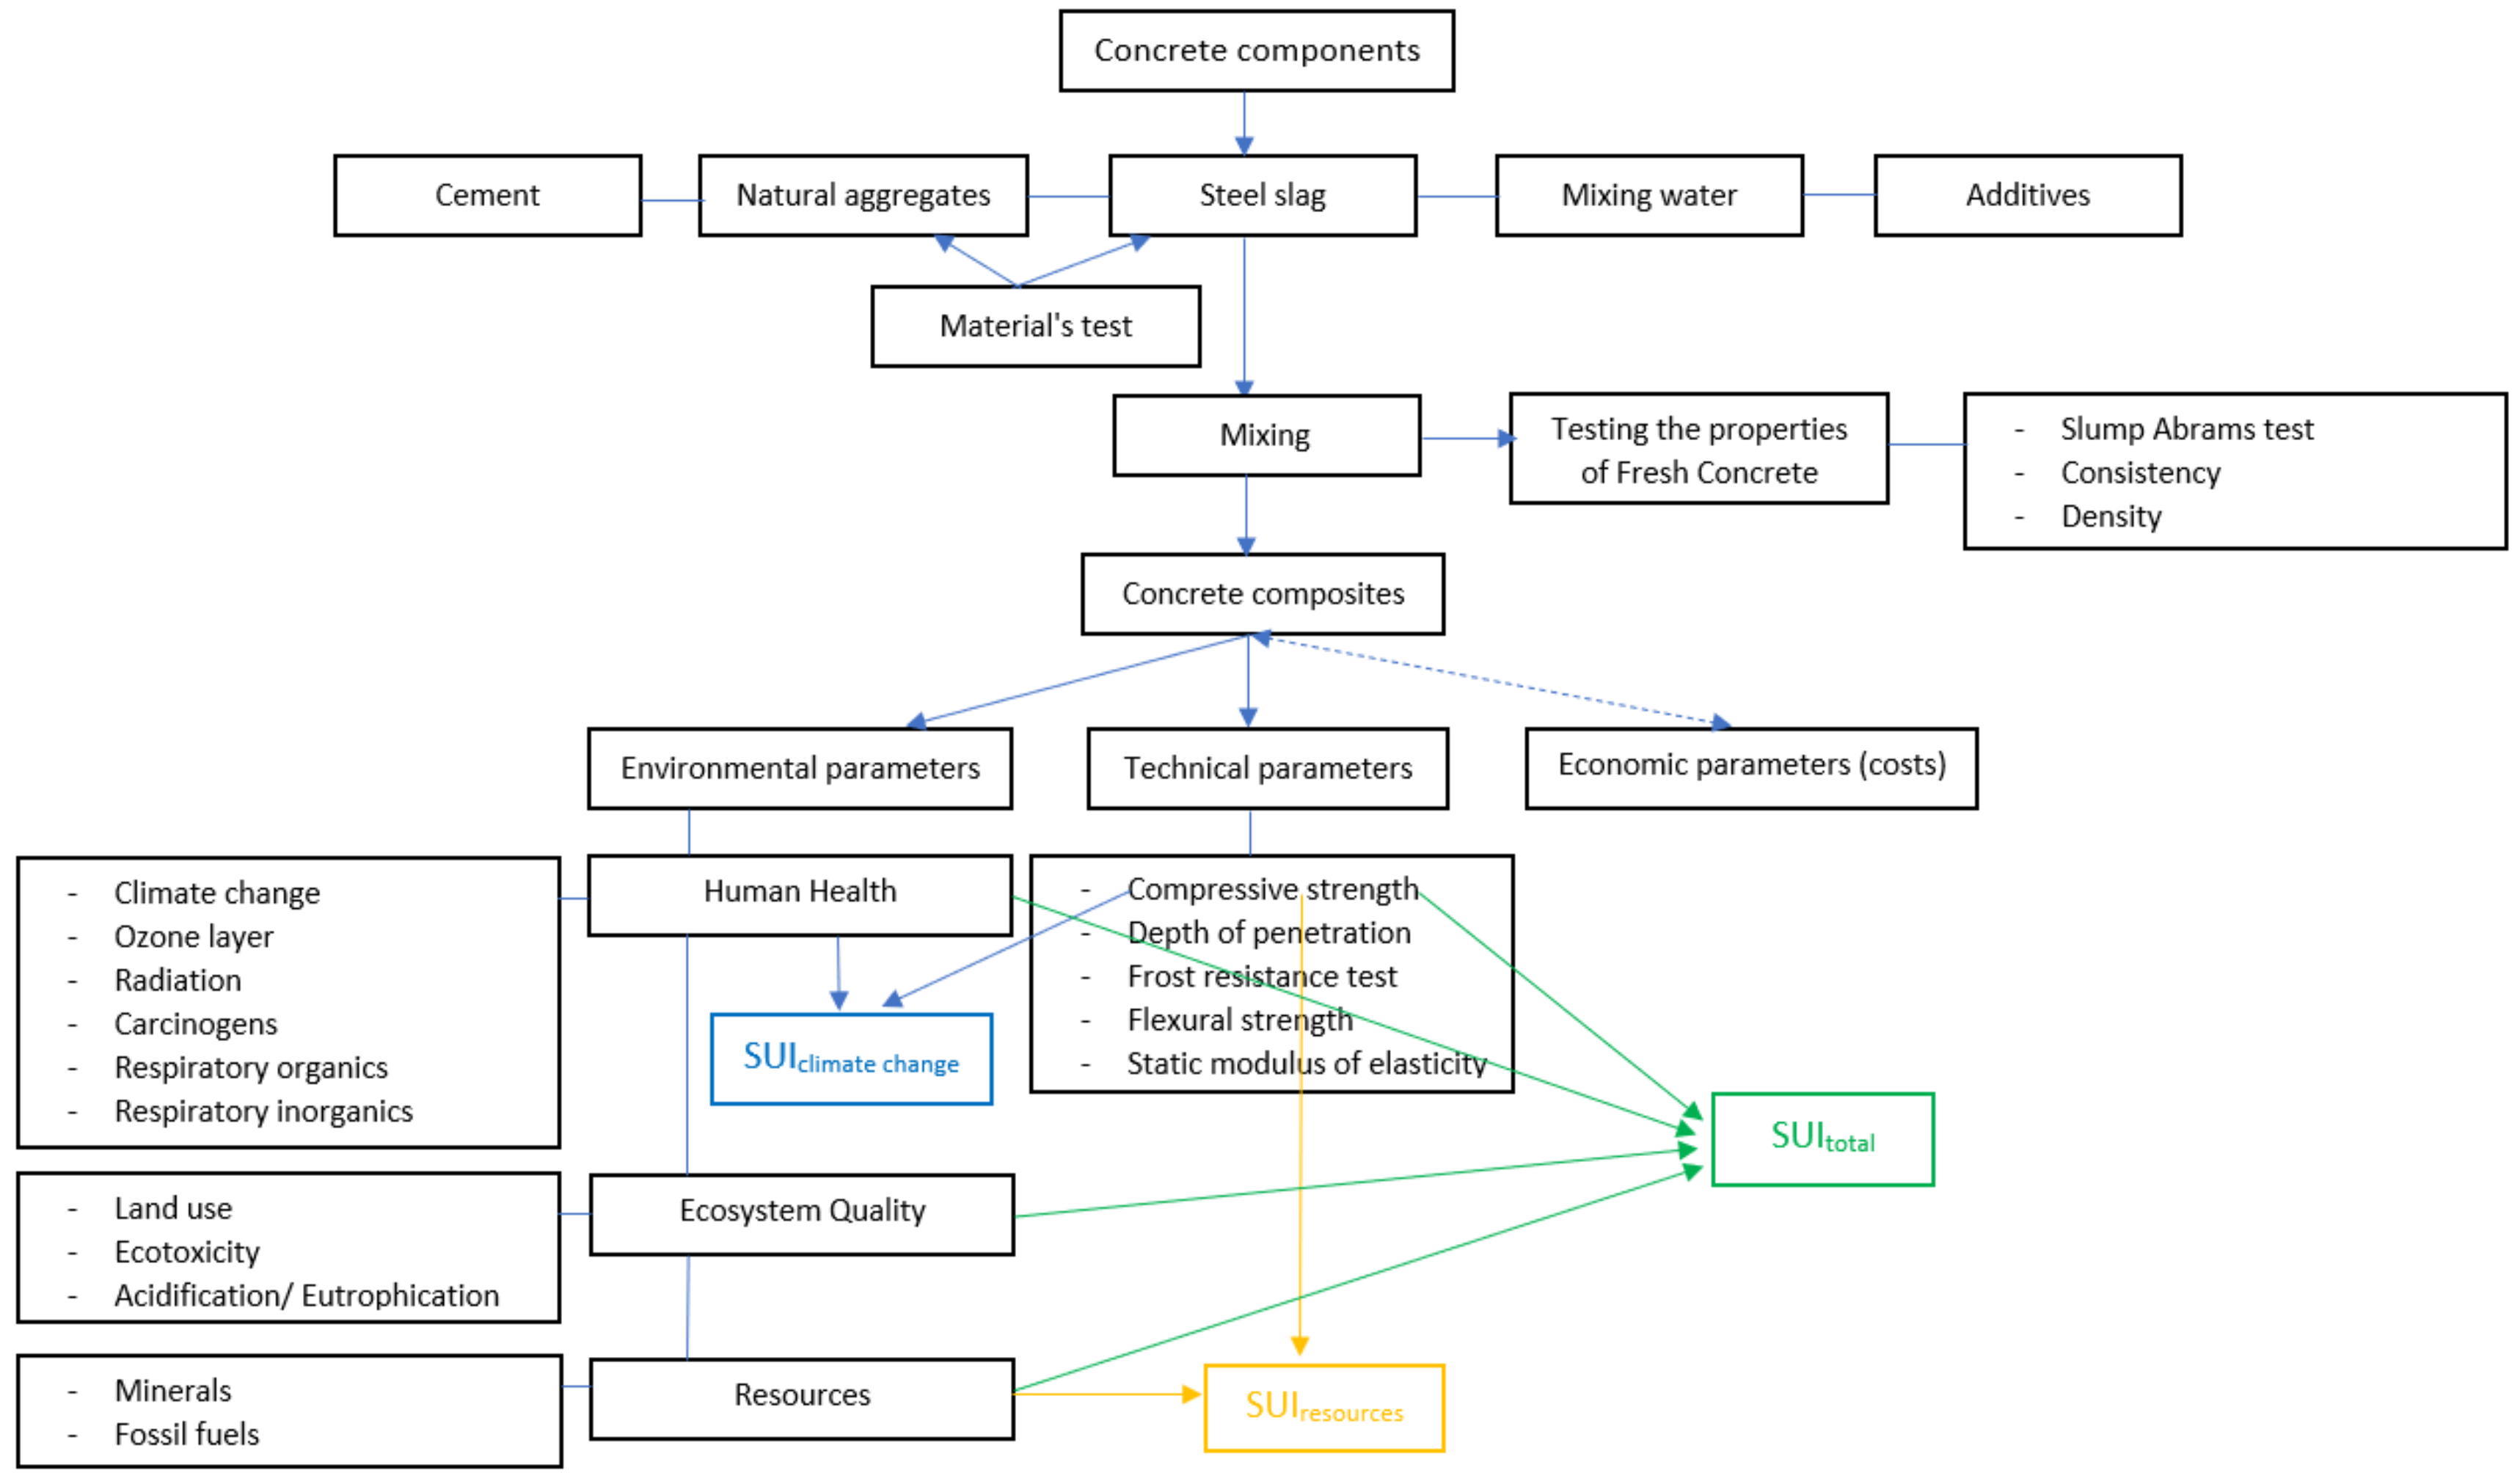
Environmental analysis, in order to determine the overall environmental impacts of the prepared concretes, was conducted using Eco-indicator 99 method [58]. This method is based on the damage approach and calculates environmental impacts in terms of damages (end points) relating to three main damage categories: human health, ecosystem quality, and resources [59]. Impact indicators, which were under consideration in the study, resulting in the mentioned damage categories, are presented in Table 3.
The functional unit of the LCA analysis was set to 1 m3 of concrete and the system boundaries were defined as cradle to gate (modules A1–A3 according to the EN 15804). The Ecoinvent database was applied to obtain the inventory data of the concrete components. The data included the life cycle from energy generation and raw material supply to the final products on the factory gate. Transports of the final materials to building site were not part of the system. The processes included in the particular data are listed below.
Unit data of Portland cement included all manufacturing processes, not excluding mixing and grinding, internal processes (transport, etc.), and infrastructure (specific machines and plant). Additional milling substances, fly ash, silica dust, and limestone were not considered as they are wastes to which no burdens are allocated within the database. The unit data regarding to natural gravel aggregates covered quarrying and treatment of the raw mineral including washing of the stone grains, which have been extracted from the repository and sorted in vibration sieves or in an upstream classifier. However, in natural aggregates data, the infrastructure and the production of the manufacturing facility were not considered.
Steel slag presented type of wastes to which no burdens were allocated within the Eco-invent database. Tap water data included the infrastructure, energy use for water treatment, and transportation to the final consumer. No emissions from water treatment were counted.
Superplasticizer’s data involved all processes related to preparation and transportation of raw materials, energy, infrastructure, and land use, as well as the generation of emissions to air. Emissions to air were considered as emanating in a high population density area. Auxiliaries, solid wastes, and emissions to water due to superplasticizer manufacturing were not included due to the lack of information. No by-products or co-products, nor storage of the final product, were considered in superplasticizer data as well.
Electricity included in all processes was selected from the database as medium voltage, average production EU. Transport included all relevant transport processes (rail and truck transport for imported bulk resources). The data used for the calculation represented the average European consumption for truck transport (EURO 6), as well as the standard EU electricity consumption for train transport. Operation of vehicle, production, maintenance, and disposal of vehicles, as well as the construction and maintenance and disposal of road, were also included. Inventory refers to the entire transport life cycle.

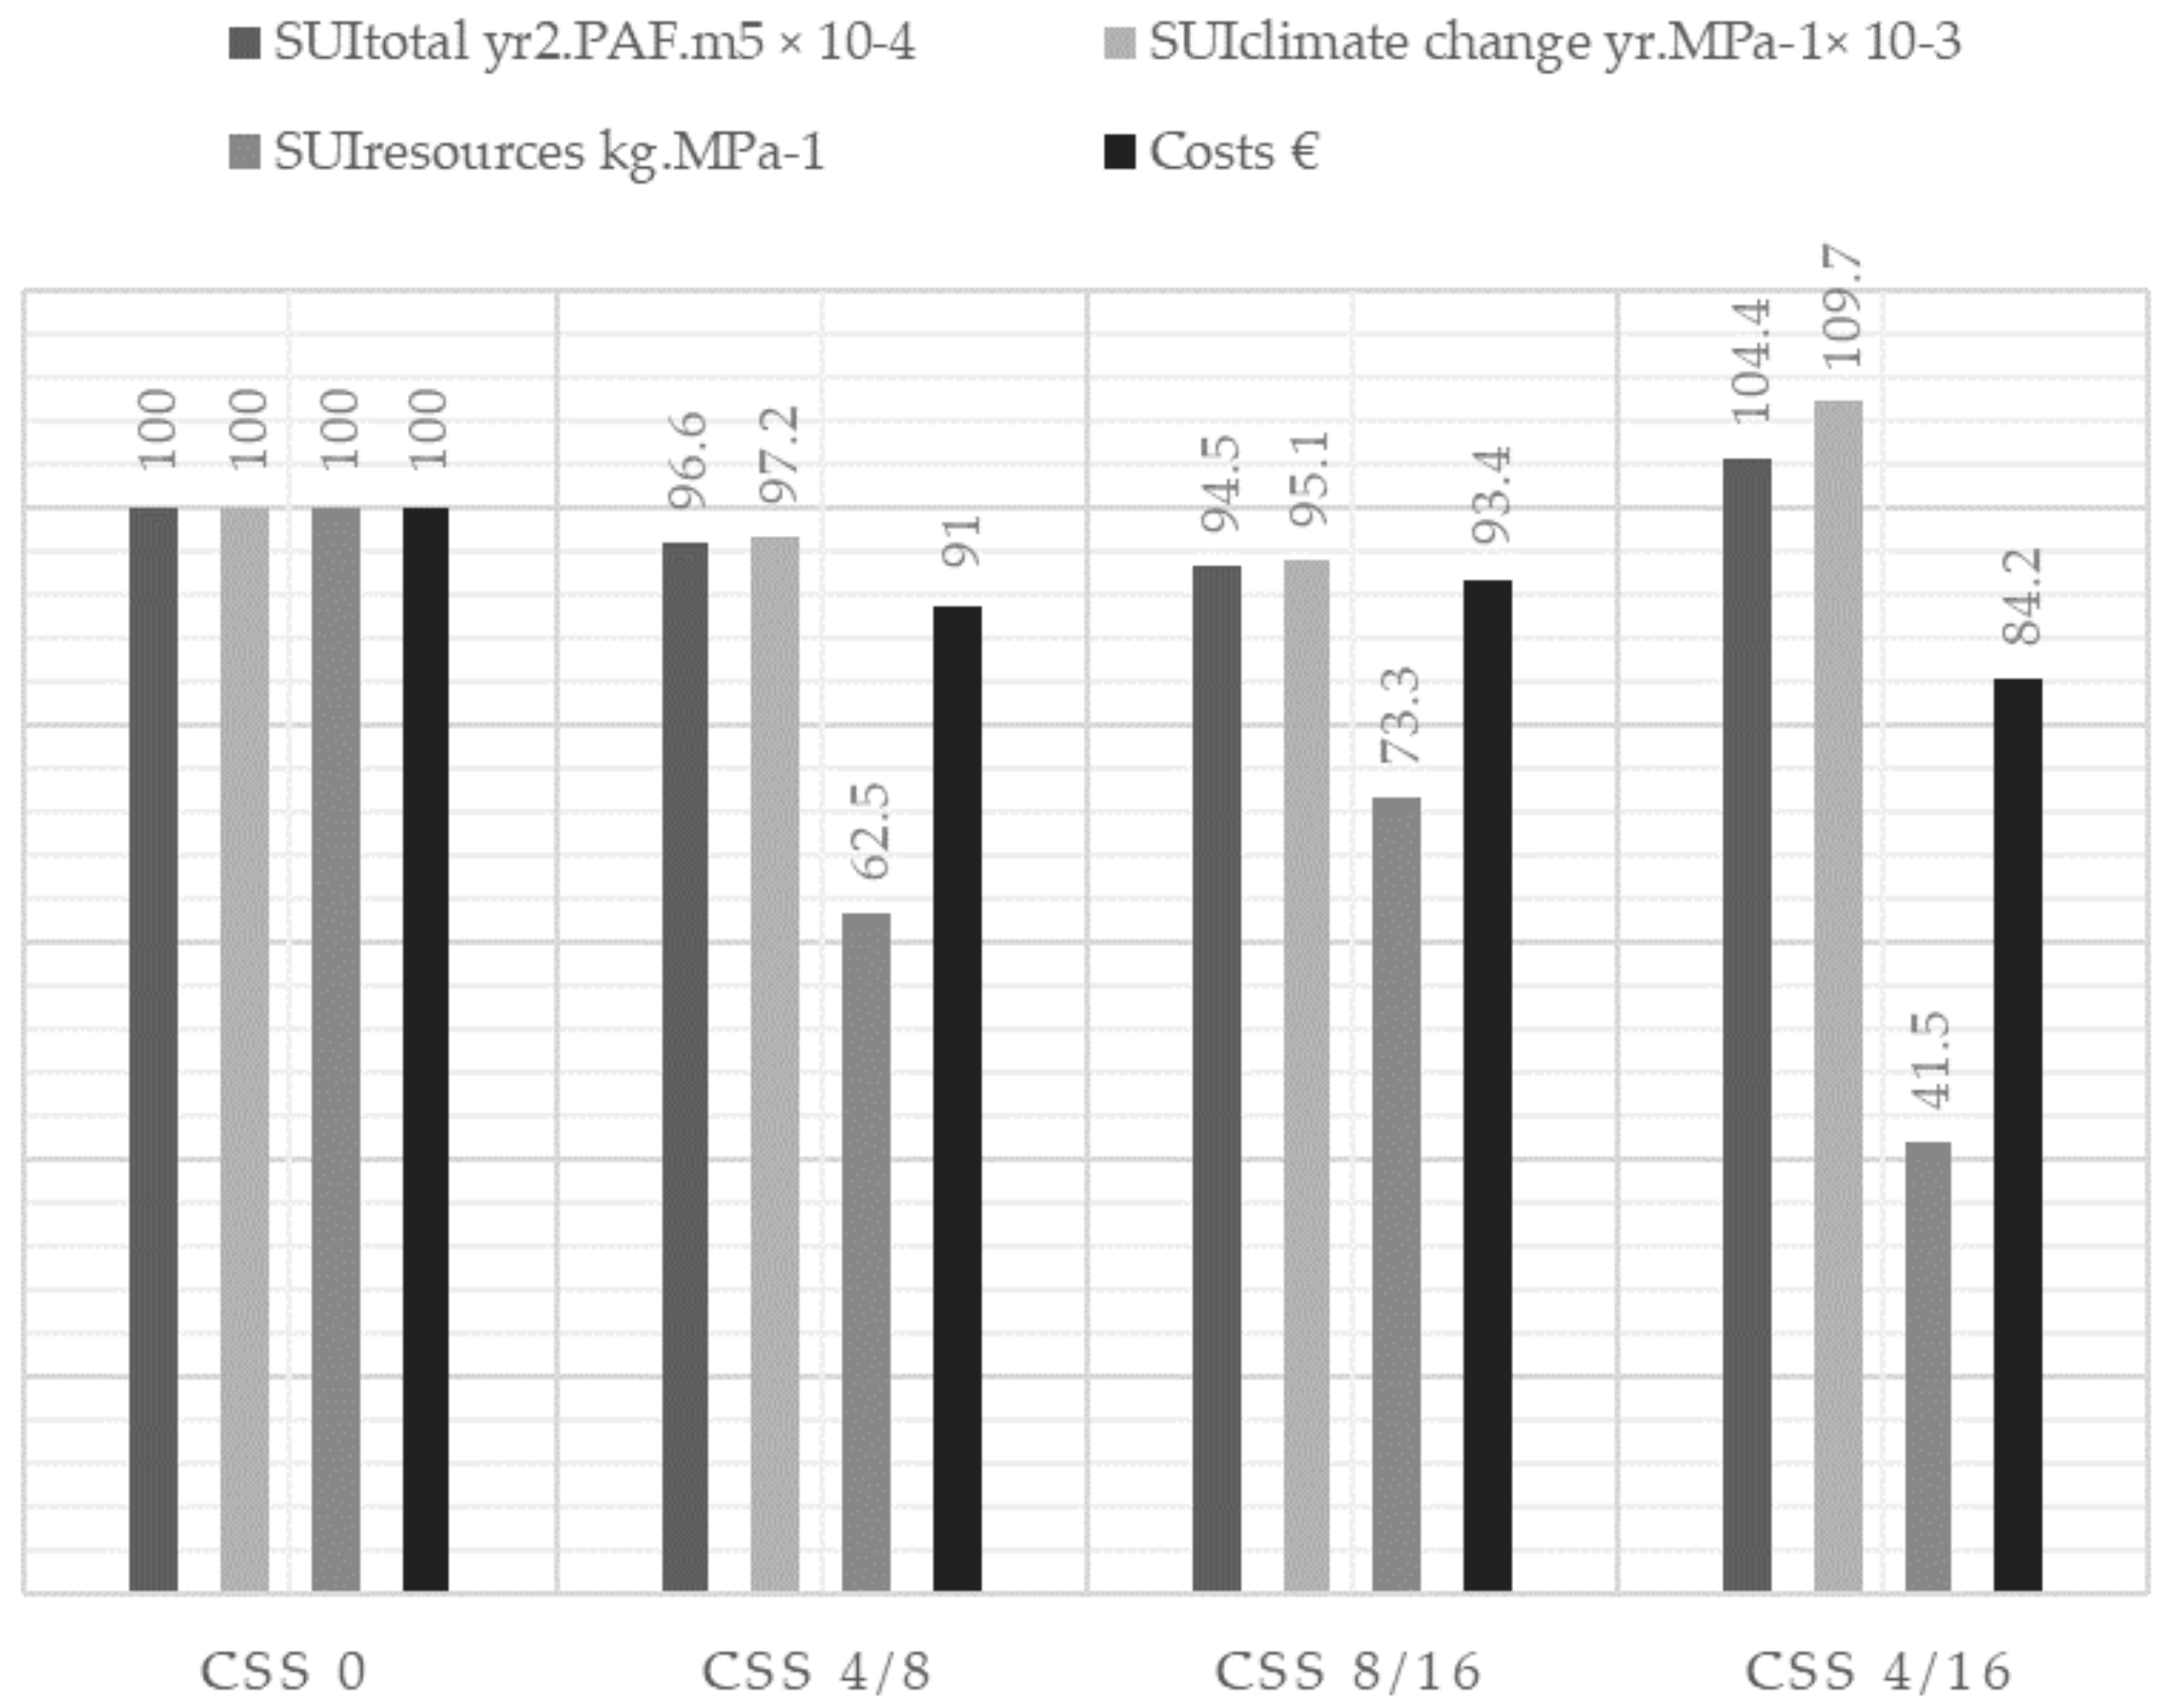
2.5. Sustainability Analysis

To assess the sustainability potential of concrete composites, the sustainability indexes (SUIclimate change, SUItotal, and SUIresources) were set according to the Equations (1)–(3), respectively. This approach was based on the current studies, in which authors have addressed the effective use of binders to reduce the negative impacts, e.g., CO2 emissions [60,61,62]. In general, a larger amount of cement binder is needed to increase the compressive strength of concrete. Thus, with increasing concrete strength, CO2 emissions also increase. Therefore, Lee et al. [63] proposed to introduce a parameter that would evaluate CO2 emissions for concretes with a binder content, which corresponds to an increase in strength of 1 MPa. Based on this philosophy, he used an indicator, which is defined as the ratio of the CO2 eq of concrete and its strength. The SUIclimate change indicator proposed in our study contains, instead of the value of CO2 eq, the value of an analogous environmental indicator expressing climate change, Equation (1).
SUI climate   change = CCh f c        yr . MPa 1
where CCh is the contribution of the concrete to climate change (DALY) and fc is the concrete compressive strength (MPa).
According to the same strategy, to evaluate the overall environmental load of concrete per 1 MPa, another indicator, SUItotal, was proposed:
SUI total = HHD   ×   EQD   × RE f c           yr 2 . PAF . m 2  
where HHD is the contribution of the concrete to human health damage (DALY), EQD is ecosystem quality value (PAF m2 yr), RE is resources extraction value (MJ), and fc is the concrete compressive strength in MPa.
On the other hand, the proposed sustainability indicators express the need for the lowest possible contribution of the evaluated mixture to environmental damage, and at the same time the best possible functionality and durability of concrete material. Therefore, the lower the value of the indicator for the analyzed mixture, the more sustainable the concrete. The SUIresources indicator is based on a similar concept of the lowest possible rate of depletion of natural resources of raw materials, and thus the highest possible replacement of natural aggregates with slag while achieving the best possible technical parameters of the resulting concrete composites. The rate of depletion of raw materials is represented by the amount of natural aggregate m(NGA) used in the concrete in kg and the technical parameters are represented by the concrete compressive strength fc (MPa) and frost resistance coefficient (FRC) of the concrete, Equation (3). The SUIresources indicator corresponds to the indicator used in [63], where the authors evaluate the binder intensity in kg to compressive strength of concrete.
SUI resources = m   NGA f c   ×   FRC          kg . MPa 1
where m(NGA) is a mass of the natural gravel aggregates in the concrete (kg), fc is the concrete compressive strength (MPa), and FRC is frost resistance coefficient.

3. Results and Discussion

3.1. Raw Material Properties Characterizing

Table 4 shows the tested characteristics of the steel slag (SS) used in the study for the natural aggregates substitution in concretes and the tested characteristics of natural gravel aggregates (NGA) as well. As expected, for the same size fractions of SS and NGA, differences in values of shape index, density, and water absorption were observed. The 24 h water absorption of the slag reached 3–4 times higher values compared to NGA. Similarly, density values of steel slag were significantly higher than those of NGA. However, found values of crushing resistance, determined by Los Angeles abrasion test, did not show significant differences for the particular fractions of SS and NGA. The shape index, calculated as the percentage of noncubical particles to the total dry mass of particles, found for the NGA was five times higher than for SS in 4/8 mm fraction and up to 30 times higher in 8/16 mm fraction. This indicated differences in shape and a higher proportion of elongated particles in NGA.
Compatibility in size of the natural aggregates and steel slag substitutes was investigated by a sieve analysis and the results are illustrated in Figure 2. The sieving tests were conducted to find the grading of the coarse fractions of NGA and SS used in this study. The fraction of 4/8 mm of steel slag proved a higher content of grains within the range of 0.1–4 mm. In spite of this, both SS and NGA curves were identical in the required interval of the grain size of 4–8 mm (Figure 2A) and the passing rates for each sieve opening size were satisfied. A higher share of fine grains within the range of 0.1–8 mm is clearly visible also in the steel slag fraction of 8/16 mm (Figure 2B). A smaller difference is clearly visible at the value of 80% of weight of overall siftings. In the case of steel slag, grains with the size of 8 mm represented the siftings value of 80% of weight; in the case of natural gravel aggregate, they were grains with the size of 10 mm. The average fineness modulus of the fractions was found to be 3.57 and 1.98 for NGA and SS, respectively.

3.2. Fresh Concrete Mixture Characteristics

The results of the slump tests and bulk density according to the replacement fraction of the SS are compared in Figure 3. All mixtures showed a low degree of workability of fresh concrete, in the range 15–40 mm, corresponding to the S1 consistence class. It is obvious that the substitution of natural gravel aggregates of 4/8 and 8/16 fractions by the same size fractions of steel slag resulted in a significant decrease of workability degree of concrete mixture, as seen in Figure 3. The consistency was measured immediately after mixing (dark grey) and also after 30 min (light grey). The decrease is linked likely to the higher portion of the fine particles and higher water absorption of the steel slag.
Based on the determination of density, it can be stated that the substitution of natural gravel aggregates by steel slag increased the density of fresh concrete mixture. The most significant increase in density, by 4.11% compared to the reference sample, was recorded in the CSS 4/16 mixture. The increase was caused by the substitution of the fractions of natural gravel aggregate with steel slag fractions of higher density. Similar results regarding the increase in the bulk density of fresh concrete mixture and the values of the slump test corresponding to the degree S1 were achieved and presented by González-Ortega et al. [64].

3.3. Physical-Mechanical Properties of Hardened Concrete

Results of the cube compressive strength tests showed that substitution of only one fraction of natural gravel aggregate by steel slag of the same fraction had not led to reduction in the initial strength of concretes (Figure 4). The CSS 4/8 and CSS 8/16 mixtures even achieved slightly higher values in the cubic compressive strength of concrete comparing to the reference sample CSS 0. The highest increase in strength (4.4%) was recorded for the sample CSS 8/16. However, a decrease in cube compressive strength was recorded for the concrete sample where there was a substitution of both fractions of natural gravel aggregates with steel slag (CSS 4/16). This decrease could be likely caused by synergic effect due to differences in the fineness modulus of NGA and SS. Nevertheless, the results of the subsequent cube compressive strength test show a linear increase in strength. After 90 days of hardening, the differences in acquired strengths were negligible and comparable to CSS 0 (47.0 MPa): CSS 4/8 (48.5 MPa), CSS 8/16 (49.0 MPa), and CSS 4/16 (46.0 MPa). Comparable results of cube compressive strength were also presented by Arribas et al. [65].
The prism compressive strength of concrete samples was considerably lower than the cube one. Comparison of cube and prism strength values is given by the ratio fc prism 28/cube 28, which varied within the range of 0.64~0.87 (Table 4). The trend of prism strength results of concretes after 28 days differed from the cube strength results. In comparison with the reference sample (CSS 0 mixture), an increase by 20.7% and 10.2% in the prism strength was observed for the CSS 4/8 and CSS 4/16 mixtures, respectively. On the contrary, a decrease of the prism strength by 5.5% compared to the reference mixture strength was found for the sample CSS 8/16.
Based on the obtained results of the depth of penetration test, it is clear that the substitution of natural gravel aggregate of 4/8 and 8/16 mm fractions by the same fractions of the steel slag is possible, without compromising the waterproof resistance of concrete. The water ingress in the steel slag-based samples reached the depths 13–19 mm (Table 5), whereas the EN standard requires the depth of penetration of water under pressure in the composite to be maximum of 50 mm. Moreover, the samples with steel slag proved the improved resistance of concrete against depth of penetration by 16 to 41%.
The largest percentage increase of water resistance of concrete compared to the reference mixture could be seen in CSS 4/8 (41%). Results showed that larger share of fine slag particles significantly influenced the depth of penetration of concrete through the structure of the composite itself. The presented conclusions are in accordance with the results of other works [66,67].
After 100 cycles of concrete freezing and thawing, it can be said that there was a decrease of all specimen’s weight, while the largest weight loss, compared to the value before freezing, was observed for the reference sample CSS 0, namely 1.01%. The weight loss of the other experimental samples, compared to the initial weight before freezing, ranged from 0.49% to 0.89%. The frost resistance coefficient of experimental concrete samples, which had been calculated as the ratio of the average value of the strength of frozen prisms in tension in bending to the value of the arithmetic average of the strength of comparative beams in tension, varied within a range of values from 0.81 to 0.97. The highest value (0.97) was achieved for the CSS 4/8 mixture. When replacing natural aggregate with steel slag of the same fraction, it was possible to observe an increase in the coefficient of frost resistance compared to the value of the coefficient of frost resistance of the reference sample for all concrete mixtures except CSS 8/16 mixture.
As for flexural strength, the results showed that the flexural strength of the reference concrete sample had reached an average value of 3.8 MPa. The percentage differences in the flexural strength of the test specimens before and after the 100 cycles of freezing were 11.28%, 3.08%, 19.06%, and 5.84% for CSS 0, CSS 4/8, CSS 8/16 and CSS 4/16, respectively. The largest decrease in the flexural strength observed for the CSS 8/16 sample also corresponded to the lowest value of the frost resistance coefficient of 0.8. According to EN standard requirements, concrete is frost resistant to such a number of cycles during which the frost resistance coefficient is not lower than 75%. As the frost resistance test of all experimental mixtures was carried out for 100 cycles, all the experimental mixtures comply with this condition.
Measured data showed that the results of the modulus of elasticity of slag-based samples reached values higher than (CSS 4/8 and CSS 4/16 mixtures) or comparable to (CSS 8/16 mixture) those measured for the reference sample. From the percentage point of view, an increase by 27% for the CSS 4/8 and by 11% for the CSS 4/16 mixtures was found. Again, it is assumed that the proportion of fine slag particles affected the bulk density of the composite and filled its structure more. Study of Santamaría et al. reported similar results in static modulus testing. The values of the modulus of elasticity ranged from 31.4 to 38.6 GPa after 180 days [67].
The presented results of physical-mechanical and deformable properties of concretes with slag substitutes (Table 6) confirmed the possibility of using slag as a partial replacement of natural aggregate of fractions 4/8 or 8/16 mm in the production of nontraditional concrete, which coincides with the results and conclusions of the other researches focused on reuse of slag in concrete [65,66,67]. In order to take into account all tested mechanical parameters, it can be stated that the best properties were achieved by concretes with replacement of the aggregate fraction 4/8 mm. These concretes can be used well for many applications, but not for all. Results of physical-mechanical tests of composites met requirements for production of prefabricated and light constructions. Concretes prepared according to the recipes mentioned above were intended to be applied and subsequently tested in real construction as prefabricated panels and road curbs.

3.4. Environmental Impacts of Concretes

Summaries of the results of environmental impacts per 1 m3 of the analyzed concrete samples are presented according to impact and damage categories in Table 6.
Figure 5 (left) illustrates changes in individual impact categories according to the substituted fraction of steel slag. It is obvious that with the SS replacement, the environmental indicators in human health damage category were reduced, except for carcinogens and respiratory organics. The most significant decrease, by almost 7%, was observed in the ozone layer category. As for the ecosystem quality damage category, improvement of environmental parameters with SS substitution was observed in the acidification/eutrophication impact category (by 3.6%) and land use. In resources, the SS substitution has had a positive effect in reducing the environmental burden in both considered categories (minerals and fossil fuels) as well, as seen in Figure 5—right).
As can be seen from the Table 6 and Figure 5, the highest environmental benefits were observed for the cement composites with the replacement of both fractions of natural aggregate with steel slag. However, the physical-mechanical parameters of these composites did not reach the best values compared to the others, where only one fraction was substituted. Therefore, sustainability indices, SUI, were calculated as defined in the Methods section by Equations (1)–(3), with compressive strength and frost resistance coefficients selected as representatives of the physical-mechanical parameters. Table 7 shows the calculated values of the sustainability indexes. The lowest value found for the particular SUI index pointed to the best sustainability performance of the concrete sample.
Evaluating the sustainability of concretes through the index, including all environmental categories together with the compressive strength (SUItotal), the sample with the substitution of 8/16 mm NGA fraction was identified to be the most sustainable. The same concrete sample (CSS 8/16) also achieved the best score according to the SUIclimate change index, which preferred the lowest possible production of greenhouse gases in order to mitigate climate change and at the same time the highest possible strength of concrete, as a parameter of material durability. The second-best score in the two mentioned indices was achieved by a concrete sample with the replacement of the NGA fraction 4/8 mm with SS. The sustainability performances of concretes with cement replacement by slag were presented in the work [68]. The authors reported that the highest sustainability rating was identified for concrete containing 40% of slag. Yang et al. [61] also investigated the concretes applying the binder content and CO2 intensities of concrete in developing the unit strength (1 MPa). The sustainability potential increased sharply with the substitution level of secondary cementitious materials. However, information on the evaluation of the sustainability of concretes with fillers (aggregates) substitution by secondary materials is rare.
A strong linear correlation (y = 0.3968x – 6.1176; R² = 0.9431) was observed between the SUItotal and SUIclimate change indexes, as seen in Figure 6a). Comparison among the replacement fraction and SUItotal and SUIclimate change are illustrated in Figure 6b,c.
The results point to the fact that replacing only one fraction of natural gravel aggregate in concrete was a more sustainable solution than replacing both fractions at once. However, if we focus only on saving natural resources, the best solution clearly appears to be to replace both fractions of NGA by SS, despite the fact that these concretes have worse physical and mechanical parameters, though are still acceptable for specific applications. The values of the SUIrecources for the concretes with the highest SS substitution were by 58.5% lower than those for the concretes with only one fraction substituted (Table 7).
As already mentioned, concretes prepared according to the recipes studied above were applied in real road construction as prefabricated panels (Figure 7) and road curbs.
The SUI indicators, calculated for the prefabricated concrete panel with dimensions 3000 mm × 1000 mm × 215 mm used for the construction of the cover layer of 1 km long road, are compared together with the price of the concrete slab in Figure 8. The total amount of concrete incorporated in the prefabricated panels was 645 m3. The price of the panels included only material costs, the construction works were not considered. The cost of the concrete material ranged from 102.8 € for a covering layer made of NGA concrete to 86 € for a concrete cover with the replacement of both fractions of NGA by SS. The costs of the concrete materials with one substituted fraction of NGA were comparable and reached 93.5 € and 96 € for the CSS 4/8 and CSS 8/16 concretes.
Since a high correlation was found between SUItotal and SUIclimate change, only SUIclimate change was selected for comparison in Figure 7. The interpretation of the results generally shows a strong subjectivity and depends on the goal of the analysis and the area of implementation. This was also confirmed in our study, comparing the results to the reference concrete. Nonconventional CSS 4/16 concrete with the substitution of both NGA fractions by SS, applied in the road covering, achieved the best score in terms of price (lower price by 19.5%) and saving of raw material resources (improvement by 43%). However, it achieved even worse SUIclimate change parameters than concrete without SS substitution. Therefore, even taking into account the price, it was confirmed that the most sustainable option is to replace one fraction of aggregate, whether fraction 4/8 or 8/16, whose sustainability parameters are comparable. Besides the environmental benefits of the steel slag incorporation, the use of natural aggregates for the production of concrete and its application on the monitored section of the road turned out to be more expensive, on average by 10 %. Transport to site was not included in the LCA; however, an additional estimation on the effectivity of secondary materials transportation in relation to the construction of the analyzed road with a length of 1 km was performed. Based on the calculated data, it can be confirmed that transport plays an important role and could limit the use of secondary raw materials in construction. According to our results, it can be specified that the maximum transportation distance, where the environmental benefits of using secondary raw materials (SS) still outweigh the negative environmental impacts of transport, is 102 km. Therefore, when using secondary raw materials, it is necessary to take into account also other factors, such as transport from the place of treatment to the construction site or the energy needed for their processing before their further use. In our further research, we want to focus more closely on these aspects.

4. Conclusions

The paper dealt with the evaluation of the sustainability of nontraditional concrete with the replacement of natural gravel aggregates by steel slag. Based on the obtained results, the following conclusions can be formulated:
  • Testing of functional and technical parameters of nontraditional concretes through their physical-mechanical properties confirmed that steel slag can be effectively applied as a substitute for a part of natural aggregate in the production of concretes with special uses. In order to take into account all tested mechanical parameters, it can be stated that the best properties were achieved by concretes with replacement of the natural aggregate fraction of 4/8 mm.
  • The results of the LCA analysis showed a reduction in the negative environmental effects of nontraditional concretes compared to concrete without natural aggregate replacement. As expected, the most significant decrease was observed in concretes with replacement of both natural aggregate fractions.
  • However, by evaluation of the sustainability potentials through the sustainability indexes stated, taking into account both mechanical and environmental parameters, findings revealed that the substitution of both fractions is not the most sustainable option. Substitution of only one fraction of natural gravel aggregate in concrete with steel slag was identified as a more sustainable solution in comparison to the both fractions substitution at once.
  • A different trend was observed in the SUItotal and SUIrecources indicators in relation to the replaced fraction, while a high linear correlation was found between the SUItotal and SUIclimate change indicators.
  • The presented study confirmed that it is necessary to take into account not only the environmental but also the technical parameters of the evaluated product when assessing sustainability.
Subsequent optimization of the use of secondary raw materials in concrete production, focusing on transport as well as on the other negative interventions, is an important research issue and will be the subject of further works.

Author Contributions

Conceptualization, V.V., M.O., and A.E.; methodology, V.V. and M.O.; software, M.O.; validation, V.V., M.O., and A.E.; formal analysis, A.E.; investigation, V.V. and M.O.; resources, T.D. and L.G.; data curation, T.D.; writing—original draft preparation, V.V. and M.O.; writing—review and editing, M.O. and A.E.; visualization, M.F.; funding acquisition, V.V. All authors have read and agreed to the published version of the manuscript.

Funding

This research was funded by the Scientific Grant Agency of the Ministry of Education, Science, Research, and Sport of the Slovak Republic and the Slovak Academy of Sciences (VEGA), grant number 1/0648/17 and the Slovak Grant Agency for Science Slovak Cultural and Education Grant Agency (KEGA), grant number 073TUKE-4/2018. This research was funded by VŠB—TUO, Faculty of Mining and Geology, grant number SP2020/30.

Conflicts of Interest

The authors declare no conflict of interest.

References

  1. Johnston, P.; Everard, M.; Santillo, D.; Robèrt, K. Reclaiming the Definition of Sustainability. Environ. Sci. Pollut. Res. Int. 2007, 14, 60–66. [Google Scholar] [PubMed]
  2. Benoît, C.; Mazijn, B. Guideline for Social Life Cycle Assessment of Products; United Nations Environment Programme: Paris, France, 2009; ISBN 9789280730210. [Google Scholar]
  3. Onat, N.C.; Kucukvar, M.; Halog, A.; Cloutier, S. Systems Thinking for Life Cycle Sustainability Assessment: A Review of Recent Developments, Applications, and Future Perspectives. Sustainability 2017, 9, 706. [Google Scholar] [CrossRef] [Green Version]
  4. United Nations Environment Programme UNEP/SETAC Life Cycle Initiative. Global Guidance Principles for Life Cycle Assessment Databases—A Basis for Greener Processes and Products—Shonan Guidance Principles; UNEP: Shonan, Japan, 2011. [Google Scholar]
  5. Junakova, N.; Junak, J. Sustainable Use of Reservoir Sediment through Partial Application in Building Material. Sustainability 2017, 9, 852. [Google Scholar] [CrossRef] [Green Version]
  6. Naqi, A.; Jang, J.G. Recent Progress in Green Cement Technology Utilizing Low-Carbon Emission Fuels and Raw Materials: A Review. Sustainability 2018, 11, 537. [Google Scholar] [CrossRef] [Green Version]
  7. Pati, P.K.; Sahu, S.K. Innovative utilization of fly ash in concrete tiles for sustainable construction. Mater. Today Proc. 2020, in press. [Google Scholar] [CrossRef]
  8. Siddique, R. Effect of fine aggregate replacement with Class F fly ash on the mechanical properties of concrete. Cem. Concr. Res. 2003, 33, 539–547. [Google Scholar] [CrossRef]
  9. Tsuji, D.; Kojima, M.; Kuroda, M.; Sakata, N. Study on the basic properties of concrete using high amount of ground-granulated blast-furnace slag. Proc. Jpn. Concr. Inst. 2013, 35, 145–150. [Google Scholar]
  10. Srinivasarao, C.; Reddy, V.B.S. Study of standard grade concrete consisting of granulated blast furnace slag as a fine aggregate. Mater. Today Proc. 2020, 27, 859–865. [Google Scholar] [CrossRef]
  11. Oren, O.H.; Gholampour, A.; Gencel, O.; Ozbakkaloglu, T. Physical and mechanical properties of foam concretes containing granulated blast furnace slag as fine aggregate. Constr. Build. Mater. 2020, 238, 117774. [Google Scholar] [CrossRef]
  12. Pasetto, M.; Baliello, A.; Pasquini, E.; Skaf, M.; Ortega-López, V. Performance-Based Characterization of Bituminous Mortars Prepared with Ladle Furnace Steel Slag. Sustainability 2020, 12, 1777. [Google Scholar] [CrossRef] [Green Version]
  13. Jia, R.; Deng, L.; Yun, F.; Li, H.; Zhang, X.; Jia, X. Effects of SiO2/CaO ratio on viscosity, structure, and mechanical properties of blast furnace slag glass ceramics. Mater. Chem. Phys. 2019, 233, 155–162. [Google Scholar] [CrossRef]
  14. Aziz, I.H.; Abdullah, M.M.A.B.; Mohd Salleh, M.A.A.; Azimi, E.A.; Chaiprapa, J.; Sandu, A.V. Strength development of solely ground granulated blast furnace slag geopolymers. Constr. Build. Mater. 2020, 250, 118720. [Google Scholar] [CrossRef]
  15. Baalamurugan, J.; Kumar, G.V.; Chandrasekaran, S.; Balasundar, S.; Venkatraman, B.; Padmapriya, R.; Raja, B.V.K. Utilization of induction furnace steel slag in concrete as coarse aggregate for gamma radiation shielding. J. Hazard. Mater. 2019, 369, 561–568. [Google Scholar] [CrossRef] [PubMed]
  16. Guo, Y.; Xie, J.; Zhao, J.; Zuo, K. Utilization of unprocessed steel slag as fine aggregate in normal- and high-strength concrete. Constr. Build. Mater. 2019, 204, 41–49. [Google Scholar] [CrossRef]
  17. Zhang, X.; Zhao, S.; Liu, Z.; Wang, F. Utilization of steel slag in ultra-high performance concrete with enhanced eco-friendliness. Constr. Build. Mater. 2019, 214, 28–36. [Google Scholar] [CrossRef]
  18. Lang, L.; Duan, H.; Chen, B. Properties of pervious concrete made from steel slag and magnesium phosphate cement. Constr. Build. Mater. 2019, 209, 95–104. [Google Scholar] [CrossRef]
  19. Václavík, V.; Dvorský, T.; Šimíček, V.; Ondová, M.; Valíček, J.; Kušnerová, M.; Gola, L. Steel slag as a substitute for natural aggregate in the production of concrete. Solid State Phenom. 2016, 244, 77–87. [Google Scholar] [CrossRef]
  20. Martauz, P.; Vaclavik, V.; Cvopa, B. The Use of Steel Slag in Concrete. In Proceedings of the 1st International Conference on Advances in Environmental Engineering (AEE 2017), Ostrava, Czech Republic, 28–30 November 2017; IOP Conference Series Earth and Environmental Science. IOP Publishing Ltd: Bristol, UK, 2017; Volume 92. [Google Scholar]
  21. Roslan, N.H.; Ismail, M.; Khalid, N.H.A.; Muhammad, B. Properties of concrete containing electric arc furnace steel slag and steel sludge. J. Build. Eng. 2020, 28, 101060. [Google Scholar] [CrossRef]
  22. Fauzi, R.T.; Lavoie, P.; Sorelli, L.; Heidari, M.D.; Amor, B. Exploring the Current Challenges and Opportunities of Life Cycle Sustainability Assessment. Sustainability 2019, 11, 636. [Google Scholar] [CrossRef] [Green Version]
  23. Guinée, J. Life Cycle Sustainability Assessment: What Is It and What Are Its Challenges? In Taking Stock of Industrial Ecology; Clift, R., Druckman, A., Eds.; Springer: Cham, Switzerland, 2016. [Google Scholar] [CrossRef] [Green Version]
  24. Kamali, M.; Hewage, K. Life cycle performance of modular buildings: A critical review. Renew. Sustain. Energy Rev. 2016, 62, 1171–1183. [Google Scholar] [CrossRef]
  25. Curran, M.A. Life Cycle Assessment. In Kirk-Othmer Encyclopedia of Chemical Technology; Wiley-Interscience: Hoboken, NJ, USA, 2016; pp. 1–28. [Google Scholar]
  26. Kono, J.; Ostermeyer, Y.; Wallbaum, H. Trade-Off between the Social and Environmental Performance of Green Concrete: The Case of 6 Countries. Sustainability 2018, 10, 2309. [Google Scholar] [CrossRef] [Green Version]
  27. Palod, R.; Deo, S.V.; Ramtekkar, G.D. Utilization of waste from steel and iron industry as replacement of cement in mortars. J. Mater. Cycles Waste Manag. 2019, 21, 1361–1375. [Google Scholar] [CrossRef]
  28. Tait, M.W.; Cheung, W.M. A comparative cradle-to-gate life cycle assessment of three concrete mix designs. Int. J. Life Cycle Assess. 2016, 21, 847–860. [Google Scholar] [CrossRef] [Green Version]
  29. British Standards Institution. EN 933-1, (2012). In Tests for Geometrical Properties of Aggregates—Part 1: Determination of Particle Size Distribution—Sieving Method; British Standards Institution: Milton Keynes, UK, 2012. [Google Scholar]
  30. British Standards Institution. EN 933-3, (2012). In Tests for Geometrical Properties of Aggregates—Part 3: Determination of Particle Shape—Flakiness Index; British Standards Institution: Milton Keynes, UK, 2012. [Google Scholar]
  31. British Standards Institution. EN 1097-2, (2010). In Tests for Mechanical and Physical Properties of Aggregates—Part 2: Methods for the Determination of Resistance to Fragmentation; British Standards Institution: Milton Keynes, UK, 2010. [Google Scholar]
  32. British Standards Institution. EN 1097-6, (2013). In Tests for Mechanical and Physical Properties of Aggregates—Part 6: Determination of Particle Density and Water Absorption; British Standards Institution: Milton Keynes, UK, 2013. [Google Scholar]
  33. British Standards Institution. EN 1097-7, (2008). In Tests for Mechanical and Physical Properties of Aggregates—Part 7: Determination of the Particle Density of Filer—Pyknometer Method; British Standards Institution: Milton Keynes, UK, 2008. [Google Scholar]
  34. Slovenski Inštiut za Standardizacijo–SIST. EN 1097-3, (1999). In Tests for Mechanical and Physical Properties of Aggregates—Part 3: Determination of Loose Bulk Density and Voids; SIST: Ljubljana, Slovenia, 1999. [Google Scholar]
  35. Czech Standards Institute. ČSN 72 1180, (1968). In Determination of Different Particles in Aggregates; Czech office for standards, metrology and testing: Prague, Czech Republic, 1968. [Google Scholar]
  36. Slovenski Inštiut za Standardizacijo–SIST. EN 1367-2, (2010). In Tests for Thermal and Weathering Properties of Aggregates—Part 2: Magnesium Sulfate Test; SIST: Ljubljana, Slovenia, 2010. [Google Scholar]
  37. Czech Standards Institute. ČSN 73 1322, (1969). In Determination of Frost Resistance of Concrete; Czech office for standards, metrology and testing: Prague, Czech Republic, 1969. [Google Scholar]
  38. Slovenski Inštiut za Standardizacijo–SIST. EN 933-8, (2012). In Tests for Geometrical Properties of Aggregates—Part 8: Assessment of Fines—Sand Equivalent Test; SIST: Ljubljana, Slovenia, 2012. [Google Scholar]
  39. British Standards Institution. EN 1744-1, (2013). In Tests for Chemical Properties of Aggregates—Part 1: Chemical Analysis; British Standards Institution: Milton Keynes, UK, 2013. [Google Scholar]
  40. Slovenski Inštiut za Standardizacijo–SIST. EN 12350-2, (2009). In Testing Fresh Concrete—Part 2: Slump-Test; SIST: Ljubljana, Slovenia, 2009. [Google Scholar]
  41. Slovenski Inštiut za Standardizacijo–SIST. EN 12390-3, (2009). In Testing Hardened Concrete—Part 3: Compressive Strength of Test Specimens; SIST: Ljubljana, Slovenia, 2009. [Google Scholar]
  42. European Committee for Standardization. ISO 4012, (1994). In Concrete—Determination of Compressive Strength of Test Specimens; European Committee for Standardization: Brussels, Belgium, 1994. [Google Scholar]
  43. Slovenski Inštiut za Standardizacijo–SIST. EN 12390-5, (2009). In Testing Hardened Concrete—Part 5: Flexural Strength of Test Specimens; SIST: Ljubljana, Slovenia, 2009. [Google Scholar]
  44. Slovenski Inštiut za Standardizacijo–SIST. EN 12390-8, (2009). In Testing Hardened Concrete—Part 8: Depth of Penetration of Water under Pressure; SIST: Ljubljana, Slovenia, 2009. [Google Scholar]
  45. Czech Standards Institute. ČSN ISO 6784, (1993). In Concrete-Determination of Static Modulus of Elasticity in Compression; Czech office for standards, metrology and testing: Prague, Czech Republic, 1993. [Google Scholar]
  46. European Committee for Standardization. ISO 14040:2006. In Environmental Management. Life Cycle Assessment—Principles and Framework; European Committee for Standardization: Brussels, Belgium, 2006. [Google Scholar]
  47. Slovenski Inštiut za Standardizacijo–SIST. ISO 14044:2006. In Environmental Management. Life Cycle Assessment—Requirements and Guidelines; SIST: Ljubljana, Slovenia, 2006. [Google Scholar]
  48. Zampori, L.; Saouter, E.; Castellani, V.; Schau, E.; Cristobal, J.; Sala, S. Guide Forinterpreting Life Cycle Assessment Result; Publications Office of the European Union: Luxembourg, 2016. [Google Scholar] [CrossRef]
  49. Büchel, K. System Boundaries. In Life Cycle Assessment (LCA)—Quo Vadis? Schaltegger, S., Ed.; Themenhefte Schwerpunktprogramm Umwelt; Birkhäuser: Basel, Switzerland, 1996. [Google Scholar]
  50. British Standards Institution. EN 15804 (2012). In Sustainability of Construction Works—Environmental Product Declarations—Core Rules for the Product Category of Construction Products; British Standards Institution: Milton Keynes, UK, 2012. [Google Scholar]
  51. Kim, S.J.; Kara, S.; Hauschild, M.Z. Functional unit and product functionality—addressing increase inconsumption and demand for functionality in sustainability assessment with LCA. Int. J. Life Cycle Assess. 2017, 22, 1257–1265. [Google Scholar] [CrossRef] [Green Version]
  52. Ghattas, R.; Gregory, J.; Olivetti, E.; Greene, S. Life Cycle Assessment for Residential Buildings: A Literature Review and Gap Analysis, Massachusetts Institute of Technology. 2013. Available online: https://cshub.mit.edu/sites/default/files/documents/LCAforResidentialBuildings.pdf (accessed on 24 November 2020).
  53. Tillman, A.M.; Ekvall, T.; Baumann, H.; Rydberg, T. Choice of system boundaries in life cycle assessment. J. Clean. Prod. 1994, 2, 21–29. [Google Scholar] [CrossRef] [Green Version]
  54. Khasreen, M.; Banfill, P.; Menzies, G. Life-cycle assessment and the environmental impact of buildings: A review. Sustainability 2009, 1, 674–701. [Google Scholar] [CrossRef]
  55. Li, T.; Zhang, H.; Liu, Z.; Ke, Q.; Alting, L. A system boundary identification method for life cycle assessment. Int. J. Life Cycle Assess. 2014, 19, 646–660. [Google Scholar] [CrossRef]
  56. Tuladhar, R.; Yin, S. Sustainability of using recycled plastic fiber in concrete. In Use of Recycled Plastics in Eco-Efficient Concrete; Series in Civil and Structural Engineering; Woodhead Publishing: Duxford, UK, 2019; pp. 441–460. [Google Scholar] [CrossRef]
  57. Trusty, W. An Overview of Life Cycle Assessments. ICC Build. Saf. J. 2010, 8. Available online: http://www.athenasmi.org/wp-content/uploads/2012/05/BSJ_overview_life_cycle_assessment.pdf (accessed on 24 November 2020).
  58. Hernandez, P.; Oregi, X.; Longo, S.; Cellura, M. Chapter 4—Life-Cycle Assessment of Buildings. In Handbook of Energy Efficiency in Buildings; Elsevier: Amsterdam, The Netherlands, 2019; pp. 207–261. [Google Scholar]
  59. Bare, J.C.; Hofstetter, P.; Pennington, D.W.; De Haes, H.A.U. Midpoints versus endpoints: The sacrifices and benefits. Int. J. Life Cycle Assess. 2000, 5, 319. [Google Scholar] [CrossRef] [Green Version]
  60. Damineli, B.L.; Kemeid, F.M.; Aguiar, P.S.; John, V.M. Measuring the eco-efficiency of cement use. Cem. Concr. Compos. 2010, 32, 555–562. [Google Scholar] [CrossRef]
  61. Yang, K.H.; Jung, Y.B.; Cho, M.S.; Tae, S.H. Effect of supplementary cementitious materials on the reduction of CO2 emissions from concrete. J. Clean. Prod. 2015, 103, 774–783. [Google Scholar] [CrossRef]
  62. Yang, K.H.; Song, J.K.; Song, K.I. Assessment of CO2 reduction of alkali-activated concrete. J. Clean. Prod. 2013, 39, 265–272. [Google Scholar] [CrossRef]
  63. Lee, J.; Lee, T.; Jeong, J.; Jeong, J. Sustainability and Durability Assessment Analysis of High Volume PCC Ash Based Concrete. Sustainability 2020, 12, 3520. [Google Scholar] [CrossRef]
  64. González-Ortega, M.A.; Segura, I.; Cavalaro, S.H.P.; Toralles-Carbonari, B.; Aguado, A.; Andrello, A.C. Radiological protection and mechanical properties of concretes with EAF steel slags. Constr. Build. Mater. 2014, 51, 432–438. [Google Scholar] [CrossRef]
  65. Arribas, I.; Vegas, I.; San-José, J.T.; Manso, J.M. Durability studies on steelmaking slag concretes. Mater. Des. 2014, 63, 168–176. [Google Scholar] [CrossRef]
  66. Manso, J.M.; Polanco, J.A.; Losañez, M.; González, J.J. Durability of concrete made with EAF slag as aggregate. Cem. Concr. Compos. 2006, 28, 528–534. [Google Scholar] [CrossRef]
  67. Santamaría, A.; Ortega-López, V.; Skaf, M.; CHica, J.A.; Manso, J.M. The study of properties and behavior of self-compacting concrete containing Electric Arc Furnace Slag (EAFS) as aggregate. Ain Shams Eng. J. 2020, 11, 231–243. [Google Scholar] [CrossRef]
  68. Rahla, K.M.; Mateus, R.; Bragança, L. Comparative sustainability assessment of binary blended concretes using Supplementary Cementitious Materials (SCMs) and Ordinary Portland Cement (OPC). J. Clean. Prod. 2019, 220, 445–459. [Google Scholar] [CrossRef]
Figure 1. Methodology flow of the study.
Sustainability 12 09873 g001
Figure 2. Grain fineness curves of natural aggregates and steel slag for the fractions (A) 4/8 mm, (B) 8/16 mm.
Sustainability 12 09873 g002
Figure 3. Results of consistency and bulk density tests of fresh concrete mixtures.
Sustainability 12 09873 g003
Figure 4. Results of compressive strength, depth of penetration of water under pressure, and frost resistance of hardened concrete samples.
Sustainability 12 09873 g004
Figure 5. Percentage comparisons of the environmental parameters of the concretes with the NGA replacement by SS in the human health damage category (left) and ecosystem quality and resource damage categories (right).
Sustainability 12 09873 g005
Figure 6. Correlation between (a) SUItotal and SUIclimate change indexes; (b,c) comparison among sustainability indicators and the replacement fractions.
Sustainability 12 09873 g006
Figure 7. Scheme of an experimental road composition using studied CSS.
Sustainability 12 09873 g007
Figure 8. Percentage comparison of the sustainability indexes (SUI) and costs of the prefabricated panels made of the analyzed concretes.
Sustainability 12 09873 g008
Table 1. X-ray fluorescence analysis (XRF) chemical analysis of steel slag.
OxidesConcentration (%)Absolute Error (%)
CaO49.30.02
SiO213.50.02
Fe2O322.10.02
Al2O31.490.007
MgO1.20.02
MnO4.10.007
Other8.36
Table 2. Characteristics of Portland cement CEM I 42.5 R.
Parameter Value
Compressive strength—after 2 days [MPa]≥20.0
Compressive strength—after 28 days [MPa]42.5–62.5
Setting time [min.]≥60
Volume stability [mm]≤10.0
Insoluble residues [wt. %]≤5.0
Loss on ignition [wt. %]≤5.0
Content of sulphates (as SO3) [wt. %]≤4.0
Content of chlorides [wt. %]≤0.1
Table 3. Damage categories and impact categories with their geographical scale under study.
Damage CategoryImpact CategoryGeographical Scale
Human healthClimate changeglobal
Ozone layer depletionglobal
Radiationlocal
Carcinogenslocal
Respiratory inorganicslocal
Respiratory organicsregional, local
Ecosystem qualityLand uselocal
Ecotoxicityregional
Acidification/eutrophicationregional
ResourcesMinerals extraction effectsglobal, regional
Fossil fuels extraction effectsglobal, regional
Table 4. Results of testing the properties of the steel slag (SS) and natural gravel aggregates (NGA).
ParameterFraction 0/4 mmFraction 4/8 mmFraction 8/16 mm
NGASSNGASSNGA
Shape index SI [wt. %]-210131
Crushing resistance—Los Angeles abrasion test [wt. %]-23232517
Water absorption (24 h) WA24 [wt. %]-1.70.61.80.4
Apparent specific density ρa [kg·m−3]-3440273031602700
Bulk specific gravity of samples dried in the oven ρrd [kg·m−3]-3260269029902670
Bulk specific gravity ρssd [kg·m−3]-3300270030502680
Particle density (specific gravity) ρf [kg·m−3]--328032903280
Bulk density ρb [kg·m−3]17101630123015101360
Content of impurities [wt. %]0.00.00.00.00.0
Freeze-thaw resistance—magnesium sulfate test [wt. %]--1-4
Freeze-thaw resistance—sodium sulphate test [wt. %]----0.9
Sand equivalent value [wt. %]94----
Organic substances Not presentNot presentNot presentNot presentNot present
Table 5. Results of physical-mechanical parameters of hardened concrete after 28 days.
MixturePrism/Cube Strength Ratio fc, Prism 28/fc, Cube 28Depth of Penetration under Water Pressure (mm)Flexural Strength (MPa)Frost Resistance CoefficientModulus of Elasticity (GPa)
1 RC2 FC
CSS 00.71233.903.460.8925.8
CSS 4/80.84133.893.770.9735.3
CSS 8/160.64193.833.100.8125.5
CSS 4/160.87173.773.550.9429.0
1 RC—reference composite; 2 FC—composite exposed to frost resistance test.
Table 6. Total environmental impacts of concrete composites according to the damage and impact categories per 1 m3 of the concretes.
Damage CategoryImpact CategoryUnitCSS 0CSS 4/8CSS 8/16CSS 4/16EB(CSS 0 –CSS 4/8)**EB(CSS 0–CSS 8/16)**EB(CSS 0—CSS 4/16)**
Human Health DALY*1.52 × 10−41.51 × 10−41.51 × 10−41.48 × 10−40.01 × 10−40.01 × 10−40.04 × 10⁻⁴
Climate changeDALY*6.32 × 10−56.29 × 10−56.29 × 10−56.24 × 10−50.03 × 10−50.03 × 10−50.08 × 10⁻⁵
Ozone layerDALY*1.08 × 10−81.05 × 10−81.05 × 10−81.01 × 10−80.03 × 10−80.03 × 10−80.07 × 10⁻⁸
RadiationDALY*5.66 × 10−75.59 × 10−75.59 × 10−75.49 × 10−70.07 × 10−70.07 × 10−70.17 × 10⁻⁷
CarcinogensDALY*1.06 × 10−51.06 × 10−51.06 × 10−51.06 × 10−5000
Respiratory organicsDALY*8.45 × 10−88.45 × 10−88.45 × 10−88.30 × 10−8000.15 × 10−8
Respiratory inorganicsDALY*7.76 × 10−57.65 × 10−57.65 × 10−57.44 × 10−50.11 × 10−50.11 × 10−50.33 × 10⁻⁵
Ecosystem Quality PAF m2 yr*15.9916.0416.0415.86−0.05−0.050.13
Land usePAF m2 yr*0.900.820.820.810.080.080.09
EcotoxicityPAF m2 yr*12.012.1712.1712.05−0.17−0.17−0.05
Acidification/EutrophicationPAF m2 yr*3.093.053.052.980.030.030.11
Resources MJ surplus*95.0594.1894.1892.180.870.872.87
MineralsMJ surplus*1.461.451.451.450.010.010.01
Fossil fuelsMJ surplus*93.5992.7392.7390.730.860.862.86
* DALY = disability adjusted life years; PAF m2 yr = potentially affected fraction of plant species; MJ surplus = additional energy required to compensate for lower future ore grade; ** EB represents the net environmental benefit, i.e., the absolute numerical value by which the environmental impact in the individual categories has improved compared to the reference sample
Table 7. Sustainability indexes per 1 m3 of the concretes.
Sustainability IndexUnitCSS 0CSS 4/8CSS 8/16CSS 4/16Min–Max
SUItotalyr2 PAF m5 × 10−452.550.749.654.85.2
SUIclimate changeyr MPa−1 × 10−314.414.013.715.82.1
SUIresourceskg MPa−150.131.336.720.829.3
Publisher’s Note: MDPI stays neutral with regard to jurisdictional claims in published maps and institutional affiliations.

