Possibilities of BIM-FM for the Management of COVID in Public Buildings


1
Departamento de Ingeniería Civil: Construcción, E.T.S de Ingenieros de Caminos, Canales y Puertos, Universidad Politécnica de Madrid, 28040 Madrid, Spain
2
Departamento de Ingeniería y Morfología del Terreno, E.T.S de Ingenieros de Caminos, Canales y Puertos, Universidad Politécnica de Madrid, 28040 Madrid, Spain
*
Author to whom correspondence should be addressed.
Sustainability 2020, 12(23), 9974; https://0-doi-org.brum.beds.ac.uk/10.3390/su12239974
Submission received: 22 October 2020
/
Revised: 23 November 2020
/
Accepted: 25 November 2020
/
Published: 28 November 2020
(This article belongs to the Special Issue Integration of Building Information Modelling (BIM) into Facility Management: towards Sustainability)
Abstract
:The COVID-19 pandemic, with more than 49.7 million reported cases and over 1.2 million deaths globally confirmed deaths at the time of writing, demands global action to counteract this virus. It is widely accepted that COVID-19 is a long-term pandemic that will require a constant and innovative range of mitigation approaches to protect public health. This paper provides infrastructure facility management (FM) systems based on Building Information Modeling (BIM) to reduce the likelihood of COVID-19 infections indoors. Although there are several factors for dealing with COVID-19, the sole focus of this project is to reduce crowding and facilitate social distancing between occupants. The significance of this research relies on the use of mathematical methods, BIM, programming as well as FM tools and databases to achieve safer management of large and populated public buildings during the COVID-19 pandemic. The infrastructure management example refers to the Civil Engineering School at the Universidad Politécnica de Madrid. It is based on mathematical applications to find the paths of people paths inside the infrastructure and is synchronized with in-house developed software and the Internet domain as source and input data.
1. Introduction
The COVID-19 crisis has become a worldwide challenge, with a total accumulated 49.7 million confirmed cases at the time of writing. Around the world, this pandemic has resulted in one of the biggest crises in human history. The most affected nations are far from the end of the struggle, and a return to normality in countries with harsh self-isolation policies faces the potential risk of a resurgence in the number of infectious cases. It is necessary to begin thinking of a long-term strategy and attempt to apply technology to overcome this situation. In this paper, some measures are described based on the Building Information Modeling (BIM) facility management (FM) methodology to face the spread of COVID-19 in complex buildings, such as educational, airport or hospital infrastructures. This paper describes some measures based on the campus of Universidad Politécnica de Madrid (UPM), specifically at the Civil Engineering School (ETSICCP). The main objective of this study was to apply mathematical tools combined with synchronized BIM-based FM technologies for the management of COVID-19 safety measures in large public buildings such as ETSICCP. To achieve this goal, a tridimensional infrastructure model of the ETSICCP was used [1]. With this framework, this paper aimed to implement an internal management system in complex buildings under pandemic situations. This target houses a global technological process where new technologies, such as BIM, FM, IoT or Big Data, were considered to develop a new infrastructure management system.
COVID-19 arose from the SARS-CoV-2 virus, and the first cases were identified in the Chinese city of Wuhan in December of 2019. Its expansion across the world is reminiscent of the so-called Spanish Flu epidemic of 1918–1919, the “deadliest plague in history” [2], which was classified as the third leading probable cause of death [3].
The spread of COVID-19 has resulted in a loss of production in many companies and affected consumer patterns. The International Monetary Fund expects China’s Gross National Product (GNP) to slow down by 0.4 percentage points compared to its initial growth target of 5.6%, causing a global growth drop of 0.1 percentage points [2].
2. COVID-19 Crisis
2.1. Situation in the World
2.1.1. First Semester of 2020
The COVID-19 pandemic is studied daily and controlled by official institutions. This paper uses the official data of Situation Report 111 of the World Health Organization (WHO) from May 10, 2020 [4] as a source of information for the evolution of the pandemic in the first semester of 2020, and the situation report of the WHO as a source of information for the second semester of 2020 to identify the evolution of COVID-19.
The fight against COVID-19 is far from being over. Many cases are currently appearing daily worldwide, predominantly in Europe and the Americas, as has been the case since May and June 2020. After this date, as pandemic response measures in many European countries were introduced, this tendency reversed, and the Americas became the region with the highest number of new daily cases worldwide. The official situation report by the WHO [4] is presented in Table 1.
As can be seen, in just 24 h, the deaths in Europe increased by 1319 cases, with 25,608 more infections than on 9 May, 2020. Table 2 collects the total number of cases and the total new cases from 9 to 10 May in some European countries.
Spain has risen to the top of the table in Europe, above Italy, with more than five thousand total confirmed cases. However, Spain shows one of the lowest rates in terms of daily cases, only below countries such as France and Germany.
2.1.2. Second Semester of 2020
Concerning the evolution of the pandemic from June to November 2020, the curves, as expected, show analogous trends than those shown for May. Table 3 and Table 4 show the situation at the time of writing according to the situation report of the WHO on 11 November.
Global cases have increased by more than 45 million. In terms of deaths, over one million deaths have been confirmed. In Spain, total cases have increased by more than one million, and total deaths have increased by more than 12,000. With this context, the management of educational buildings, such as ETSICCP, is of great relevance to provide services with the highest quality possible in accordance with health and safety measures.
2.2. Spain Situation
At the time of writing, the situation in Spain and some of the measures taken are being reported by a number of official publications and in research articles. An example is “The Resilience of the Spanish Health System against the COVID-19 Pandemic,” which summarizes the initial situation in Spain and the considered measures divided into application blocks [6].
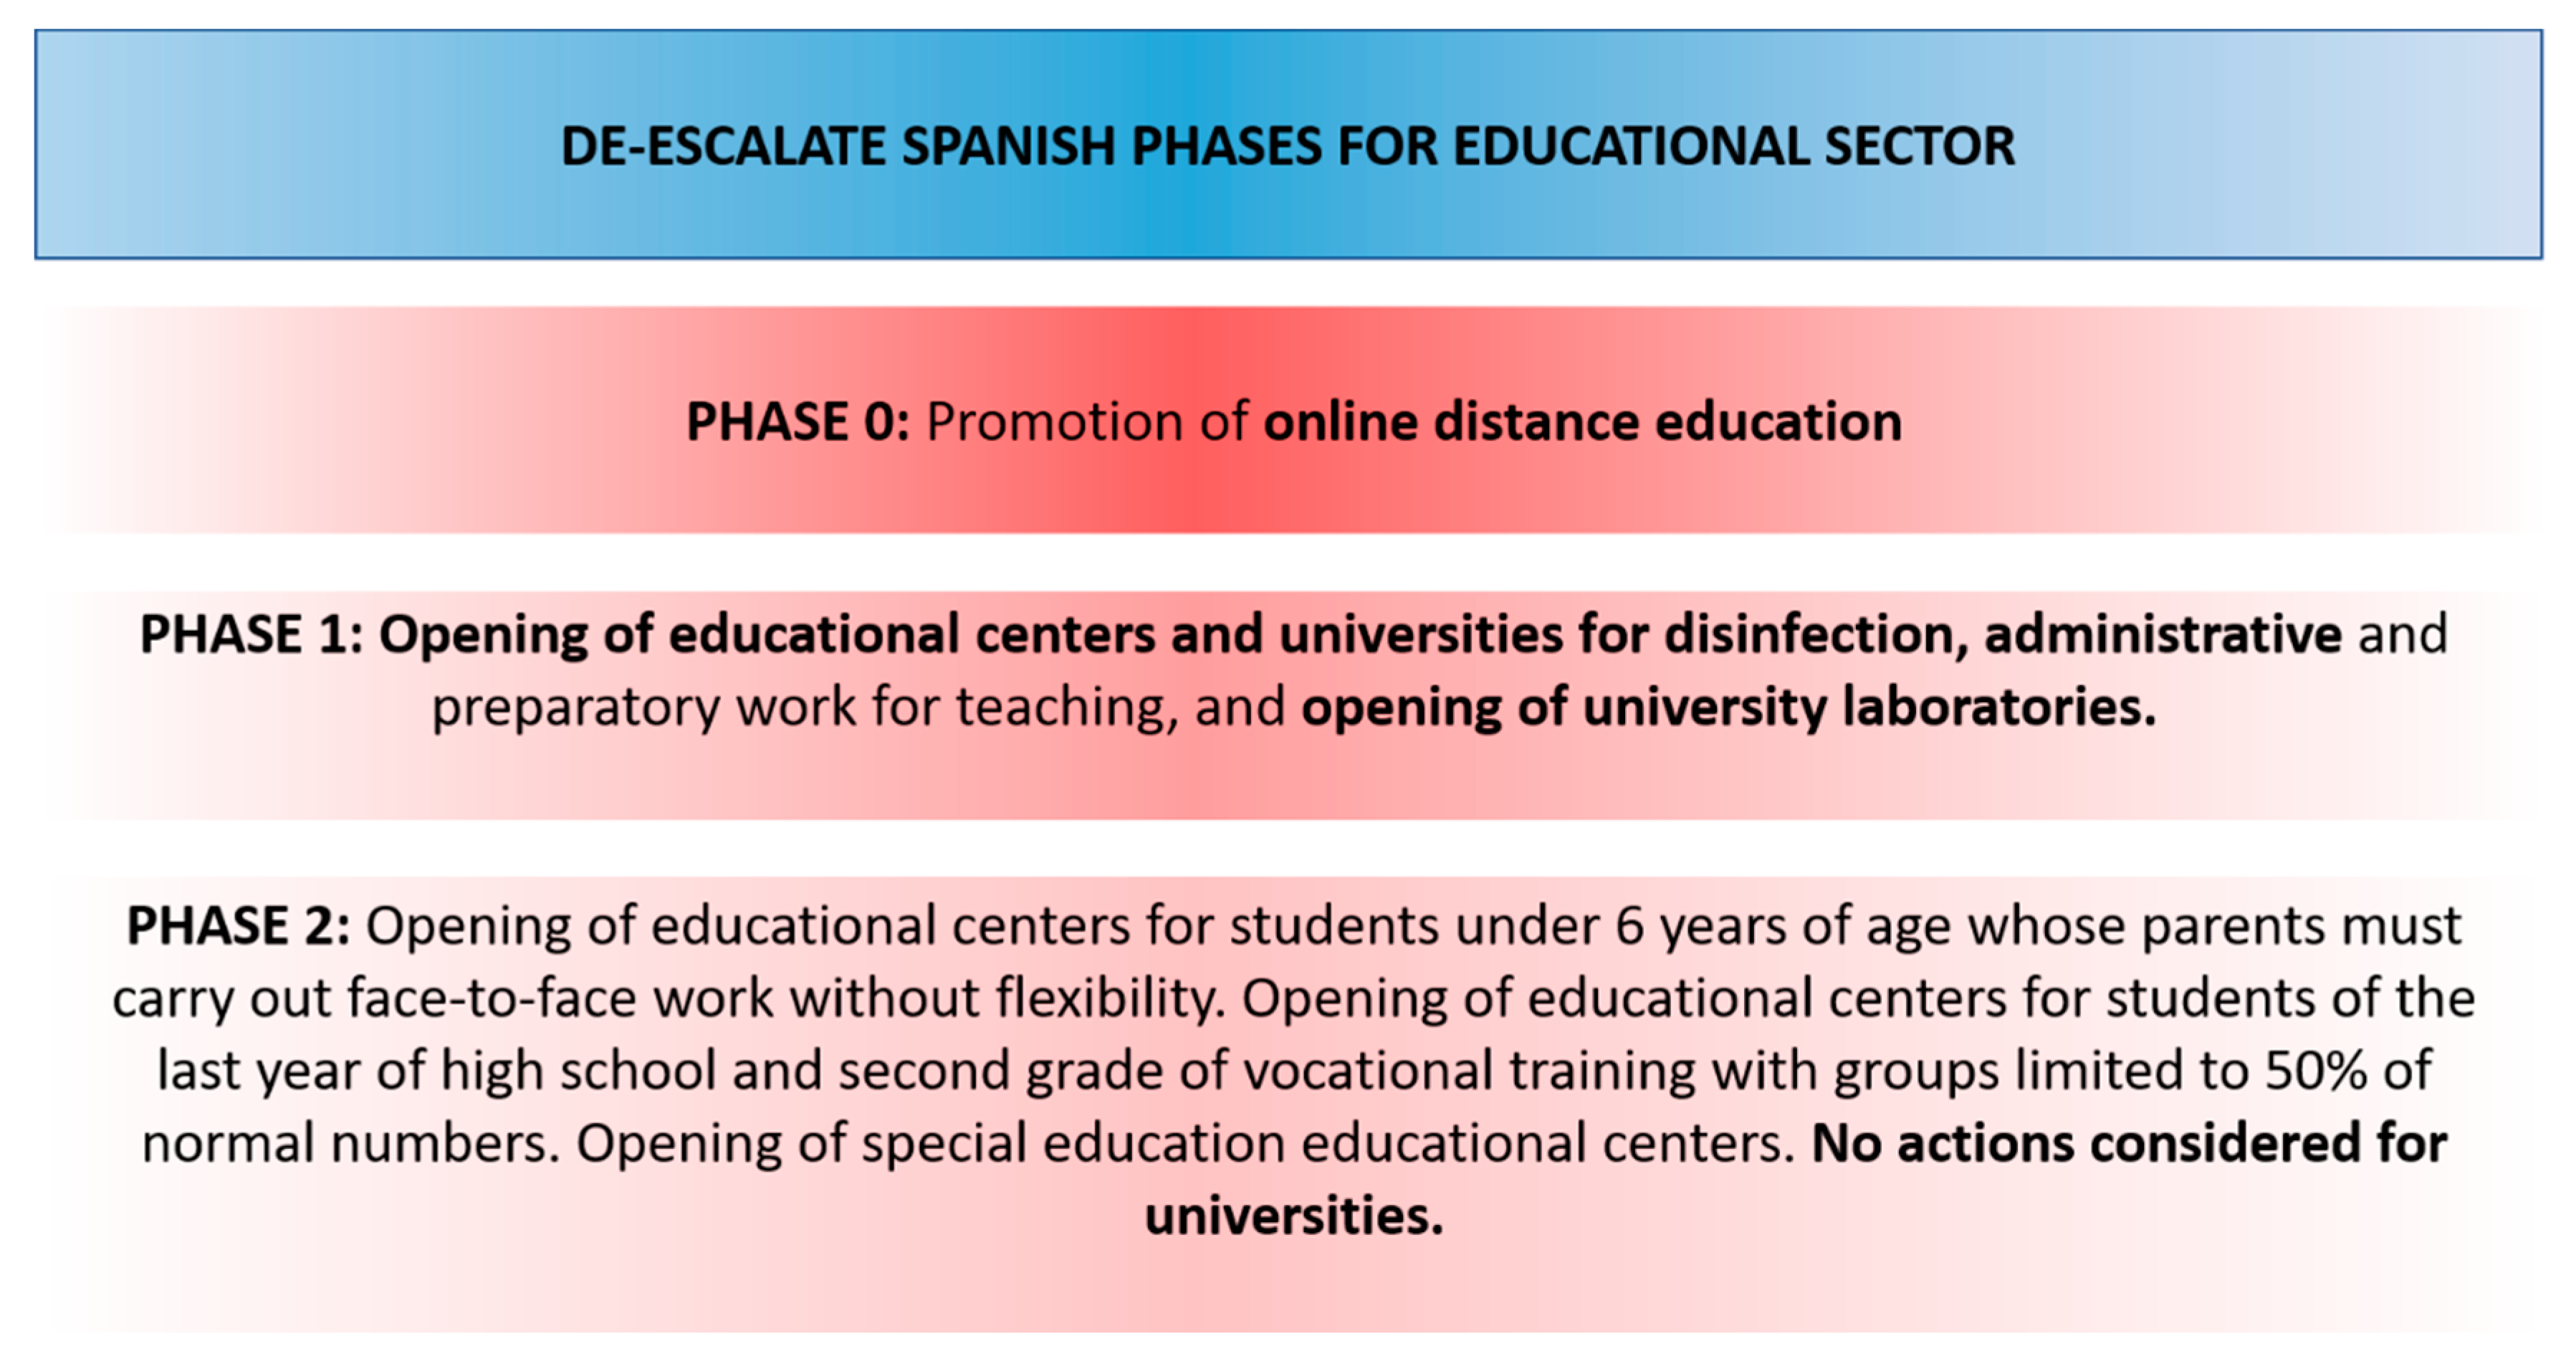
With more than 7000 new daily COVID-19 infection cases, the Spanish government used a royal decree (463/2020) to declare a 15-day national emergency, starting on 15 March, 2020 [6]. The national emergency was extended until June. During this period, there was the establishment by decree of the Health Alert and Emergency Coordination Spanish Center as a mechanism for coordination between national and regional governments for hiring graduates without qualified specialization. New phases to gradually de-escalate the current measures are being considered. As the aim of this paper is to provide a BIM model to assist in the COVID-19 crisis. The most relevant information about the abovementioned phases is presented in Figure 1 [7].
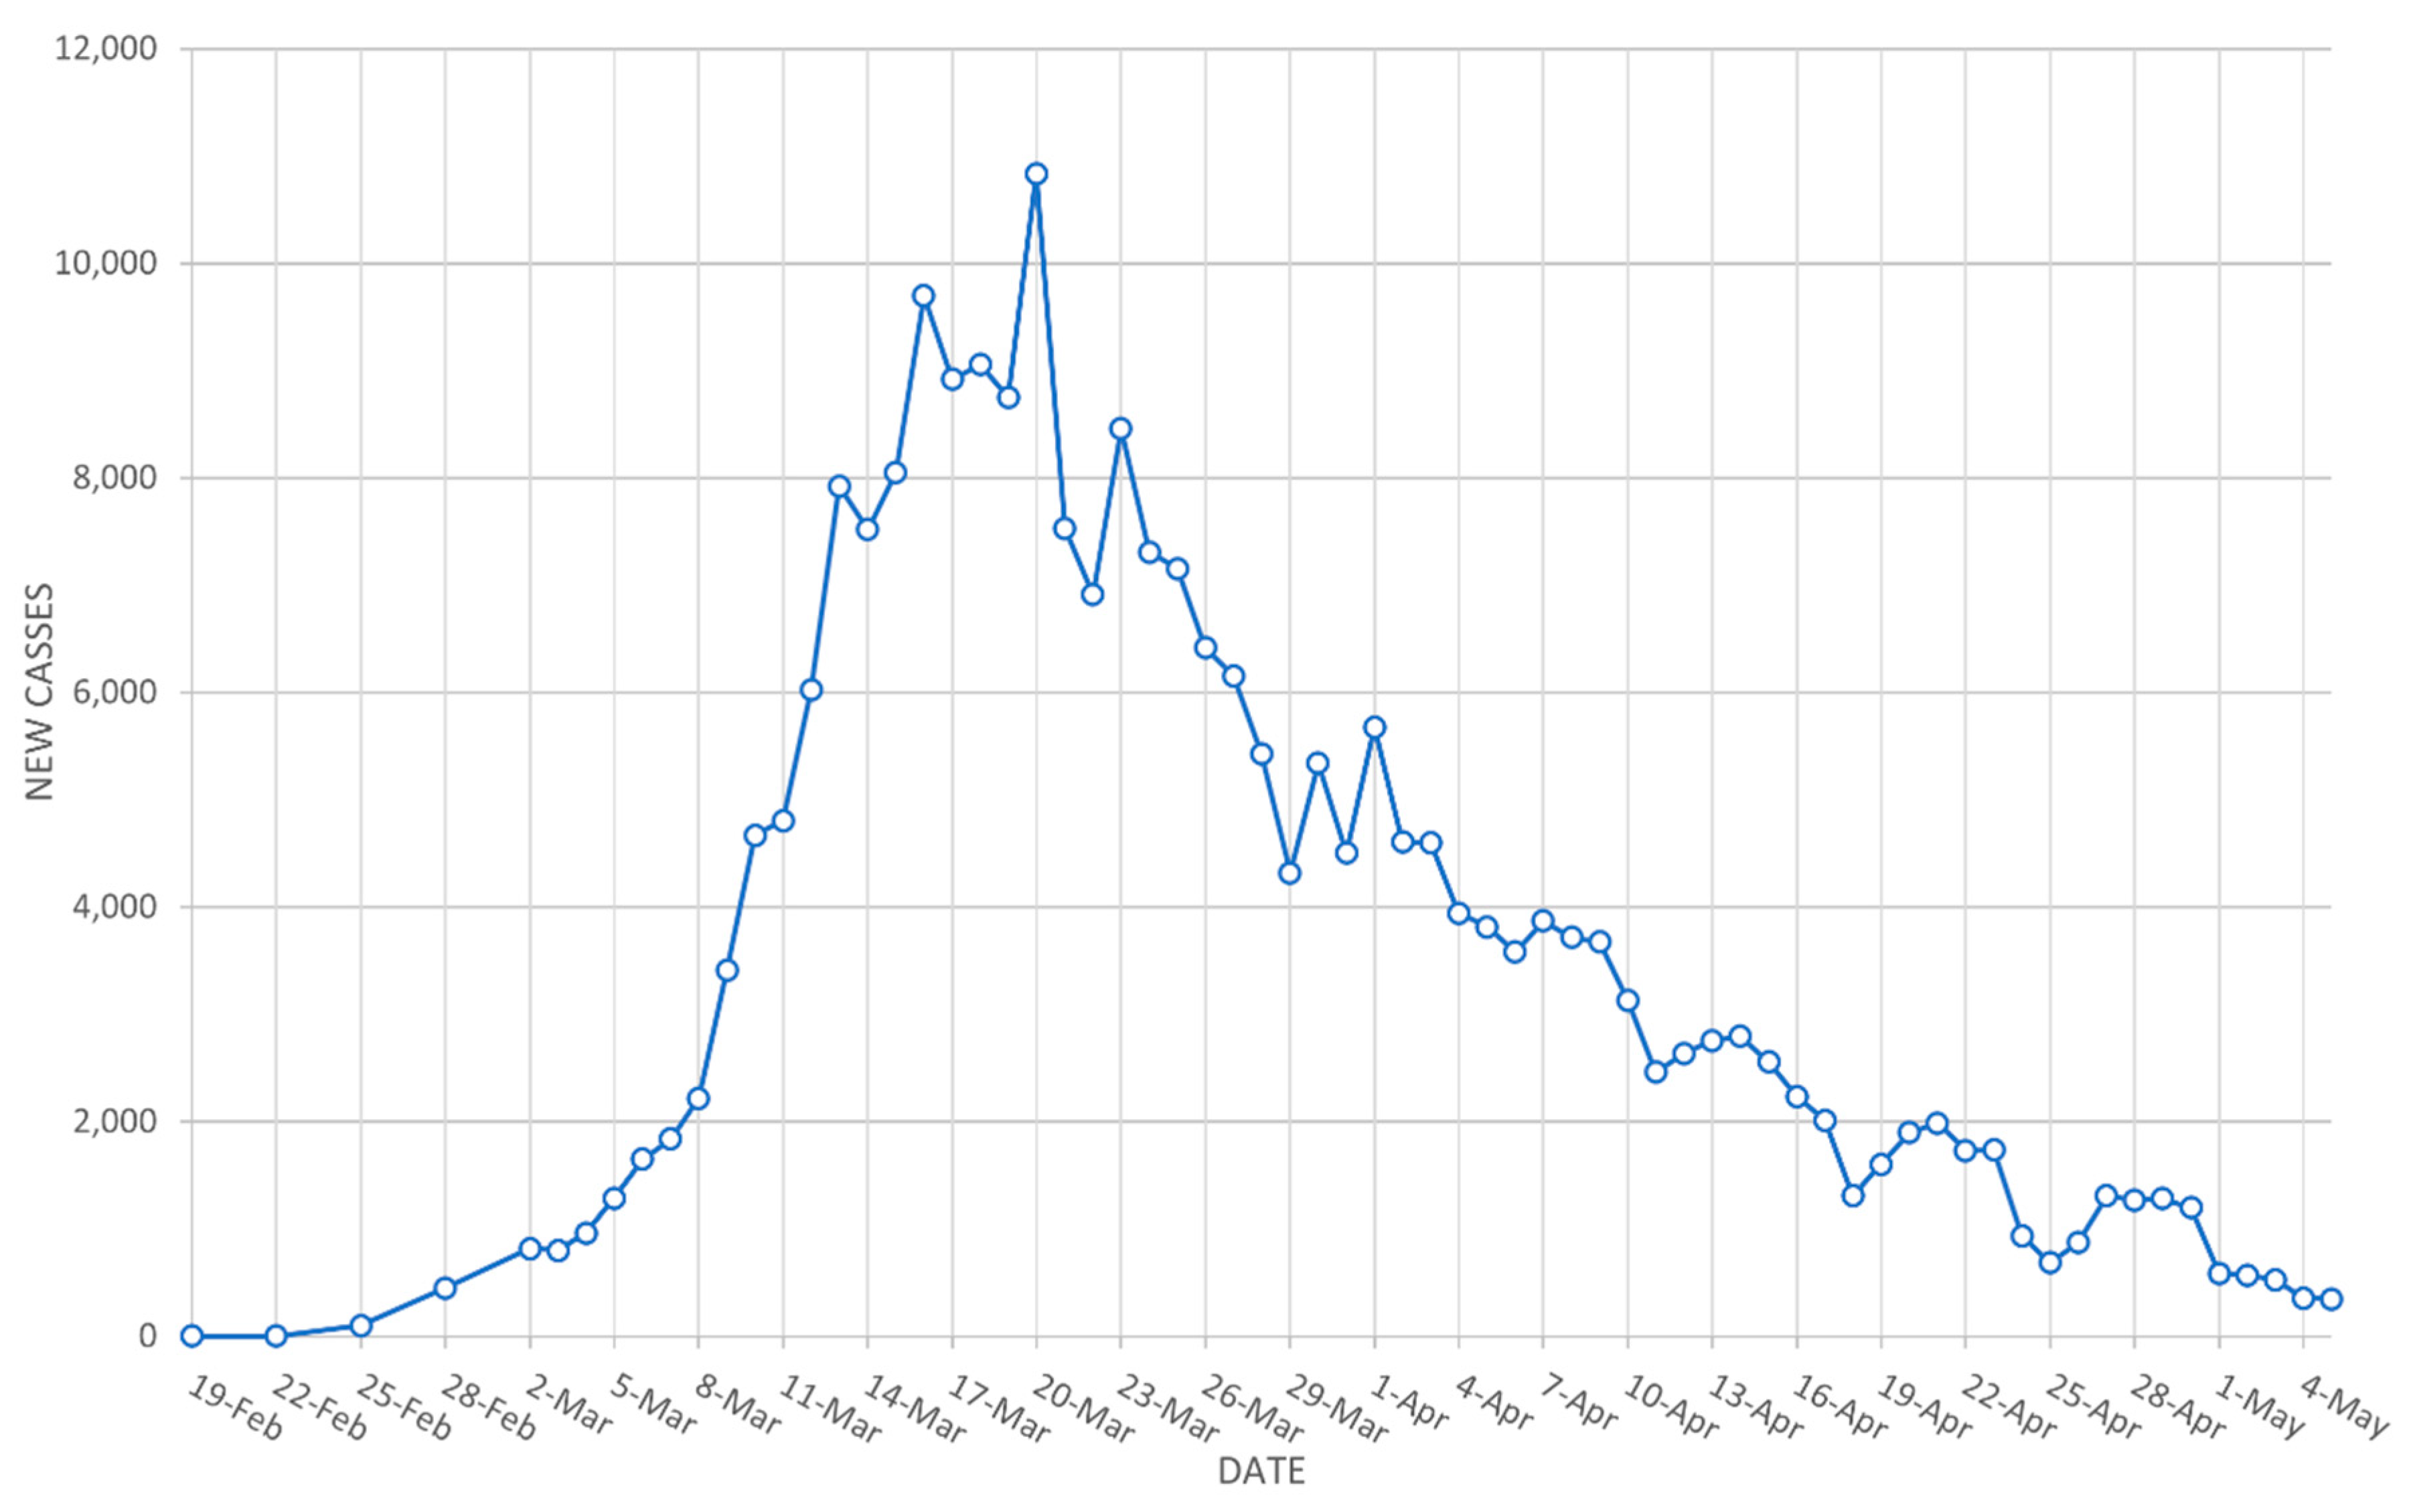
The first case in Spain was discovered on 24 February, and nearly one month later, on 14 March, approximately 8000 new daily cases were reached. By 18 March, just four days later, the country augmented its daily rate of new cases from 8000 to 9000. This trend continued until 20 March, when more than new 10,000 daily cases were registered, which was precisely the turning point and the peak of the daily cases curve in Spain. Thereafter, the curve started to decrease, with fewer than 6000, 4000 and 2000 new daily cases reported on 7 April, 11 April and 25 April, respectively, as can be seen in Figure 2.
The state of emergency was implemented on 15 March when there were more than 2000 new daily cases. However, the curve did not change its tendency until six days after its implementation on 21 March. The Spanish new daily cases curve is very similar to other European countries such as Italy, which was proclaimed after China as the greatest source of infection.
Although the threshold of 2000 new daily cases was exceeded by Italy on 13 May, Spain broke that figure just four days later, on 17 March. A big difference is observed in the highest peaks: whereas Italy presents two days, 20 and 26 March, with more than 6000 new daily cases, Spain only shows one peak, albeit with more than 8000 new daily cases. From those peaks, both countries showed a decrease until reaching the current situation, with fewer than 800 new daily cases.
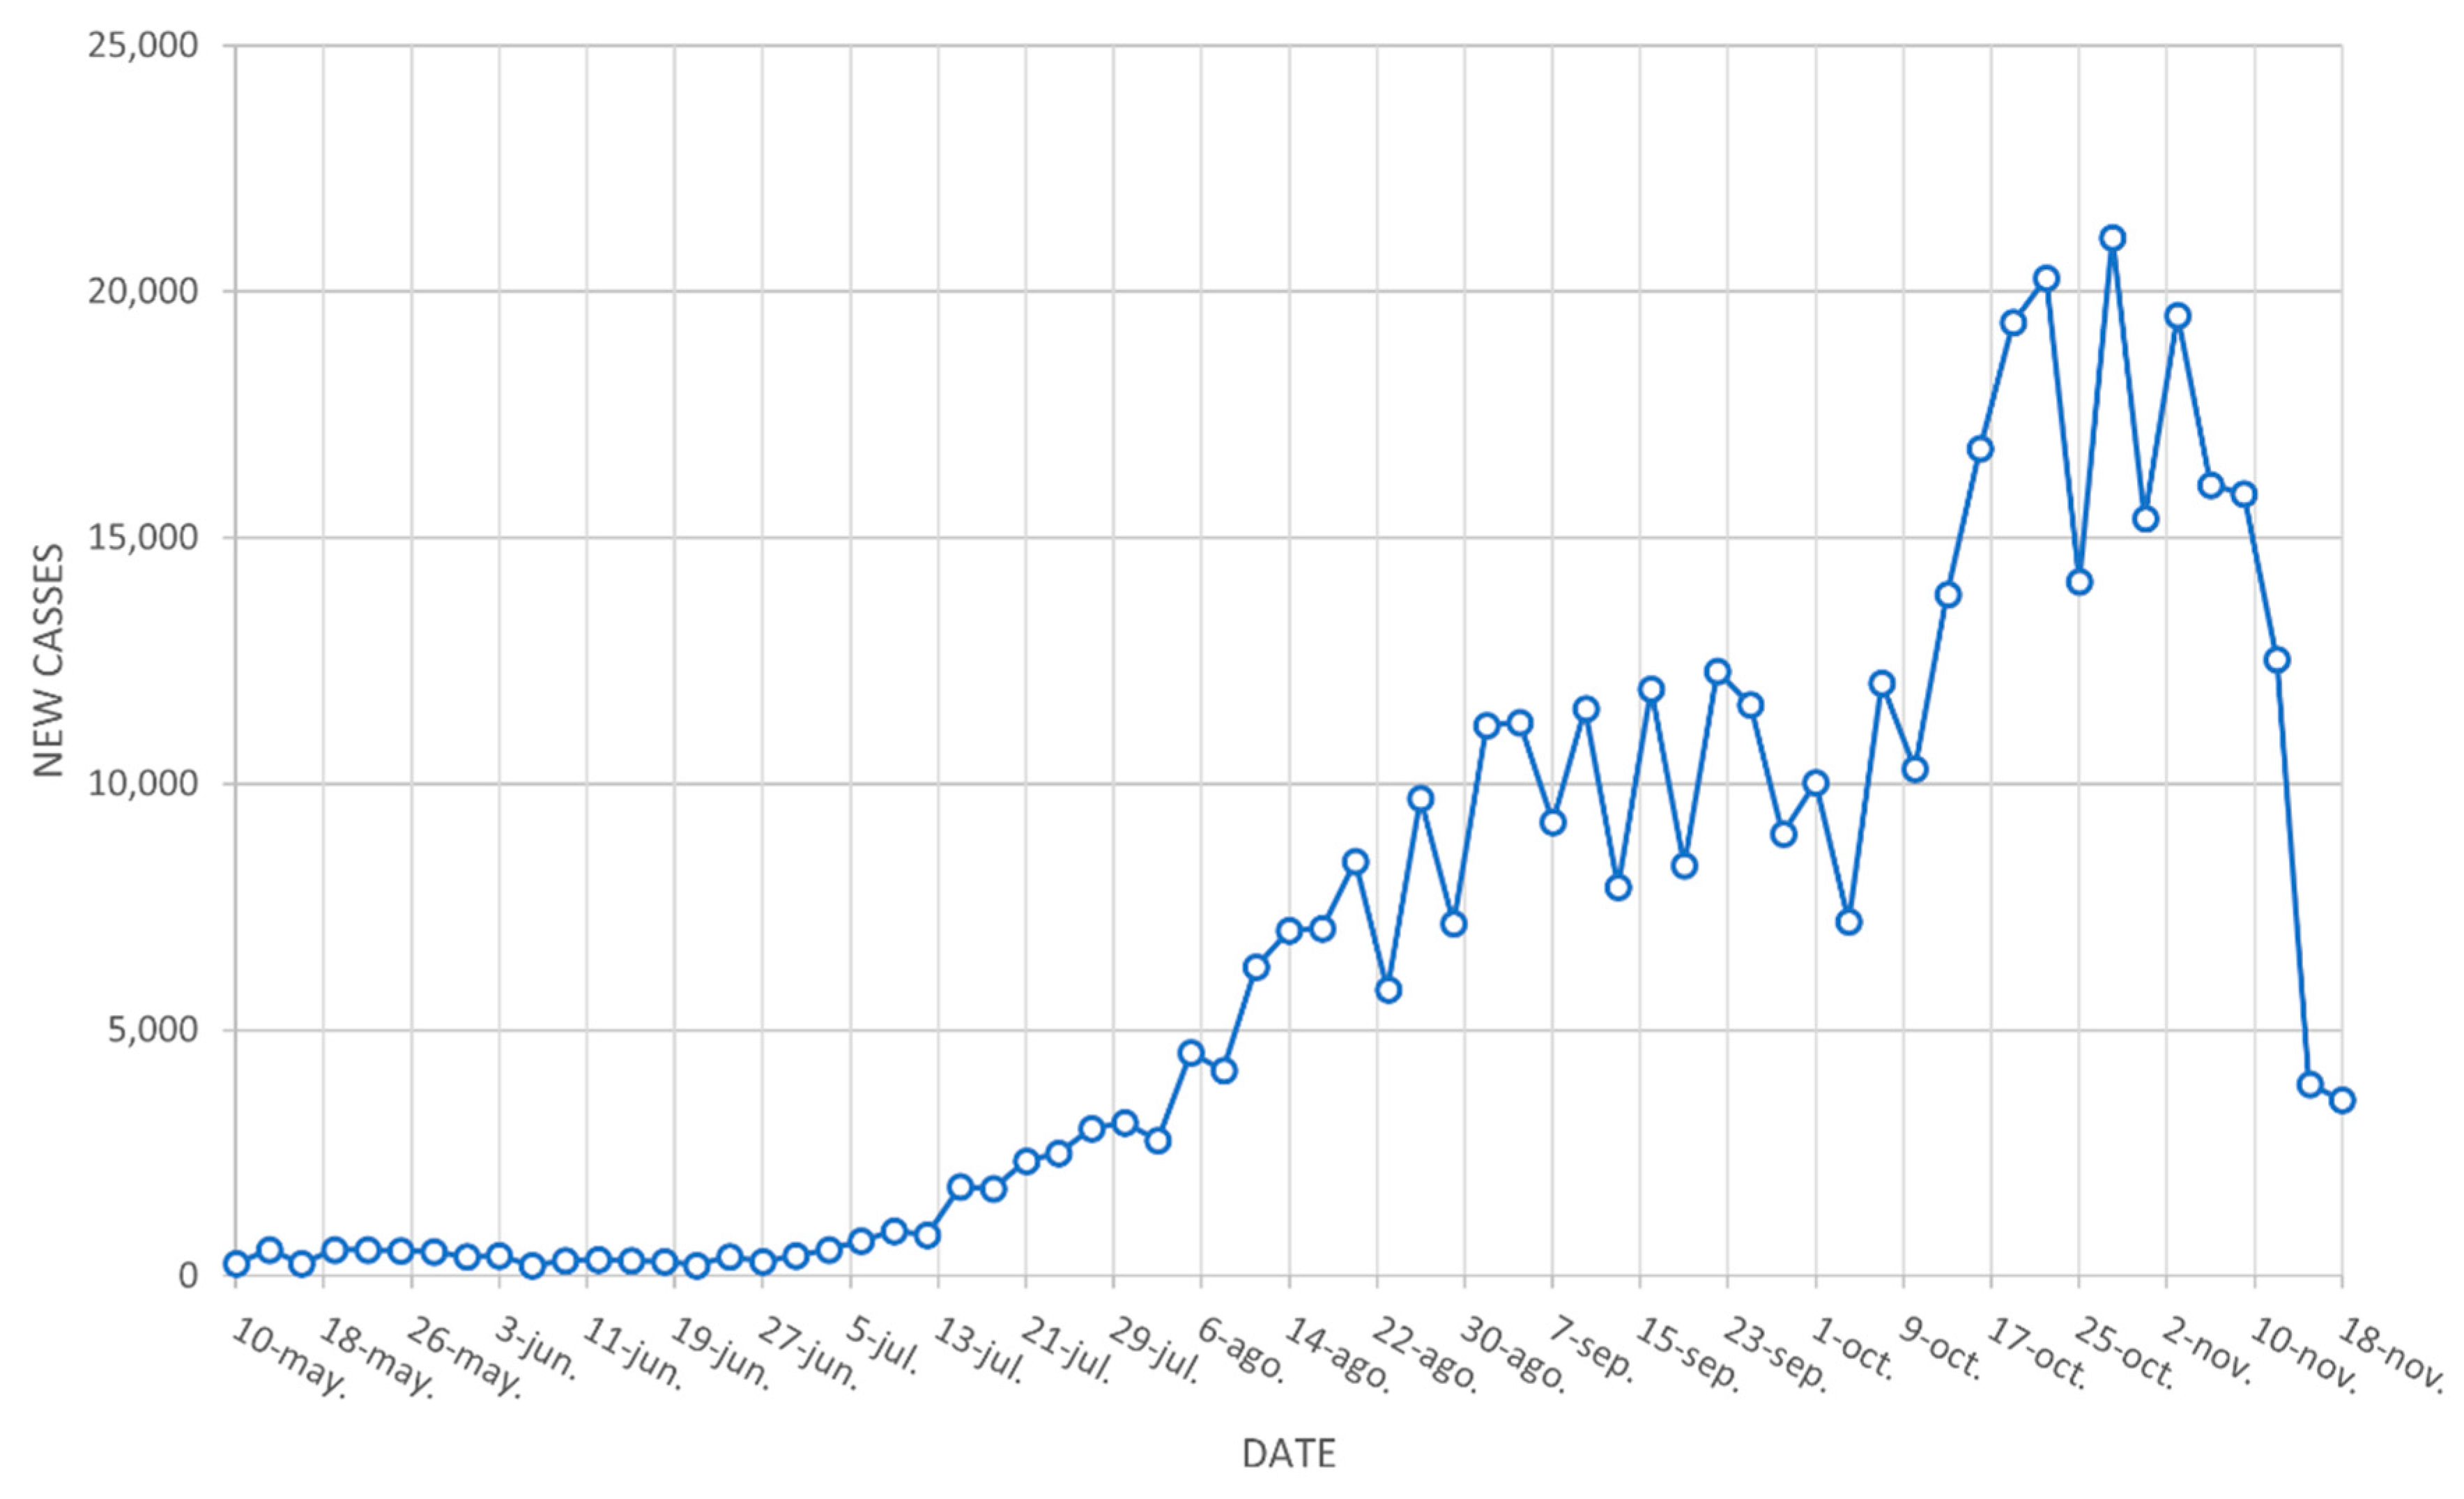
Figure 3 shows the daily new cases from May to November. The maximum rate of new daily cases was reached on October 27, with more than 20,000 new daily cases. The maximum rate in the previous semester was approximately 10,000 new daily cases confirmed.
It is said that the COVID-19 status is far from over, and the prospect of living with this pandemic for a long time is becoming more likely. In order to control COVID-19 in the future, this paper develops useful tools of infrastructure management based on BIM methodology.
3. Methodology
3.1. BIM Introduction
The term Building Information Modeling has many definitions, such as that provided by the International Standards ISO, which define BIM as the “digital representation of functionalities and characteristics of any built element.” Additional definitions refer to BIM as a virtual representation of the infrastructure in the whole life of the building or BIM as a centralized repository of information [9,10,11,12].
The origin of BIM is related to product models [13,14] of motoring, petrochemistry and naval sectors. BIM has evolved throughout the years and expanded to other sectors such as civil construction, where the application of this new methodology houses different implementation grades. BIM has been very much developed in terms of new construction infrastructures [11,14,15,16,17,18], whereas the utilization of BIM in existing buildings is not yet fully developed [19,20]. However, in Europe, 80% of residential buildings were built before 1990 with no BIM documentation [19,21,22,23]. This converts BIM into a big application environment related to infrastructure management, which could be a potential tool in situations like the COVID-19 crisis in complex infrastructure management in countries like Spain with a total of more than 200,000 cases of infection. BIM has shown to be suitable even for civil engineering and transportation infrastructure projects [24], such as roads or bridges.
3.2. BIM-Based Infrastructure Management. Literature Review
This project encompasses the use of techniques and research developed under the denomination of BIM-based FM applied to special infrastructure facilities [25,26]. The setup of the 3D model was considered as the database element in which the FM tools were built [27].
Various tools referred to infrastructure management databases and multiple research on this field have been developed. Initial challenges of BIM application to FM were detailed by Kassem et al. [28]. A case study on the Northumbria University Campus was used to empirically obtain the challenges and values of a BIM-based FM application. Marmo et al. [29] applied an open standard approach to BIM and FM system integration. Several case studies were developed in this research and performed various procedures that entailed mapping relational databases with management tasks. Using the Python programming language and Dynamo, IFC parameters were linked from databases to tridimensional model elements. In addition, case studies related to BIM and FM implementation in healthcare buildings, linking maintenance works, organizational and environmental requirements through the use of Dynamo programming, have also been reported [30].
Automated monitoring of the infrastructure operation phase grounded on BIM methodology was developed by Bonci et al. [31]. The monitoring was supported by a BIM-based cyberphysical system. This provides the user with performance indicators based on the metric denominated as overall throughput effectiveness (OTE), making it possible to manage multiple objectives in real time.
ETSICCP is a large public building. In such a sense, several publications have studied the management of important public institutions focusing on FM and highlighting its importance. It should be highlighted that the exploitation and maintenance of this type of facility are considered to be the second-largest cost of universities, ranging between 5 and 15% in Europe [32,33,34,35].
Achieving a Smart Campus is the main goal of modern universities. This process comprises three stages: traditional campus, e-campus and digital campus as the final phase [36]. The ETSICCP is located in the beginning stages of the Smart Campus path. With this study, the campus expects an important step to achieve the total digitalization on the infrastructure, considering COVID-19 measures in public buildings.
3.3. Model for COVID-19 Management
This paper summarizes some useful applications of the BIM methodology in infrastructure management for complex buildings. The application focuses on educational frameworks using the BIM model of the ETSICCP at the UPM. The previously mentioned infrastructure has either geometrically or occupationally complex characteristics. The construction object referred to herein has a total gross area of 38,970.84 m², of which the useful area is 32,631.23 m², with both Classrooms 26 and 27 standing out, as shown in Table 3. The school is used by more than 4000 students of different degree levels: Graduate, Master and PhD. These numbers provide an idea of the magnitude of the school’s facilities model and the excellent opportunity for implementing the latest advances and new management approaches for spaces, equipment maintenance and the relationship with the staff responsible for it. These staff members are aware of the impact that can be generated by a BIM methodology, which is quite different from the present traditional management approach.
In order to show the amplitude of the useful area of the ETSICCP, Table 5 presents the area values of all classrooms with a total floor area of 5289.329 m². The table originated in the BIM model by creating a constant relationship between the model and the database so that any information in the model could be reflected in a matter of seconds in the database and vice-versa.
A BIM project based on the management of this infrastructure is already under development, creating access via Internet login through www.biminfrastructure.com and enabling the user to access all BIM parameters through the big data Structured Query Language (SQL) database programming language and database connection. Live parameters, such as ambient temperature or humidity, are measured and saved into the SQL database. All these environment-synchronizing live parameters and BIM information data provide a powerful tool for infrastructure management in any situation.
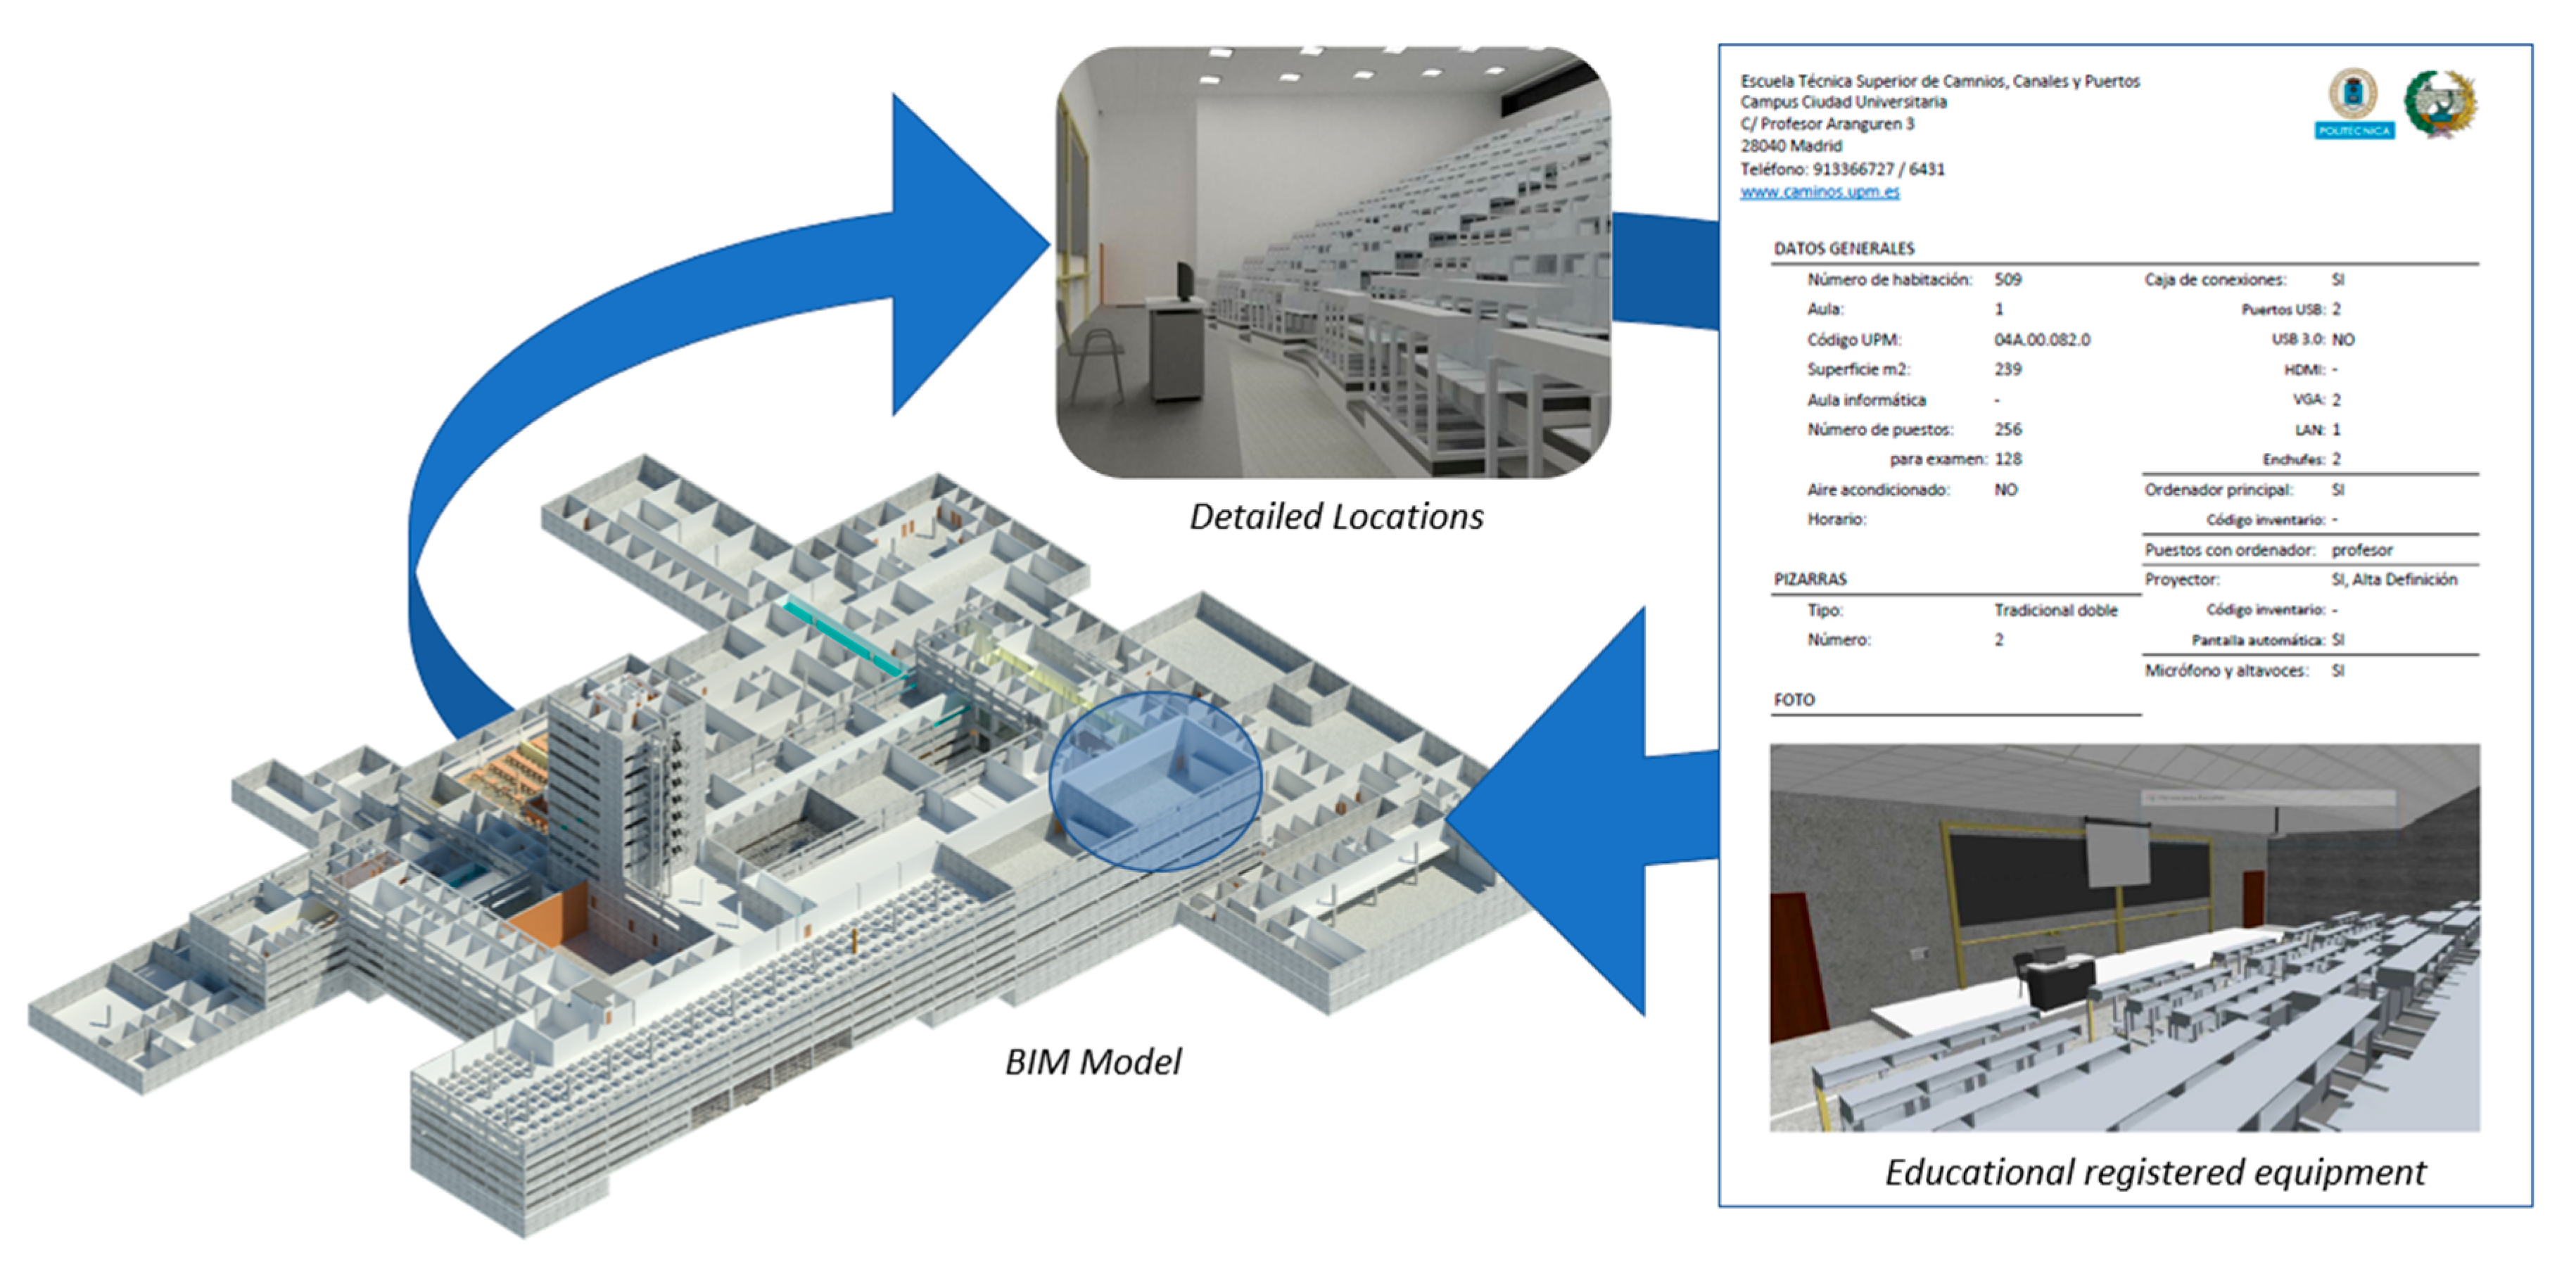
The BIM model is presented in Figure 4. With a one-year modeling time span, this model houses perfect geometric parameters, detailed textures, the quantification of materials, total students by degree, total room occupation and educational equipment for maintenance, such as blackboards, projectors or desks. Moreover, the BIM model houses all codes assigned by the UPM to locate all spaces under its ownership.
The BIM model proposed here for COVID Infrastructure Management works as one element, with total coordination from the same BIM model to the SQL database. The model provides either internal BIM data, i.e., maximum occupation for each room, or external BIM data, i.e., registered users of the platform, differentiating between management staff, students or professors, thereby establishing a filter for each kind of user.
4. Results: BIM and Infrastructure COVID-19 Management
This chapter comprises different infrastructure management alternatives based on the BIM model presented previously.
4.1. Mathematical Model for Internal Infrastructure Movements
One of the key factors against the current resurgence of COVID-19 is the minimum safety distance between people. This factor is complex to comply with in special infrastructures such as campus areas, airports or hospitals, where many people are involved. To comply with this measure, it is necessary to know the busiest zones inside the building, taking into account the different hours and days and providing live information to users about occupation rates and the busiest zones throughout the building, as well as with live information and the best route for their destination, thereby avoiding hot spots.
For this practical purpose, this paper established a mathematical model based on the origin–destination matrix related to the movements in the internal part of the infrastructure. For this example, 13 of the most visited rooms in the infrastructure were selected: six educational rooms, the restaurant, library, secretary, break zone and three types of arriving transport systems, including the subway and bus. Five time intervals were chosen, from 8:00 to 9:00, 9:00 to 12:00, 12:00 to 15:00, 15:00 to 18:00 and 18:00 to 21:00.
The main goal of this mathematical model is to detect crowd hot spots and transfer information from the database to the BIM model, using it as a visualizer by means of the Internet, regarding the best time to move around the campus.
The basic formula is as follows:
where:
λ = “Sconteo”/“ET,d”,
Xij’ = Xij x λ,
ET,d: Total registered surveys for all day;
Sconteo: BIM count system;
λ: Expansion factor;
Gi: Generated tracks by zone i;
Ai: Attracted tracks by zone i;
Xij: i, j term in the origin–destination matrix;
Xij’: i, j term in the amplified origin–destination matrix;
Xtij: i, j term in the total daily origin–destination matrix;
Equation (1) is related to the obtention of the matrix elements. In terms of arrivals to a particular space, the element Aj is established, similarly for departures, and the elements Gi and Xtij are the final total elements of the daily origin–destination matrix result.
In Equation (2), the expansion factor is defined and created for special cases when the collected data from the surveys are less than 25% of the BIM count system, which is based on a person-counting camera installed in all access spots of the infrastructure providing the database with the real number of persons inside the building. As a result of this counting, it is possible to verify the number of surveys and assume if they are a good enough representation of users.
In the case of a very small participation in surveys against the real occupation of the infrastructure provided by the BIM counting system, it is necessary to obtain a new origin-destination matrix, applying the expansion factor for all the elements as described in Equation (3). In the test described below, the application factor is not considered.
The origin–destination matrices (O-DM) for each time interval are presented below. Table 4 collects the internal movements inside the campus from 8:00 to 9:00. The number of movements is simulated to verify the total functionality of the system. As can be seen in Table 4, all departures come from the transport systems, and there is no arrival. To verify the correct functionality of the O-DM, the sum of all total departures must be equal to total arrivals, in this case 984, which coincides with the total registered surveys.
The structures of all O-DMs are the same and reflect the internal movements for each time step. Table 6 collects typical movements from houses to campus by public or private transport. Table 7 collects the main room changes. In Table 8, the outstanding restaurant zone is because of lunchtime. Table 9 and Table 10 compare a high level of arrivals to means of transport. Table 11 collects the total movements throughout the day. It is important to highlight that in Table 11, no movements are considered from and to the same place, whereas in other tables, they are considered.
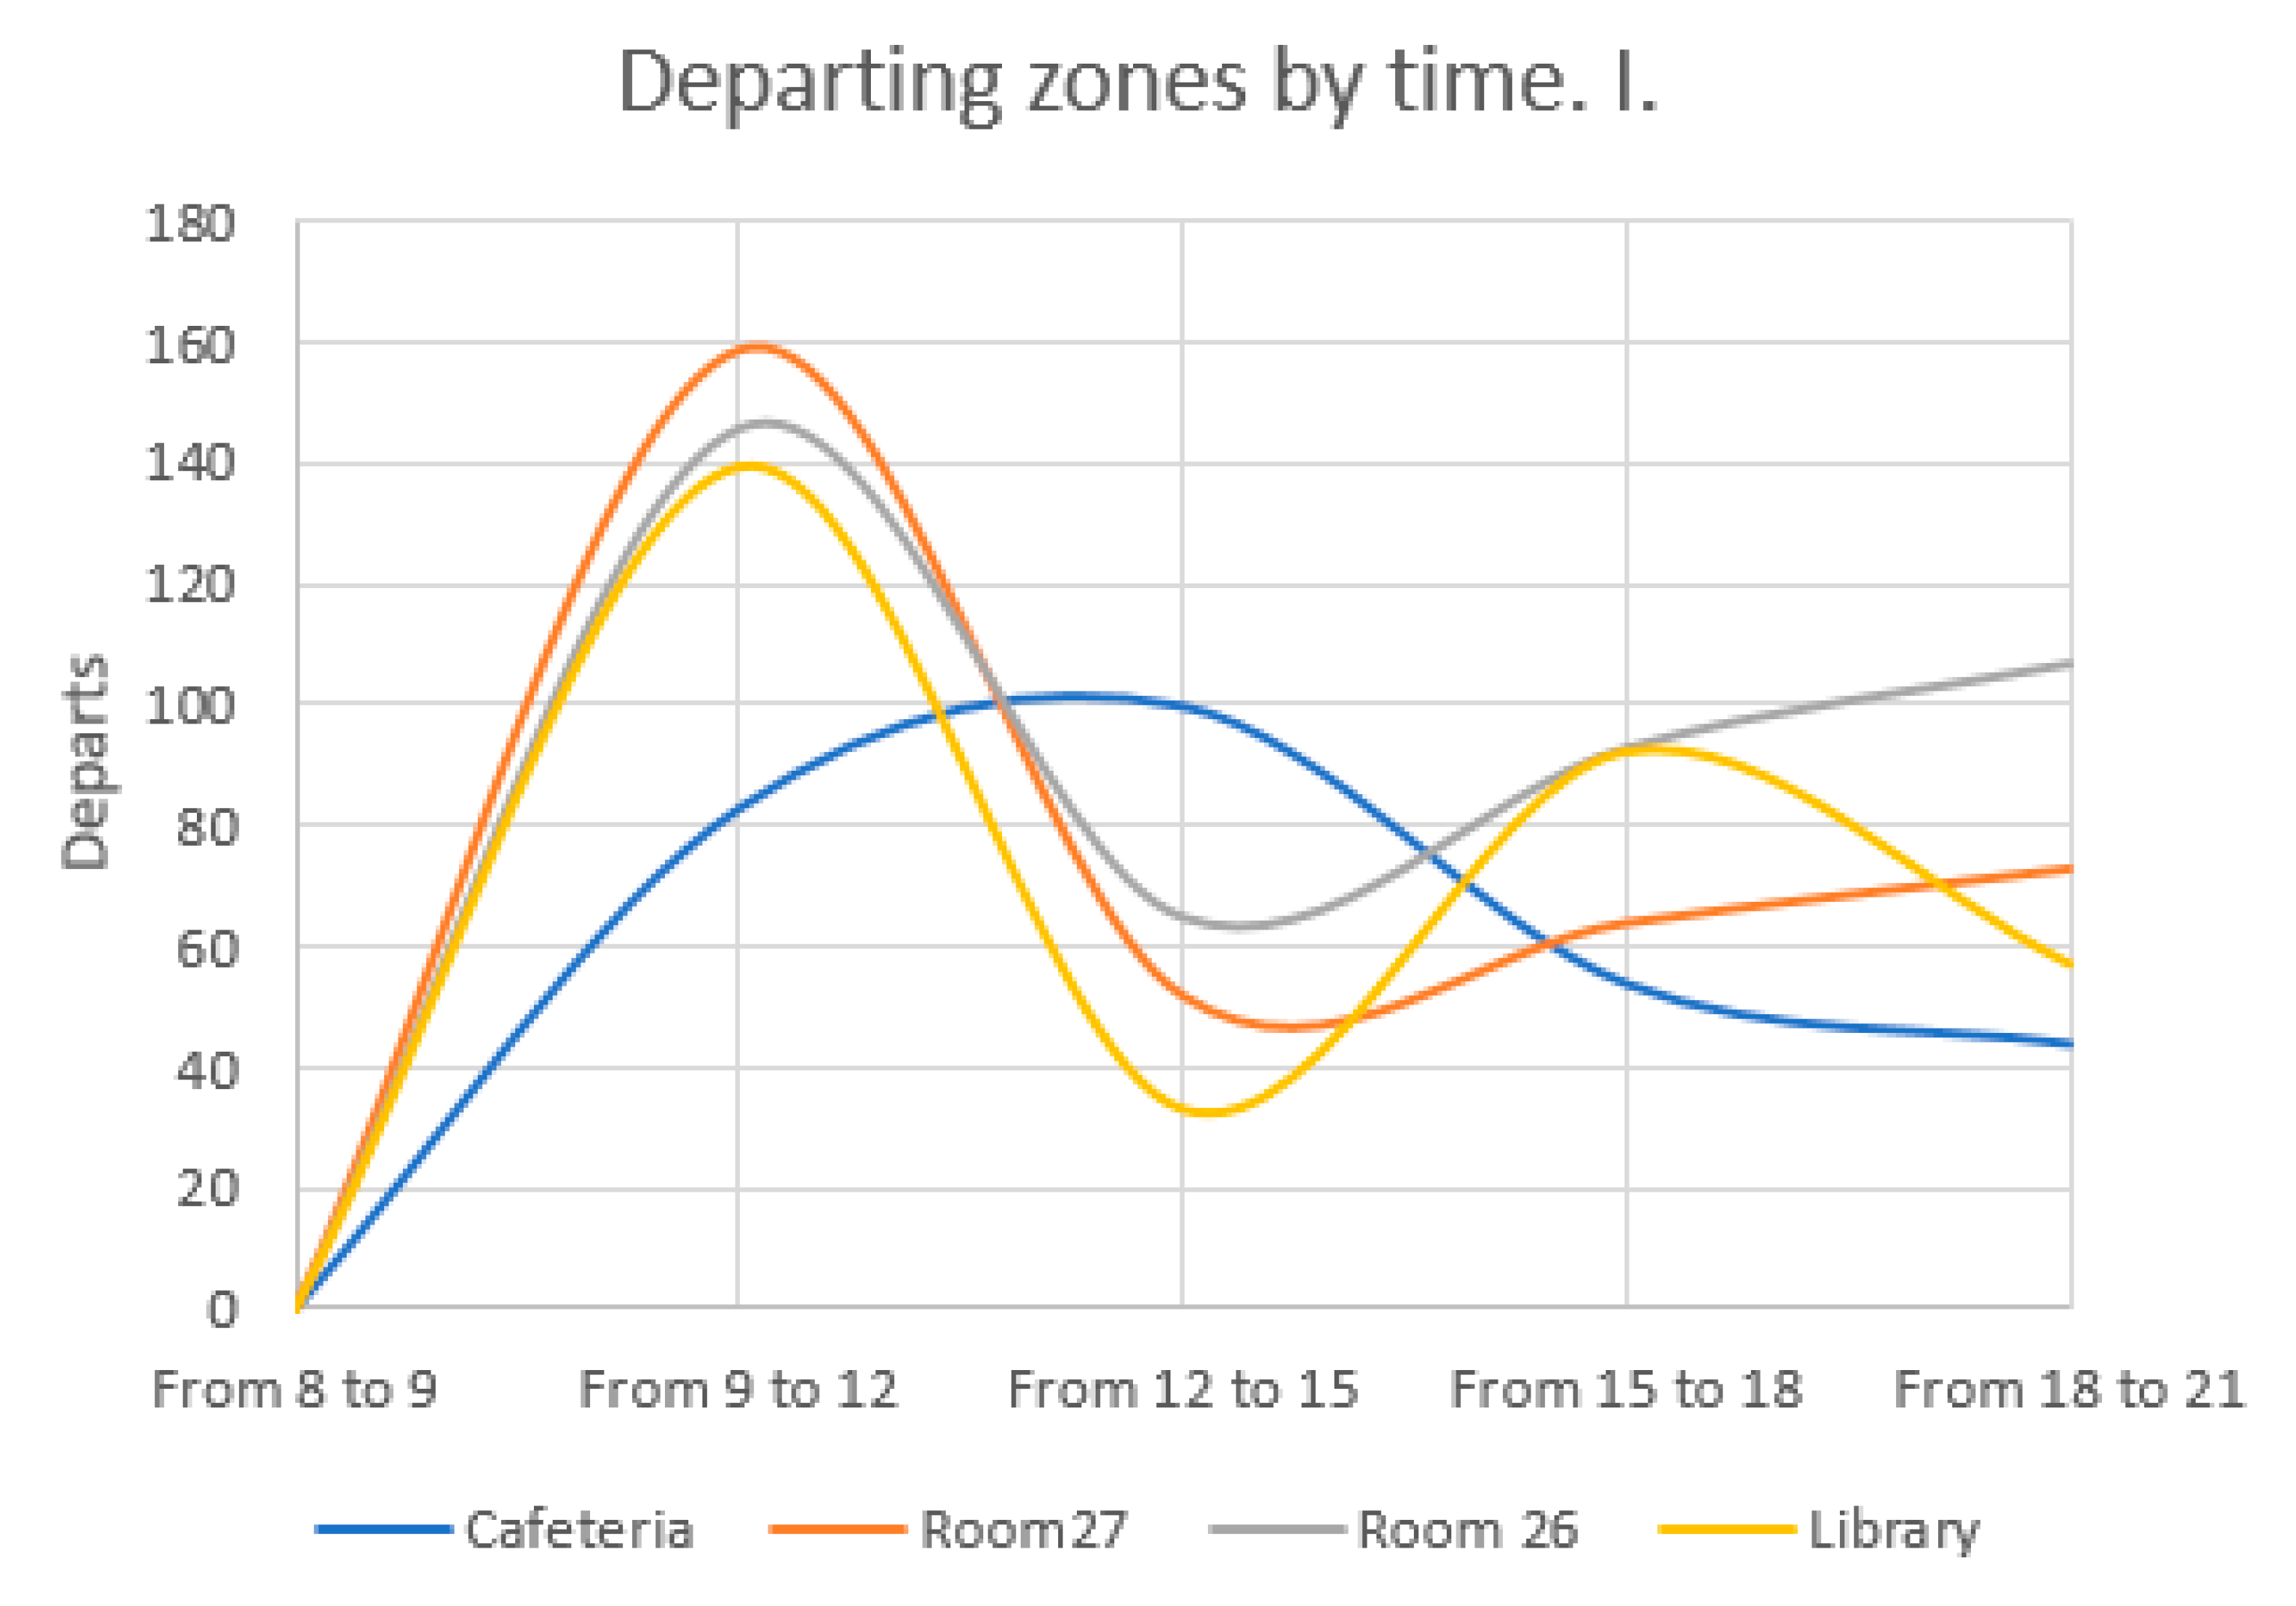
As a result of the O-DMs, it is possible to collect all data in Table 12 and Table 13 and transform the numerical data into graphical information.
Graphical data allow the detection of the busiest points per hour. This information is provided to students, teaching staff or management by an Internet protocol previously saved in the SQL database. Thus, it is possible to record all data and make an official registration.
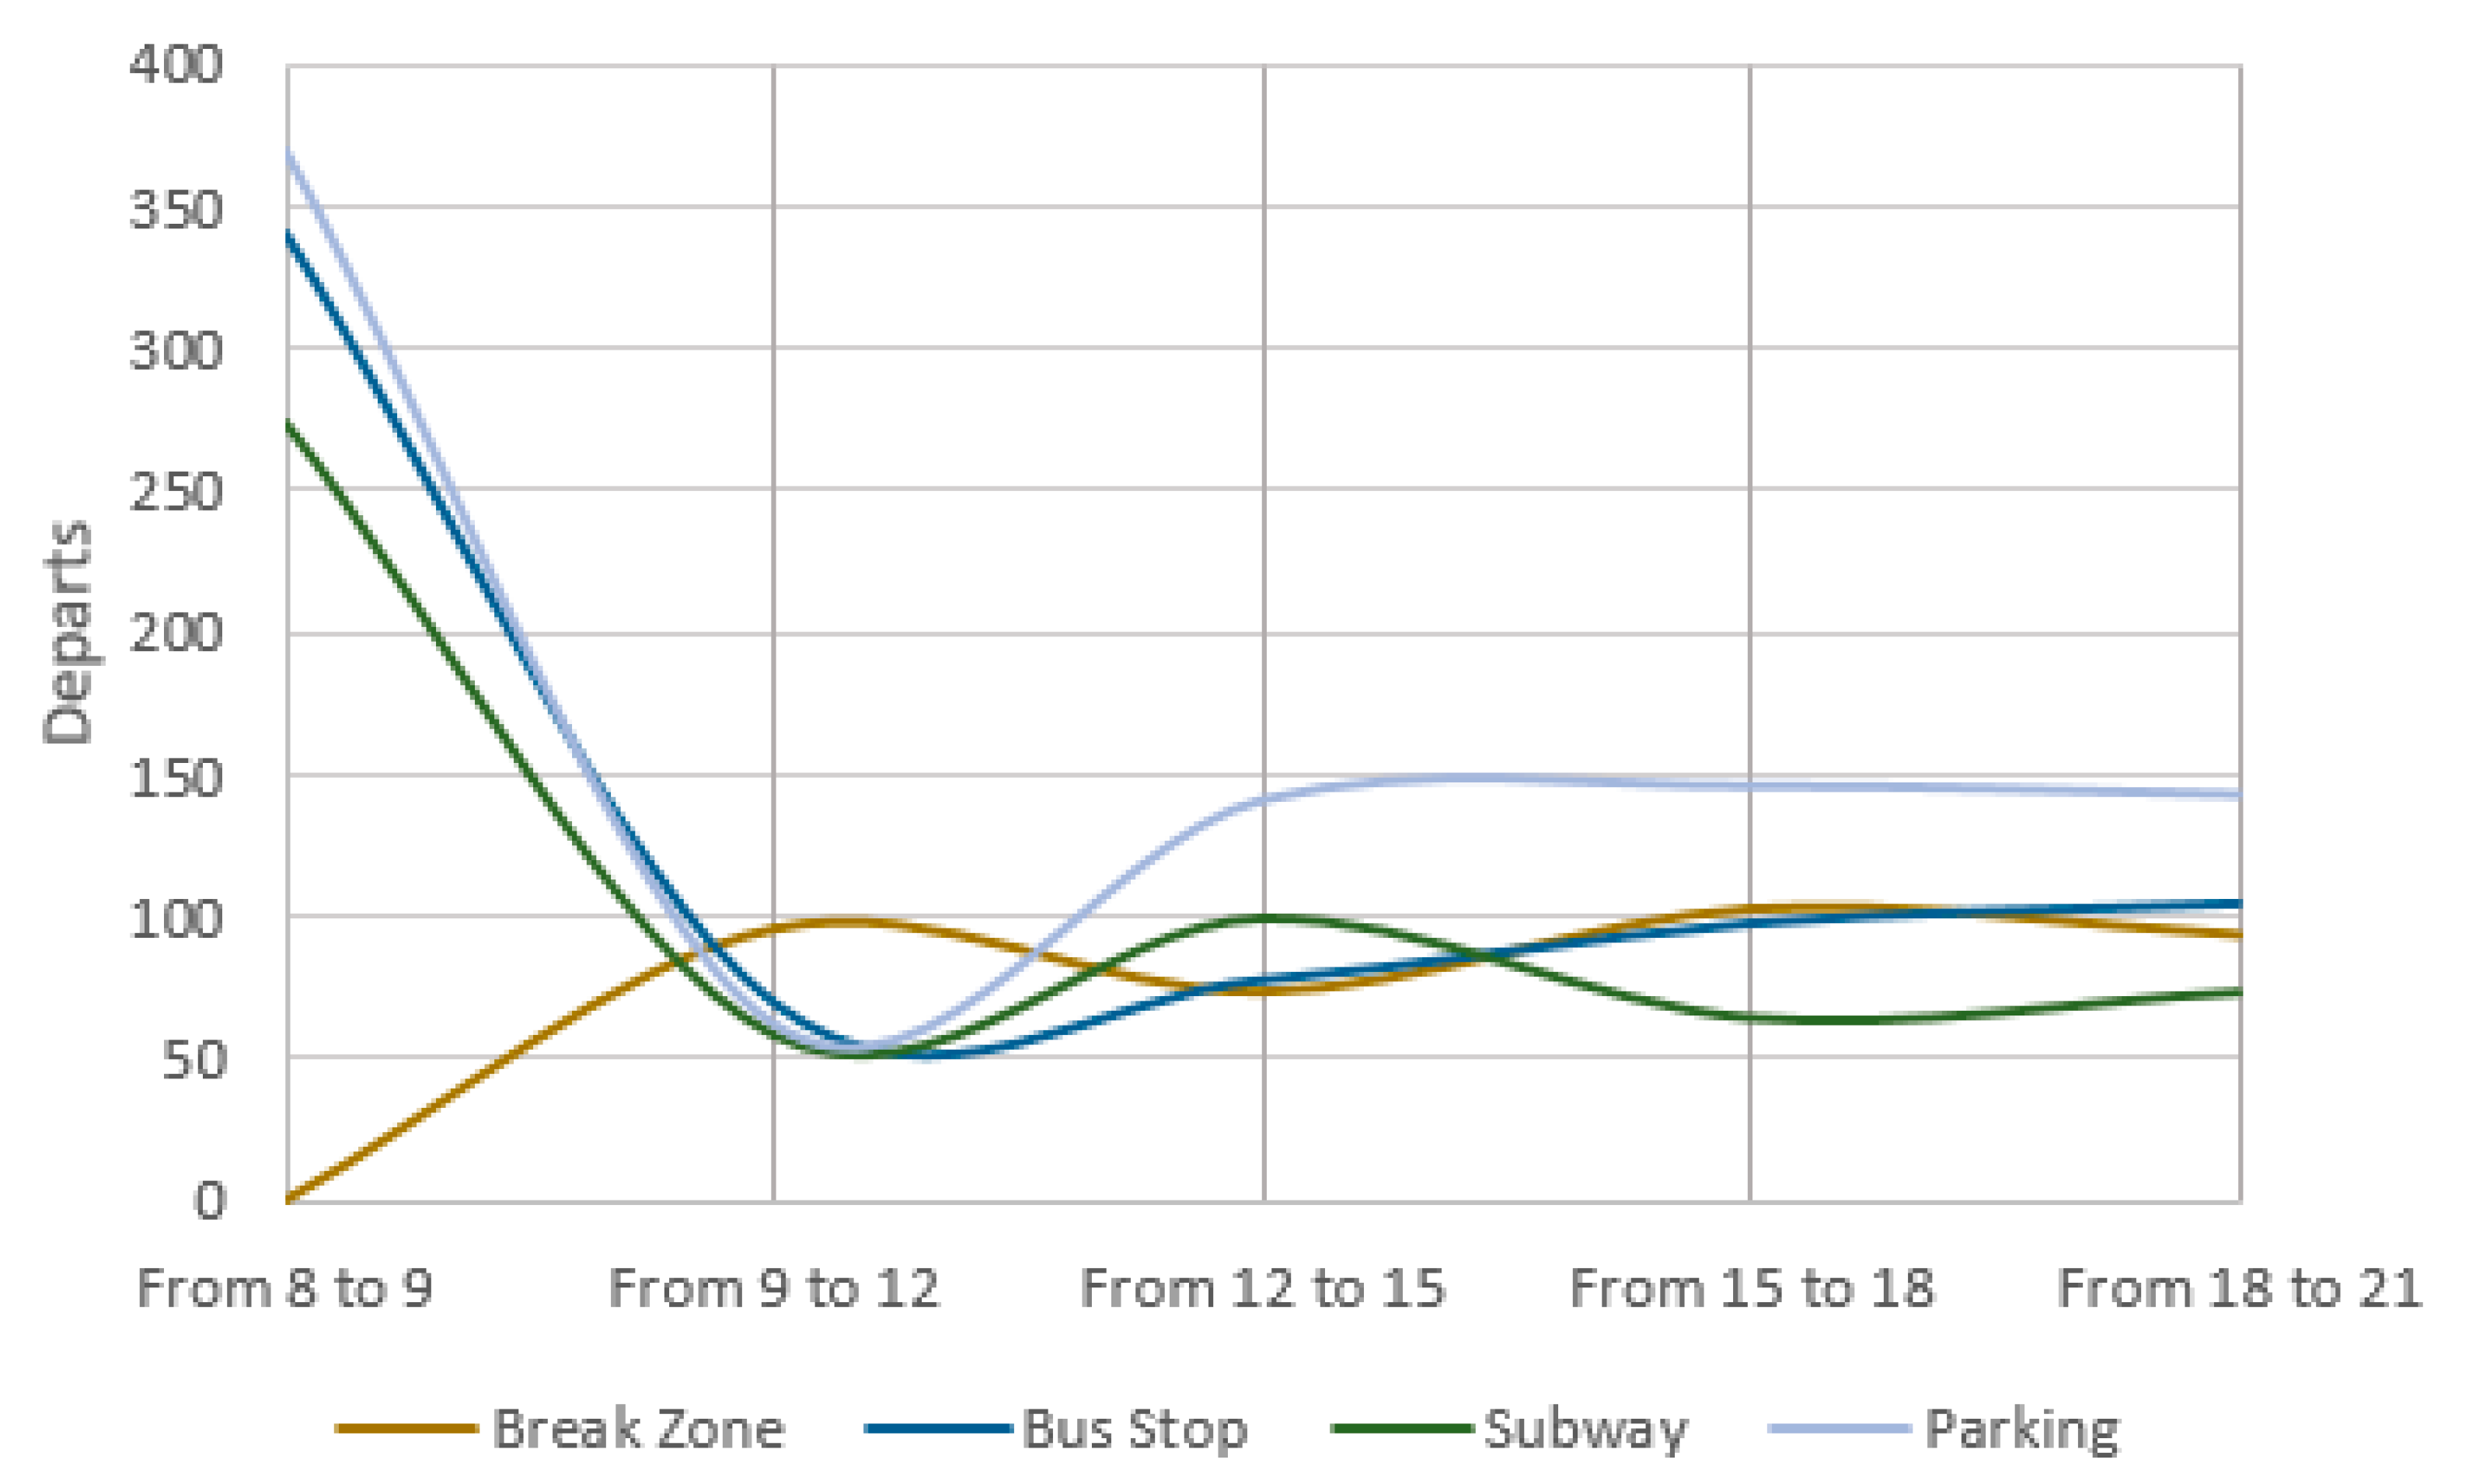
Figure 5 and Figure 6 allow showing hotspots by time steps. From 8:00 to 9:00, most people leave from Rooms 27 and 26, whereas that tendency decreases throughout the day. A new hotspot is detected in the restaurant, where most people quit this space from 12:00 to 15:00. Focusing on Figure 5, it is obvious that means of transports are the busiest departure zones from 8:00 to 9:00, although graphical data in Figure 6 show that there is new growth from 12:00 to 15:00 h, especially in private transport systems.
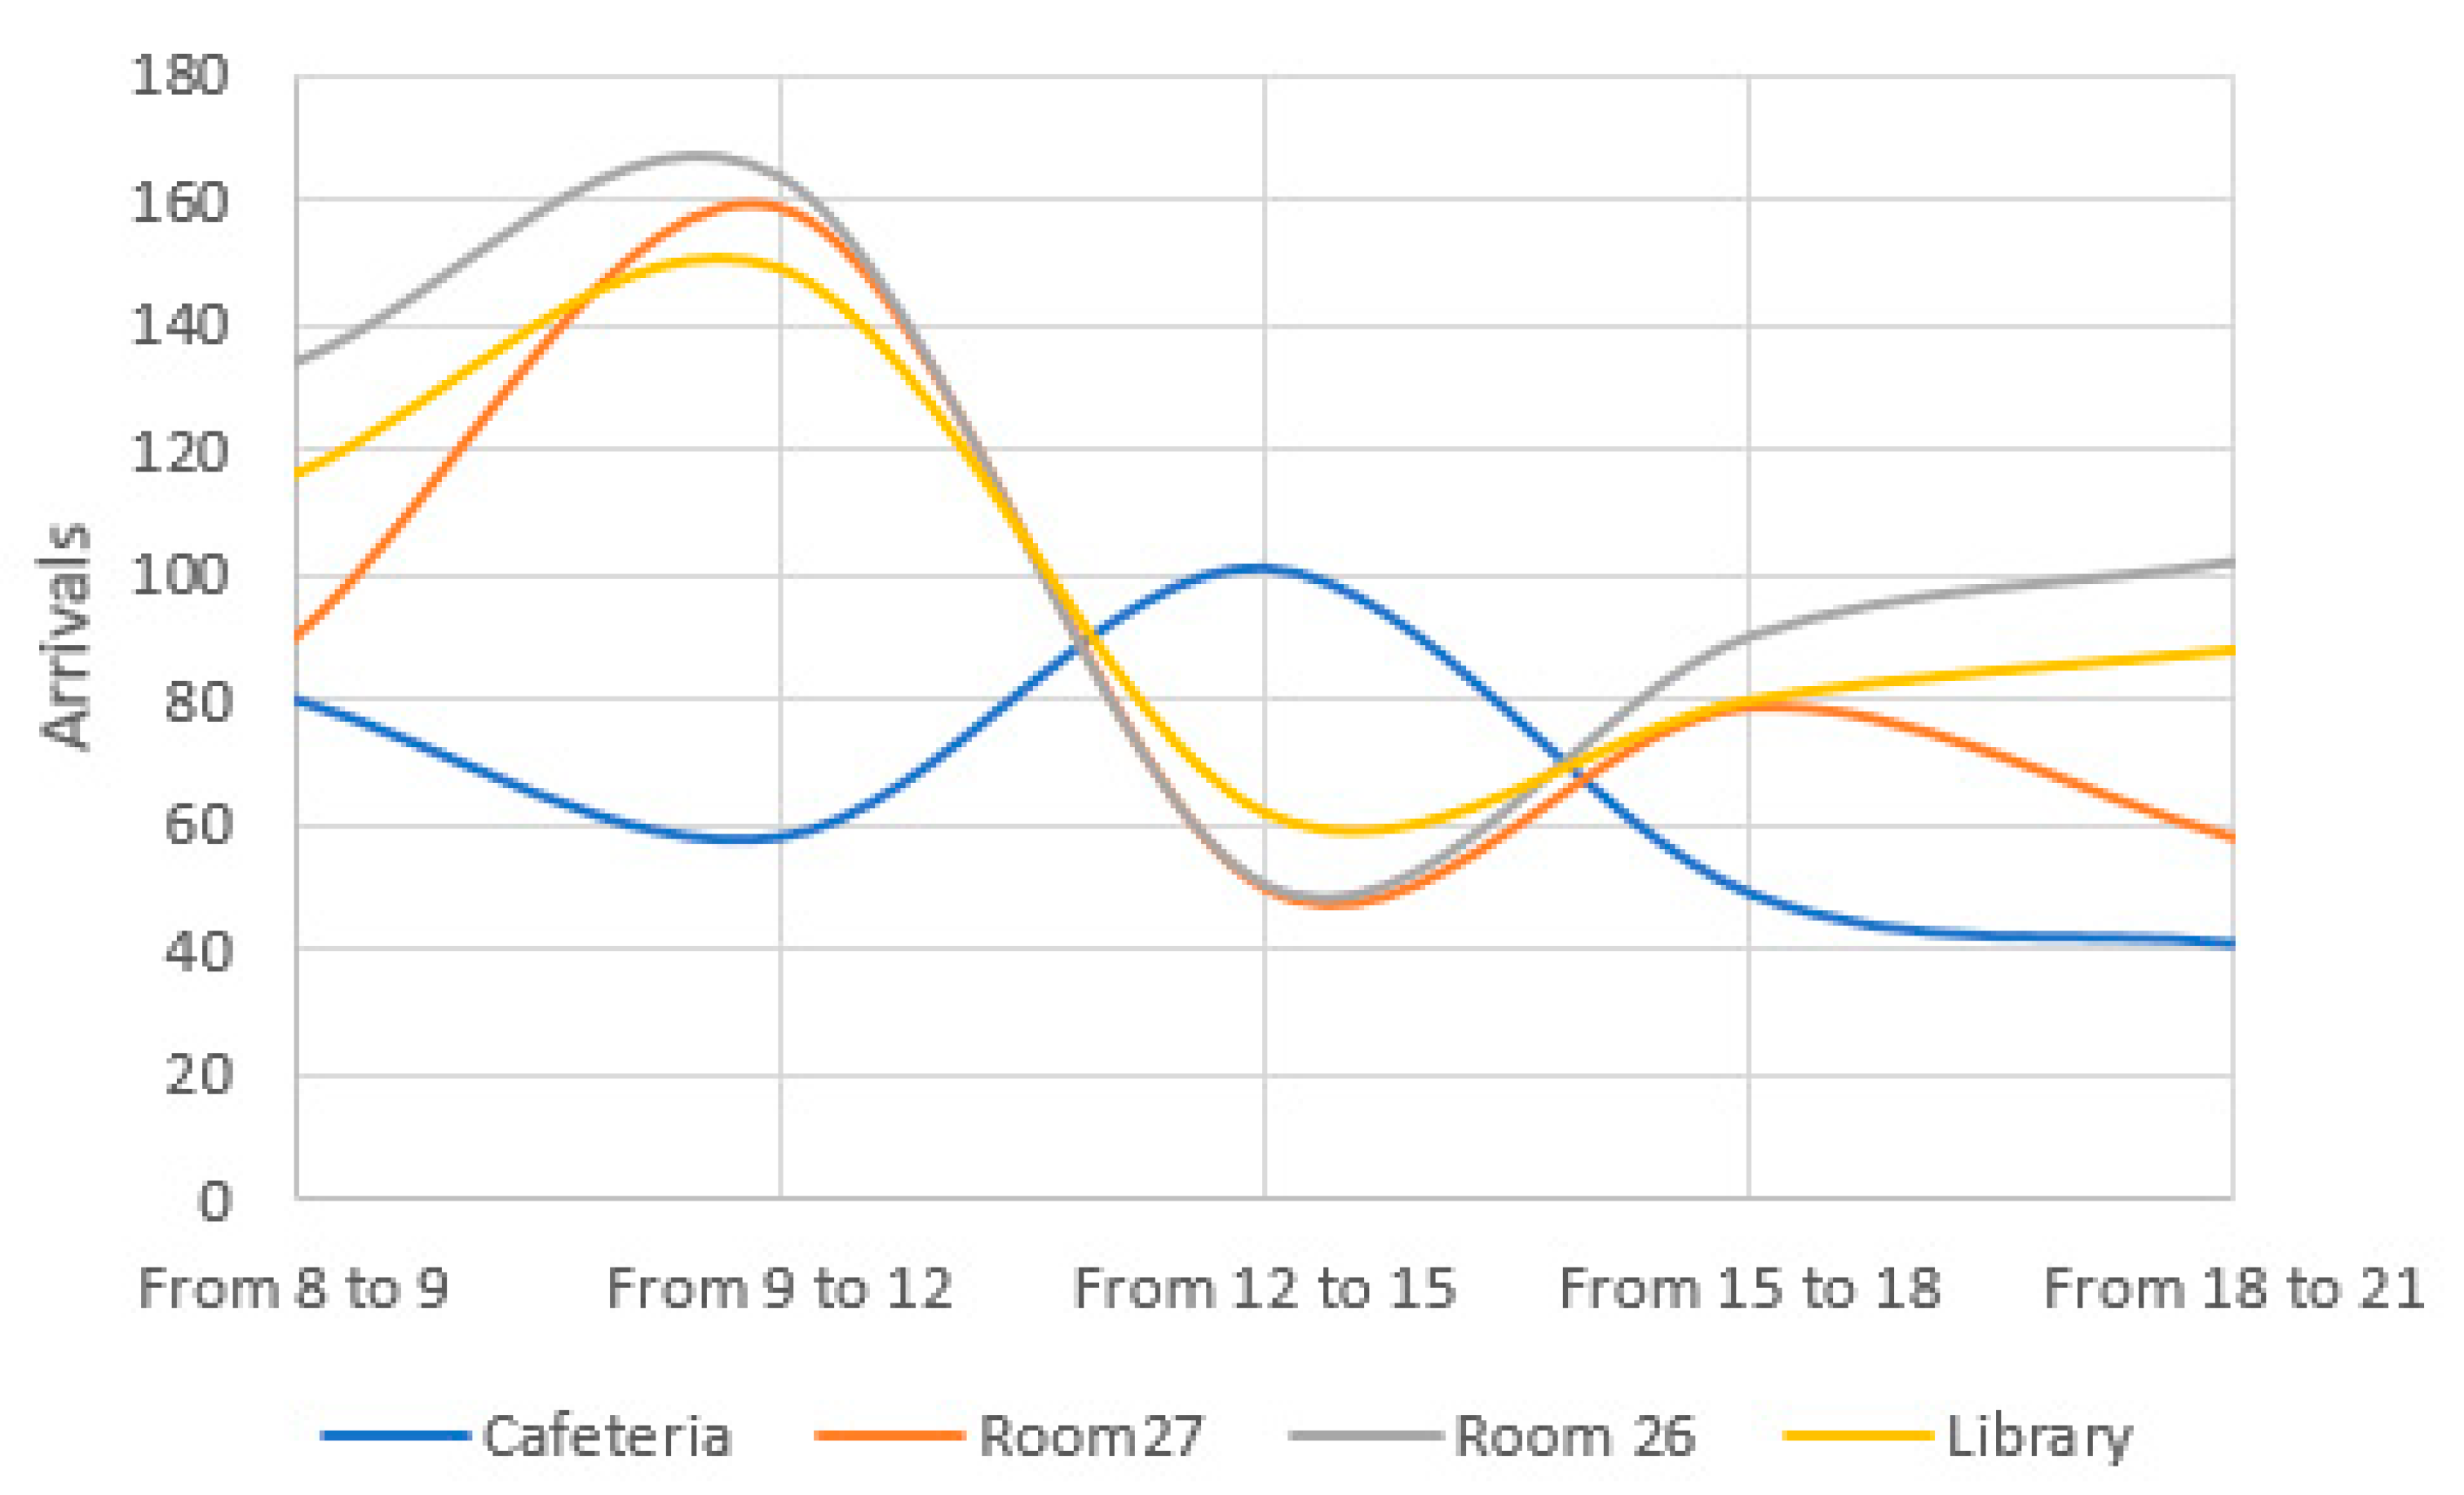
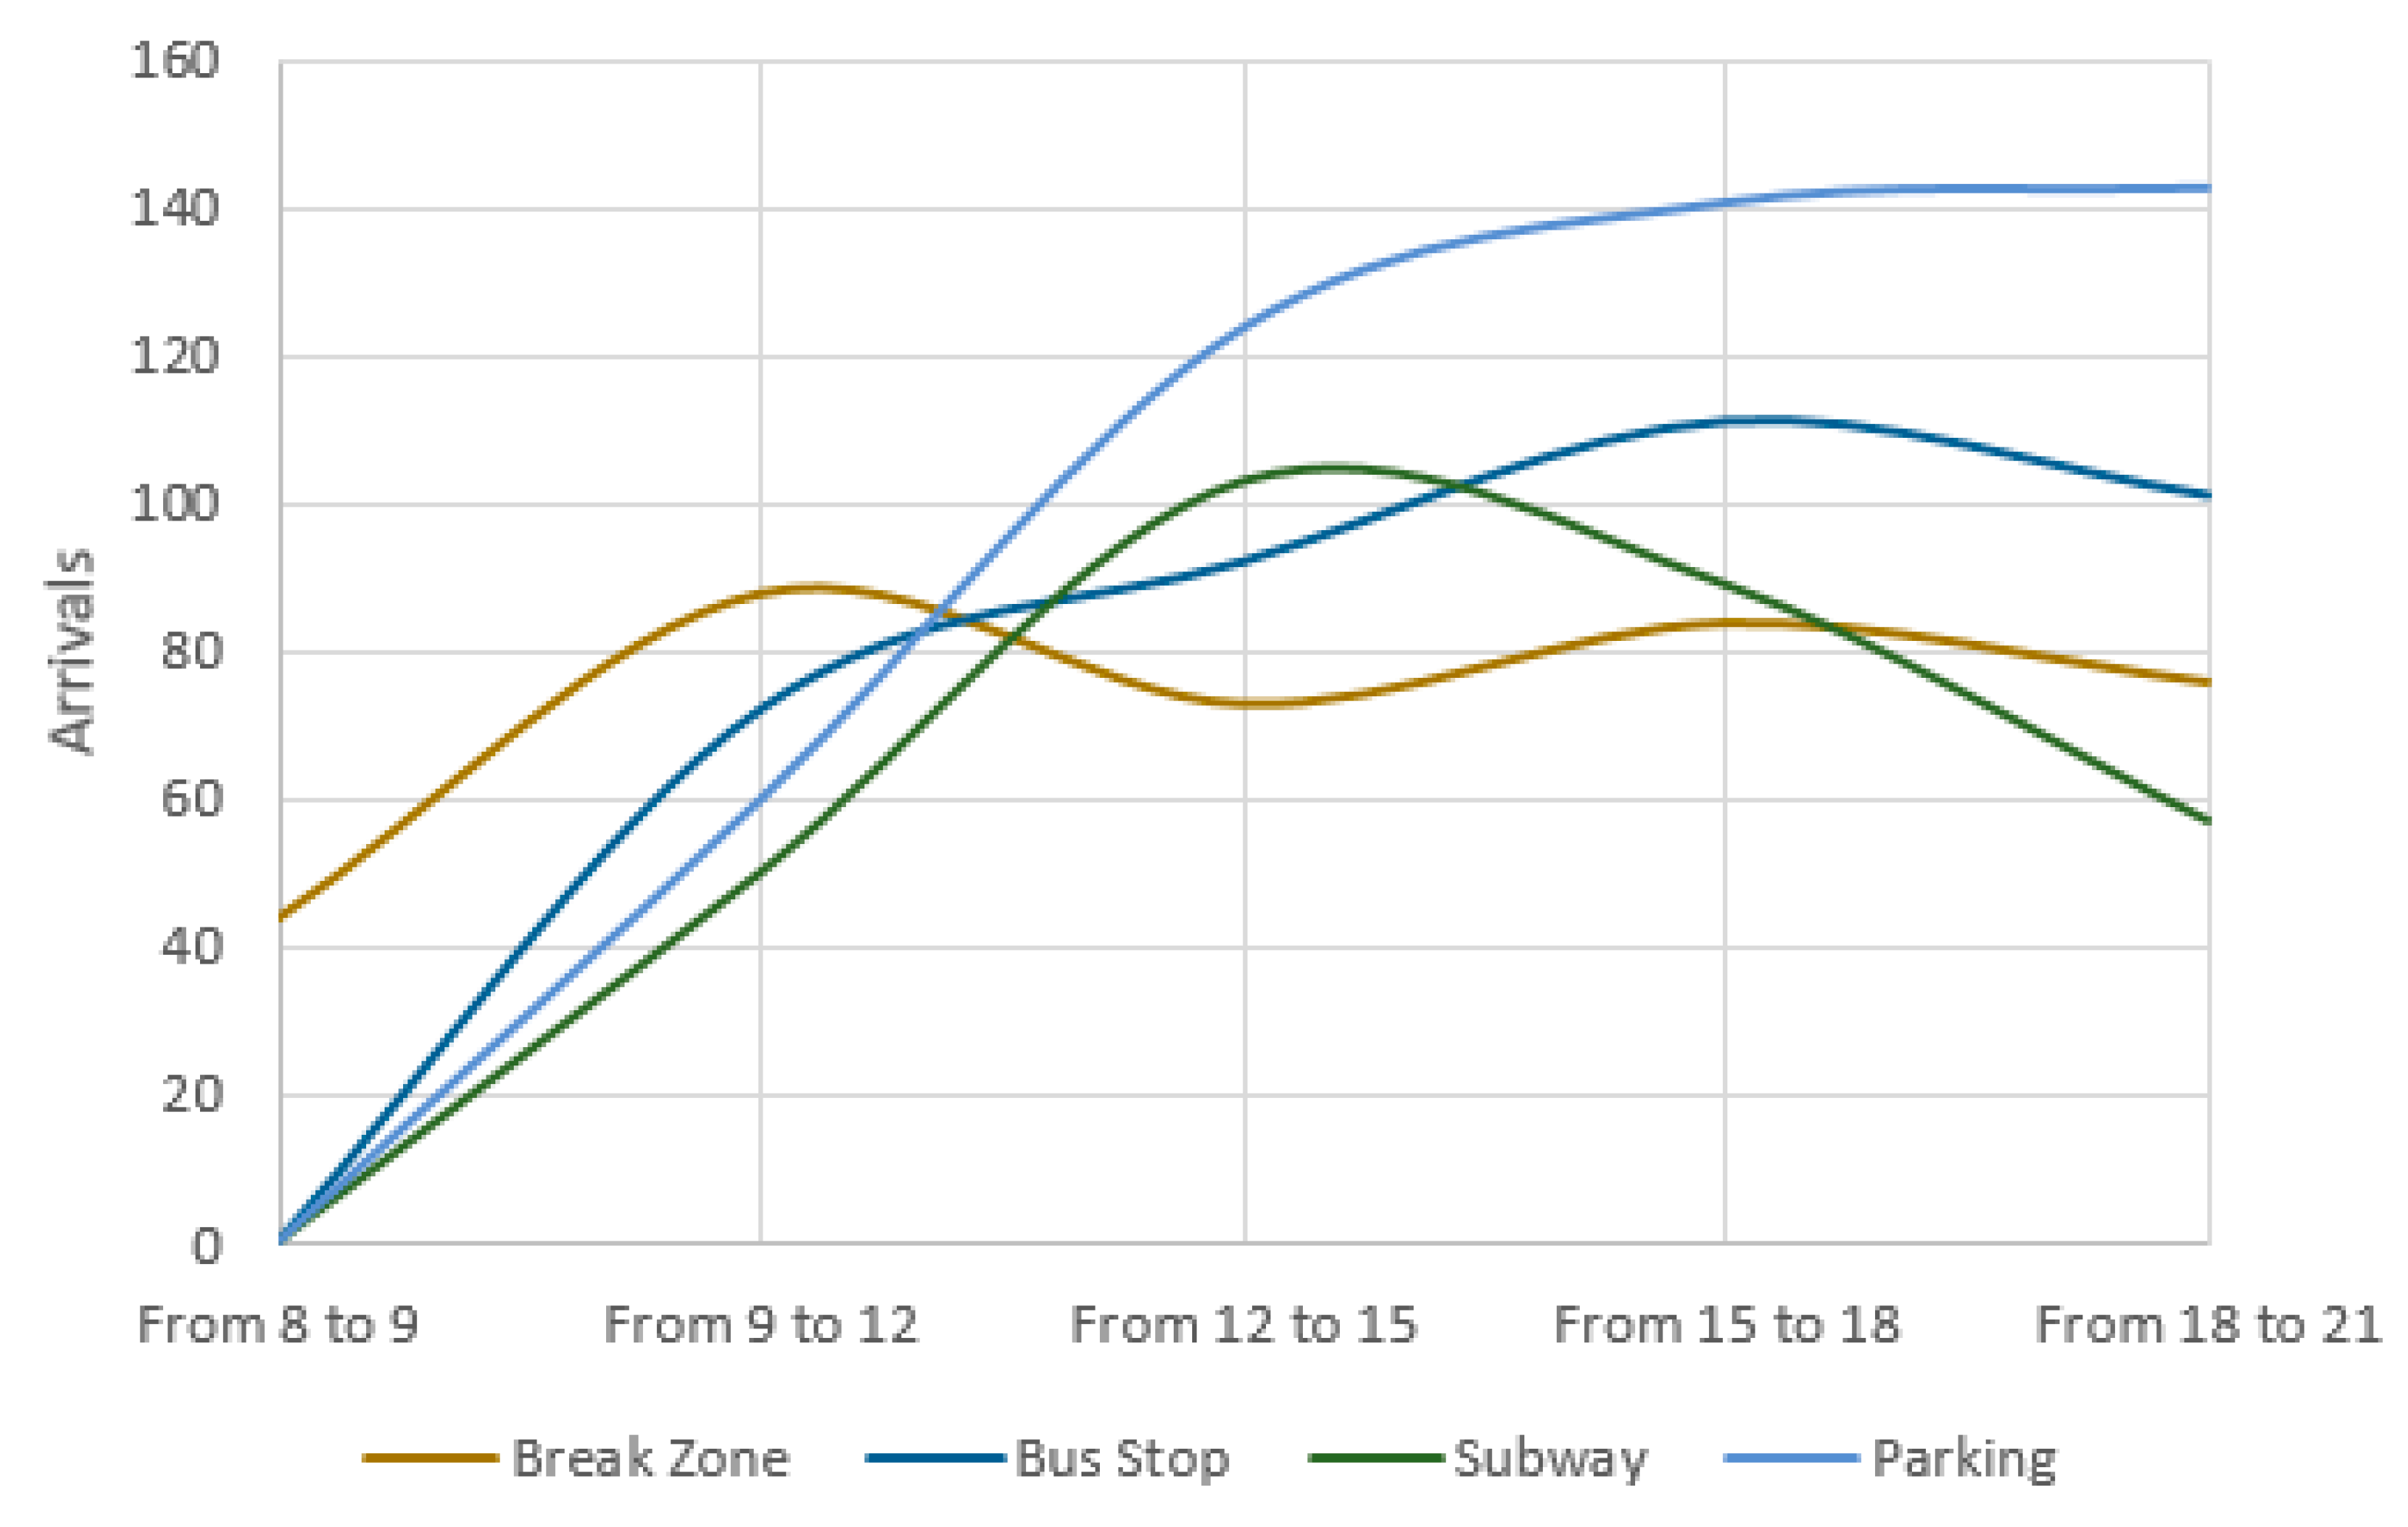
In the same way, it is possible to analyze hot spots in terms of arrivals. Figure 7 and Figure 8 show that Room 26 has the most elevated attraction value from 8:00 to 9:00; however, from 9:00 to the end of the working day, this position is occupied by parking. At midday, arrivals to the restaurant increase, and the trend diminishes from that period to the end of the day.
Thanks to BIM, it is possible to assign all these data to a virtual environment and make them accessible through the Internet. This gives all users a visualization of the best routes for movements inside the building and keeps the minimum safety distance to reduce the likelihood of the spread of COVID-19.
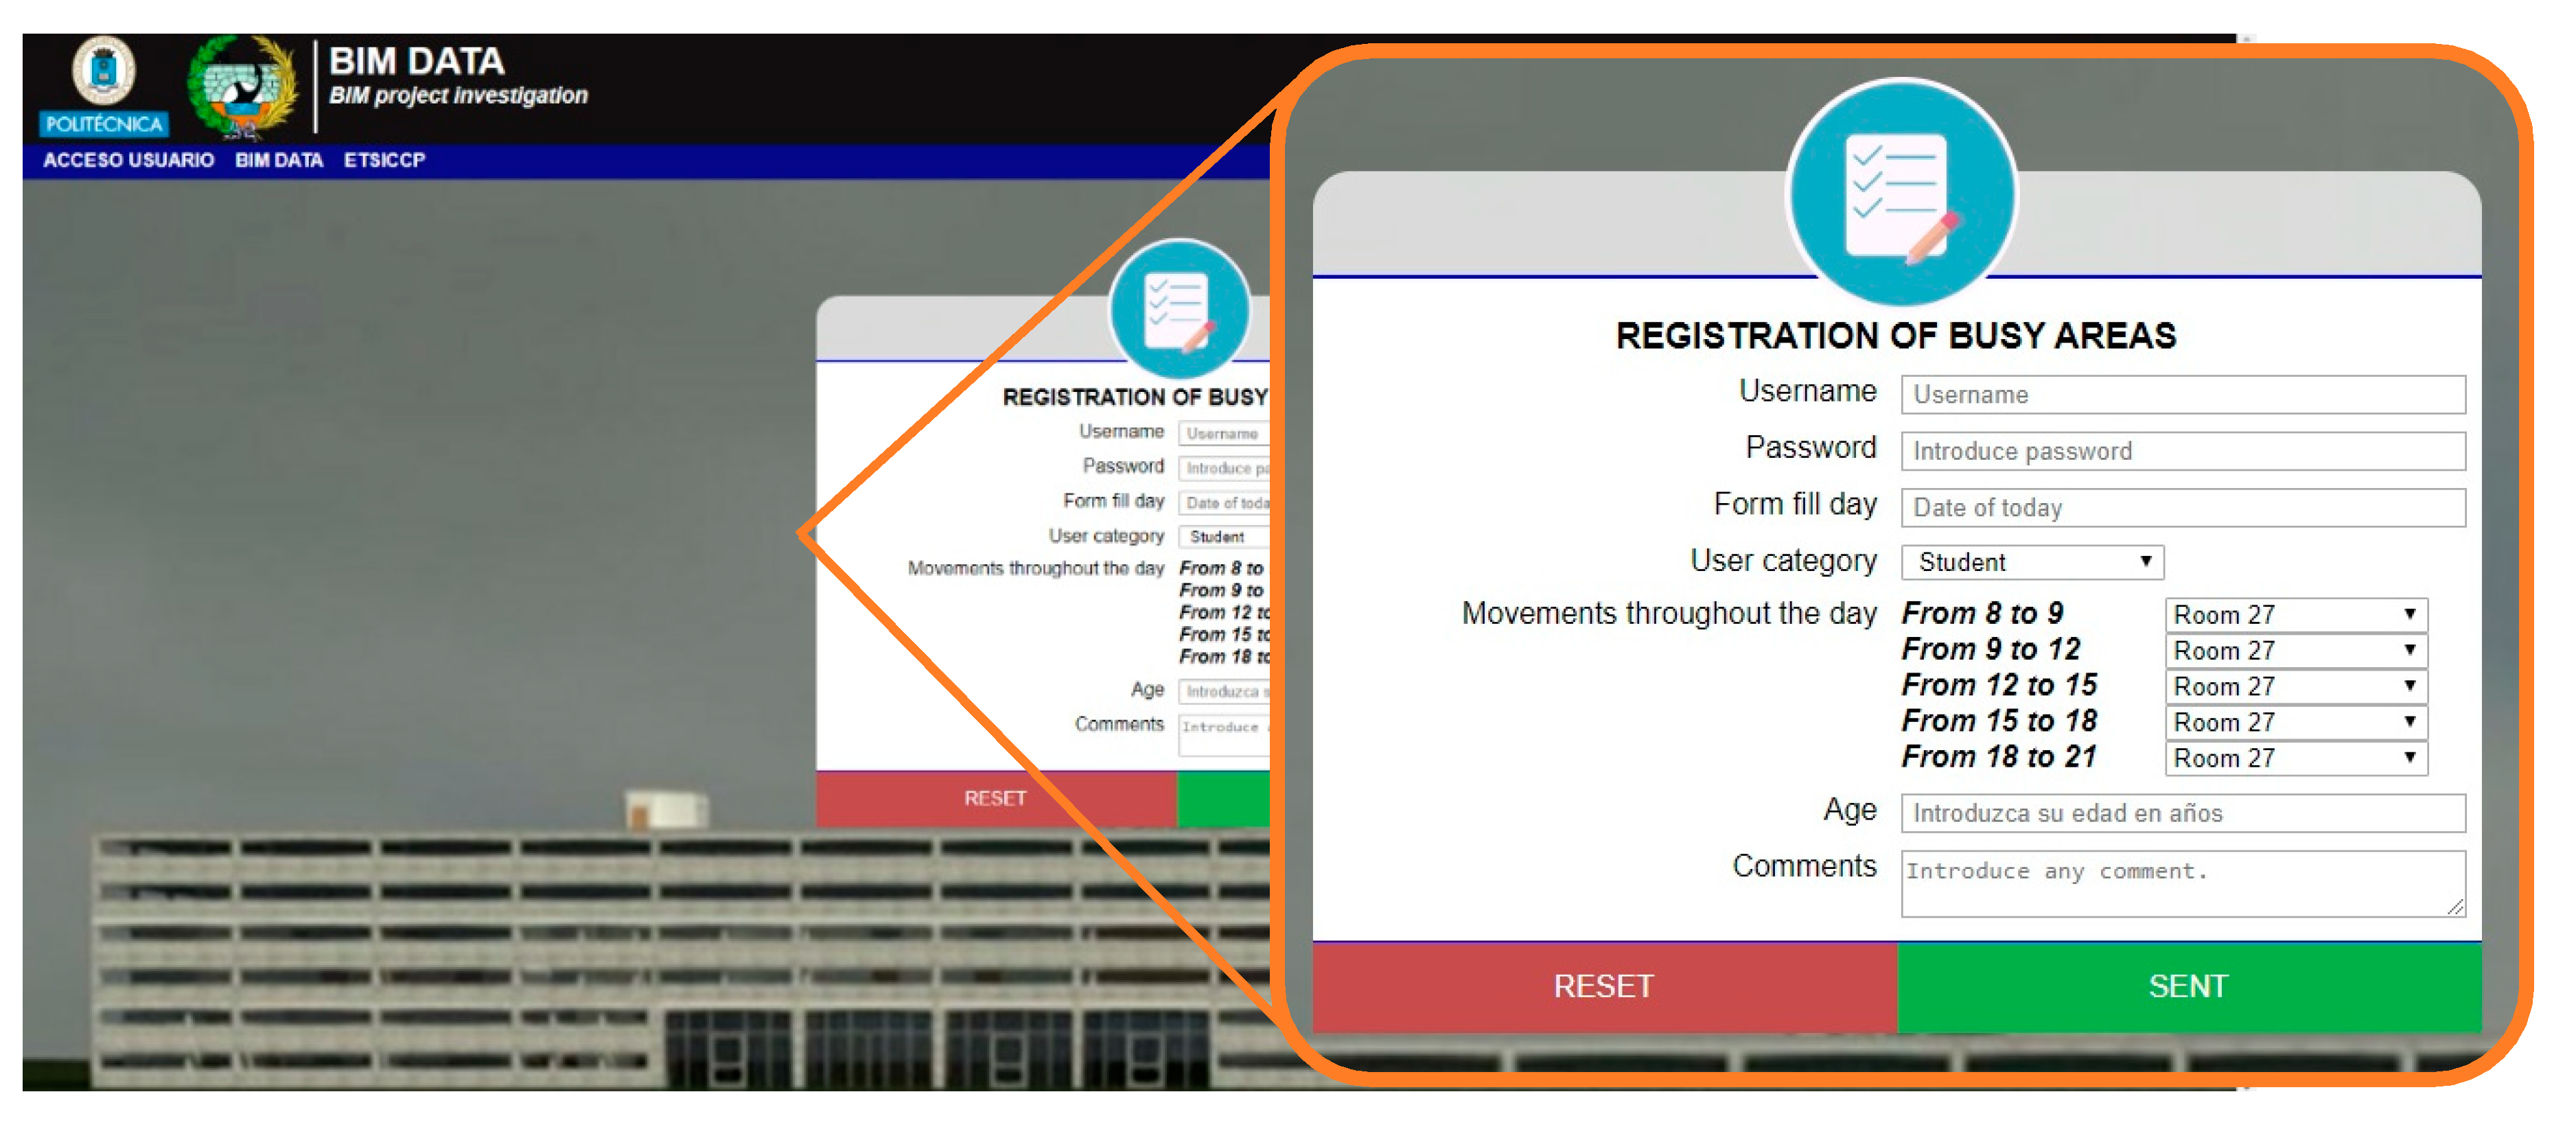
This Internet platform synchronized with BIM allows many possibilities. Starting with the beginning of this model application, it is necessary to collect many surveys. To solve this problem, the Internet platform http://www.biminfrastructure.com allows all users, previously registered, to fill in surveys by the presented form in Figure 9.
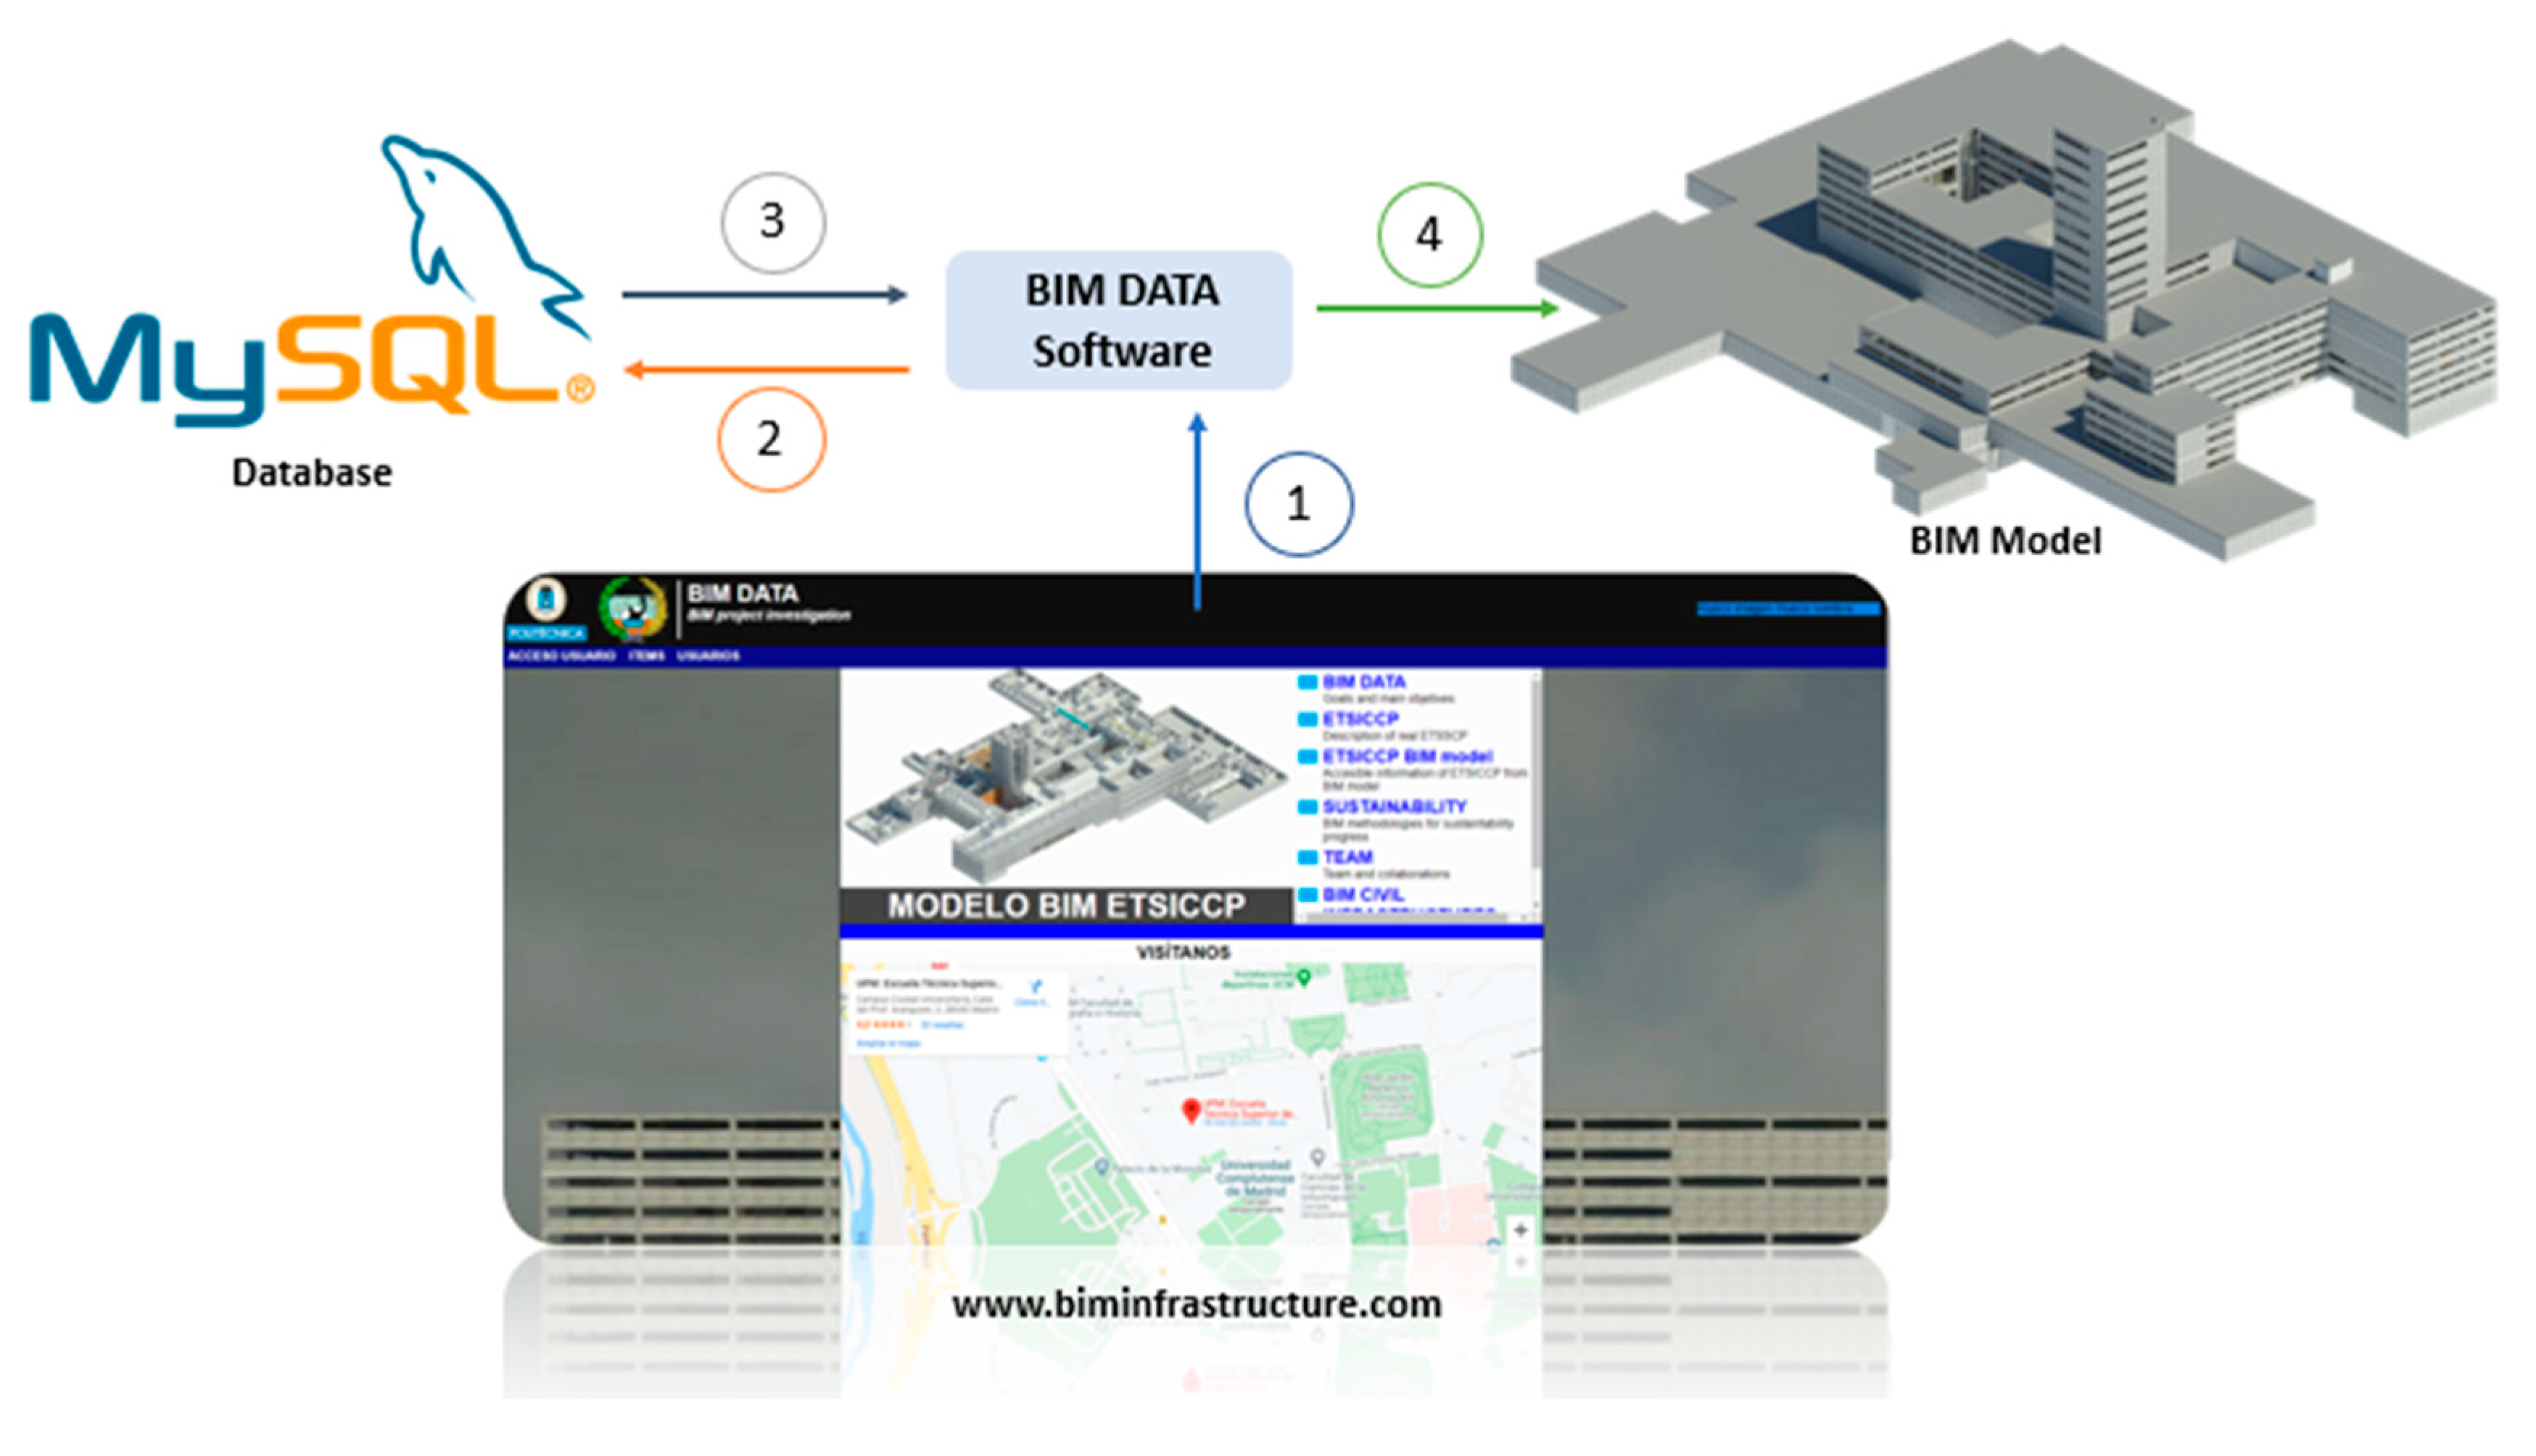
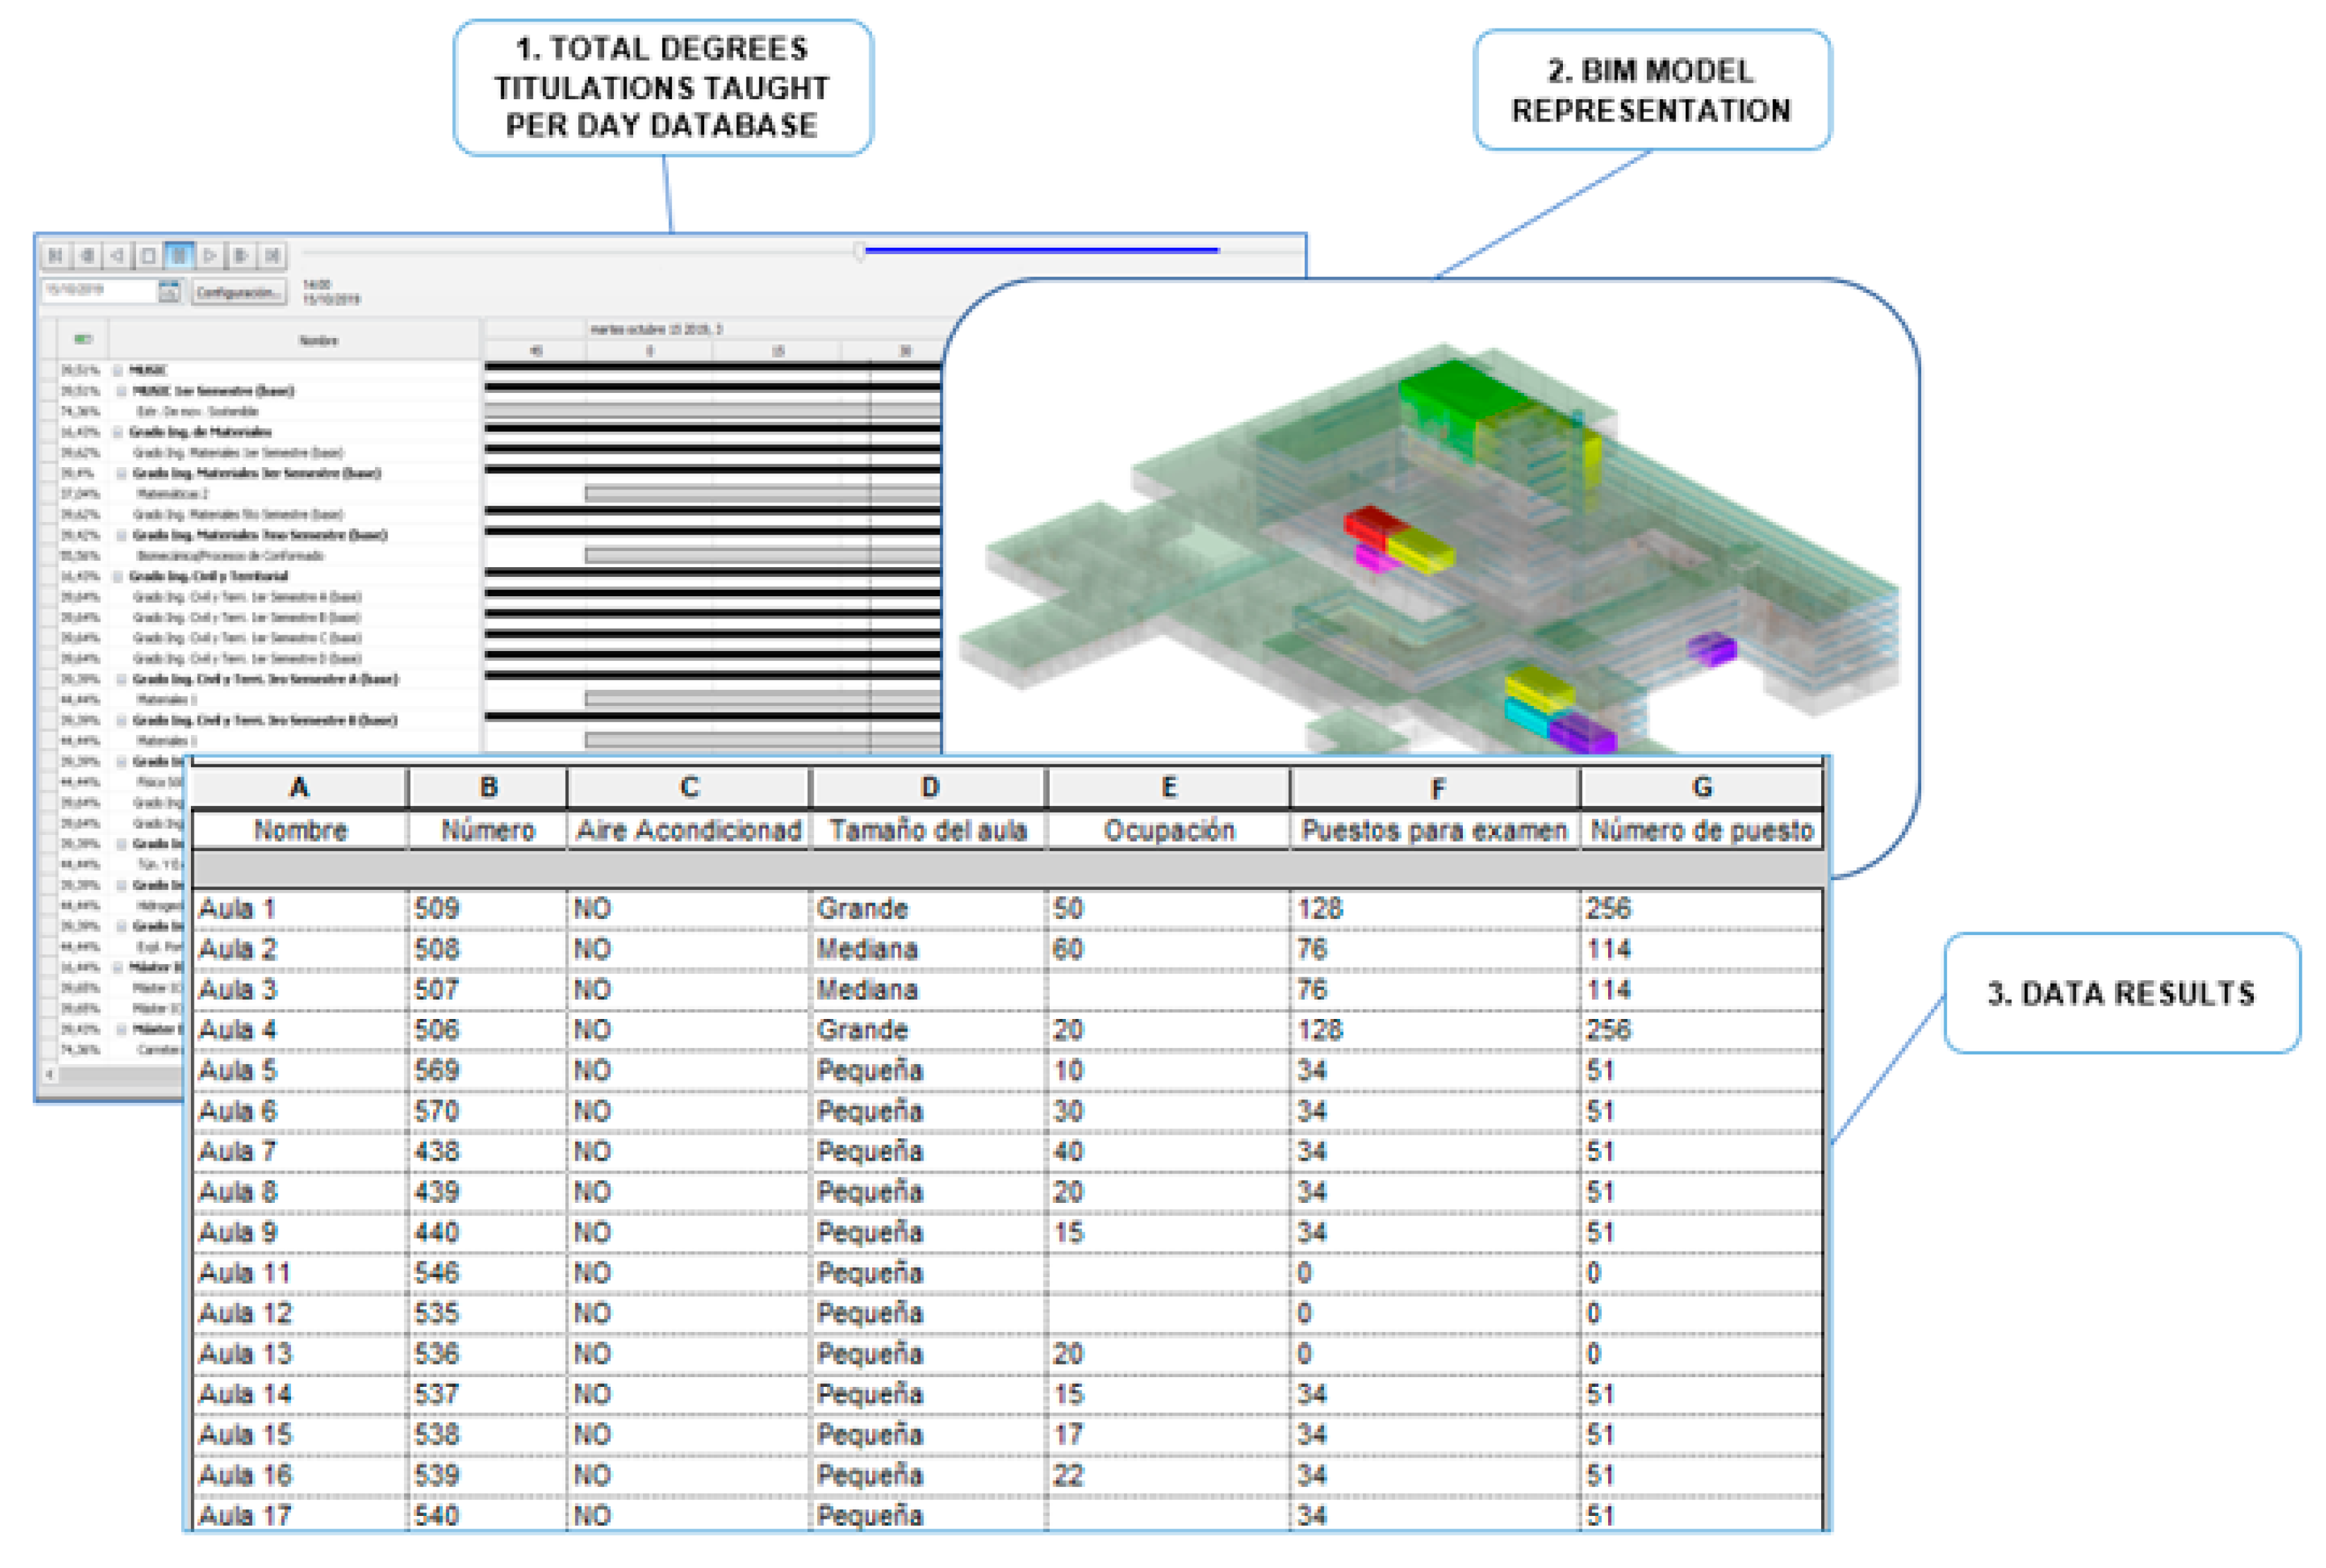
The collected information is inserted into a SQL database, articulated with the O-DM tables, which creates a daily basis graphical information that is represented inside the BIM model by a specifically developed program based on different programming languages. The information flows from the website to the final BIM model following the number sequence presented in Figure 10.
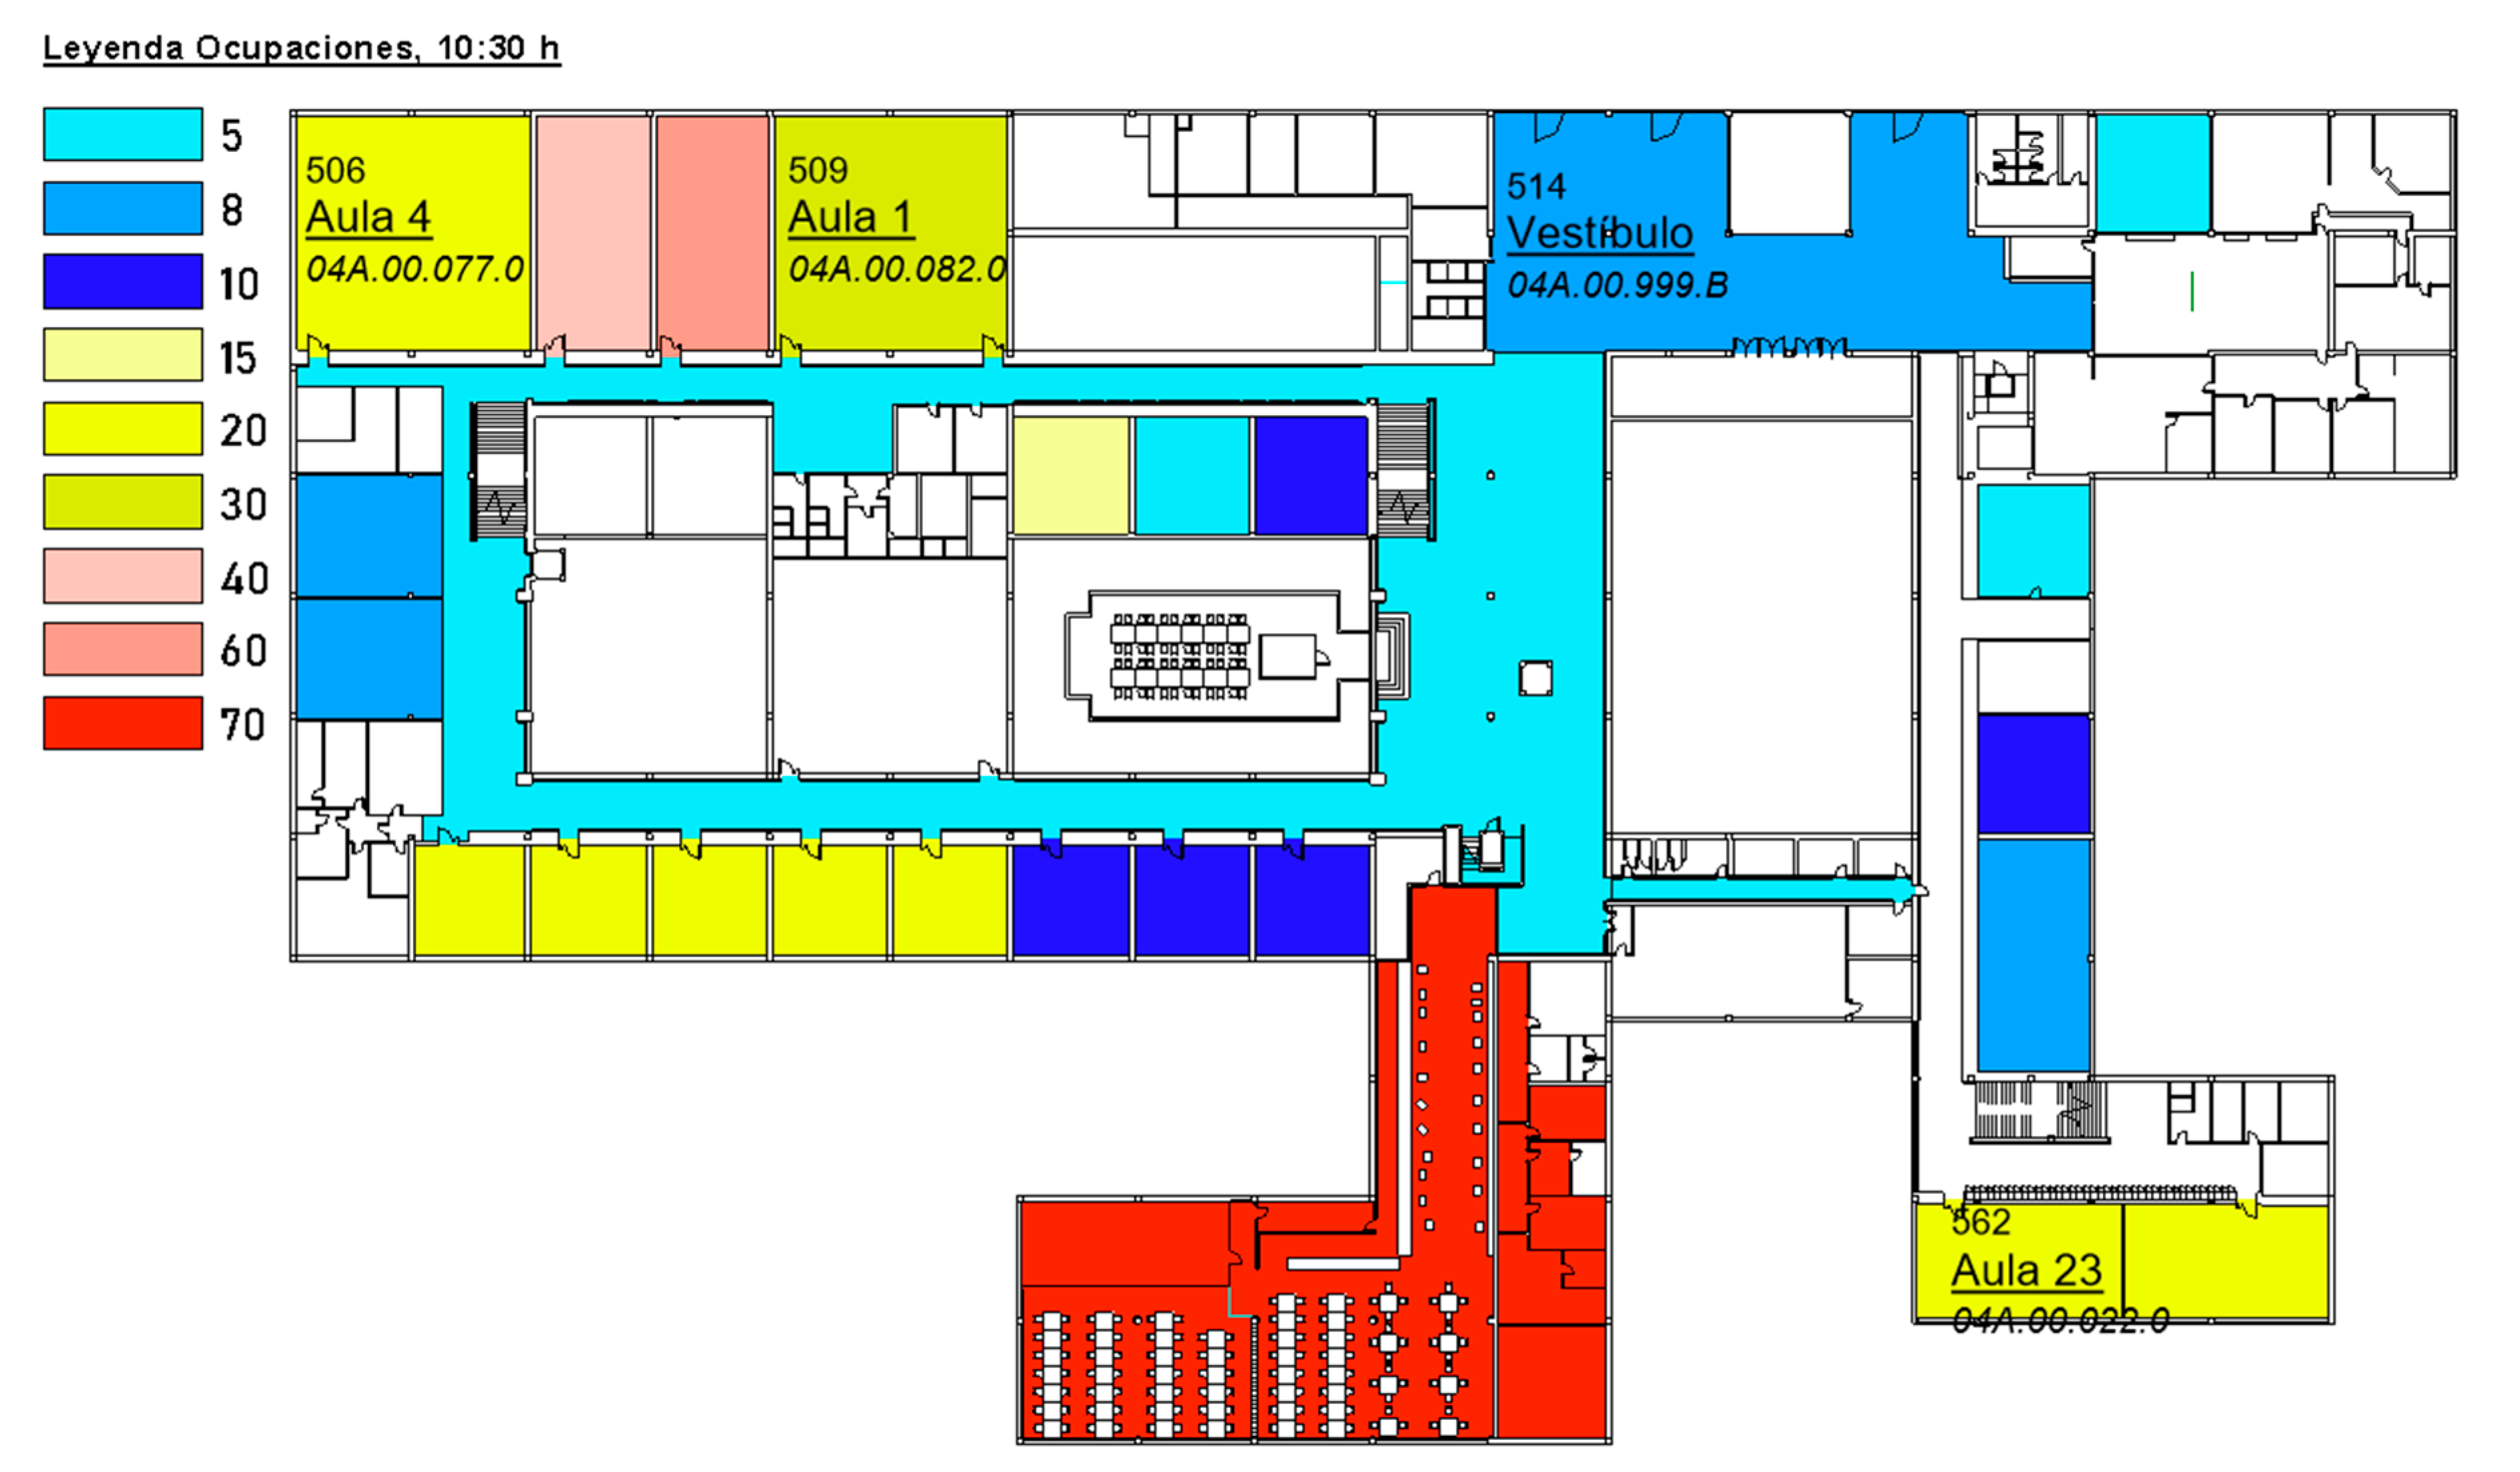
The final step identified by “4” in Figure 10 provides a visualization of hot spots in the infrastructure and the best way to avoid them. This process was performed by the BIM DATA software, which connects SQL databases with the BIM model through the use of Dynamo and Python programming languages. Thanks to the BIM model as a visualizer, it is possible to provide records of the best internal movement option, depending on the hour or a general visualization of hot spots located throughout the infrastructure. A color legend in the function of occupation of different zones (Figure 11) totally synchronized with the SQL database.
4.2. Restructuring of Students’ Placement
One of the possible measures in the educational sector to be implemented by the Spanish government is aimed at reducing the maximum number of students per room. In infrastructures such as the campus of ETSICCP, many degrees are imparted, and synchronization of all elements, schedules, teaching staff and new student locations is quite complicated. Only a global visualization of the teaching schedules can provide the required information to the management staff of the total occupied rooms and the free spaces available to redistribute the students. An example of internal infrastructure visualization is provided in Figure 12.
The process starts with a database (Figure 13) that collects all the degree schedules for every group and every subject throughout the whole academic year. The information is then assigned to the BIM model due to the specifically developed BIM DATA software. The visualization is totally filterable. Due to the BIM methodology, it is possible to export all the information to single tables related to any period of time, providing useful data such as room availability, real-time occupation, the size of the room, available positions for normal or evaluation classes or even the special equipment located in those rooms, such as air conditioning or the quality of the projector.
4.3. Temperature Camera Detector Synchronized with BIM
The use of the latest technology for capturing individual temperature information has been implemented in official locations in Spain because of the COVID-19 crisis. This solution is becoming more popular in the private sector, although the first installation of this kind of technology is related to the “IFEMA” building in Madrid, where a provisional emergency hospital was installed, and all temperatures for each person entering the area were measured. Taking one more step, it is possible to synchronize the information collected by Thermic Camera Detection (TCD) to a developed BIM model.
Modeling a TCD inside the BIM model allows the infrastructure management staff to expand the information related to this camera. Working with TCD without BIM synchronization provides thermic information and the capacity to register it. However, by implementing the BIM platform, it is possible to easily locate the source of information, synchronize the modeled TCD to official documentation or maintenance requirements or assign thermal information to BIM information directly, such as occupation, schedules, and so on.
4.4. Seat Reservation for Students
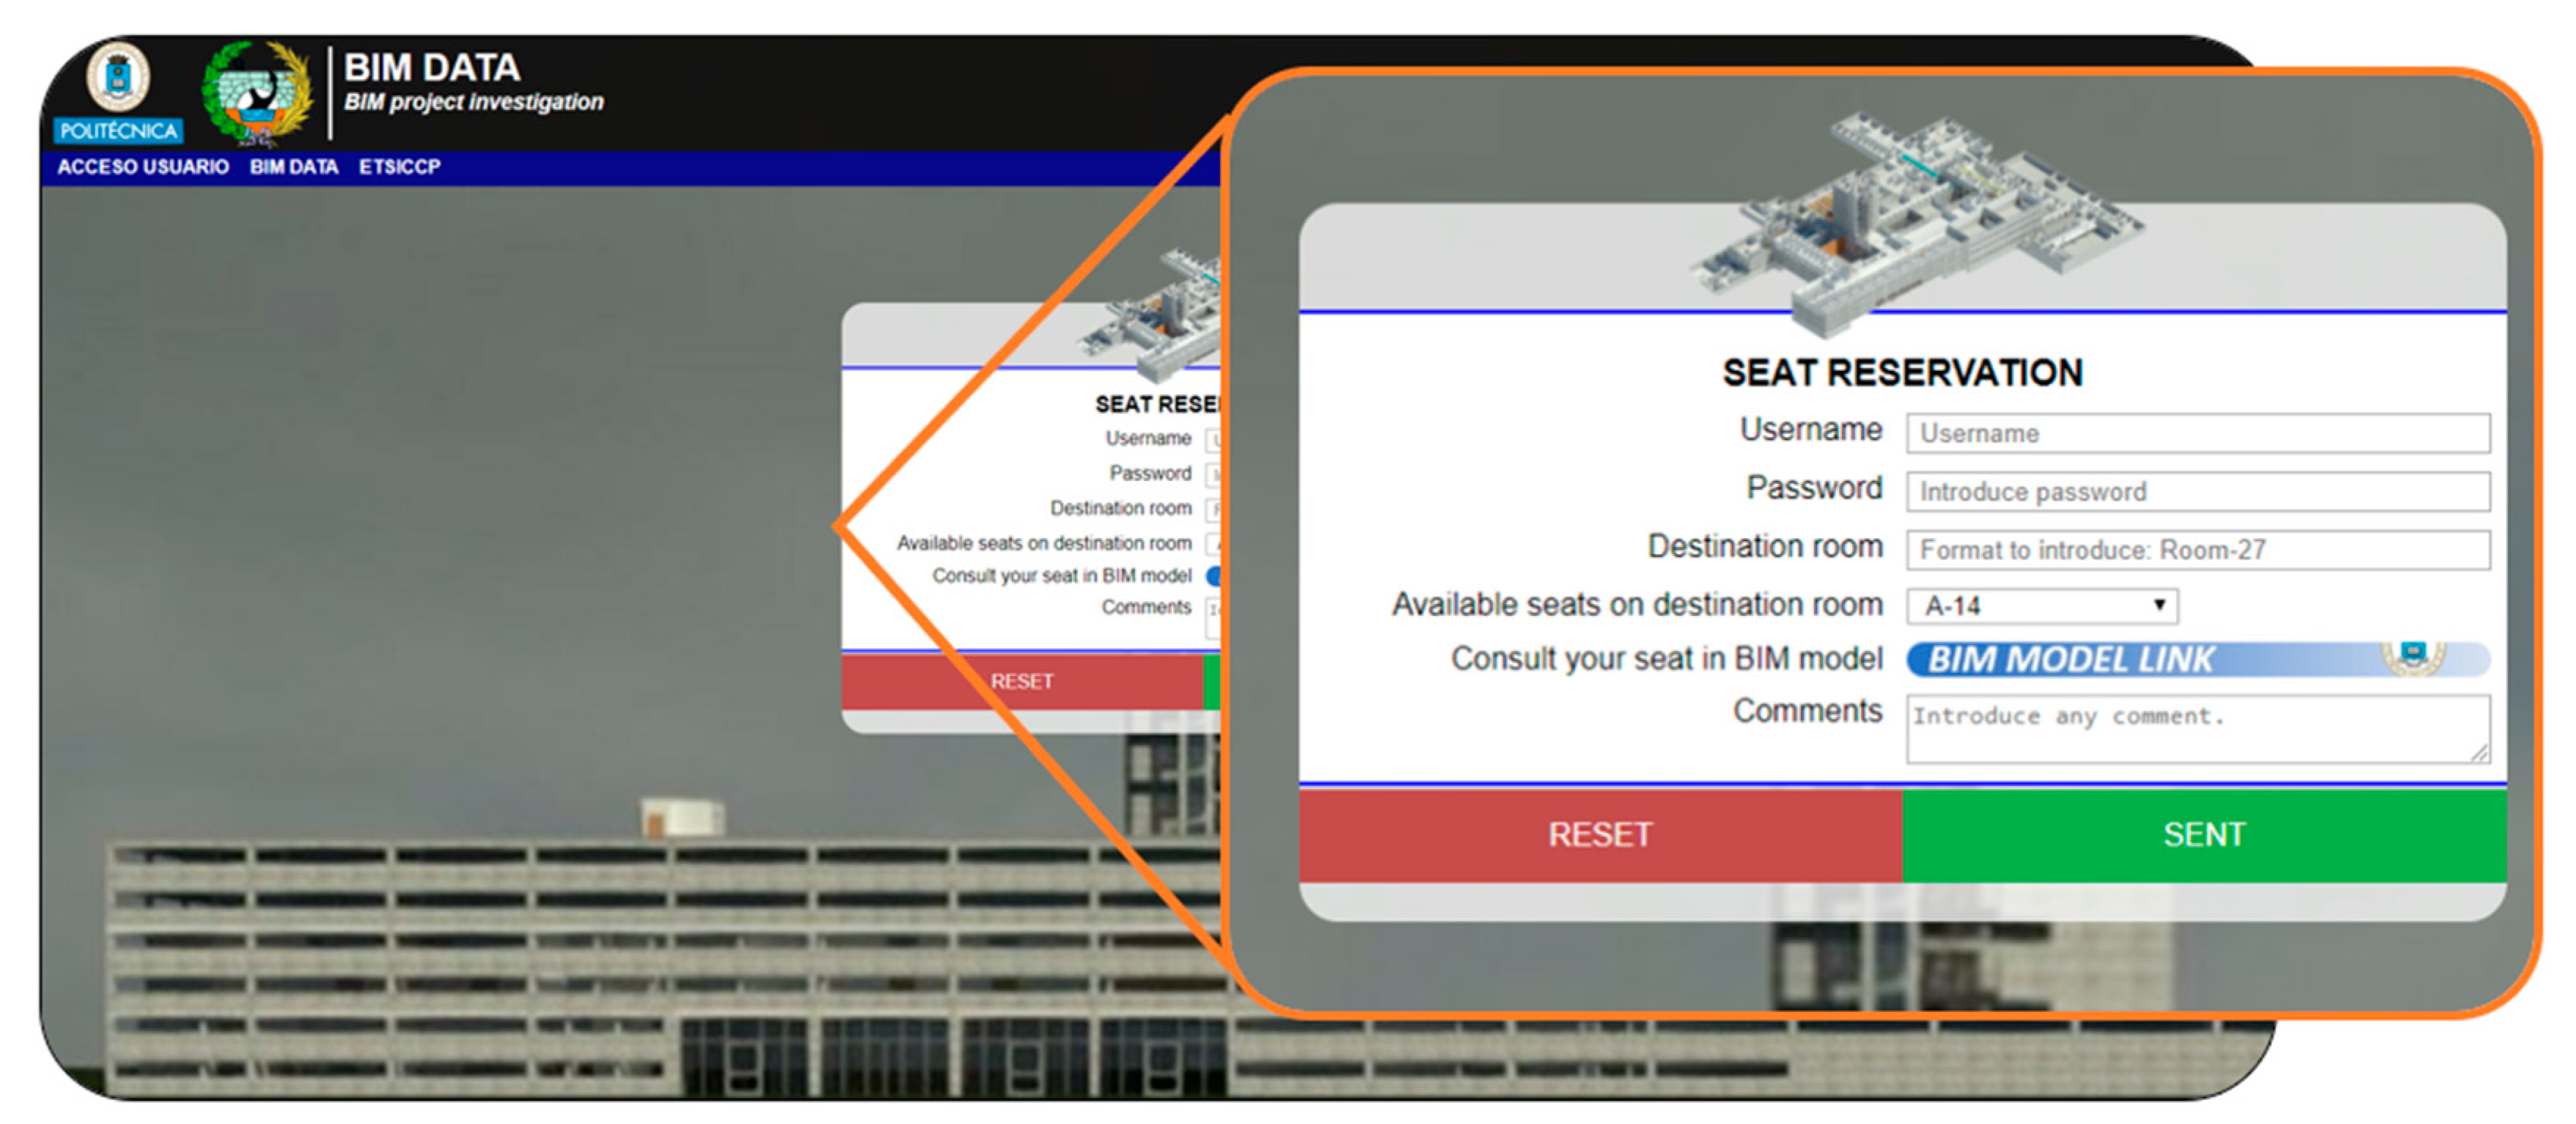
As mentioned in previous sections of this paper, one of the possible future measures for educational buildings to fight against COVID-19 is the limitation of the number of students per room. One of the solutions provided by BIM is the restructuring of student placement. However, another useful tool that could be provided by BIM methodology is seat reservation for students. This tool is crucial to keeping the normal scheduling and to avoid crowds of people. In this way, by previously checking the available rooms in the infrastructure with the tool described in 4.2, it is possible to obtain information of all seats and the respective rooms available and allocated to a certain class via the Internet.
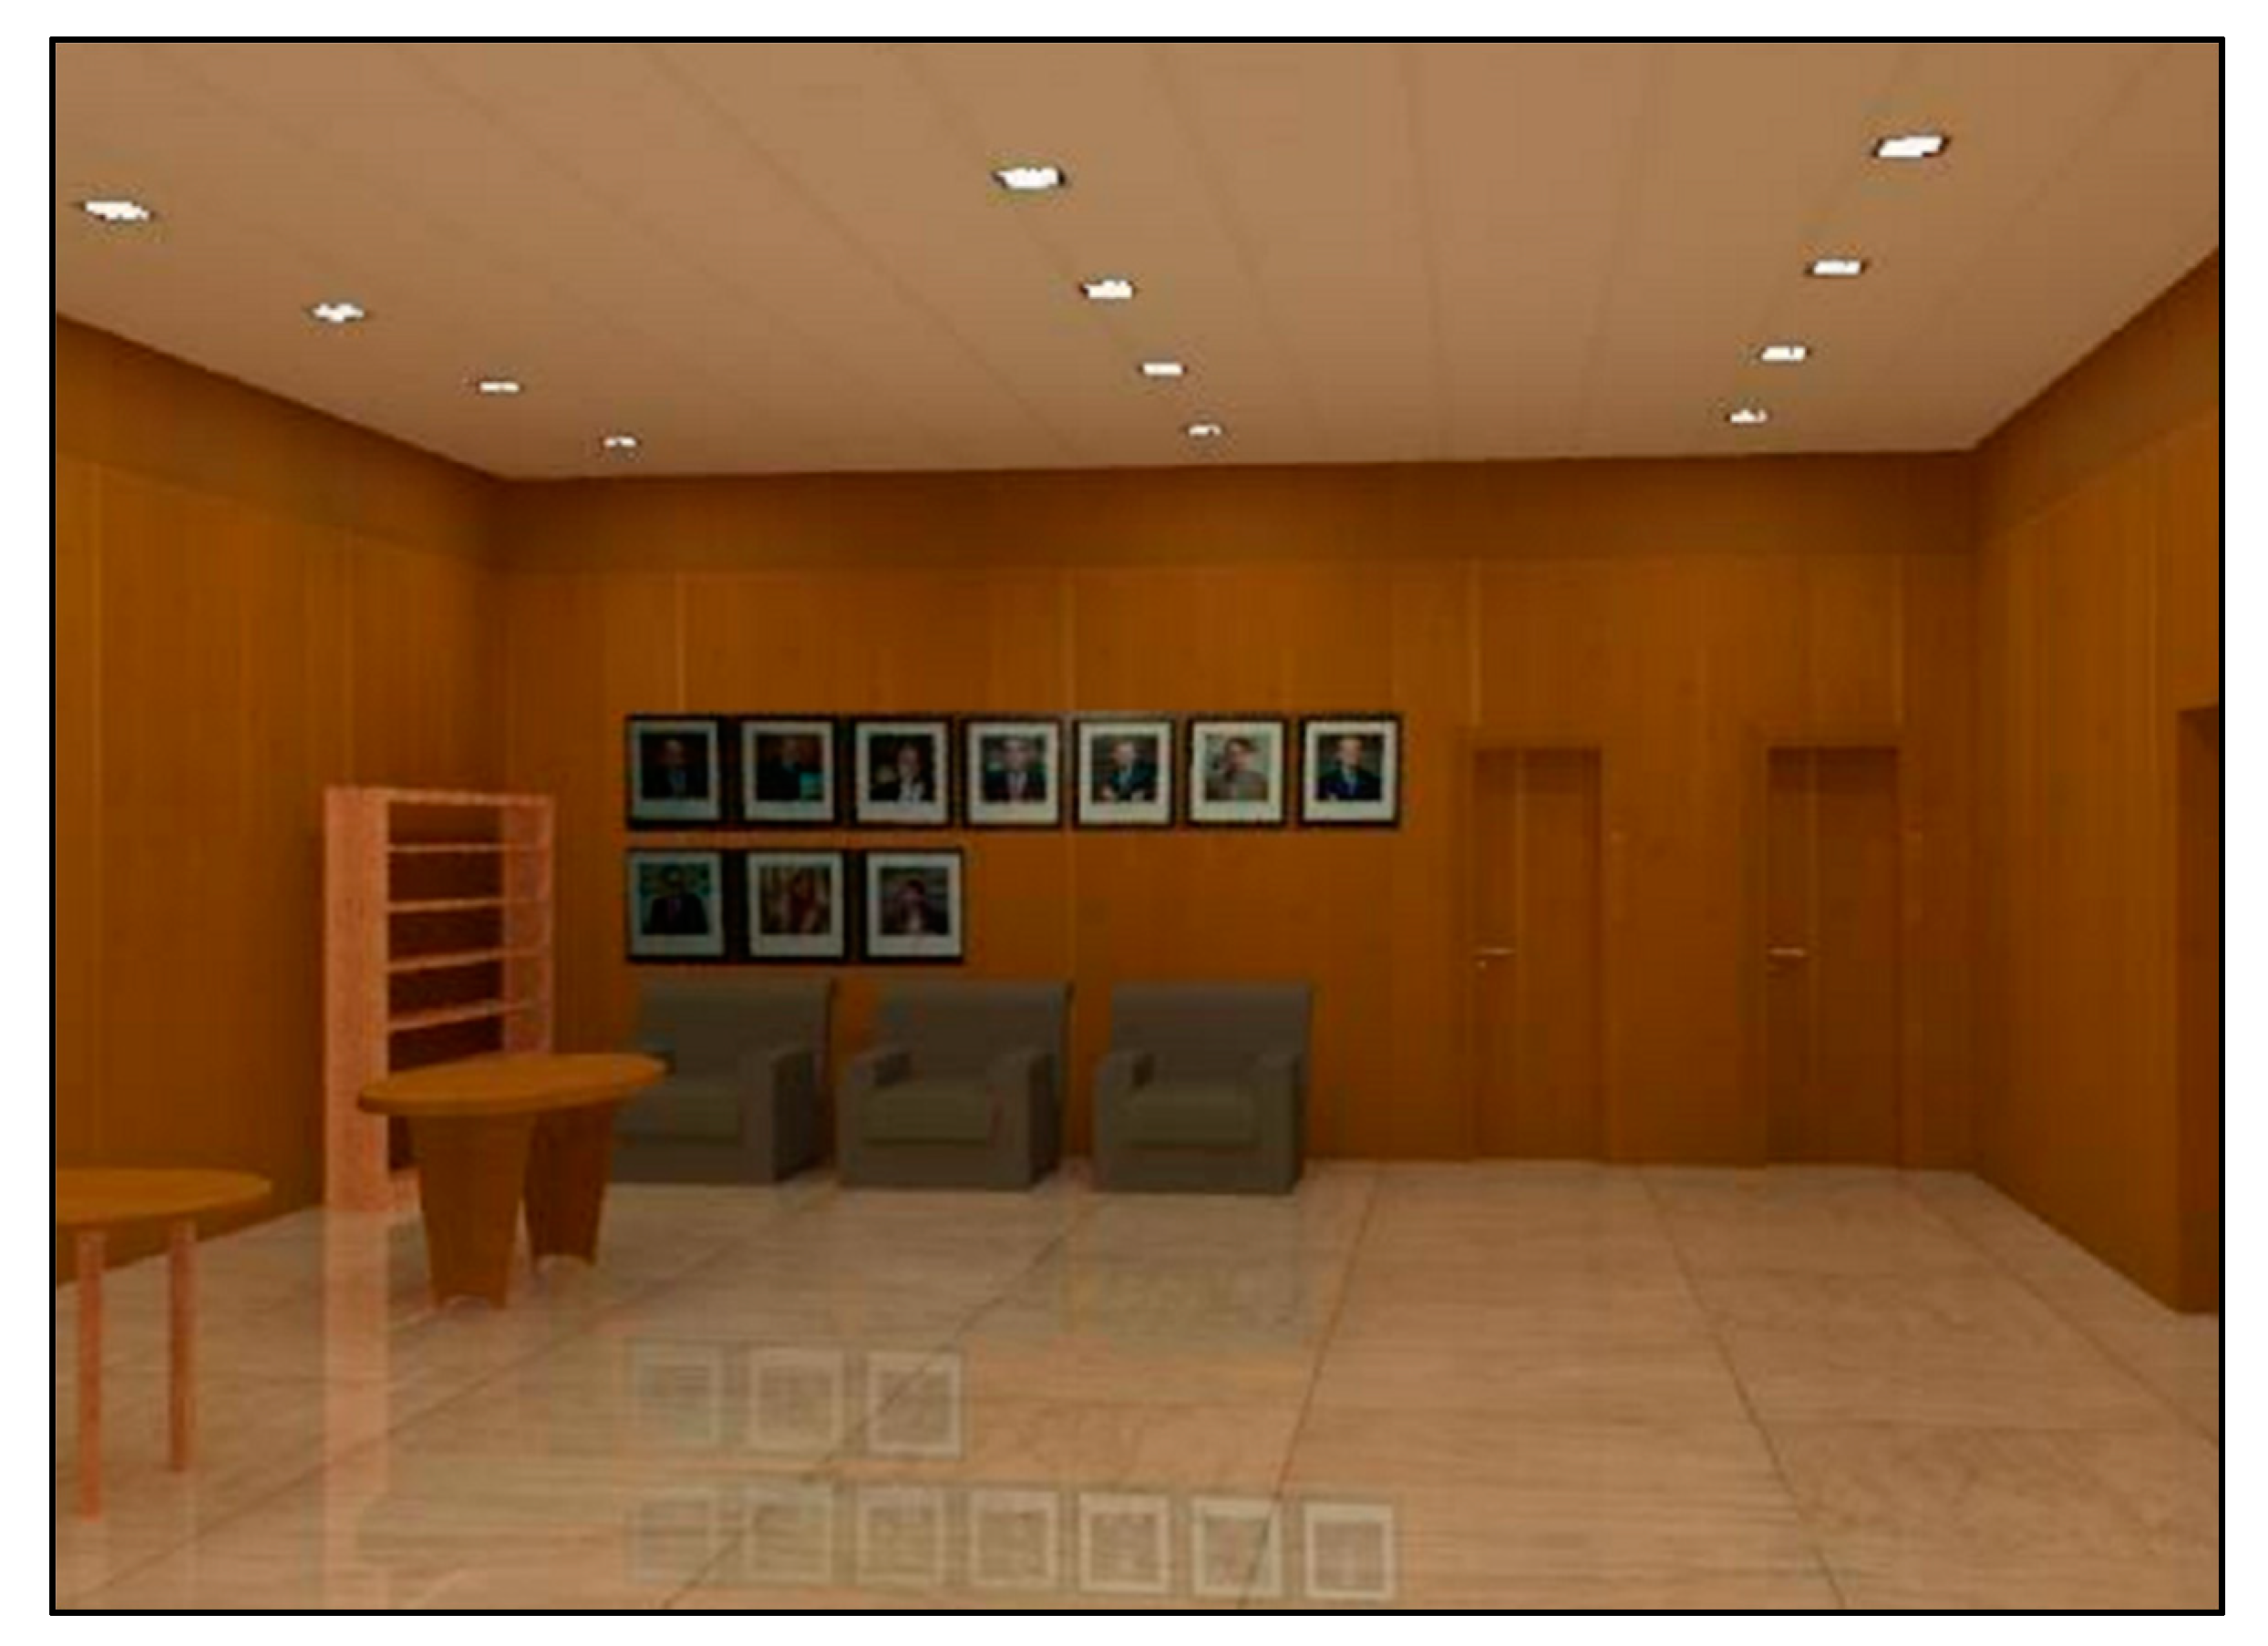
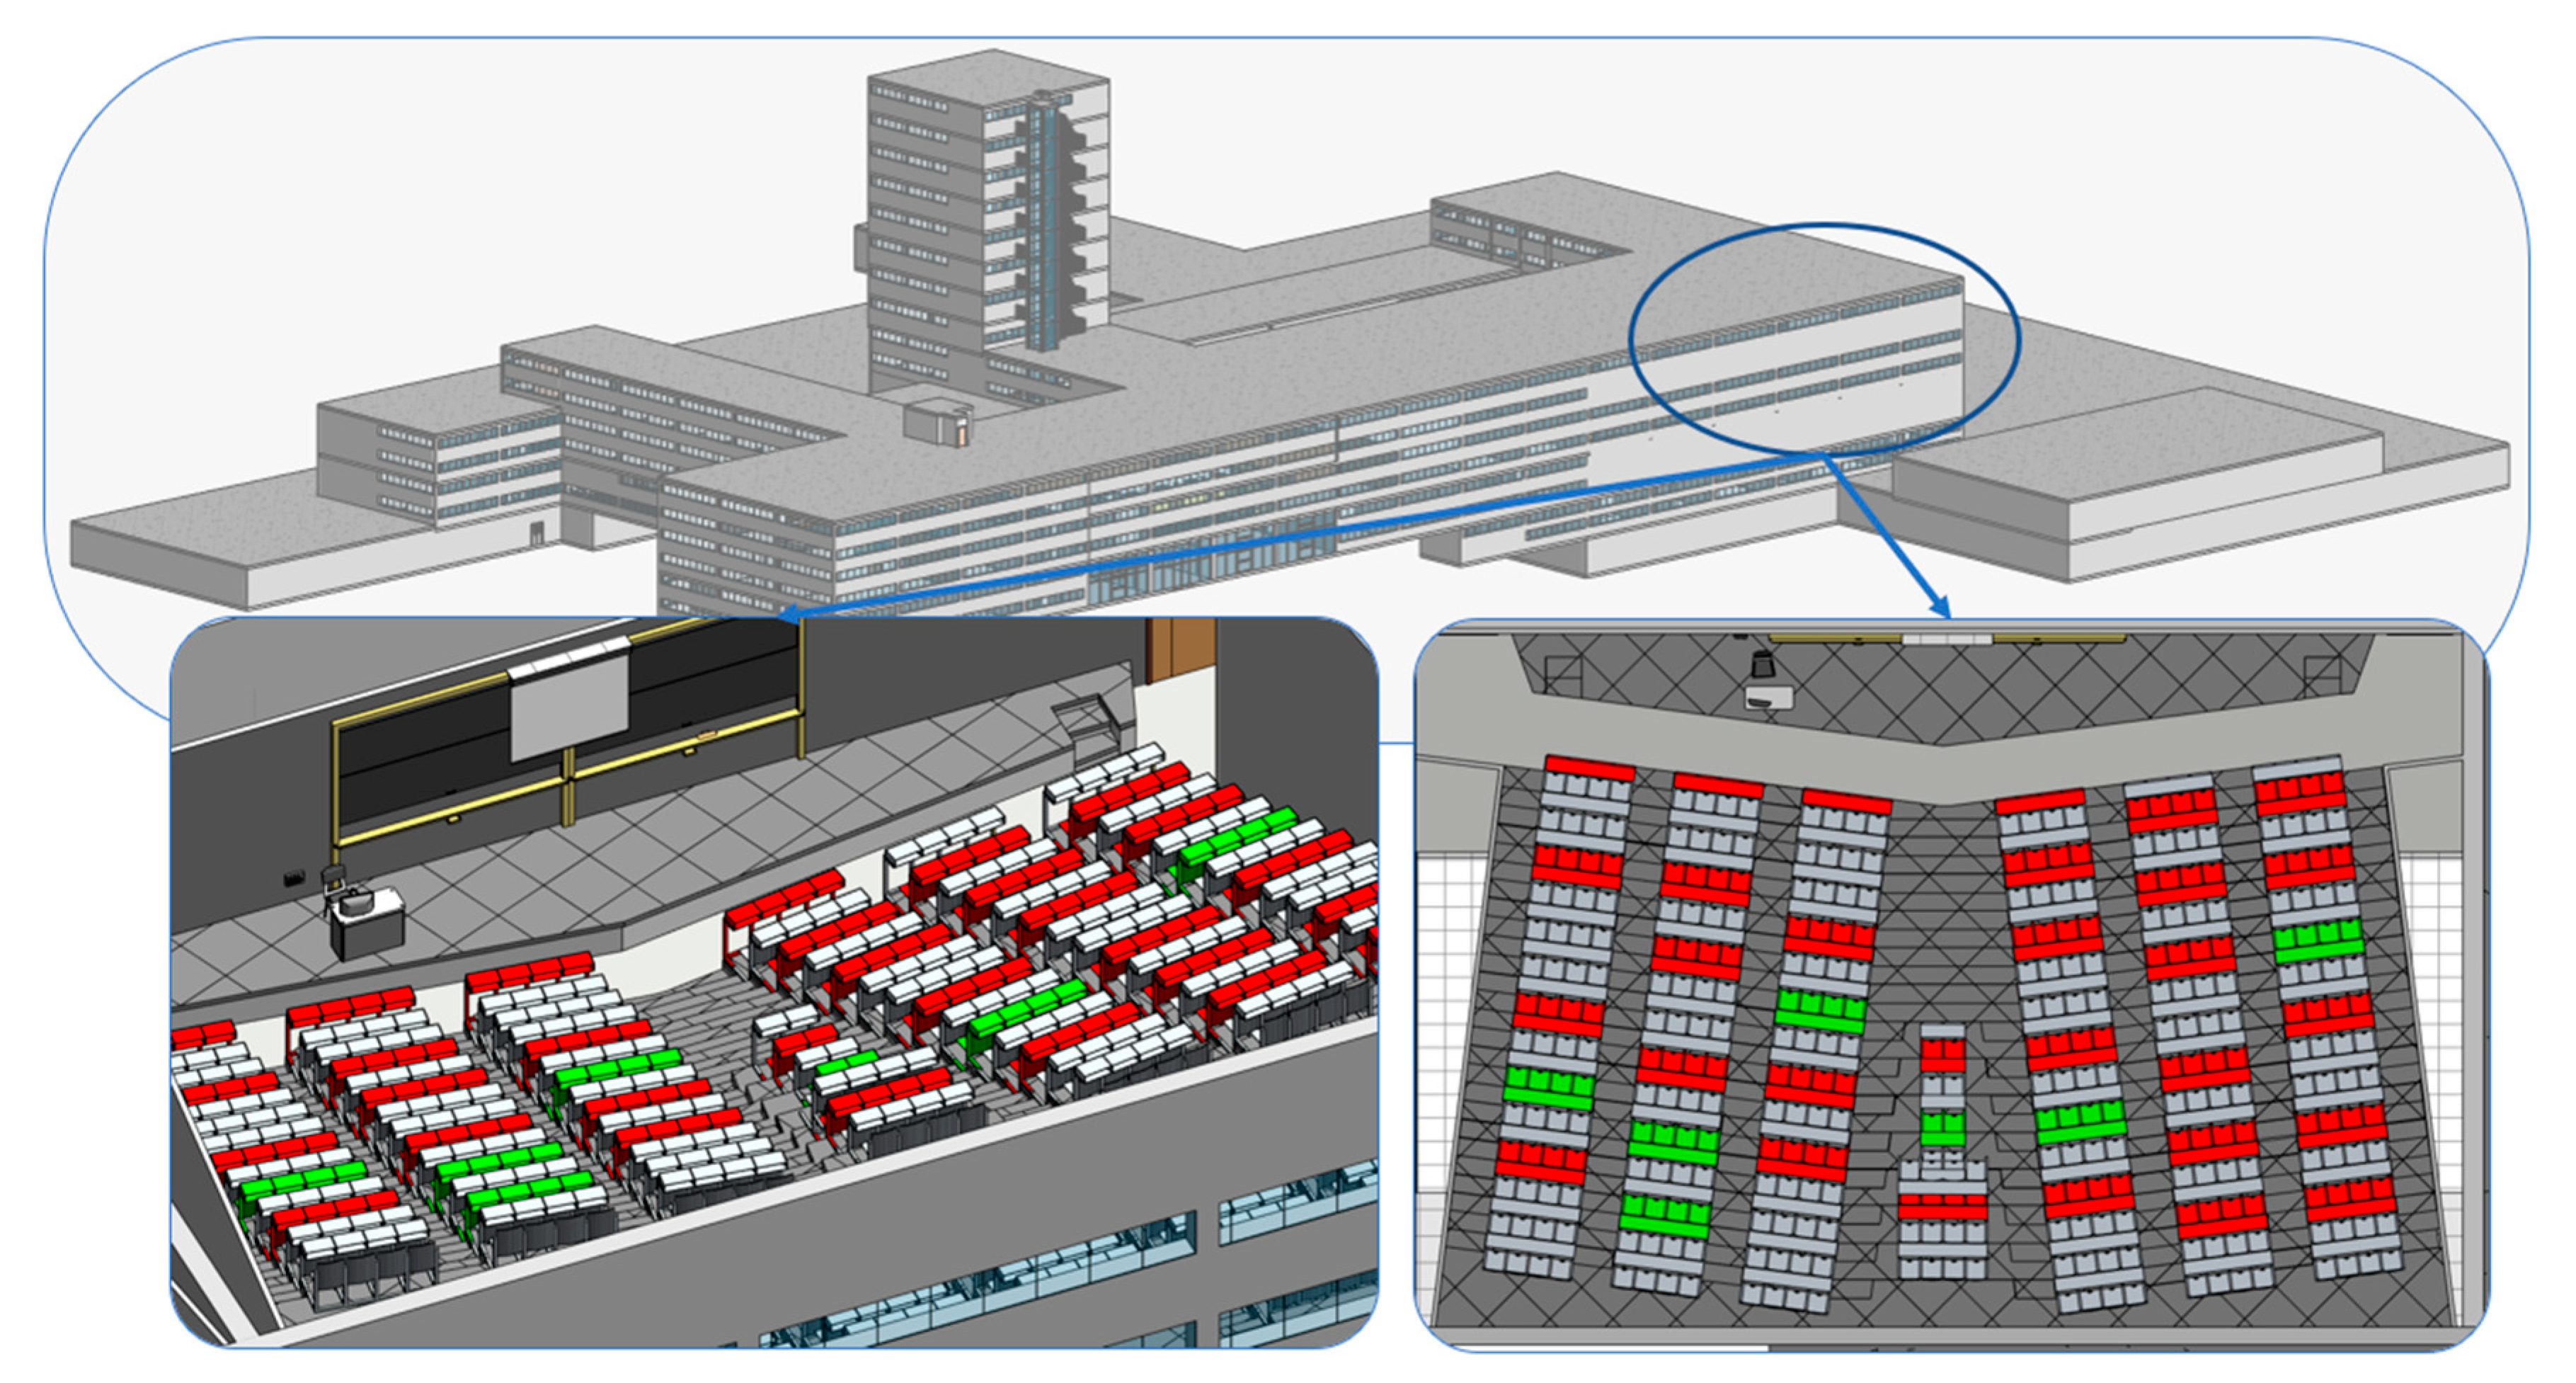
As shown in Figure 14, all students could have access to all database BIM information through the Internet, providing them the available seat in the desired destination room and the possibility to view their seats in a totally detailed environment, as shown in Figure 15, with the BIM model visualization tools.
5. Discussion
The key point of the methodology proposed in this study was the three-dimensional model of the building. The BIM model was considered as a central information repository. Due to such a model, it was possible to provide the user with a total visual environment. Thus, the model allowed a much more intuitive and user-friendly interface.
BIM-based FM applications are currently part of developing technology. One of the main advantages is that the BIM model enables hosting information that can be associated with any phase of the project [11,12,15,20]. Even with this developing technology, not all information can be linked with the BIM model due to the different data nature or origin. As an example, in a traditional management methodology, energy consumption and room occupancies are not operated through the same system, allowing linking those parameters between them. This project sought the use of the BIM model as the neural center of management [18], where all the infrastructure parameters could be associated.
Having such a model as a host, algorithms based on origin–destination matrices have been employed. Such algorithms are used in transport engineering projects, usually applying to traffic simulations. The application of such matrices in this study was performed by dividing the building into different zones. Each zone was analyzed as a departure or attraction point for each time period. The results extracted from the matrices were linked to the BIM model, providing the user with a simple and visual tool based on color fills for a better understanding.
The organization and the rooms’ occupancy levels for the academic year 2020/2021 of the ETSICCP of UPM have been developed through the BIM-based FM methodology. Implementing the Spanish regulations and measures to mitigate against COVID-19 resurgence [7], especially referring to occupancy criteria, has been possible due to the BIM model. This mostly comprises social distancing of 1.5 m between students and an occupancy rate of all rooms reduced to 30% of normal. This led to the conclusion that a face-to-face teaching methodology was not possible. However, an alternative was studied with 1 m of social distancing between students and a protection helmet screen for each one. Applying this restriction in the model, the rooms’ capacity was reduced to 50%. Thus, under these requirements, the model showed that face-to-face teaching methodology for the 2020–2021 academic year was possible, and it is taking place at the time of writing. This was studied in a one-week process, only possible with the BIM-based FM methodology shown in this study.
The BIM-FM system was designed to permit synchronization to book a seat for a specific hour. It also permits checking any parameter of the infrastructure, such as lockers or parking space availability. The challenge was to manage such facilities by a single accessible system, avoiding the initial rejection of the users to manage more than one system for each parameter [10]. That is to say, the system developed in this study permitted hosting tasks with data coming from quite a different structure and origin. To do so, the software developed links the BIM model with the most relevant management tasks that were traditionally managed from separated formats. Moreover, this was achieved through a user-friendly Internet page.
Hence, the main advantages of this project could be divided into two main groups: FM and BIM. Regarding FM, the application of origin–destination matrices had always been related to transport projects with no practical cases associated with the management of buildings. In this study, an infrastructure with 40,000 m² was considered as a transportation zone, with a capacity for more than 4000 students per day. Regarding BIM, several authors have mentioned common barriers, such as extra training for personnel to use the BIM software, extra costs for powerful hardware to run the methodology or the fact that only management staff benefits from the BIM tools [11,12,14,15,20]. With this development, BIM benefits can be used by all infrastructure users and through an intuitive and accessible Internet website from any smart device. Users do not need to have specific training to check or manage the information. Moreover, it should be mentioned that the main target achieved was the real-time link of the management databases with the BIM model. For this purpose, Python software was developed to interact with external databases and BIM model parameters, running on an Internet-accessible website.
The developments and findings of this study entailed going one step beyond regarding BIM and FM previous published research. Significant advances in the synchronization of databases with large BIM models have been achieved [29,30,31]. Python has been used as the main programming language. The computer programming uses HTML code to provide user access through the Internet, which permits the use of these tools without any previous education on BIM. With this complete implementation, users would provide occupancy information and make possible the O-DM application in all the infrastructure spaces. This study has helped the management of COVID-19 and nears the ETSICCP closer to the Smart Campus concept [36]. The significance of this research relies on the advanced use and combination of mathematical methods, BIM, computer codes, FM tools and databases to achieve safer management of a large and populated public building, such as ETSICCP, in use during the pandemic context provoked by COVID-19.
6. Conclusions
The current worldwide situation demands global action to take action against the current resurgence of COVID-19. With information relative to the 11 November of 2020, globally, there are 49,727,316 cases of infection and a total of 1,248,373 deaths according to the official situation report of the World Health Organization. With over 25,531 new deaths in the last seven days in Europe and 17,289 in the Americas, the end of this situation is not in sight. New technological developments and applications could provide useful tools against the spread of COVID-19. A BIM management system for educational infrastructure is detailed in this paper, providing new infrastructure information to monitor and control the safety of all zones in the building during the regular educational activities.
BIM methodology has demonstrated multiple benefits either in all project phases or in many kinds of infrastructure, such as bridges, tunnels, or buildings. With the clear advantage detailed by many researchers of improving the flow of information through all the entities related to the project, especially in complex infrastructures such hospitals, University Campuses and Airports, this feature links directly with the current pandemic situation, where data flow for all the persons involved in a building requires fast and detailed information. In this way, the BIM DATA software project developed in this research provides real data information for room occupancy and areas with a high confluence of people. Moreover, Spanish regulations for the new academic year 2020–2021 promotes semi on-site teaching classes that could be managed by BIM system software so that students could reserve seats for daily classes while maintaining the safety distance between them.
The highlight of this research is the capability of the developed BIM DATA software to provide access to all BIM information through the Internet, improving its accessibility when, traditionally, only people with BIM skills or commercial software were able to access such information. This capability would make it possible for either students, teachers, maintenance or management staff to access all detailed information related to infrastructure management through any device.
BIM-based tools have been developed associated with seat reservation, internal infrastructure paths tracking, reconfiguring room capacity and temperature control linking with a three-dimensional BIM model. Such tools entailed processing information from different origins. With the previous management methodologies, multiple systems had to be installed. The developed tools provide all management needs in an integral way and totally accessible through the Internet. Several authors [14,18] cited the need for new information standards linking BIM with different management tasks as the main barrier to implementing BIM management methodology. Moreover, the exclusive software training needed to use BIM methodology makes it more difficult to apply this methodology to all entities involved in the infrastructure lifecycle. As a result of the research project, a total digital infrastructure environment could be used by all building users. The outstanding results of this system’s applications are the occupation and capacity criteria for the academic year 2020–2021. All rooms of the infrastructure were analyzed by different occupation criteria according to Spanish national rules for COVID-19 management in public buildings. Results and graphical information were ready in a one-week period. This analysis would have been unfeasible in that time with no BIM management system. Moreover, the application of the O-DM in all the infrastructure may provide the users with the best movement alternatives through the website.
Author Contributions
Conceptualization, M.G.A.; Data curation, R.M.P.; Formal analysis, A.A.A.A. and M.G.A.; Investigation, R.M.P. and M.G.A.; Methodology, A.A.A.A. and M.G.A.; Project administration, M.G.A.; Resources, A.A.A.A. and M.G.A.; Software, R.M.P.; Supervision, A.A.A.A. and M.G.A.; Validation, M.G.A.; Visualization, R.M.P.; Writing–original draft, R.M.P. and M.G.A.; Writing–review & editing, A.A.A.A. and M.G.A. All authors have read and agreed to the published version of the manuscript.
Funding
The APC was funded by the Enterprise University Chair Calle30-UPM.
Acknowledgments
The authors gratefully acknowledge the financial support provided by the Ministry of Economy, Industry and Competitiveness of Spain by means of the Research Fund Project PID2019-108978RB-C31. They also offer their gratitude to Calle 30 for supporting the Enterprise University Chair Calle30-UPM and to the “Colegio de Ingenieros de Caminos, Canales y Puertos” for awarding the Final Master´s Thesis as the most innovative project in the national contest of 2019. The authors also acknowledge the support provided by the UPM through the Educational Innovation Project IE1920.0409 as well as the support of the Leadership Team of the ETSICCP.
Conflicts of Interest
The authors declare no conflict of interest.
References
- Pavón, R.M.; Alvarez, A.A.; Alberti, M.G. BIM-Based Educational and Facility Management of Large University Venues. Appl. Sci. 2020, 10, 7976. [Google Scholar] [CrossRef]
- McKibbin, W.J.; Fernando, R. The Global Macroeconomic Impacts of COVID-19: Seven Scenarios. SSRN Electron. J. 2020, 45. [Google Scholar] [CrossRef] [Green Version]
- Viscusi, W.K.; Hakes, J.K.; Carlin, A. Measures of Mortality Risks. J. Risk Uncertain. 1997, 14, 213–233. [Google Scholar] [CrossRef]
- World Health Organization Coronavirus Disease (COVID-19); Situation Report – 111; 2020; Available online: https://www.who.int/docs/default-source/coronaviruse/situation-reports/20200510covid-19-sitrep-111.pdf?sfvrsn=1896976f_6 (accessed on 27 November 2020).
- World Health Organization COVID-19 Weekly Epidemiological Update. Available online: https://www.who.int/publications/m/item/weekly-epidemiological-update---10-november-2020 (accessed on 27 November 2020).
- Legido-Quigley, H.; Mateos-García, J.T.; Campos, V.R.; Gea-Sánchez, M.; Muntaner, C.; McKee, M. The resilience of the Spanish health system against the COVID-19 pandemic. Lancet Public Heal. 2020, 5, e251–e252. [Google Scholar] [CrossRef] [Green Version]
- Gobierno de España. Plan para la Transición hacia una nueva normalidad; Spain; 2020; Available online: https://www.lamoncloa.gob.es/covid-19/Paginas/plan-transicion.aspx (accessed on 27 November 2020).
- Gobierno de España. Datos oficiales COVID-19. Ministerio de Sanidad; 2020; Available online: https://cnecovid.isciii.es/covid19/#ccaa (accessed on 27 November 2020).
- Donath, D. Bauaufnahme und Planung im Bestand; Springer Science and Business Media LLC: Berlin, Germany, 2009. [Google Scholar]
- Redmond, A.; Hore, A.; Alshawi, M.; West, R. Exploring how information exchanges can be enhanced through Cloud BIM. Autom. Constr. 2012, 24, 175–183. [Google Scholar] [CrossRef]
- Wang, X. BIM Handbook: A guide to Building Information Modeling for owners, managers, designers, engineers and contractors. Constr. Econ. Build. 2012, 12, 101–102. [Google Scholar] [CrossRef] [Green Version]
- Watson, A. Digital buildings-Challenges and opportunities. Adv. Eng. Inform. 2011, 25, 573–581. [Google Scholar] [CrossRef]
- Borrmann, A.; Rank, E. Specification and implementation of directional operators in a 3D spatial query language for building information models. Adv. Eng. Inform. 2009, 23, 32–44. [Google Scholar] [CrossRef]
- Cerovsek, T. A review and outlook for a “Building Information Model” (BIM): A multi-standpoint framework for technological development. Adv. Eng. Inform. 2011, 25, 224–244. [Google Scholar] [CrossRef]
- Wong, J.; Yang, J. Research and application of Building Information Modelling (BIM) in the Architecture, Engineering and Construction (AEC) industry: A review and direction for future research. In Proceedings of the 6th International Conference on Innovation in Architecture, Engineering and Construction (AEC), Loughborough, UK, 4 November 2010; pp. 356–365. [Google Scholar]
- Gray, M.; Gray, J.; Teo, M.; Chi, S.; Cheung, F. Building Information Modelling: An international survey. In Proceedings of the 19th International CIB World Building Congress 2013, Brisbane, Australia, 5–9 May 2013; pp. 5–9. [Google Scholar]
- Gu, N.; London, K. Understanding and facilitating BIM adoption in the AEC industry. Autom. Constr. 2010, 19, 988–999. [Google Scholar] [CrossRef]
- Rezgui, Y.; Beach, T.; Rana, O. A governance approach for BIM management across lifecycle and supply chains using mixed-modes of information delivery. J. Civ. Eng. Manag. 2013, 19, 239–258. [Google Scholar] [CrossRef]
- Arayici, Y. Towards building information modelling for existing structures. Struct. Surv. 2008, 26, 210–222. [Google Scholar] [CrossRef] [Green Version]
- Becerik-Gerber, B.; Jazizadeh, F.; Li, N.; Calis, G. Application areas and data requirements for BIM-enabled facilities management. J. Constr. Eng. Manag. 2012, 138, 431–442. [Google Scholar] [CrossRef]
- Armesto, J.; Lubowiecka, I.; Ordóñez, C.; Rial, F.I. FEM modeling of structures based on close range digital photogrammetry. Autom. Constr. 2009, 18, 559–569. [Google Scholar] [CrossRef]
- Attar, R.; Prabhu, V.; Glueck, M.; Khan, A. 210 king street: A dataset for integrated performance assessment. In Proceedings of the the 2010 Spring Simulation Multiconference, Orlando, FL, USA, 11 April 2010; pp. 177:1–177:4. [Google Scholar]
- Dickinson, J.; Pardasani, A.; Ahamed, S.; Kruithof, S. A survey of automation technology for realising as-built models of services. Available online: https://www.researchgate.net/publication/44092069_A_survey_of_automation_technology_for_realising_as-built_models_of_services (accessed on 27 November 2020).
- Bazán, Á.M.; Alberti, M.G.; Álvarez, A.A.A.; Trigueros, J.A. New Perspectives for BIM Usage in Transportation Infrastructure Projects. Appl. Sci. 2020, 10, 7072. [Google Scholar] [CrossRef]
- Manning, R.; Messner, J.I. Case studies in BIM implementation for programming of healthcare facilities. Electron. J. Inf. Technol. Constr. 2008, 13, 446–457. [Google Scholar]
- Davies, R.; Harty, C. Implementing “site BIM”: A case study of ICT innovation on a large hospital project. Autom. Constr. 2013, 30, 15–24. [Google Scholar] [CrossRef]
- Gursel, I.; Sariyildiz, S.; Akin, Ö.; Stouffs, R. Modeling and visualization of lifecycle building performance assessment. Adv. Eng. Inform. 2009, 23, 396–417. [Google Scholar] [CrossRef]
- Kassem, M.; Kelly, G.; Dawood, N.; Serginson, M.; Lockley, S. BIM in facilities management applications: A case study of a large university complex. Built Environ. Proj. Asset Manag. 2015, 5, 261–277. [Google Scholar] [CrossRef] [Green Version]
- Marmo, R.; Polverino, F.; Nicolella, M.; Tibaut, A. Building performance and maintenance information model based on IFC schema. Autom. Constr. 2020, 118. [Google Scholar] [CrossRef]
- Marmo, R.; Nicolella, M.; Polverino, F.; Tibaut, A. A methodology for a performance information model to support facility management. Sustainability 2019, 11, 7007. [Google Scholar] [CrossRef] [Green Version]
- Bonci, A.; Carbonari, A.; Cucchiarelli, A.; Messi, L.; Pirani, M.; Vaccarini, M. A cyber-physical system approach for building efficiency monitoring. Autom. Constr. 2019, 102, 68–85. [Google Scholar] [CrossRef]
- Focus, O.-E.I. How are countries around the world supporting students in higher education? Available online: https://ideas.repec.org/p/oec/eduaaf/2-en.html (accessed on 27 November 2020).
- Herald, U. Study in Georgia system shows vast underutilization of classrooms. 2013. Available online: https://www.universityherald.com/articles/3327/20130525/study-georgia-system-shows-vast-underutilization-classrooms.htm (accessed on 27 November 2020).
- Neary, M.; Harrison, A.; Crellin, G.; Parekh, N.; Saunders, G.; Duggan, F.; Williams, S.; Austin, S. Learning Landscapes in Higher Education Learning Landscapes in Higher Education 2010 Clearing Pathways, Making Spaces, Involving Academics in the Leadership, Governance and Management of Academic Spaces in Higher Education; Centre for Educational Research and Development, University of Lincoln: Brayford Pool, Lincoln, UK, 2010; ISBN 978-0-9564797. [Google Scholar]
- Harrison, A.; Hutton, L. Design for the Changing Educational Landscape, Place and the Future of Learning, 1st ed.; Routledge: London, UK, 2013; Volume 9780203762, ISBN 9780203762653. [Google Scholar]
- Nie, X. Research on smart campus based on cloud computing and internet of things. In Proceedings of the Applied Mechanics and Materials, Zurich, Switzerland, 30 August 2013; Volume 380–384, pp. 1951–1954. [Google Scholar]
Figure 1.
Spanish phases for educational sectors for the prevention of COVID-19, adapted from [7].
Figure 1.
Spanish phases for educational sectors for the prevention of COVID-19, adapted from [7].

Figure 2.
Official COVID-19 new daily cases in Spain (first semester). Source [8].
Figure 2.
Official COVID-19 new daily cases in Spain (first semester). Source [8].

Figure 3.
Official COVID-19 new daily cases in Spain (second semester). Source [8].
Figure 3.
Official COVID-19 new daily cases in Spain (second semester). Source [8].

Figure 4.
Building Information Modeling (BIM) model, detailed spaces and information management.

Figure 5.
Total daily departures from each space and time step I.

Figure 6.
Total daily departures from each space and time step II.

Figure 7.
Total daily arrivals to each space and time step I.

Figure 8.
Total daily arrivals to each space and time step II.

Figure 9.
Online registration form for journeys.

Figure 10.
Data flow from the Internet user to the BIM model.

Figure 11.
BIM model data output by real-time occupation.

Figure 12.
Internal infrastructure BIM model visualization.

Figure 13.
Timetable representation in the BIM model and data results.

Figure 14.
Seats reservation online form.

Figure 15.
Visualization of the BIM model’s seat reservation function.


Table 1.
Situation Report 111, 10 May, II. [4].
Table 1.
Situation Report 111, 10 May, II. [4].
| Location | Total Cases | New Daily Cases | Total Deaths | New Daily Deaths |
|---|---|---|---|---|
| Globally | 3,917,366 | 61,578 | 27,4361 | 8499 |
| Africa | 42,626 | 2082 | 1369 | 47 |
| Americas | 1,655,378 | 18,537 | 98,723 | 6830 |
| Eastern Mediterranean | 255,728 | 9706 | 8878 | 130 |
| Europe | 1,707,946 | 25,608 | 155,552 | 1319 |
| South-East Asia | 95,314 | 4506 | 3356 | 152 |
| Western Pacific | 159,662 | 1139 | 6470 | 21 |
Table 2.
Situation Report 111, 10 May, I. [4].
Table 2.
Situation Report 111, 10 May, I. [4].
| Reporting Country | Total Confirmed Cases | Total Confirmed New Cases | Total Deaths | Total New Deaths |
|---|---|---|---|---|
| Spain | 223,578 | 721 | 26,478 | 227 |
| Italy | 218,268 | 1083 | 30,395 | 194 |
| United Kingdom | 215,264 | 3896 | 31,587 | 346 |
| Russian Federation | 209,688 | 11,012 | 1915 | 88 |
| Germany | 169,218 | 667 | 7395 | 26 |
| Turkey | 137,115 | 1546 | 3739 | 50 |
| France | 137,008 | 430 | 26,268 | 80 |
Table 3.
Situation Report 111, 11 November [5].
Table 3.
Situation Report 111, 11 November [5].
| Location | Total Confirmed Cases | New Cases in the Last 7 Days | Total Deaths | New Deaths in the Last 7 Days |
|---|---|---|---|---|
| Globally | 49,727,316 | 3,690,495 | 1,248,373 | 54,835 |
| Americas | 21,509,104 | 1,031,573 | 656,629 | 17,289 |
| Europe | 13,144,973 | 1,989,636 | 311,542 | 25,531 |
| South-East Asia | 9,641,945 | 390,157 | 149,326 | 5132 |
| Eastern Mediterranean | 3,307,411 | 214,072 | 84,305 | 5675 |
| Africa | 1,357,945 | 33,687 | 30,616 | 831 |
| Western Pacific | 765,197 | 31,370 | 15,942 | 377 |
Table 4.
Situation Report 111, 11f November [5].
Table 4.
Situation Report 111, 11f November [5].
| Reporting Country | Total Confirmed Cases | New Cases in Last the 7 Days | Total Deaths | New Deaths in the Last 7 Days |
|---|---|---|---|---|
| Russian Federation | 1,774,334 | 137,553 | 30,537 | 2302 |
| France | 1,714,361 | 382,553 | 39,849 | 551 |
| Spain | 1,328,832 | 95,732 | 38,833 | 2584 |
| United Kingdom | 1,171,445 | 159,781 | 48,888 | 2333 |
| Italy | 902,490 | 223,060 | 41,063 | 2445 |
| Germany | 658,505 | 125,575 | 11,289 | 808 |
| Turkey | 391,739 | 16,372 | 10,803 | 3376 |
Table 5.
Floor area of teaching spaces.
| Name | Floor Area | Name | Floor Area |
|---|---|---|---|
| José Echegaray Room | 69.61 m² | Room 24 | 101.16 m² |
| Room 1 | 238.88 m² | Room 26 | 329.94 m² |
| Room 2 | 115.08 m² | Room 27 | 330.64 m² |
| Room 3 | 117.68 m² | Room 28 | 57.82 m² |
| Room 4 | 238.87 m² | Room 29 | 59.52 m² |
| Room 5 | 57.82 m² | Room 30 | 58.78 m² |
| Room 6 | 59.52 m² | Room 31 | 58.78 m² |
| Room 7 | 58.78 m² | Room 32 | 57.22 m² |
| Room 8 | 58.78 m² | Room 38 | 100.10 m² |
| Room 9 | 57.22 m² | Room 39 | 100.02 m² |
| Room 11 | 54.90 m² | Room 40 | 58.67 m² |
| Room 12 | 56.39 m² | Languages Room | 57.26 m² |
| Room 13 | 56.39 m² | Room 45 | 103.25 m² |
| Room 14 | 56.39 m² | Room 46 | 101.16 m² |
| Room 15 | 56.39 m² | Ag. Betancourt Room | 56.70 m² |
| Room 16 | 56.39 m² | CAD Room | 55.67 m² |
| Room 17 | 56.39 m² | Exam room | 1652.12 m² |
| Room 18 | 56.39 m² | Informatic room | 90.56 m² |
| Room 22 | 113.49 m² | Turing Room | 121.18 m² |
| Room 23 | 103.25 m² | Total | 5289.32 m² |
Table 6.
Daily internal journeys from 8:00 to 9:00.
| Origin↓/Destination→ | A | B | C | D | E | F | G | H | I | J | K | L | M | Tot. Departures |
|---|---|---|---|---|---|---|---|---|---|---|---|---|---|---|
| Cafeteria | 0 | 0 | 0 | 0 | 0 | 0 | 0 | 0 | 0 | 0 | 0 | 0 | 0 | 0 |
| Room 27 | 0 | 0 | 0 | 0 | 0 | 0 | 0 | 0 | 0 | 0 | 0 | 0 | 0 | 0 |
| Room 26 | 0 | 0 | 0 | 0 | 0 | 0 | 0 | 0 | 0 | 0 | 0 | 0 | 0 | 0 |
| Room 25 | 0 | 0 | 0 | 0 | 0 | 0 | 0 | 0 | 0 | 0 | 0 | 0 | 0 | 0 |
| Room 1 | 0 | 0 | 0 | 0 | 0 | 0 | 0 | 0 | 0 | 0 | 0 | 0 | 0 | 0 |
| Room 2 | 0 | 0 | 0 | 0 | 0 | 0 | 0 | 0 | 0 | 0 | 0 | 0 | 0 | 0 |
| Room 3 | 0 | 0 | 0 | 0 | 0 | 0 | 0 | 0 | 0 | 0 | 0 | 0 | 0 | 0 |
| Room 4 | 0 | 0 | 0 | 0 | 0 | 0 | 0 | 0 | 0 | 0 | 0 | 0 | 0 | 0 |
| Secretary | 0 | 0 | 0 | 0 | 0 | 0 | 0 | 0 | 0 | 0 | 0 | 0 | 0 | 0 |
| Break Zone | 0 | 0 | 0 | 0 | 0 | 0 | 0 | 0 | 0 | 0 | 0 | 0 | 0 | 0 |
| Bus Stop | 50 | 40 | 54 | 12 | 65 | 45 | 45 | 25 | 1 | 3 | 0 | 0 | 0 | 340 |
| Subway | 10 | 20 | 40 | 54 | 45 | 65 | 23 | 12 | 4 | 1 | 0 | 0 | 0 | 274 |
| Parking | 20 | 30 | 40 | 50 | 50 | 40 | 30 | 20 | 50 | 40 | 0 | 0 | 0 | 370 |
| Tot. Arrivals | 80 | 90 | 134 | 116 | 160 | 150 | 98 | 57 | 55 | 44 | 0 | 0 | 0 | 984 |
Note: A = Cafeteria, B = Room 27, C = Room 26, D = Room 25, E = Room 1, F = Room 2, G = Room 3, H = Room 4, I = Secretary, J = Break Zone, K = Bus Stop, L = Subway, M = Parking.
Table 7.
Daily internal journeys from 9:00 to 12:00.
| Origin↓/Destination→ | A | B | C | D | E | F | G | H | I | J | K | L | M | Tot. Departures |
|---|---|---|---|---|---|---|---|---|---|---|---|---|---|---|
| Cafeteria | 20 | 8 | 9 | 2 | 8 | 6 | 5 | 2 | 3 | 1 | 5 | 6 | 8 | 83 |
| Room 27 | 3 | 90 | 8 | 3 | 8 | 9 | 0 | 8 | 5 | 9 | 9 | 1 | 6 | 159 |
| Room 26 | 1 | 2 | 100 | 0 | 4 | 6 | 2 | 7 | 6 | 6 | 2 | 6 | 4 | 146 |
| Room 25 | 7 | 0 | 2 | 100 | 5 | 0 | 2 | 5 | 6 | 5 | 4 | 1 | 2 | 139 |
| Room 1 | 1 | 9 | 6 | 7 | 90 | 8 | 8 | 1 | 5 | 6 | 3 | 4 | 1 | 149 |
| Room 2 | 1 | 7 | 6 | 0 | 6 | 50 | 8 | 5 | 3 | 9 | 9 | 0 | 8 | 112 |
| Room 3 | 4 | 4 | 9 | 4 | 5 | 7 | 40 | 8 | 7 | 0 | 6 | 4 | 4 | 102 |
| Room 4 | 1 | 3 | 4 | 8 | 6 | 6 | 1 | 50 | 1 | 0 | 7 | 5 | 7 | 99 |
| Secretary | 2 | 8 | 2 | 3 | 1 | 1 | 5 | 2 | 54 | 0 | 6 | 2 | 7 | 93 |
| Break Zone | 3 | 4 | 2 | 3 | 9 | 4 | 0 | 7 | 4 | 40 | 7 | 7 | 5 | 95 |
| Bus Stop | 1 | 9 | 6 | 9 | 8 | 1 | 5 | 4 | 7 | 8 | 0 | 9 | 2 | 69 |
| Subway | 9 | 7 | 8 | 1 | 0 | 3 | 6 | 5 | 8 | 0 | 6 | 0 | 6 | 59 |
| Parking | 5 | 8 | 2 | 9 | 7 | 0 | 8 | 6 | 0 | 4 | 8 | 5 | 0 | 62 |
| Tot. Arrivals | 58 | 159 | 164 | 149 | 157 | 101 | 90 | 110 | 109 | 88 | 72 | 50 | 60 | 1367 |
Note: A = Cafeteria, B = Room 27, C = Room 26, D = Room 25, E = Room 1, F = Room 2, G = Room 3, H = Room 4, I = Secretary, J = Break Zone, K = Bus Stop, L = Subway, M = Parking.
Table 8.
Daily internal journeys from 12:00 to 15:00.
| Origin↓/Destination→ | A | B | C | D | E | F | G | H | I | J | K | L | M | Tot. Departures |
|---|---|---|---|---|---|---|---|---|---|---|---|---|---|---|
| Cafeteria | 40 | 7 | 0 | 3 | 9 | 3 | 7 | 9 | 6 | 5 | 0 | 8 | 3 | 100 |
| Room 27 | 9 | 0 | 4 | 6 | 5 | 3 | 6 | 3 | 8 | 4 | 1 | 1 | 2 | 52 |
| Room 26 | 8 | 9 | 0 | 5 | 6 | 6 | 8 | 3 | 3 | 0 | 8 | 9 | 0 | 65 |
| Room 25 | 1 | 0 | 5 | 0 | 6 | 2 | 1 | 0 | 3 | 7 | 2 | 2 | 4 | 33 |
| Room 1 | 2 | 1 | 8 | 7 | 0 | 1 | 2 | 6 | 5 | 1 | 6 | 6 | 4 | 49 |
| Room 2 | 6 | 1 | 3 | 4 | 6 | 0 | 0 | 8 | 7 | 8 | 2 | 0 | 0 | 45 |
| Room 3 | 8 | 5 | 5 | 4 | 3 | 0 | 0 | 2 | 1 | 6 | 8 | 7 | 7 | 56 |
| Room 4 | 4 | 3 | 1 | 5 | 0 | 8 | 8 | 0 | 6 | 7 | 9 | 1 | 9 | 61 |
| Secretary | 8 | 3 | 0 | 7 | 3 | 0 | 8 | 2 | 0 | 9 | 3 | 0 | 7 | 50 |
| Break Zone | 3 | 9 | 6 | 8 | 0 | 1 | 5 | 5 | 2 | 20 | 5 | 8 | 1 | 73 |
| Bus Stop | 2 | 2 | 9 | 0 | 1 | 6 | 3 | 5 | 5 | 0 | 40 | 3 | 1 | 77 |
| Subway | 1 | 5 | 6 | 4 | 4 | 4 | 3 | 4 | 4 | 6 | 3 | 50 | 6 | 100 |
| Parking | 9 | 5 | 3 | 9 | 4 | 9 | 5 | 0 | 4 | 0 | 5 | 8 | 80 | 141 |
| Tot. Arrivals | 101 | 50 | 50 | 62 | 47 | 43 | 56 | 47 | 54 | 73 | 92 | 103 | 124 | 902 |
Note: A = Cafeteria, B = Room 27, C = Room 26, D = Room 25, E = Room 1, F = Room 2, G = Room 3, H = Room 4, I = Secretary, J = Break Zone, K = Bus Stop, L = Subway, M = Parking.
Table 9.
Daily internal journeys from 15:00 to 18:00.
| Origin↓/Destination→ | A | B | C | D | E | F | G | H | I | J | K | L | M | Tot. Departures |
|---|---|---|---|---|---|---|---|---|---|---|---|---|---|---|
| Cafeteria | 4 | 9 | 2 | 2 | 4 | 3 | 4 | 3 | 0 | 2 | 3 | 9 | 9 | 54 |
| Room 27 | 5 | 20 | 0 | 1 | 1 | 5 | 4 | 4 | 8 | 5 | 8 | 1 | 2 | 64 |
| Room 26 | 4 | 2 | 40 | 5 | 0 | 8 | 9 | 3 | 8 | 4 | 8 | 1 | 1 | 93 |
| Room 25 | 1 | 3 | 6 | 30 | 7 | 5 | 5 | 9 | 3 | 5 | 4 | 7 | 7 | 92 |
| Room 1 | 3 | 9 | 5 | 5 | 40 | 1 | 1 | 6 | 4 | 1 | 4 | 8 | 1 | 88 |
| Room 2 | 0 | 3 | 2 | 1 | 5 | 20 | 2 | 3 | 6 | 1 | 7 | 7 | 1 | 58 |
| Room 3 | 1 | 4 | 5 | 6 | 1 | 3 | 20 | 6 | 6 | 5 | 7 | 9 | 5 | 78 |
| Room 4 | 7 | 4 | 9 | 1 | 7 | 0 | 4 | 30 | 5 | 8 | 7 | 9 | 4 | 95 |
| Secretary | 3 | 0 | 7 | 9 | 8 | 4 | 3 | 9 | 40 | 9 | 3 | 7 | 4 | 106 |
| Break Zone | 8 | 9 | 9 | 1 | 8 | 2 | 1 | 4 | 5 | 40 | 8 | 4 | 3 | 102 |
| Bus Stop | 3 | 6 | 1 | 4 | 3 | 8 | 7 | 2 | 7 | 1 | 50 | 4 | 1 | 97 |
| Subway | 5 | 6 | 1 | 7 | 0 | 6 | 1 | 7 | 5 | 2 | 2 | 20 | 3 | 65 |
| Parking | 5 | 4 | 3 | 8 | 0 | 4 | 3 | 9 | 6 | 1 | 0 | 3 | 100 | 146 |
| Tot. Arrivals | 49 | 79 | 90 | 80 | 84 | 69 | 64 | 95 | 103 | 84 | 111 | 89 | 141 | 1138 |
Note: A = Cafeteria, B = Room 27, C = Room 26, D = Room 25, E = Room 1, F = Room 2, G = Room 3, H = Room 4, I = Secretary, J = Break Zone, K = Bus Stop, L = Subway, M = Parking.
Table 10.
Daily internal journeys from 18:00 to 21:00.
| Origin↓/Destination→ | A | B | C | D | E | F | G | H | I | J | K | L | M | Tot. Departures |
|---|---|---|---|---|---|---|---|---|---|---|---|---|---|---|
| Cafeteria | 4 | 7 | 6 | 8 | 2 | 5 | 3 | 2 | 0 | 0 | 5 | 2 | 0 | 44 |
| Room 27 | 3 | 20 | 7 | 4 | 0 | 2 | 2 | 6 | 6 | 2 | 7 | 8 | 6 | 73 |
| Room 26 | 3 | 8 | 40 | 4 | 9 | 1 | 8 | 3 | 9 | 9 | 2 | 4 | 7 | 107 |
| Room 25 | 3 | 1 | 0 | 30 | 6 | 0 | 7 | 1 | 0 | 1 | 4 | 3 | 1 | 57 |
| Room 1 | 4 | 5 | 8 | 9 | 40 | 8 | 7 | 5 | 5 | 8 | 1 | 0 | 0 | 100 |
| Room 2 | 1 | 0 | 7 | 8 | 1 | 20 | 9 | 0 | 8 | 4 | 0 | 3 | 5 | 66 |
| Room 3 | 1 | 7 | 8 | 2 | 8 | 3 | 20 | 7 | 1 | 1 | 5 | 0 | 0 | 63 |
| Room 4 | 0 | 1 | 9 | 1 | 6 | 2 | 1 | 30 | 7 | 0 | 1 | 3 | 9 | 70 |
| Secretary | 3 | 1 | 1 | 2 | 8 | 1 | 5 | 8 | 40 | 2 | 7 | 8 | 0 | 86 |
| Break Zone | 2 | 0 | 5 | 6 | 8 | 9 | 3 | 8 | 5 | 40 | 5 | 1 | 1 | 93 |
| Bus Stop | 8 | 0 | 4 | 5 | 6 | 2 | 9 | 3 | 4 | 4 | 50 | 3 | 6 | 104 |
| Subway | 2 | 8 | 6 | 2 | 0 | 5 | 8 | 4 | 1 | 5 | 5 | 20 | 8 | 74 |
| Parking | 7 | 0 | 1 | 7 | 7 | 5 | 2 | 3 | 0 | 0 | 9 | 2 | 100 | 143 |
| Tot. Arrivals | 41 | 58 | 102 | 88 | 101 | 63 | 84 | 80 | 86 | 76 | 101 | 57 | 143 | 1080 |
Note: A = Cafeteria, B = Room 27, C = Room 26, D = Room 25, E = Room 1, F = Room 2, G = Room 3, H = Room 4, I = Secretary, J = Break Zone, K = Bus Stop, L = Subway, M = Parking.
Table 11.
Total daily internal journeys.
| Origin↓/Destination→ | A | B | C | D | E | F | G | H | I | J | K | L | M | Tot. Departures |
|---|---|---|---|---|---|---|---|---|---|---|---|---|---|---|
| Cafeteria | 0 | 31 | 17 | 15 | 23 | 17 | 19 | 16 | 9 | 8 | 13 | 25 | 20 | 213 |
| Room 27 | 20 | 0 | 19 | 14 | 14 | 19 | 12 | 21 | 27 | 20 | 25 | 11 | 16 | 218 |
| Room 26 | 16 | 21 | 0 | 14 | 19 | 21 | 27 | 16 | 26 | 19 | 20 | 20 | 12 | 231 |
| Room 25 | 12 | 4 | 13 | 0 | 24 | 7 | 15 | 15 | 12 | 18 | 14 | 13 | 14 | 161 |
| Room 1 | 10 | 24 | 27 | 28 | 0 | 18 | 18 | 18 | 19 | 16 | 14 | 18 | 6 | 216 |
| Room 2 | 8 | 11 | 18 | 13 | 18 | 0 | 19 | 16 | 24 | 22 | 18 | 10 | 14 | 191 |
| Room 3 | 14 | 20 | 27 | 16 | 17 | 13 | 0 | 23 | 15 | 12 | 26 | 20 | 16 | 219 |
| Room 4 | 12 | 11 | 23 | 15 | 19 | 16 | 14 | 0 | 19 | 15 | 24 | 18 | 29 | 215 |
| Secretary | 16 | 12 | 10 | 21 | 20 | 6 | 21 | 21 | 0 | 20 | 19 | 17 | 18 | 201 |
| Break Zone | 16 | 22 | 22 | 18 | 25 | 16 | 9 | 24 | 16 | 0 | 25 | 20 | 10 | 223 |
| Bus Stop | 64 | 57 | 74 | 30 | 83 | 62 | 69 | 39 | 24 | 16 | 0 | 19 | 10 | 547 |
| Subway | 27 | 46 | 61 | 68 | 49 | 83 | 41 | 32 | 22 | 14 | 16 | 0 | 23 | 482 |
| Parking | 46 | 47 | 49 | 83 | 68 | 58 | 48 | 38 | 60 | 45 | 22 | 18 | 0 | 582 |
| Tot. Arrivals | 261 | 306 | 360 | 335 | 379 | 336 | 312 | 279 | 273 | 225 | 236 | 209 | 188 | 3699 |
Note: A = Cafeteria, B = Room 27, C = Room 26, D = Room 25, E = Room 1, F = Room 2, G = Room 3, H = Room 4, I = Secretary, J = Break Zone, K = Bus Stop, L = Subway, M = Parking.
Table 12.
Total daily journeys generated by the space and time step.
| Total Generated | A | B | C | D | E |
|---|---|---|---|---|---|
| Cafeteria | 0 | 83 | 100 | 54 | 44 |
| Room 27 | 0 | 159 | 52 | 64 | 73 |
| Room 26 | 0 | 146 | 65 | 93 | 107 |
| Library | 0 | 139 | 33 | 92 | 57 |
| Room 1 | 0 | 149 | 49 | 88 | 100 |
| Room 2 | 0 | 112 | 45 | 58 | 66 |
| Room 3 | 0 | 102 | 56 | 78 | 63 |
| Room 4 | 0 | 99 | 61 | 95 | 70 |
| Secretary | 0 | 93 | 50 | 106 | 86 |
| Break Zone | 0 | 95 | 73 | 102 | 93 |
| Bus Stop | 340 | 69 | 77 | 97 | 104 |
| Subway | 274 | 59 | 100 | 65 | 74 |
| Parking | 370 | 62 | 141 | 146 | 143 |
Note: A = From 8:00 to 9:00 h, B = From 9:00 to 12:00 h, C = From 12:00 to 15:00 h, D = From 15:00 to 18:00 h, E = From 18:00 to 21:00 h.
Table 13.
Total daily journeys attracted by the space and time step.
| Total Attracted | A | B | C | D | E |
|---|---|---|---|---|---|
| Cafeteria | 80 | 58 | 101 | 49 | 41 |
| Room 27 | 90 | 159 | 50 | 79 | 58 |
| Room 26 | 134 | 164 | 50 | 90 | 102 |
| Library | 116 | 149 | 62 | 80 | 88 |
| Room 1 | 160 | 157 | 47 | 84 | 101 |
| Room 2 | 150 | 101 | 43 | 69 | 63 |
| Room 3 | 98 | 90 | 56 | 64 | 84 |
| Room 4 | 57 | 110 | 47 | 95 | 80 |
| Secretary | 55 | 109 | 54 | 103 | 86 |
| Break Zone | 44 | 88 | 73 | 84 | 76 |
| Bus Stop | 0 | 72 | 92 | 111 | 101 |
| Subway | 0 | 50 | 103 | 89 | 57 |
| Parking | 0 | 60 | 124 | 141 | 143 |
Note: A = From 8:00 to 9:00 h, B = From 9:00 to 12:00 h, C = From 12:00 to 15:00 h, D = From 15:00 to 18:00 h, E = From 18:00 to 21:00 h.
Publisher’s Note: MDPI stays neutral with regard to jurisdictional claims in published maps and institutional affiliations. |
© 2020 by the authors. Licensee MDPI, Basel, Switzerland. This article is an open access article distributed under the terms and conditions of the Creative Commons Attribution (CC BY) license (http://creativecommons.org/licenses/by/4.0/).
Share and Cite
MDPI and ACS Style
Pavón, R.M.; Arcos Alvarez, A.A.; Alberti, M.G. Possibilities of BIM-FM for the Management of COVID in Public Buildings. Sustainability 2020, 12, 9974. https://0-doi-org.brum.beds.ac.uk/10.3390/su12239974
AMA Style
Pavón RM, Arcos Alvarez AA, Alberti MG. Possibilities of BIM-FM for the Management of COVID in Public Buildings. Sustainability. 2020; 12(23):9974. https://0-doi-org.brum.beds.ac.uk/10.3390/su12239974
Chicago/Turabian StylePavón, Rubén Muñoz, Antonio A. Arcos Alvarez, and Marcos G. Alberti. 2020. "Possibilities of BIM-FM for the Management of COVID in Public Buildings" Sustainability 12, no. 23: 9974. https://0-doi-org.brum.beds.ac.uk/10.3390/su12239974
Note that from the first issue of 2016, this journal uses article numbers instead of page numbers. See further details here.