What Drives Urbanisation in Modern Cambodia? Some Counter-Intuitive Findings


School of Business, Western Sydney University, Penrith NSW 2751, Australia
*
Author to whom correspondence should be addressed.
Sustainability 2020, 12(24), 10253; https://0-doi-org.brum.beds.ac.uk/10.3390/su122410253
Submission received: 23 October 2020
/
Revised: 2 December 2020
/
Accepted: 2 December 2020
/
Published: 8 December 2020
(This article belongs to the Special Issue Sustainable Planning of Urban Regions)
Abstract
:The history of urbanisation in Cambodia is a fascinating case study. During 1965–1973, the Vietnam war triggered the mass migration of Cambodians to the urban centres as its rural economy was virtually annihilated by an unprecedented cascade of aerial bombardments. During the Pol Pot regime, 1975–1979, urban areas were hastily closed down by the Khmer Rouge militia that led to the phase of forced de-urbanisation. With the ouster of the Pol Pot regime, since 1993 a new wave of urbanisation has taken shape for Cambodia. Rising urban population in a few urban regions has triggered multidimensional problems in terms of housing, employment, infrastructure, crime rates and congestions. This paper investigates the significant drivers of urbanisation since 1994 in Cambodia. Despite severe limitations of the availability of relevant data, we have extrapolated the major long-term drivers of urbanization by using autoregressive distributed lag (ARDL) analysis and nonlinear autoregressive distributed lag (NARDL) models. Our main finding is that FDI flows have a significant short-run and long-run asymmetric effect on urbanisation. We conclude that an increase in FDI boosts the pull-factor behind rural–urban migration. At the same time, a decrease in FDI impoverishes the economy and promotes the push-factor behind the rural–urban migration.
1. Introduction
Urbanisation is a major force of economic and social transformation of society—and hence of sustainability—as urban areas have become the hubs of cultural, economic, scientific, and social innovations [1,2]. Urbanisation has a particular implication for sustainability in the Asian economies, except for China: the unplanned urban growth in a few clusters of an Asian developing economy has triggered an urban sprawl undermining the ability of the nation to achieve the significant targets set for sustainable development by the United Nations. Such urban sprawls have pushed urban planning to the background with massive increases in air pollution, congestion, water contamination and depletion of groundwater stocks along with losses of wildlife and habitat. This paper examines the case of Cambodia for understanding the main drivers of urbanisation.
There are two critical facets of the current phase of human history impacting sustainability: first and foremost, the current period of our collective history is characterised by unprecedented globalism, or global interdependence as we have also learned from the COVID-19 pandemic. Secondly, the contemporary human history is essentially an urban era. As an example, in 2018, 4.2 billion people lived in the urban areas of our globe, which will rise to about 9.25 billion people (70% of the global population) by the 2050s [3]. Since North America, Europe and Oceania are already highly urbanised, the future path of urbanisation will take place in Asia with an urbanisation level of about 50%. Yet, Asian urbanisation has also contributed highly uncomfortable sustainability challenges such as concentration of urban poverty, urban pollution, urban sprawls, slums, and a myriad of ecological challenges.
In order to promote healthy urbanisation, one of the major targets of sustainable development is: “Make cities and human settlements inclusive, safe and resilient and sustainable.” (see Target 11, Stahel [4], https://unstats.un.org/sdgs/report/2016/goal-11/). Doubts have been gathering momentum as to whether Asian developing countries can create adequate “administrative, management, institutional and financial capacities” to productively harness urbanisation for avoiding serious and adverse socio-economic consequences of urbanisation [5]. Even more importantly, most urban scholars now admit that a single grand model of Asian urbanisation and its implications does not exist. The dynamics and consequences of urbanisation are believed to vary significantly from one Asian country to another [5]. In this paper, we hence examine the determinants of urbanisation in Cambodia—to unravel the forces that propel the phenomenon of rural–urban migration driving urbanisation in one of the fastest-growing developing countries in Southeast Asia. The crux of the matter is that in the highly globalised and market-driven economy of Cambodia, market forces have come to the forefront only since the early 1990s and, hence, urban development is influenced by both local and international factors. By applying an advanced methodology in time series analysis, to the best of our knowledge for the first time for sustainability issues in Southeast and East Asia, we will highlight the importance of various factors in driving urbanisation in Cambodia.
Specifically, we explore the pattern of urbanisation in Cambodia, to examine the precise roles of various factors—like foreign direct investment (FDI), public investment, tourist arrivals and GDP growth—in triggering and propelling urbanisation in Cambodia. Urbanisation seeks to capture the process of transition of a society from predominantly rural to urban modes of production and cultures. Urbanisation in any society is driven by three major changes: (1) natural population growth, (2) migration, and finally (3) reclassification of rural areas as urban [6]. Cambodia offers a rare case history to urban scholars for understanding diverse forces of urbanisation absent from other societies due to somewhat unprecedented twists and turns in the urbanisation history of Cambodia, at least since the 1960s. We will provide a brief description of the historical process of urbanisation in Cambodia in the next section.
In contrast to older cities in developed countries (like London, Paris, and New York), where urbanisation took place over a century, urbanisation in developing Asian countries like Cambodia is taking place within few short decades. In the absence of institutional, managerial, and economic capacity to manage rapid and concentrated growth, authorities in such developing economies might fail to achieve critical sustainable development goals. In this paper we apply the Autoregressive Distributed Lag (ARDL) model to examine the long-run relationship between urbanisation and various internal and external factors—such as foreign direct investment, tourism and internal business activities in Cambodia—using data from 1994 to 2015. We further utilise the Nonlinear Autoregressive Distributed Lag (NARDL) model—recently advanced by Shin et al. (2011) [7]—to uncover the asymmetric impacts of increases and decreases in various drivers of urbanisation on the process of urbanization. To the best of our knowledge, the process of urbanisation in any country has never been examined using such an advanced econometric approach. The present study thus offers policy makers and authorities in Cambodia a comprehensive empirical analysis of factors driving urbanisation in the country, which remains largely concentrated in select hotspots—where systems are at risk of collapse due to the unbridled influx of the domestic migrant population with limited choice. Such urbanization has compromised the sustainability of the urban regions of Cambodia. It is hence critical for Cambodia to undertake an immediate policy action, to alleviate burden from the current urban centres by fostering urbanisation of other areas in the country. Our research thus offers options for urban development policies, which can help Cambodia formulate strategies for a balanced and sustainable urbanisation. The plan of the paper is as follows: Section 2 discusses the background history, data, and the econometric methodology of our model of investigation. Section 3 offers the results and Section 4 concludes.
2. Evolution of Urbanisation in Cambodia
With the advent of market forces in 1994, the process of urbanisation has been primarily driven in Cambodia by the urge of the youth to use (rural–urban) migration as a livelihood strategy. It is important to bear in mind that Cambodia is still a predominantly agricultural economy with 78% of its population living in rural areas. In 2019 rural–rural migration is still the dominant force (59% of all migrants) while rural–urban migrants account for roughly 25% of all migrant workers. It is widely held among policymakers that urbanisation in the country is critically enmeshed with the transition of the Cambodian economy from a primarily agriculture-based to a service-production-based economy. Thus, a further increase in the pace of rural–urban migration can cause serious challenges for sustainability in Cambodia.
2.1. Historical Background
In the 1960s roughly 11% Cambodians lived in urban areas [8]. In a bid to curtail the flow of arms and communist soldiers from North to South Vietnam, during the Vietnam war, the US air force conducted massive aerial bombardments and undertook covert military incursion into Cambodian territory between 1965 and 1973. These lethal attacks resulted in mass destruction of rural farms and villages while millions of Cambodians undertook a forced journey of migration to urban areas to escape the adversities of continuing wars and poverty in rural areas [9]. This is a phase of forced urbanisation in Cambodia as the influx of rural refugees swelled the city’s population from 1.5 million to 3 million by 1973 [10].
As the aerial bombings subsided, the devastating Pol Pot regime started unfolding its assaults on the urban population. On 17 April 1975, the Cambodian Capital Phnom Penh was captured by the Pol Pot led Communist Party of Kampuchea (CPK, also known as the Khmer Rouge). Within weeks after coming to power, the CPK militia forcibly evacuated the capital city and then drove the entire urban population of Cambodia to rural regions [9,11]. During the Pol Pot regime, urban areas were virtually closed, and the urban regions thus became ghost towns. This is a phase of forced de-urbanisation.
With support from Vietnam, the Khmer Rouge regime was eventually overthrown, and the Cambodian people started returning to and re-populating the urban areas in two surges: after the collapse of the Pol Pot regime in 1979, the ghost cities of Cambodia were opened up and were repopulated. As an example, the population of Phnom Penh surged to 320,000 (Pierdet, 2012 [12]) in 1980 from 30,000 in 1979 [13]. Secondly, urbanisation received a further fillip in 1993 when hundreds of thousands of Cambodians could return home from border camps.
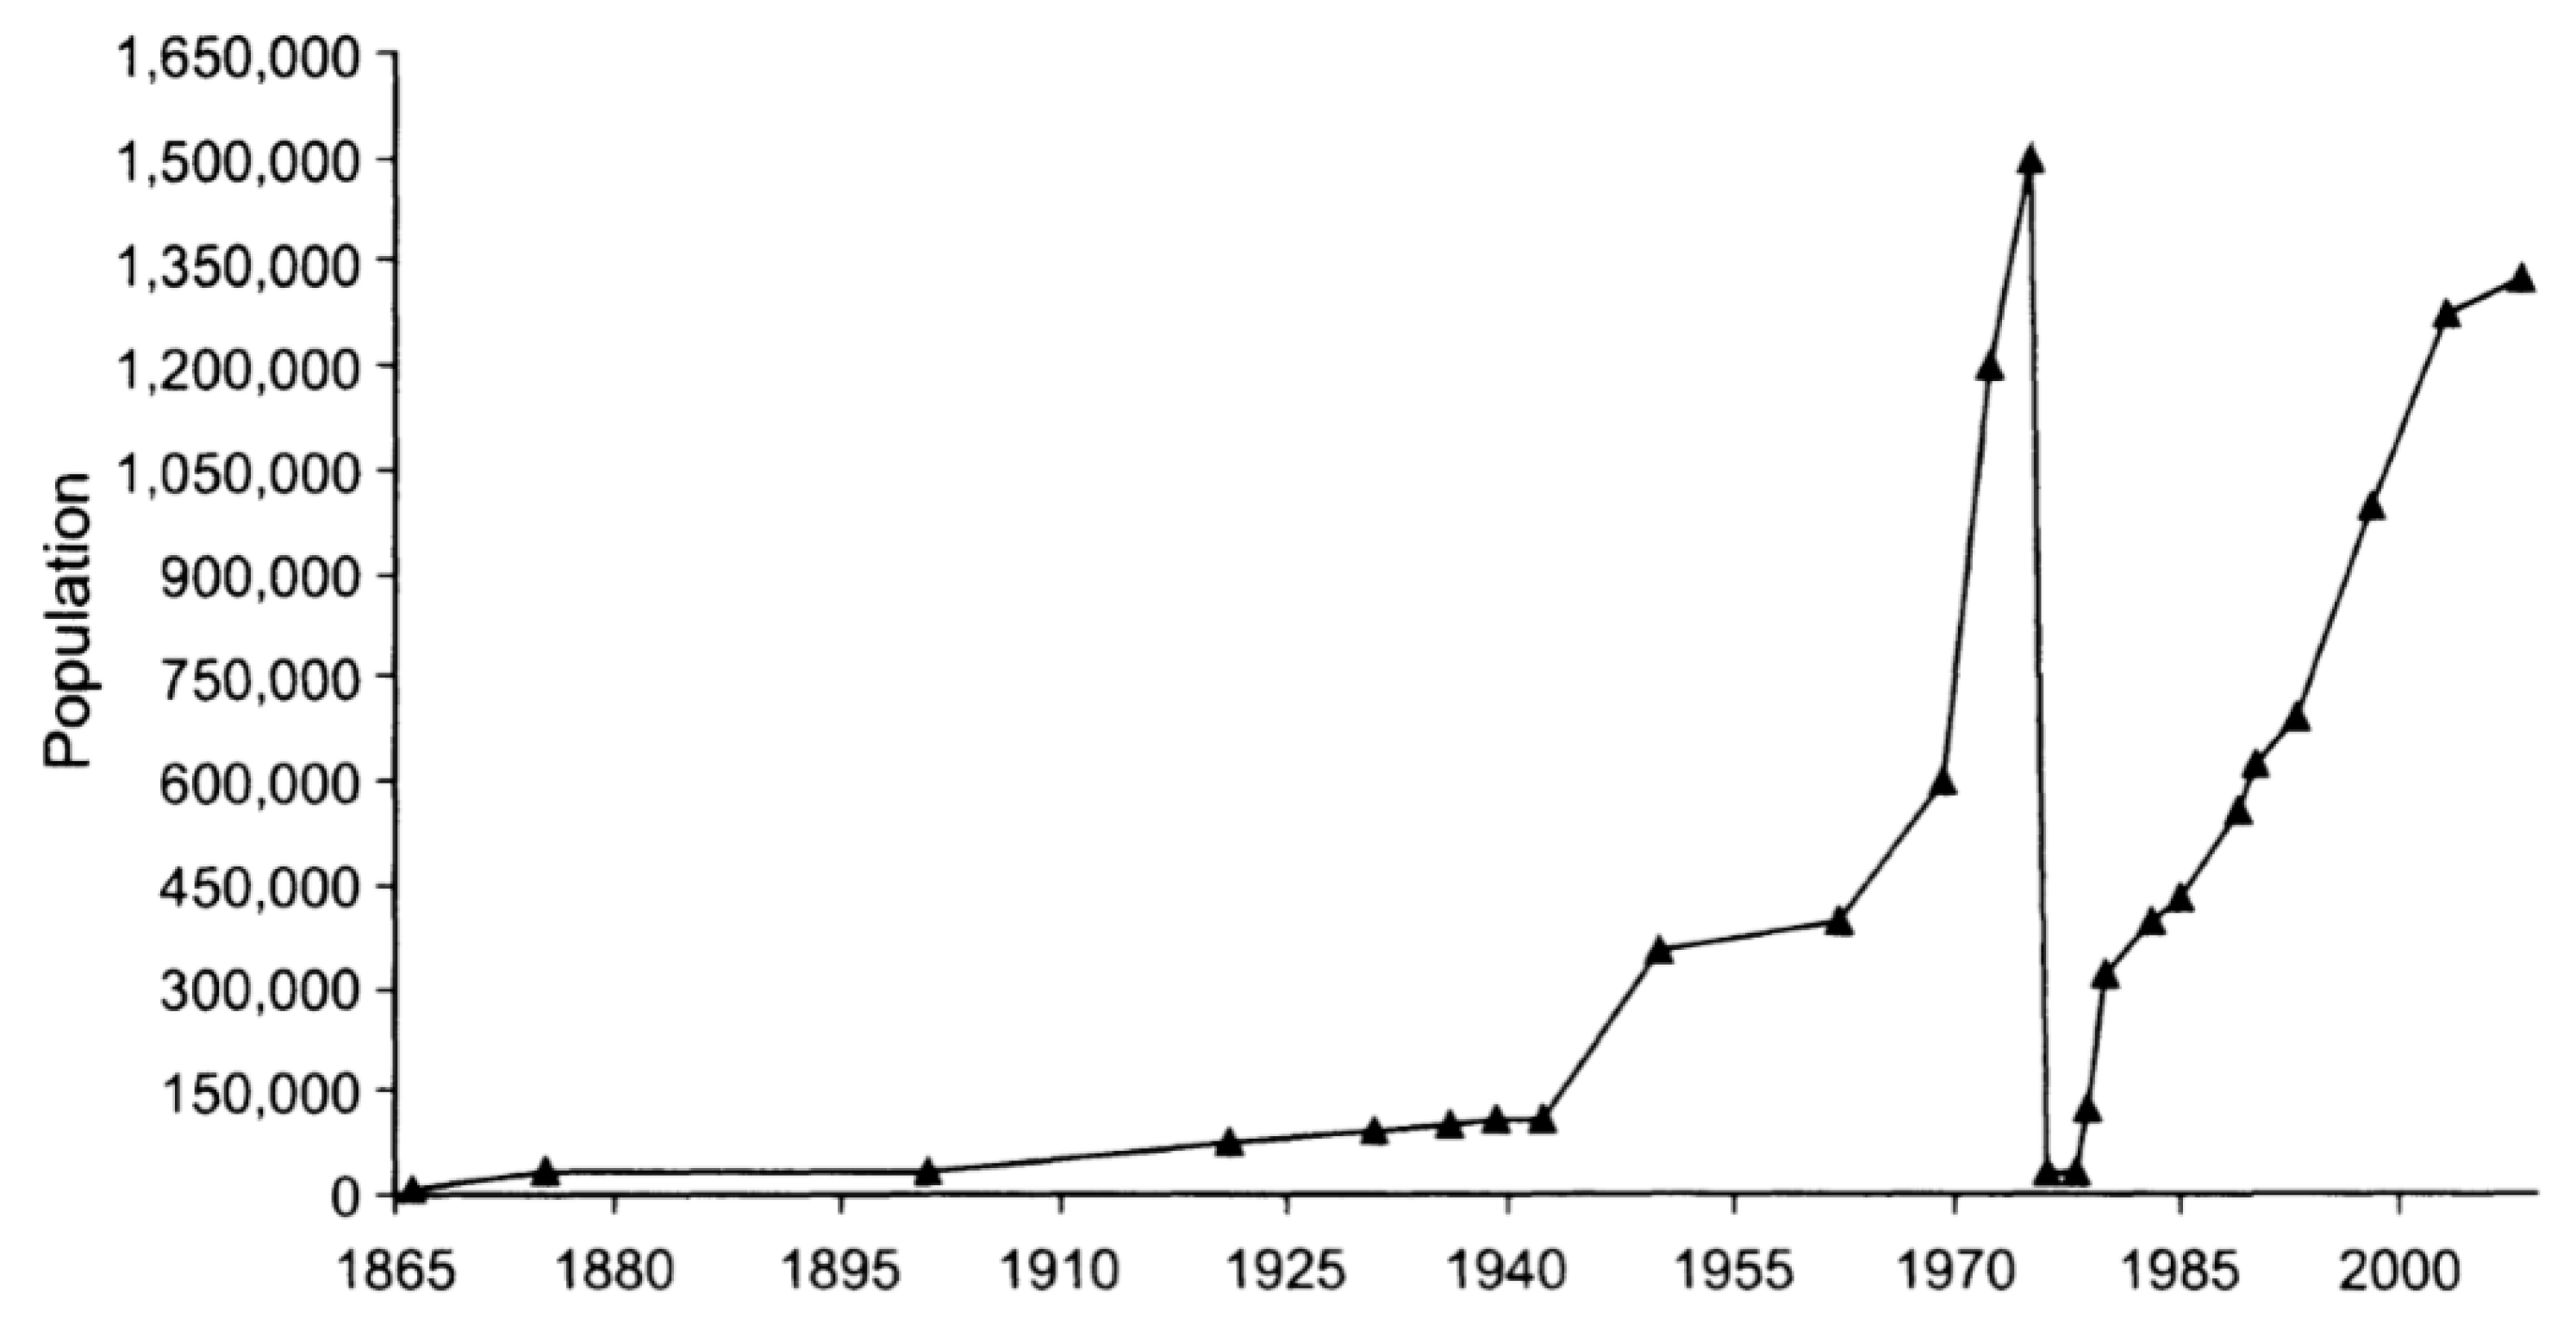
By the end of the millennium, rural–urban migration in Cambodia has been characterised by four critical features: first and foremost, due to a large-scale genocide committed by the Pol Pot regime, the Cambodian population is very young today—roughly 61% below the age of 24. Secondly, urbanisation in Cambodia is propelled mainly by economic growth, which creates job opportunities for mostly unskilled, or low-skilled, and unemployed youth from the rural areas as Wells-Dang (2010) [13] has highlighted. It has also been argued that rural–urban migration in Cambodia is a key livelihood strategy for the rural poor [14], hence push factors play a major role in driving people from rural to urban areas [15]. Thirdly, since 1998, economic growth has been closely associated with the opening of the Cambodian economy to the market forces and, hence, with the foreign direct investment (FDI) flows into Cambodia. As a result, by the new millennium 56% of the urban population was composed of (internal) migrants. Fourthly, though FDI flows are a major source of economic growth, sectoral and geographical distribution of FDI is highly uneven and mostly clustered around the major urban centres of Cambodia’s capital city of Phnom Penh. Since FDI is attracted to the labour-intensive industries of Cambodia, FDI flows are a major source of job opportunities in the urban sector (see Cuyvers et al., 2011 [16]) for the rural youth, which seemingly drives internal migration-led urbanization. The graph below reflects the severe volatility in the long-term demographic changes in a major city of Cambodia, Phnom Penh, between 1865 and 2008 with a clear upward trend in the new millennium.
2.2. Major Changes in the Dynamics of Urbanisation in Recent Years
The labour force in Cambodia, accounting for about 70% of its population, was approximately 15 million about a decade ago [17]. According to some estimates, close to 250,000 to 300,000 new young workers enter the Cambodian job-market each year [18]. Cambodia has been traditionally an agricultural economy and the agriculture sector has played an important role in employing the majority of the labour force of the country for several centuries. However, increasing landlessness, rapidly expanding labour force, significant wage differences between rural and urban areas, poverty and environmental degradation of the rural region triggered rural–urban migration in Cambodia in the new millennium [19,20].
Cambodia emerged as a destination for Foreign Direct Investment (FDI) after the first general elections held in 1993; but the sectoral and geographical distribution of FDI in the country is highly uneven. Firstly, it is concentrated in labour-intensive, export-oriented manufacturing industries such as garments and tourism (restaurants and hotels); secondly, it is clustered around the capital city of Phnom Penh and the surrounding Kandal province, which attracts by far the largest share (82 percent) of the total FDI in Cambodia [16]. As FDI in labour-intensive industries creates job opportunities in and around the capital city of Phnom Penh, it can be considered as the key pull factor propelling migration led urbanisation in Cambodia.
It is noteworthy that besides Phnom Penh, the rural workforce of Cambodia has an option to explore and migrate to neighbouring Thailand, which is a key destination for them due to two reasons. Firstly, the average monthly wage in Thailand (US$260) is more than double the average monthly earnings (US$119) of employees in Cambodia [18]. Secondly, the geographical proximity of Thailand, which shares an 803 km long, relatively porous land border with Cambodia, makes it an easy choice for human traffickers and illegal migrants [21], who can dodge restrictive immigration policies, and lengthy, complex and expensive legal recruitment procedures to immigrate illegally. FDI flows, which create employment opportunities in and around major urban centres like Phnom Penh, combined with the deteriorating job prospects in the rural economy have been and will remain the key driver of migration-led urbanisation in Cambodia in the visible future.
2.3. Emergence of ‘Primate’ Urban Centres in Cambodia
The role of urbanisation in economic development has been suitably highlighted by the United Nations: according to the United Nations, a city is called ‘primate’ if its population accounts for 40 per cent or more of the total urban population of a nation. The capital city of Phnom Penh has become a primate city by the new millennium, as its population accounts for more than half of the total urban population of Cambodia [11]. Interestingly, in the early 1990s Phnom Penh was the largest urban centre in Cambodia—its population was 17.8 times the population of the next largest urban centre of Cambodia. The situation has not changed over the decades and the urban population of Cambodia largely remains concentrated in and around major metropoles like Phnom Penh.
However, some noticeable changes took place in the context of urbanisation in Cambodia: first and foremost, since the early 1990s there has been a continuous influx of new and young migrant workers from rural areas to the urban labour markets of the country [18]. Secondly, the economy, which is heavily dependent on foreign capital, started experiencing slower rates of economic growth [22]. Thirdly, neighbouring Thailand became a viable alternative destination of Cambodian migrant workers, which has a relatively stronger and higher-wage job-market. Finally, deep-rooted changes in the financial sector, like financial inclusion, took place in Cambodia allowing migrants to explore informal and small-scale entrepreneurial activities in the urban sector as an alternative to traditional low-skill jobs.
An important question with regard to urbanisation in Cambodia, which is heavily concentrated in and around the Phnom Penh region is thus—What are the factors responsible for the urban primacy in the country?
Both manufacturing and the services sectors in Cambodia attracted the bulk of FDI—mainly from China, Japan, Hong Kong, the US and the Netherlands. The 13 special economic zones (SEZ) of the country attracted FDI to the construction industry, infrastructure, textiles, agriculture and tourism. However, as sectoral and geographical distribution of FDI is highly uneven and mostly clustered around the capital city of Phnom Penh (see Cuyvers et al., 2011 [16]), it is important to analyse the influence of FDI on urbanisation in Cambodia.
Apart from FDI, Cambodia relies on the tourism sector to spur its sustainable economy in relation to urbanisation. Since the early 1990s, dozens of countries have committed millions of dollars for the restoration of the World-Heritage Site of Angkor—due to which Cambodia has emerged as one of the premier destinations of Southeast Asia [23]. Besides heritage tourism (mainly from East Asia and her ASEAN neighbors) to three world heritage sites, the tourism sector of Cambodia also relies upon natural areas and national parks to attract visitors. Sports (and gambling) tourism and health tourism has also recorded significant growth for the six cities of Cambodia, as China has become the largest source for in-bound tourists in the country.
Domestic credit is another critical factor that leverages the economy and the pace of urbanisation. Domestic lending in Cambodia by the financial sector took three major forms: first, microfinance lending; secondly, trade credits and, finally, the purchase of non-equity security. ACLEDA is the largest bank of Cambodia—in terms of both loan portfolios and deposits—specialising in lending to small and medium enterprises (SMEs) and microfinance (MF). ACLEDA has 238 offices covering every province of Cambodia. The second largest bank is PRASAC and it is the largest MF institution of Cambodia covering all 24 provinces with presence in the catchment areas of 10,874 (76%) villages. By 2016, there was at least one MF outlet for every one square km of land in Cambodia. In 2018 about 2.2 million of 10 million Cambodian adults had a MF loan outstanding. The annual MF debt is roughly twice that of the annual per capita GDP.
The public investment in basic infrastructure in Cambodia created the local and regional public goods such as (i) water supply, (ii) networks of roads and highways, (iii) telecommunications and connectivity projects, (iv) airports for domestic and international flights under the Open Sky policy), (v) power plants for generation of hydro-electricity. Since public goods and infrastructure impact urbanisation, it is important to investigate their influence on urban primacy in Cambodia.
3. Data and Empirical Strategy
Our main goal in this section is to examine how the time profile of urbanisation has evolved in Cambodia in response to changes occurring in various domains as outlined in the previous section. From the dataset spanning from 1994 to 2015, during the last phase of urbanisation driven by the market forces, we try to capture the impacts of some of the most salient variables driving the urbanisation processes. One of the major hurdles for analysing the time profile of urbanisation in Cambodia is not only the paucity of data but also enormous problems of autocorrelation and non-stationarity in recent data for reliable econometric studies. In order to create a pathway for research, we apply the autoregressive distributed lag (ARDL) bounds testing approach of Pesaran et al. (2001) [24] to test for cointegration between urbanisation and other relevant variables in Cambodia. The ARDL approach is especially suitable for small sample situations such as the present study due to non-availability of reliable long-run data from Cambodia (see Haug, 2002 [25]). More importantly, the methodology does not require that all variables be integrated of the same order i.e., is capable of handling variables that are stationary and nonstationary (integrated of up to order 1 or even fractionally integrated). Table 1. below outlines the variables of interest utilised in the empirical analysis.
Since, the path of urbanisation has been uneven in Cambodia, we also apply a new methodology of nonlinear ARDL (NARDL) to the non-linear extract impacts of relevant variables on urbanisation in Cambodia—for the very first time in the field to the best of our understanding. Several empirical studies argue that the presence of asymmetric effects in terms of some regressors—decreasing or increasing in any independent variable of interest—can impact the dependent variable differently. Hence the nonlinear and asymmetric analysis becomes critical to assess the different responses of the dependent variables in the presence of fluctuations associated with the independent variables of interest. The NARDL approach of Shin et al. (2011) [7] addresses the asymmetry issue and will allow us to collectively examine the short and long run responses of migration-led urbanisation in Cambodia to various variables of interest like FDI flows [7].
Developed by Shin et al. (2011) [7], NARDL approach to cointegration uses positive and negative partial sum decompositions of the variables of interest to detect hidden and asymmetric, or nonlinear, cointegration. The key advantage of using an NARDL model is that it allows studying dynamic long-run relationships and asymmetries simultaneously [7]. Furthermore, the model is capable of testing cointegration among variables even when these variables may not share the same order of integration. Additionally, the NARDL model has the advantage to distinguish perfectly between the linear, the non-linear or the absence of cointegration [26].
3.1. Stationarity (Unit Root) Test
We implement the following tests for the presence of unit roots in our variables of interests: (1) the Phillips-Perron (PP) test, (2) the Augmented Dicky-Fuller (ADF) test with lag length chosen using the modified Akaike Information Criterion (AIC) as per Ng and Perron (2001) [27]. Here we present the unit root results from Phillips-Perron test and ADF (AIC) in Table 2.
As Table 2 highlights:
- (i)
- There is no variable that is integrated of order 2, or I(2), and above.
- (ii)
- Both ADF and PP tests suggest that there is a possibility that some of the variables are possibly integrated of order 1, or I(1). The possibility of I(0)series is also noted for the urbanisation variable under the ADF tests.
Given the above finding, the ARDL model is the most suitable approach to extract the long-term relationship (cointegration) between urbanisation and other variables of interest.
3.2. Long-Term Driver of Urbanisation in Cambodia: Empirical Strategy
Our postulated model for ARDL bounds testing is as:
where y is the dependent variable (say, LnUP); V is a variable of interest (say, LnFDI); Q is another driver of urbanisation (say, LnTA). Note that is an iid stochastic process. The symbol ∆ denotes the first difference of a variable. We say that the two variables y and V in Equation (1) are not cointegrated if ρ = a = 0. Due to the absence of a long-run time-series data, we can only choose two variables at one time for extracting the ARDL results. The limited availability of data for Cambodia is a major constraint on our analysis.
Pesaran et al. (2001) [24] developed the F-test to assess the presence of cointegration in the estimated ARDL model (1a). The decision is based on two critical bounds: the upper and the lower one. When the F-statistic is greater than the upper bound the null hypothesis is rejected. This means that there is a long run relationship between y and V. The ARDL model in Equation (1) assumes a linear combination of y and V which indicates a symmetric adjustment in the long and the short run of dependent variable to any shock in V—our variable of interest. The advantage of using this time series approach is that we do not need to address endogeneity between variables since coefficient estimates in the presence of cointegration have the superconsistency property, implying that endogeneity does not affect the results [28]. The superconsistency property of the estimates holds even if there are omitted stationary variables [29,30]. Step 1 of the ARDL approach involves estimating an unrestricted ARDL Error Correction Model (ECM), as shown in the generic model given by Equation (1). The specific equations and their results are summarised in Table 3.
Our postulated model for NARDL bounds testing is as:
The NARDL methodology decomposes the exogenous variable FDI into positive and negative partial sums of increase and decrease in regressors i.e., changes in the values of an independent variable. To explain the methodology, we choose as an example, which gives us Model 1 of Table 4. In an analogous fashion we derive other models of Table 4 using the partial decompositions of other variables. Note that is into its positive (+) and negative (−) partial sums of increases and decreases as below:
where:
and
Following Shin et al. (2011) [7], the NARDL model can be expressed as:
where represents the long-run coefficient associated with the positive changes in , and is the long-run coefficient associated with the negative changes in . Following Shin et al. (2011) [7], we include Equation (2) in the ARDL (p, q) model and derive the following nonlinear asymmetric conditional ARDL:
where
Note that p and q denote the lag orders for the dependent variable and independent variable, respectively.
4. Results
4.1. ARDL Modelling
Cambodia is one of the few countries for which a long-term time series of relevant variables is not available due to the serious interruptions in its economy and society. That is why we use a limited dataset from 1994 to 2015, which can create technical problems in using several variables for the ARDL estimation. We hence created three models—as highlighted in Table 3 given the limited availability of a suitable dataset. From Table 3 we learn a few important aspects of urbanisation in Cambodia:
- First and foremost, as Model 1 shows, if we consider only external factors such foreign direct investment as a percentage of GDP (FDI) and tourist arrival (TA), there does not appear to be any long-term relationship between urbanisation in Cambodia and the chosen external variables (FDI, TA) only.
- Secondly, when we consider the financial development, or financial inclusion, which is measured by the domestic credit creation by the banking sector in Cambodia (DCREDIT), some interesting pictures emerge: Model 2, from the F statistic, shows that urbanisation in Cambodia is cointegrated with both TA and DCREDIT. In other words, Model 2 confirms that urbanisation is propelled by the financial development in Cambodia—as a 10% increase in banking credit increases urbanisation by 0.75%. Increases in banking credit to the urban areas mainly constitute loans to small businesses and SMEs, which increase demand for unskilled and semi-skilled labour. The massive growth in microfinance credit to the tune of $10 billion also resulted in a surge in business activities in the urban areas. Results suggest that this massive increase in demand for labour in the urban areas acts as a ‘pulling’ force for unskilled and semi-skilled workers from the rural areas to the urban areas.
- Model 2 also finds that the chosen external factor, tourist arrival in Cambodia (TA), has no statistically significant impact on urbanisation. Thus, in Model 2, we detect economically and statistically meaningful long-run effect of DCREDIT on urbanisation, which shows that urbanisation rises (falls) in the long run as the volume of domestic bank credit (DCREDIT) rises (falls) in Cambodia. It is also important to highlight that the ECM terms, being negative and less than one (1) in absolute values, indicate causality running from DCREDIT to urbanisation.
- Thirdly, when we consider FDI and DCREDIT jointly, Model 3—from the relevant F statistic of Column 4 in Table 4—establishes that urbanisation is cointegrated with both FDI and DCREDIT. Though urbanisation is strongly driven by domestic credit advanced by banks, foreign direct investment (FDI) dampens the pace of urbanisation. The effects are noteworthy and statistically significant: a 10% increase in FDI flows lowers urbanisation by more than 10% in Cambodia, while a 10% increase in DCREDIT increases urbanisation by 1.5%. Results suggest that an increase in activities for SMEs and small businesses in urban areas—driven by a massive growth in microfinance loans—resulted in soaring demand for unskilled, semi-skilled and low-skilled migrants from rural to urban areas. Thus, domestic credit triggered an increase in rural–urban migration. On the other hand, FDI has been located in the special economic zones and a few urban hotspots due to the locational advantages of some areas in terms of infrastructure and skills. The demand for skilled workers increased in such locations while the cost of living sky-rocketed due to increases in income due to earning premiums of skilled workers. This increase in cost of living accompanied by stagnant demand for unskilled and semi-skilled workers led to the out-migration of unskilled and semi-skilled workers from the special economic zones and hotspots of FDI. Since the growth in demand for skilled labour was outmatched by a decline in the supply of unskilled and semi-skilled workers, the net effect of FDI led to the dampening of urbanisation in Cambodia.
The short-run effects of all variables are somewhat counter-intuitive. Model 1 shows little evidence of any short-run effects of FDI and TA on urbanisation. In Model 2, we exclude the short-run effects and instead focus upon the long-run cointegrating relationship. Model 3 shows that the short-run effects are in contradiction with the long-term effects of FDI and DCREDIT on urbanisation: though FDI lowers urbanisation in the long-run, it increases urbanisation in the short-run. The effects of short-run vis-à-vis long-run are in contradiction, possibly because of the differences in outmigration rates from in-migration rates (between short-run and long-run) to an urban area triggered by changes in FDI and credit creation.
DCREDIT promotes urbanisation in the long-run but depresses urbanisation in the short-run. The ECM terms confirm the stability of the long-term relationship as well as causality. The ECM terms in Table 3 show if and how quickly variables converge towards the equilibrium relationship. For meaningful convergence, the ECM terms must be statistically significant and negative and less than one (1) in absolute values [24]. The statistical significance of the ECM coefficient, its negative sign and size confirm the presence of a highly stable long-run relationship (see row 2 of Table 3 for the ECM term).
When we consider causality running from our chosen variables to urbanisation treating the chosen variables as the forcing variable, the F-and t-statistics establish that there is a long run relationship between urbanisation and the forcing variables. We also noted a highly significant error correction term indicating long-run causality running from the chosen variables to urbanisation in Cambodia (see Granger, Huangb, and Yang, 2000 for the methodology [31]). It is imperative to highlight that our analysis also examined the possibility of reverse causality, applying a methodology well-established in the literature [32], when causality is assumed to run from urbanisation to the chosen variables, the F—and t-statistics suggest that there is no long-run relationship (not reported in this paper).
4.2. An Extension: Non-Linear Cointegration and the NARDL Strategy
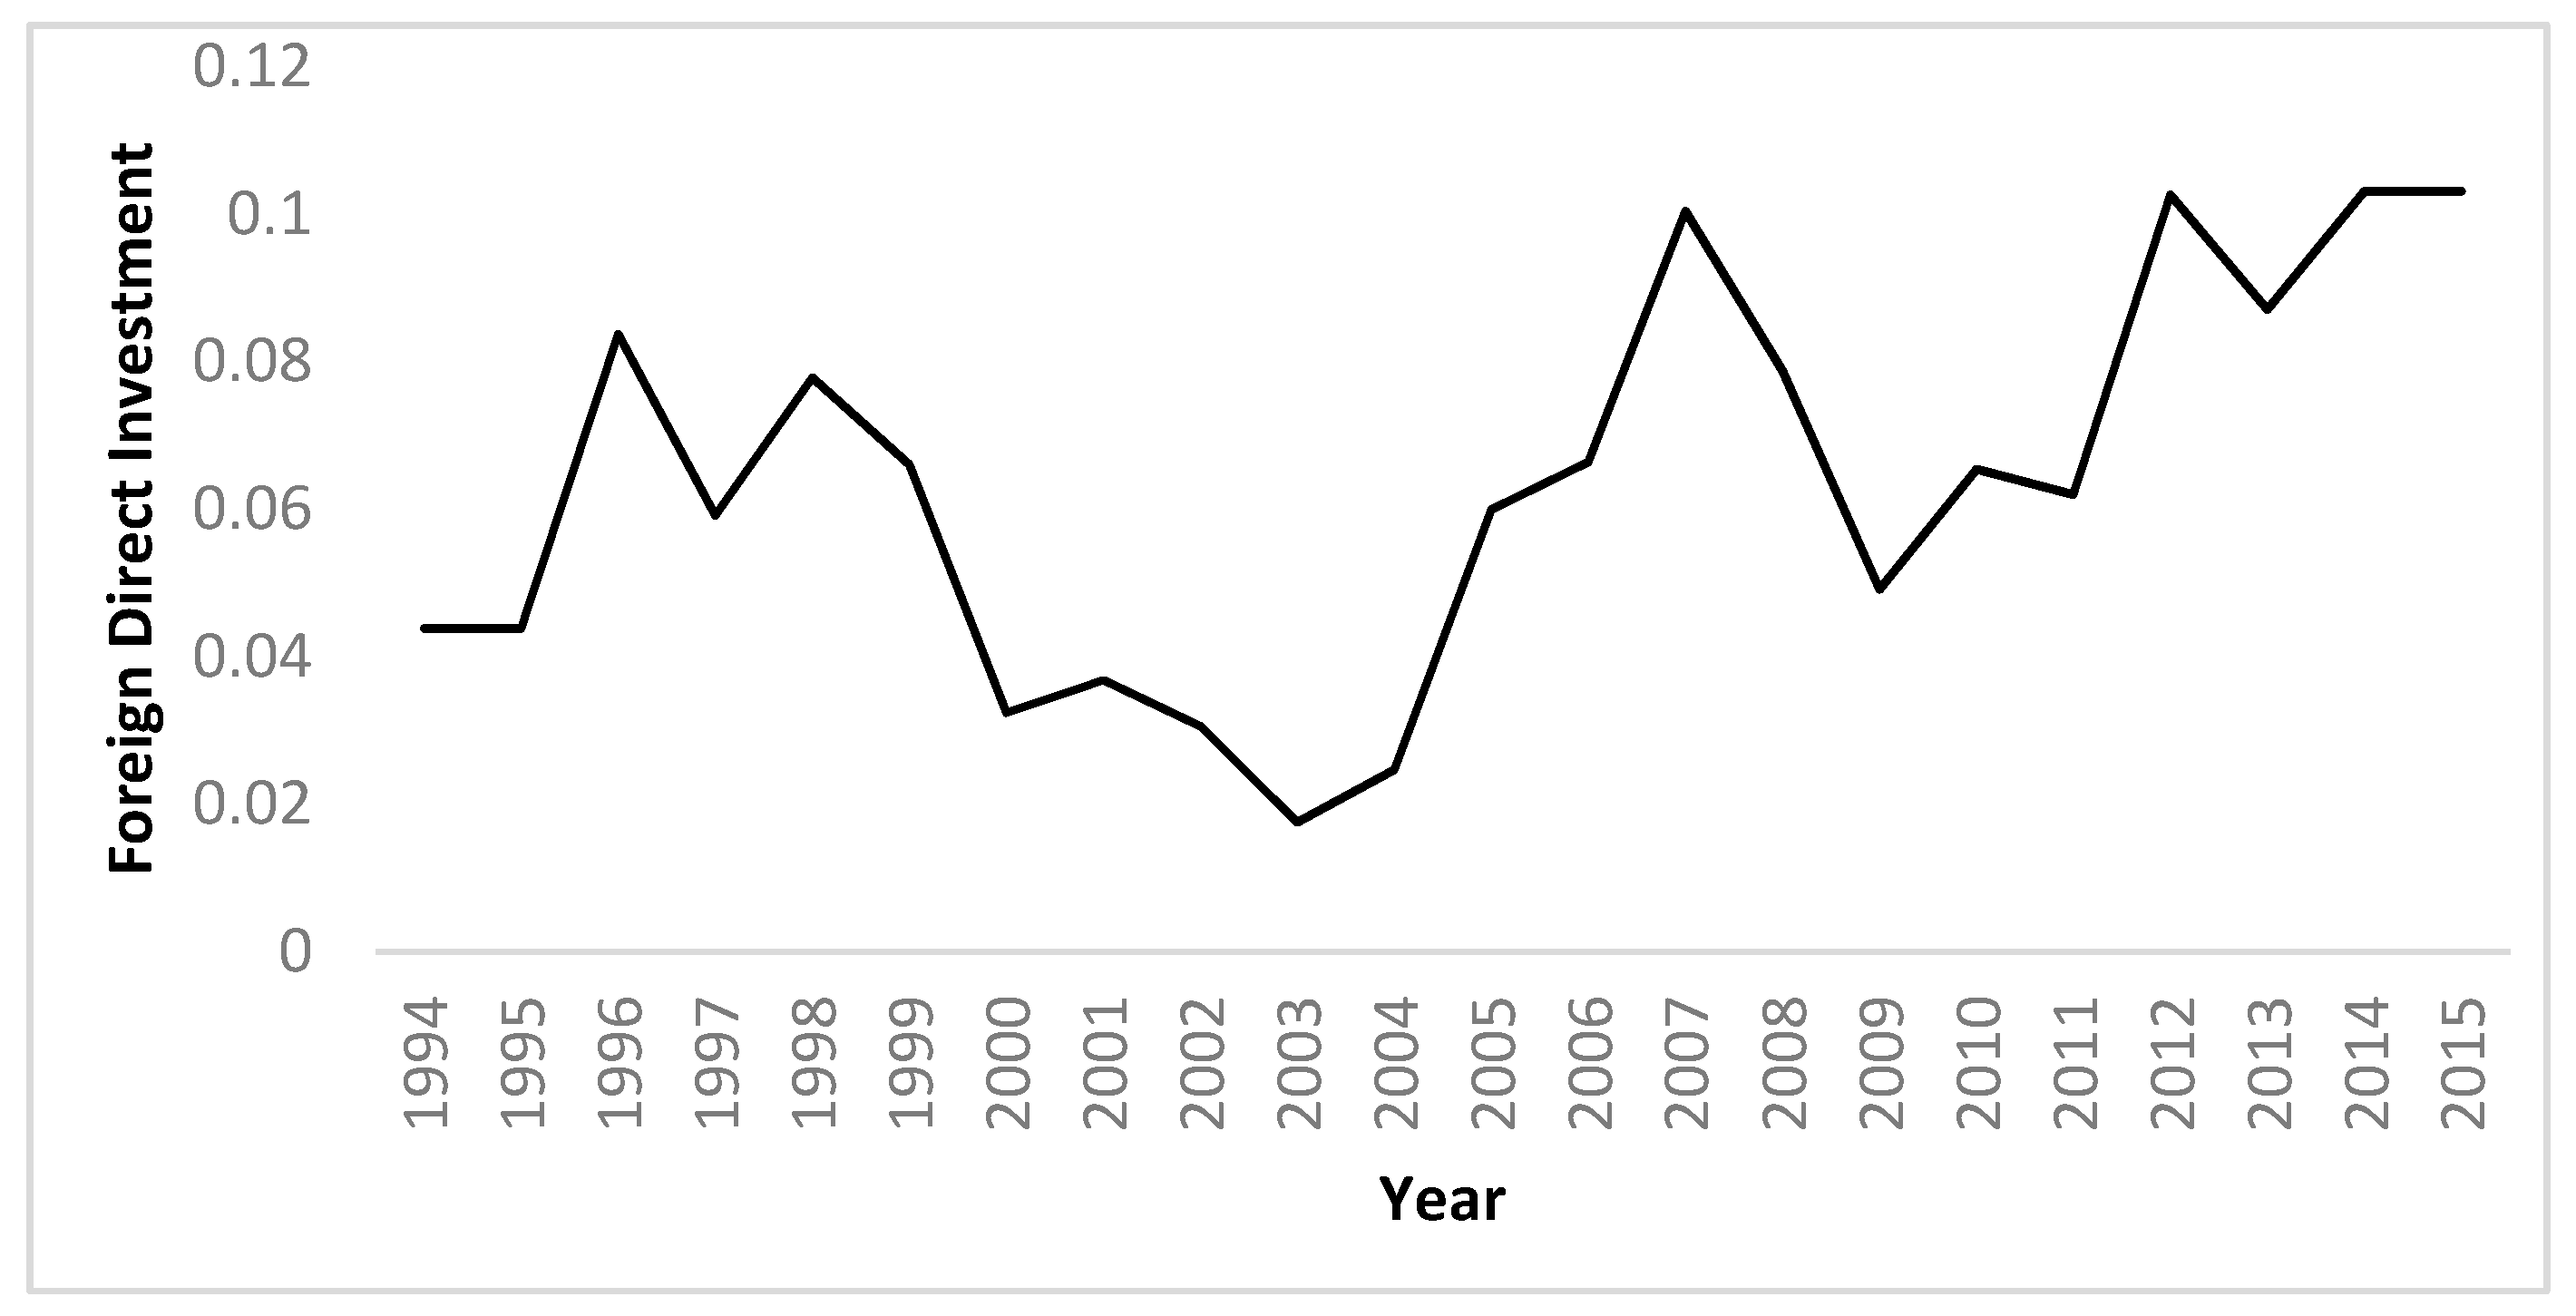
A major weakness of the ARDL modelling is its inability to capture nonlinear and hidden cointegration. It is important to underscore that FDI flows in Cambodia have been non-linear, as displayed in Figure 1. The impact of the asymmetric pattern of FDI in Cambodia on urbanisation has not been investigated in the literature to the best of our knowledge. We hence hypothesise that increases in a variable (say FDI, GDP, TA, DCREDIT, PUBI) will increase the pace of urbanisation, however decreases in this variable might not impact, or have opposite impacts, on urbanisation in Cambodia.
Like most economic data, our data on FDI flows and other variables in Cambodia (Figure 2) display serious fluctuations with the possibility of asymmetric effects on urbanisation in Cambodia. The standard assumption that the long-run relationship between cointegrating variables is linear may result in misleading empirical results given by the ARDL and other methodologies.
In this section we posit that urbanisation in Cambodia is driven by FDI-fueled economic growth, which generates employment opportunities and works as a pull factor for migrant workers in the rural areas of the country; however, this pull factor weakens if there is a fall in FDI flows as it adversely impacts job prospects and therefore the pace of urbanisation in the economy. We speculate that lower FDI will compel rural-migrant workers in Cambodia to undertake greater risk and explore opportunities in neighbouring Thailand, which might moderate the pace of urbanisation (or urban primacy) in Cambodia.
In the urbanisation literature, the unified model is to explain urbanisation in terms of the chosen variables. The problem with the Cambodian case is the non-availability of long-term time series data (due to civil wars) to test a unified model. Given the data limitations, a unified model cannot be tested. Hence, Model 1 to Model 5 are partial models as a handful of explanatory variables are chosen for each model to apply the advanced econometric methodology to overcome the absence of a long horizon of data.
- NARDL Model 1:
From the F-statistic in Table 4 we find that FDI, DCREDIT, TA, GDP and PUBI all co-move—in the long-run—with urbanisation in Cambodia. The reported F-statistic, 19.72, exceeds the critical upper bound at the 1% level of significance, with the critical bounds being available from Narayan (2005) [33]. With this finding, we check the asymmetry: from Table 5, the Wald statistic indicates that for Model 1, there is clear evidence of a long-run asymmetry for the effects of increases in FDI vis-à-vis decreases in FDI on urbanisation (see the values of and in Table 4). The long-run coefficient is statistically significant (at the 5% level of significance) with an elasticity of urbanisation of 0.575 for increases in FDI: if FDI rises by 1%, the cumulative and long-term effect of increases in FDI will increase urbanisation by 0.575%. However, as FDI decreases by 1%, this will also increase urbanisation by 1.8% at the 1% level of satisfaction. Thus, we detect a serious long-run asymmetry in the effects of fluctuations in FDI on urbanisation in Cambodia. One plausible rationale for this observed asymmetry is that increases in FDI promote ‘pull factors” behind migration and hence urbanisation. On the other hand, decreases in FDI have an asymmetric effect as such decreases triggering the ‘push factors’ behind rural–urban migration. We find a similar evidence of short-run asymmetry from and from Table 4. The ECM coefficient confirms causality from the explanatory variable to the dependent variable.
FDI has become an important source of livelihood for the Cambodian population—especially from the rural and the semi-urban areas. Given the fact that FDI promotes the demand for skilled workers, the rural and semi-urban households invested in the formation of human capital of one of their wards (due to limited economic means and absence of educational loans). As FDI increases, the demand for skilled labour increases, prompting the migration of skilled family members to earn premium wages from the special economic zones and send remittances. This is the pull theory of rural–urban migration. On the other hand, as the FDI declines some skilled workers are forced to return back to their home bases in the rural areas, which triggers the migration of unskilled and semi-skilled family members looking for jobs in the urban areas since “home is too hot”. The migration of unskilled and semi-skilled family members forms the “push” component of the rural to urban migration.
- NARDL Model 2:
In the second model, we choose the gross domestic product (GDP) as the explanatory variable for urbanisation. We note that the F-statistic is 22.18, which is much larger than the upper bound value of 7 at 1% level of significance, which confirms that there is a long-run relationship between GDP and urbanisation in Cambodia. The Wald tests statistics in Table 5 show that there is an asymmetry in the long-run but not in the short-run. While in the long-run we find that a 1% increase in GDP increases (cumulative and asymptotic) urbanisation by 3.03% in Cambodia with a 10% level of statistical significance; However, there are no perceptible long-term effects of decreases in GDP on urbanisation. We did not find any evidence of short-run asymmetry from and from Table 4. Once again, the ECM coefficient confirms causality.
- NARDL Model 3:
The third model introduces public investment (PUBI) and considers its effect on urbanisation. We note that the F-statistic is 25.67, so the public investment variable (PUBI) co-moves with urbanisation in the long-run at the 1% level of significance. The Wald tests statistics in Table 5 for Model 3 show that both the asymmetries in the long- and short-run are confirmed. In the long run, the cumulative and asymptotic value of the elasticity of urbanisation is 0.0024 at the 1% level of significance when PUBI increases by 1%. The elasticity reverses its sign for decreases in PUBI at the 5% level of significance. In other words, if PUBI increases by 1%, then urbanisation rises by 0.0024% in the long-run. If PUBI decreases by 1%, then urbanisation rises by 0.024% (at 5% level of significance). This gives a clear picture of asymmetric impacts of increases vis-à-vis decreases in PUBI on urbanisation in Cambodia. Similar short-run asymmetries are observed for the effects of PUBI on urbanisation. The ECM coefficient also confirms causality.
PUBI plays an important role in the special economic zones and urban hotspots of FDI. The FDI is driven by the increases in PUBI as FDI needs PUBI to be effective. As PUBI increases, FDI increases triggering the migration of skilled workers to the FDI hotspots. This migration of skilled workers indicates the pull forces of migration.
However, if PUBI declines in an urban hotspot, FDI also declines due to crowding of existing PUBI. As FDI declines, skilled workers are forced to return home while unskilled and semi-skilled family members migrate to urban and semi-urban areas to recoup the loss of family incomes. This increase in unskilled and semi-skilled workers—driven by the push factor—causes booming of small businesses and SMEs as they employ cheap labour leading to further urbanization.
- NARDL Model 4:
In Model 4, we consider the impacts of financial development, or DCREDIT, on urbanisation in isolation of other variables. The ECM term in Table 4 shows that the chosen variable (DCREDIT) fails to equilibrate the system towards the long-term equilibrium. In other words, the model does not converge towards the long-run equilibrium unless we incorporate external factors like FDI and/or TA. For a meaningful long-run equilibrium, the ECM terms must be statistically significant and negative [24]. The statistical significance of the ECM coefficient, its negative sign and size can only confirm the presence of a highly stable long-run relationship, which Model 4 fails to satisfy. This finding underscores the importance of the external factors for driving urbanisation in Cambodia.
- NARDL Model 5:
The fifth model considers the effects of TA on urbanisation. We note that the F-statistic implies that TA and urbanisation co-move in the long-run at the 1% level of significance. The Wald tests statistics in Table 5 for Model 5 show that both the asymmetries in the long- and short-run are rather significant, though the causality runs from TA to urbanisation in Cambodia.
5. Conclusions
Cambodia is one of the fastest growing Asian economies suffering from sustainability problems driven by massive spurts in urban growth. One large city—Phnom Penh—leads urbanisation in the country and is estimated to house over 2 million Cambodians. Other emerging secondary cities such as Siem Reap, Battambang and Poipet have populations ranging from just over 100,000 to under 250,000 [34]. The unplanned urban growth in a few clusters of the country has resulted in an urban sprawl undermining the ability of the nation to achieve the major targets set for sustainable development by the United Nations. In this paper, we examined various internal and external factors influencing the pace of urbanisation in Cambodia to assess strategies which can foster a more balanced and sustainable urbanisation in the country.
The ARDL models, exploring the long-term determinants of urbanisation in Cambodia from the cointegration analysis, underscore two important lessons: first and foremost, though urbanisation bears a long-run relationship with both external and internal drivers, the chosen external drivers—like rising FDI and TA (tourism variable)—are noted to have little impact on urbanisation without the internal drivers. The prime mover of urbanisation is the domestic financial development measured by domestic credit (DCREDIT) creation in Cambodia. The impact of FDI on urbanisation is unclear while tourist arrivals (TA) are found to have impacts on urbanisation in the long run if we consider both internal and external drivers. Secondly, this long-term relationship is found to be stable and meaningful as the system is found to converge on the long-term equilibrium implying causality running from internal and external drivers of urbanisation to urbanisation.
The existing literature has assumed a linear and symmetric relationship of urbanisation vis-à-vis explanatory variables: when an explanatory variable increases by 1%, say, urbanisation increases by a%. When this explanatory variable decreases by 1%, the existing models predict that urbanisation declines by a% without considering the possibility of asymmetric relationships. Such asymmetric relationships can also arise between long-run and short-run models. In this paper, we introduce the possibility of asymmetries by utilising the NARDL model. Since the ARDL methodology, like other models, assumes a symmetric relationship between dependent and independent variables, this methodology cannot detect hidden and non-linear cointegration and hence, we suggest that NARDL is a more convincing model.
The NARDL methodology offered us some interesting insights hitherto unknown: first, we found that all postulated models except one are meaningful. We noted that FDI flows have significant short-run and long-run asymmetric effects: in the short-run, if FDI increases by 1%, urbanisation increases by 0.36% in Cambodia. If FDI decreases by 1%, urbanisation still increases by 0.34%. The ARDL methodology failed to detect this asymmetry in the effects of changes in FDI flows on urbanisation. In the long-run, similar asymmetries are observed: the cumulative and long-run impact of a 1% increase in FDI is 0 0.57% increase in urbanisation while the effect of a 1% decrease in FDI increases urbanisation by 1.80%.
The rational for this finding is that an increase in FDI is expected to boost the pull factors for rural–urban migration while a decrease in FDI will impoverish the economy to promote the push factors for rural–urban migration. FDI has emerged as a critical source of livelihood for Cambodians, prompting rural and semi-urban households to invest in the formation of human capital. As an increase in FDI stimulates the demand for skilled labour, increases in FDI work as a ‘pull-factor’ for rural–urban migrants as skilled workers relocate to urban regions to earn premium wages. On the other hand, a decline in FDI forces skilled migrants to return to their rural bases, which works as a ‘push-factor’ for unskilled and semi-skilled workers who migrate to urban areas in search of better work opportunities and recoup the loss of family income, due to the return of a skilled family member.
We found similar elements of hidden cointegration and asymmetric effects of GDP, tourist arrival and bank credit on urbanisation in Cambodia.
It is well-established in urban economics that urbanisation is impacted by both natural increases in population and the internal migration of labour, especially from rural to urban areas [35]. It has also been noted that about 40% of urbanisation is triggered by the rural–urban migration, as Chen et al. (1998) found in their study of 55 countries—17 from Africa, 22 from Latin America and 16 from Asia [35]. Due to the lack of data, it is not possible to decompose the effects of these two factors on urbanisation in Cambodia. Yet, by using a set of relevant variables, we are able to extract the precise effects of important drivers/determinants (FDI, tourist arrival, public investment and domestic credit creation) of urbanisation. In future work, with detailed data on the flows of internal migration, we will seek to decompose the effects of population growth and migration on urbanisation in Cambodia. The existing literature assumed a symmetric relationship between urbanisation and other determinants [34,35,36,37], and our work is the first one to examine the asymmetric impacts of some of the drivers of urbanisation. The existence of such asymmetries can have a far reaching consequence for future research to re-evaluate well-established drivers of urbanisation: OECD (2009) [36], Lucas (1998) [37], and Chan et al. (2003) [38] noted that the effects of internal migration, though playing a very important role in early stages of development, gradually peter out slowly as development reaches a critical point. Our approach of NARDL models can be extended in future work to incorporate threshold effects for re-assessment of the received doctrines of urbanisation.
Author Contributions
Conceptualization, P.G.; Data curation, S.J. and A.S.; Formal analysis, P.G. and S.J.; Investigation, A.S.; Methodology, S.J.; Project administration, P.G.; Supervision, P.G.; Visualization, A.S.; Writing—original draft, P.G. and S.J.; Writing—review and editing, A.S. All authors have read and agreed to the published version of the manuscript.
Funding
This research received no external funding.
Conflicts of Interest
The authors declare no conflict of interest.
References
- Glaeser, E.L. The challenge of urban policy. J. Policy Anal. Manag. 2011, 31, 111–122. [Google Scholar] [CrossRef]
- Hall, D.D. Community in the new urbanism: Design vision and symbolic crusade. Tradit. Dwell. Settl. Rev. 1998, 23–36. [Google Scholar]
- United Nations. 2018 Revision of World Urbanization Prospects; United Nations Department of Economic and Social Affairs (UN DESA): New York, NY, USA, 2018. [Google Scholar]
- Stahel, W.R. The circular economy. Nature 2016, 531, 435–438. [Google Scholar] [CrossRef] [Green Version]
- Biswas, A.K.; Tortajada, C. Future Water Governance: Problems and Perspectives. Int. J. Water Resour. Dev. 2010, 26, 129–139. [Google Scholar] [CrossRef]
- Jiang, L.; O’Neill, B.C. Determinants of Urban Growth during Demographic and Mobility Transitions: Evidence from India, Mexico, and the US. Popul. Dev. Rev. 2018, 44, 363–389. [Google Scholar] [CrossRef] [Green Version]
- Shin, Y.; Yu, B.; Greenwood-Nimmo, M. Modelling Asymmetric Cointegration and Dynamic Multipliers in a Nonlinear ARDL Framework. SSRN Electron. J. 2011, 281–314. [Google Scholar] [CrossRef] [Green Version]
- Siampos, G.S. The Population of Cambodia 1945–1980. Milbank Mem. Fund Q. 1970, 48, 317. [Google Scholar] [CrossRef]
- Rice, S.; Tyner, J. The rice cities of the Khmer Rouge: An urban political ecology of rural mass violence. Trans. Inst. Br. Geogr. 2017, 42, 559–571. [Google Scholar] [CrossRef]
- Kiernan, B. The Cambodian Genocide, 1975–1979. Centur. Genocide Essays Eyewitn. Acc. 2012, 10, 317–354. [Google Scholar]
- Sheng, Y.K.; Thuzar, M. Urbanization in Southeast. Asia: Issues & Impacts; Institute of Southeast Asian Studies: Singapore, 2012. [Google Scholar]
- Pierdet, C. Spatial and Social Resilience in Phnom Penh, Cambodia since 1979. South East Asia Res. 2012, 20, 263–281. [Google Scholar] [CrossRef]
- Wells-Dang, A. Political space in Vietnam: A view from the ‘rice-roots’. Pac. Rev. 2010, 23, 93–112. [Google Scholar] [CrossRef]
- Bühler, D.; Grote, U.; Hartje, R.; Ker, B.; Lam, D.T.; Nguyen, L.; Nguyen, T.T.; Tong, K. Rural Livelihood Strategies in Cambodia: Evidence from a Household Survey in Stung Treng; Working Papers 200207; University of Bonn, Center for Development Research (ZEF): Bonn, Germany, 2015. [Google Scholar]
- Maltoni, B. Review of Labor Migration Dynamics in Cambodia; International Organization for Migration: Washington, DC, USA, 2006. [Google Scholar]
- Cuyvers, L.; Soeng, R.; Plasmans, J.; Bulcke, D.V.D. Determinants of foreign direct investment in Cambodia. J. Asian Econ. 2011, 22, 222–234. [Google Scholar] [CrossRef]
- National Institute of Statistics Cambodia Socio-Economic Survey 2013. Available online: https://www.nis.gov.kh/nis/CSES/Final%20Report%20CSES%202013.pdf (accessed on 12 October 2020).
- Tunon, M.; Rim, K. Cross-Border Labour Migration in Cambodia; National Employment Policy: Bangkok, Thailand, 2013. [Google Scholar]
- Acharya, A. How Ideas Spread: Whose Norms Matter? Norm Localization and Institutional Change in Asian Regionalism. Int. Organ. 2004, 58, 239–275. [Google Scholar] [CrossRef] [Green Version]
- Heinonen, U. Environmental Impact on Migration in Cambodia: Water-related Migration from the Tonle Sap Lake Region. Int. J. Water Resour. Dev. 2006, 22, 449–462. [Google Scholar] [CrossRef]
- Hing, V.; Lun, P.; Phann, D. Irregular Migration from Cambodia: Characteristics, Challenges, and Regulatory Approach. J. Philipp. Dev. 2011, 38, 1. [Google Scholar]
- Sothan, S.; Zhang, X. Causality between foreign direct investment and economic growth for Cambodia. Cogent Econ. Financ. 2017, 5, 1277860. [Google Scholar] [CrossRef]
- Winter, T. Post-conflict Heritage and Tourism in Cambodia: The Burden of Angkor. Int. J. Heritage Stud. 2008, 14, 524–539. [Google Scholar] [CrossRef]
- Pesaran, M.H.; Shin, Y.; Smithc, R.J. Bounds testing approaches to the analysis of level relationships. J. Appl. Econ. 2001, 16, 289–326. [Google Scholar] [CrossRef]
- Haug, A.A. Temporal Aggregation and the Power of Cointegration Tests: A Monte Carlo Study. Oxf. Bull. Econ. Stat. 2002, 64, 399–412. [Google Scholar] [CrossRef]
- Katrakilidis, C.; Trachanas, E. What drives housing price dynamics in Greece: New evidence from asymmetric ARDL cointegration. Econ. Model. 2012, 29, 1064–1069. [Google Scholar] [CrossRef]
- Ng, S.; Perron, P. LAG Length Selection and the Construction of Unit Root Tests with Good Size and Power. Econometrica 2001, 69, 1519–1554. [Google Scholar] [CrossRef] [Green Version]
- Engle, R.F.; Granger, C.W.J. Co-Integration and Error Correction: Representation, Estimation, and Testing. Econometrica 1987, 55, 251. [Google Scholar] [CrossRef]
- Gangopadhyay, P.; Nilakantan, R. Estimating the Effects of Climate Shocks on Collective Violence: ARDL Evidence from India. J. Dev. Stud. 2017, 54, 441–456. [Google Scholar] [CrossRef]
- Herzer, D.; Strulik, H. Religiosity and Income: A Panel Cointegration and Causality Analysis. Philosophy Relig. J. 2013, 49, 2922–2938. [Google Scholar] [CrossRef] [Green Version]
- Granger, C.W.; Huangb, B.-N.; Yang, C.-W. A bivariate causality between stock prices and exchange rates: Evidence from recent Asianflu. Q. Rev. Econ. Financ. 2000, 40, 337–354. [Google Scholar] [CrossRef]
- Morley, B. Causality between economic growth and immigration: An ARDL bounds testing approach. Econ. Lett. 2006, 90, 72–76. [Google Scholar] [CrossRef]
- Narayan, P.K. The saving and investment nexus for China: Evidence from cointegration tests. App. Econ. 2005, 37, 1979–1990. [Google Scholar] [CrossRef]
- Baker, J.L.; Xiyuan-Lin, S.; Phuong-Phen, H.T.; Kikutake, N.; Johnson, E.C.; van Woerden, F.; Sok, C. Cambodia-Achieving the Potential of Urbanization; The World Bank: Washington, DC, USA, 2018. [Google Scholar]
- Chen, N.; Valente, P.; Zlotnik, H. What Do We Know about Recent Trends in Urbanisation? Bilsborrow, R.E., Ed.; Migration, Urbanisation and Development: New York, NY, USA, 1998; pp. 59–88. [Google Scholar]
- OECD. Trends in Urbanisation and Urban Policies in OECD Countries: What Lessons for China? 2009. Available online: https://www.oecd.org/urban/roundtable/45159707.pdf (accessed on 12 October 2020).
- Lucas, R.E. Internal Migration and Urbanisation: Recent Contributions and New Evidence; IED Discussion Paper Series, No. 91; Boston University: Boston, MA, USA, 1998. [Google Scholar]
- Chan, K.; Ying, H. Urbanisation in China in the 1990’s: New definition, different series and revised trends. China Rev. 2003, 3, 48–271. [Google Scholar]
Figure 1.
Demographic trends in Phnom Penh (1865–2008). Source: Pierdet (2012) [12].
Figure 1.
Demographic trends in Phnom Penh (1865–2008). Source: Pierdet (2012) [12].

Figure 2.
Time path of foreign direct investment (FDI) in Cambodia (1994–2015). Source: constructed by the author.
Figure 2.
Time path of foreign direct investment (FDI) in Cambodia (1994–2015). Source: constructed by the author.


Table 1.
Variables of interest in Cambodia from 1994–2015.
| Variable * | Description | Data Source |
|---|---|---|
| LnUP | Urban Population | ADB ** |
| LnTA | Tourist Arrival | World Bank |
| LnPUBI | Public Investment in Infrastructure | ADB |
| LnDCREDIT | Domestic credit created by the banking sector | ADB |
| LnGDP | Gross Domestic Product in local currency | World Bank |
| LnFDI | Foreign Direct Investment as a Percentage of GDP | World Bank |
Note: * Ln denotes (natural) logarithmic transformation of the relevant variable. ** ADB stands for Asian Development Bank data series.
Table 2.
Unit root statistics for variables of interest.
| Variables | ADF (AIC) | PP | ||||||
|---|---|---|---|---|---|---|---|---|
| Level | 1st Difference | Level | 1st Difference | |||||
| Intercept | Intercept and Trend | Intercept | Intercept and Trend | Intercept | Intercept and Trend | Intercept | Intercept and Trend | |
| LnUP | −2.22 | −4.895 *** | −3.337 ** | −5.794 *** | −2.627 | −0.776 | −3.696 ** | −5.27 *** |
| LnTA | −0.498 | −1.963 | 4.678 *** | −4.575 *** | −0.498 | −2.044 | 4.692 *** | −4.643 *** |
| LnPUBI | −0.986 | −2.478 | −4.101 *** | −4.001 ** | −0.986 | −2.119 | −4.090 *** | −3.992 ** |
| LnDCREDIT | −0.799 | −1.858 | −3.623 ** | −3.51 * | −0.799 | −2.16 | −3.607 ** | −3.501 * |
| LnFDI | −1.813 | −2.304 | 5.503 *** | −5.392 *** | −1.871 | −2.296 | 5.503 *** | −5.392 *** |
Note: *, **, *** represents 10%, 5% and 1% levels of significance respectively.
Table 3.
Determinants of urbanisation in Cambodia: regression results for autoregressive distributed lag (ARDL) and Error Correction Model (ECM).
Table 3.
Determinants of urbanisation in Cambodia: regression results for autoregressive distributed lag (ARDL) and Error Correction Model (ECM).
| Variable | Model (1) | Model (2) | Model (3) |
|---|---|---|---|
| Dependent Variable | LnUPt | LnUPt | LnUPt |
| Adjustment/ECM Term | |||
| LnUPt−1 | −0.305 *** | −0.211 ** | −0.396 *** |
| LONG-RUN | |||
| LnTA | 0.164 *** | 0.05 | |
| LnFDI | −0.342 | −1.042 ** | |
| LnDCREDIT | 0.075 ** | 0.156 *** | |
| SHORT-RUN | |||
| LnTAt−1 | |||
| LnFDIt−1 | −0.085 | 0.394 ** | |
| LnFDIt−2 | −0.113 | 0.321 ** | |
| LnFDIt−3 | 0.14 | 0.226 ** | |
| LnDCREDITt−1 | −0.05 ** | ||
| LnDCREDITt−2 | −0.028 * | ||
| Period of Analysis | 1994–2015 | 1994–2015 | 1994–2015 |
| CONSTANT | 3.793 *** | 2.952 ** | 5.754 *** |
| No of observations | 21 | 21 | 21 |
| Adj. R Squared | 0.651 | 0.518 | 0.676 |
| F Statistic for no cointegration | 4.068 | 7.082 *** | 6.568 *** |
| Cointegration | Not conclusive at 5% significance | YES | YES |
Source: Constructed by the authors. Note: *, **, *** are statistically significance at 10%, 5%, and 1% levels, respectively.
Table 4.
The regression results for Nonlinear Autoregressive Distributed Lag (NARDL) models.
| Variable | Model 1 | Model 2 | Model 3 | Model 4 | Model 5 |
|---|---|---|---|---|---|
| Dependent Variable | LnUPt | LnUPt | LnUPt | LnUPt | LnUPt |
| Adjustment/ECM Term | |||||
| LnUPt−1 (ρ) | −0.28 *** | −0.23 *** | −0.29 *** | 0.17 | −0.22 ** |
| ΔLnUPt−1 | 0.10 | 0.14 | 0.13 | −0.05 | 0.34 |
| Constant | 4.09 *** | 3.37 *** | 4.23 *** | 2.56 | 3.32 ** |
| F Statistic | 19.72 | 22.18 | 25.67 | 9.28 | ** |
| Cointegration | Yes | Yes | Yes | Yes | Yes |
| a+ | 0.16 ** | 0.64 ** | 0.007 *** | 0.2 | 0.035 ** |
| a− | −0.5 *** | −0.91 | −0.0069 ** | −0.09 | 0.12 ** |
| SHORT-RUN | |||||
| ΔFDIt+ | 0.36 ** | ||||
| ΔFDIt− | −0.34 ** | ||||
| ΔGDPt−1+ | 0.06 | ||||
| ΔGDPt−1− | −0.31 | ||||
| ΔPUBIt−1+ | 0.003 | ||||
| ΔPUBIt−1− | −0.001 | ||||
| ΔDCREDITt−1+ | −0.16 | ||||
| ΔDCREDITt−1− | −0.009 | ||||
| ΔTAt−1+ | 0.34 | ||||
| ΔTAt−1− | 0.38 | ||||
| Short Run Asymmetry | |||||
| Wald Statistics | 6.59 ** | 0.015 | 0.0035 | 0.02 | 0.33 |
| S-R Asymmetry | Yes | No | No | No | No |
| Long-Run | |||||
| β+ | 0.575 ** | 3.03 * | 0.0024 *** | 0.116 *** | 0.154 *** |
| β− | −1.803 *** | −3.99 | −0.024 ** | −0.056 | 0.531 * |
| Long-Run Asymmetry | |||||
| Wald Statistics | 197.9 *** | 3.03 * | 126.5 *** | 0.08 | 1.84 |
| L-R Asymmetry | Yes | Yes | Yes | No | No |
| Diagnostics | |||||
| Portmanteau | 6.79 | 3.12 | 6.81 | 6.66 | 3.43 |
| Adjusted R2 | 0.81 | 0.77 | 0.79 | 0.68 | 0.71 |
| Ramsey Reset | 34.8 *** | 15.75 *** | 25.81 *** | 23.08 *** | 81.13 *** |
| J-B | 4.08 | 13.88 *** | 10.31 ** | 12.71 ** | 7.03 ** |
| N | 20 | 20 | 20 | 20 | 20 |
Note: *, **, *** are, respectively, statistically significance at 10%, 5% and 1% levels.
Table 5.
The Wald test results for NARDL models: Long-run (LR) and Short-run (SR) asymmetry.
| Asymmetry Wald Tests, Long-Run | Asymmetry Wald Tests, Short Run | Conclusion |
|---|---|---|
| NARDL Model 1 (Long Run) | NARDL Model 1 (Short Run) | |
| Wald Test: 197 *** | Wald Test: 6.59 ** | Both long run and short run asymmetries exist |
| NARDL Model 2 (Long Run) | NARDL Model 2 (Short Run) | |
| Wald Test 3.03 * | Wald Test: 0.015 | Long run asymmetry but no short run asymmetry |
| NARDL Model 3 (Long Run) | NARDL Model 3 (Short Run) | |
| Wald Test:126.5 *** | Wald Test:0.0035 | Long run asymmetry but no short run asymmetry |
| NARDL Model 4 (Long Run) | NARDL Model 4 (Short Run) | |
| Wald Test: 0.08 | Wald Test: 0.02 | No asymmetry |
| NARDL Model 5 (Long Run) | NARDL Model 5 (Short Run) | |
| Wald Stat: 1.84 | Wald Stat: 0.337 | No asymmetry |
Note: *** p < 0.01; ** p < 0.05; * p < 0.10 rejection of the null hypothesis of long run and short run symmetry.
Publisher’s Note: MDPI stays neutral with regard to jurisdictional claims in published maps and institutional affiliations. |
© 2020 by the authors. Licensee MDPI, Basel, Switzerland. This article is an open access article distributed under the terms and conditions of the Creative Commons Attribution (CC BY) license (http://creativecommons.org/licenses/by/4.0/).
Share and Cite
MDPI and ACS Style
Gangopadhyay, P.; Jain, S.; Suwandaru, A. What Drives Urbanisation in Modern Cambodia? Some Counter-Intuitive Findings. Sustainability 2020, 12, 10253. https://0-doi-org.brum.beds.ac.uk/10.3390/su122410253
AMA Style
Gangopadhyay P, Jain S, Suwandaru A. What Drives Urbanisation in Modern Cambodia? Some Counter-Intuitive Findings. Sustainability. 2020; 12(24):10253. https://0-doi-org.brum.beds.ac.uk/10.3390/su122410253
Chicago/Turabian StyleGangopadhyay, Partha, Siddharth Jain, and Agung Suwandaru. 2020. "What Drives Urbanisation in Modern Cambodia? Some Counter-Intuitive Findings" Sustainability 12, no. 24: 10253. https://0-doi-org.brum.beds.ac.uk/10.3390/su122410253
Note that from the first issue of 2016, this journal uses article numbers instead of page numbers. See further details here.