Citizen Science Monitoring for Sustainable Development Goal Indicator 6.3.2 in England and Zambia

 , ,
, ,
Abstract
:1. Introduction
- Can existing citizen science (FWW) data be used to produce a reliable 6.3.2. indicator score?
- What value does integration of citizen science data add to indicator 6.3.2 reporting?
- How can the benefit of citizen science schemes for the purpose of SDG reporting be maximized?
2. Materials and Methods
2.1. Study Locations
2.2. Description of Datasets
2.3. Indicator Score Calculation
2.4. Data Analysis
3. Results
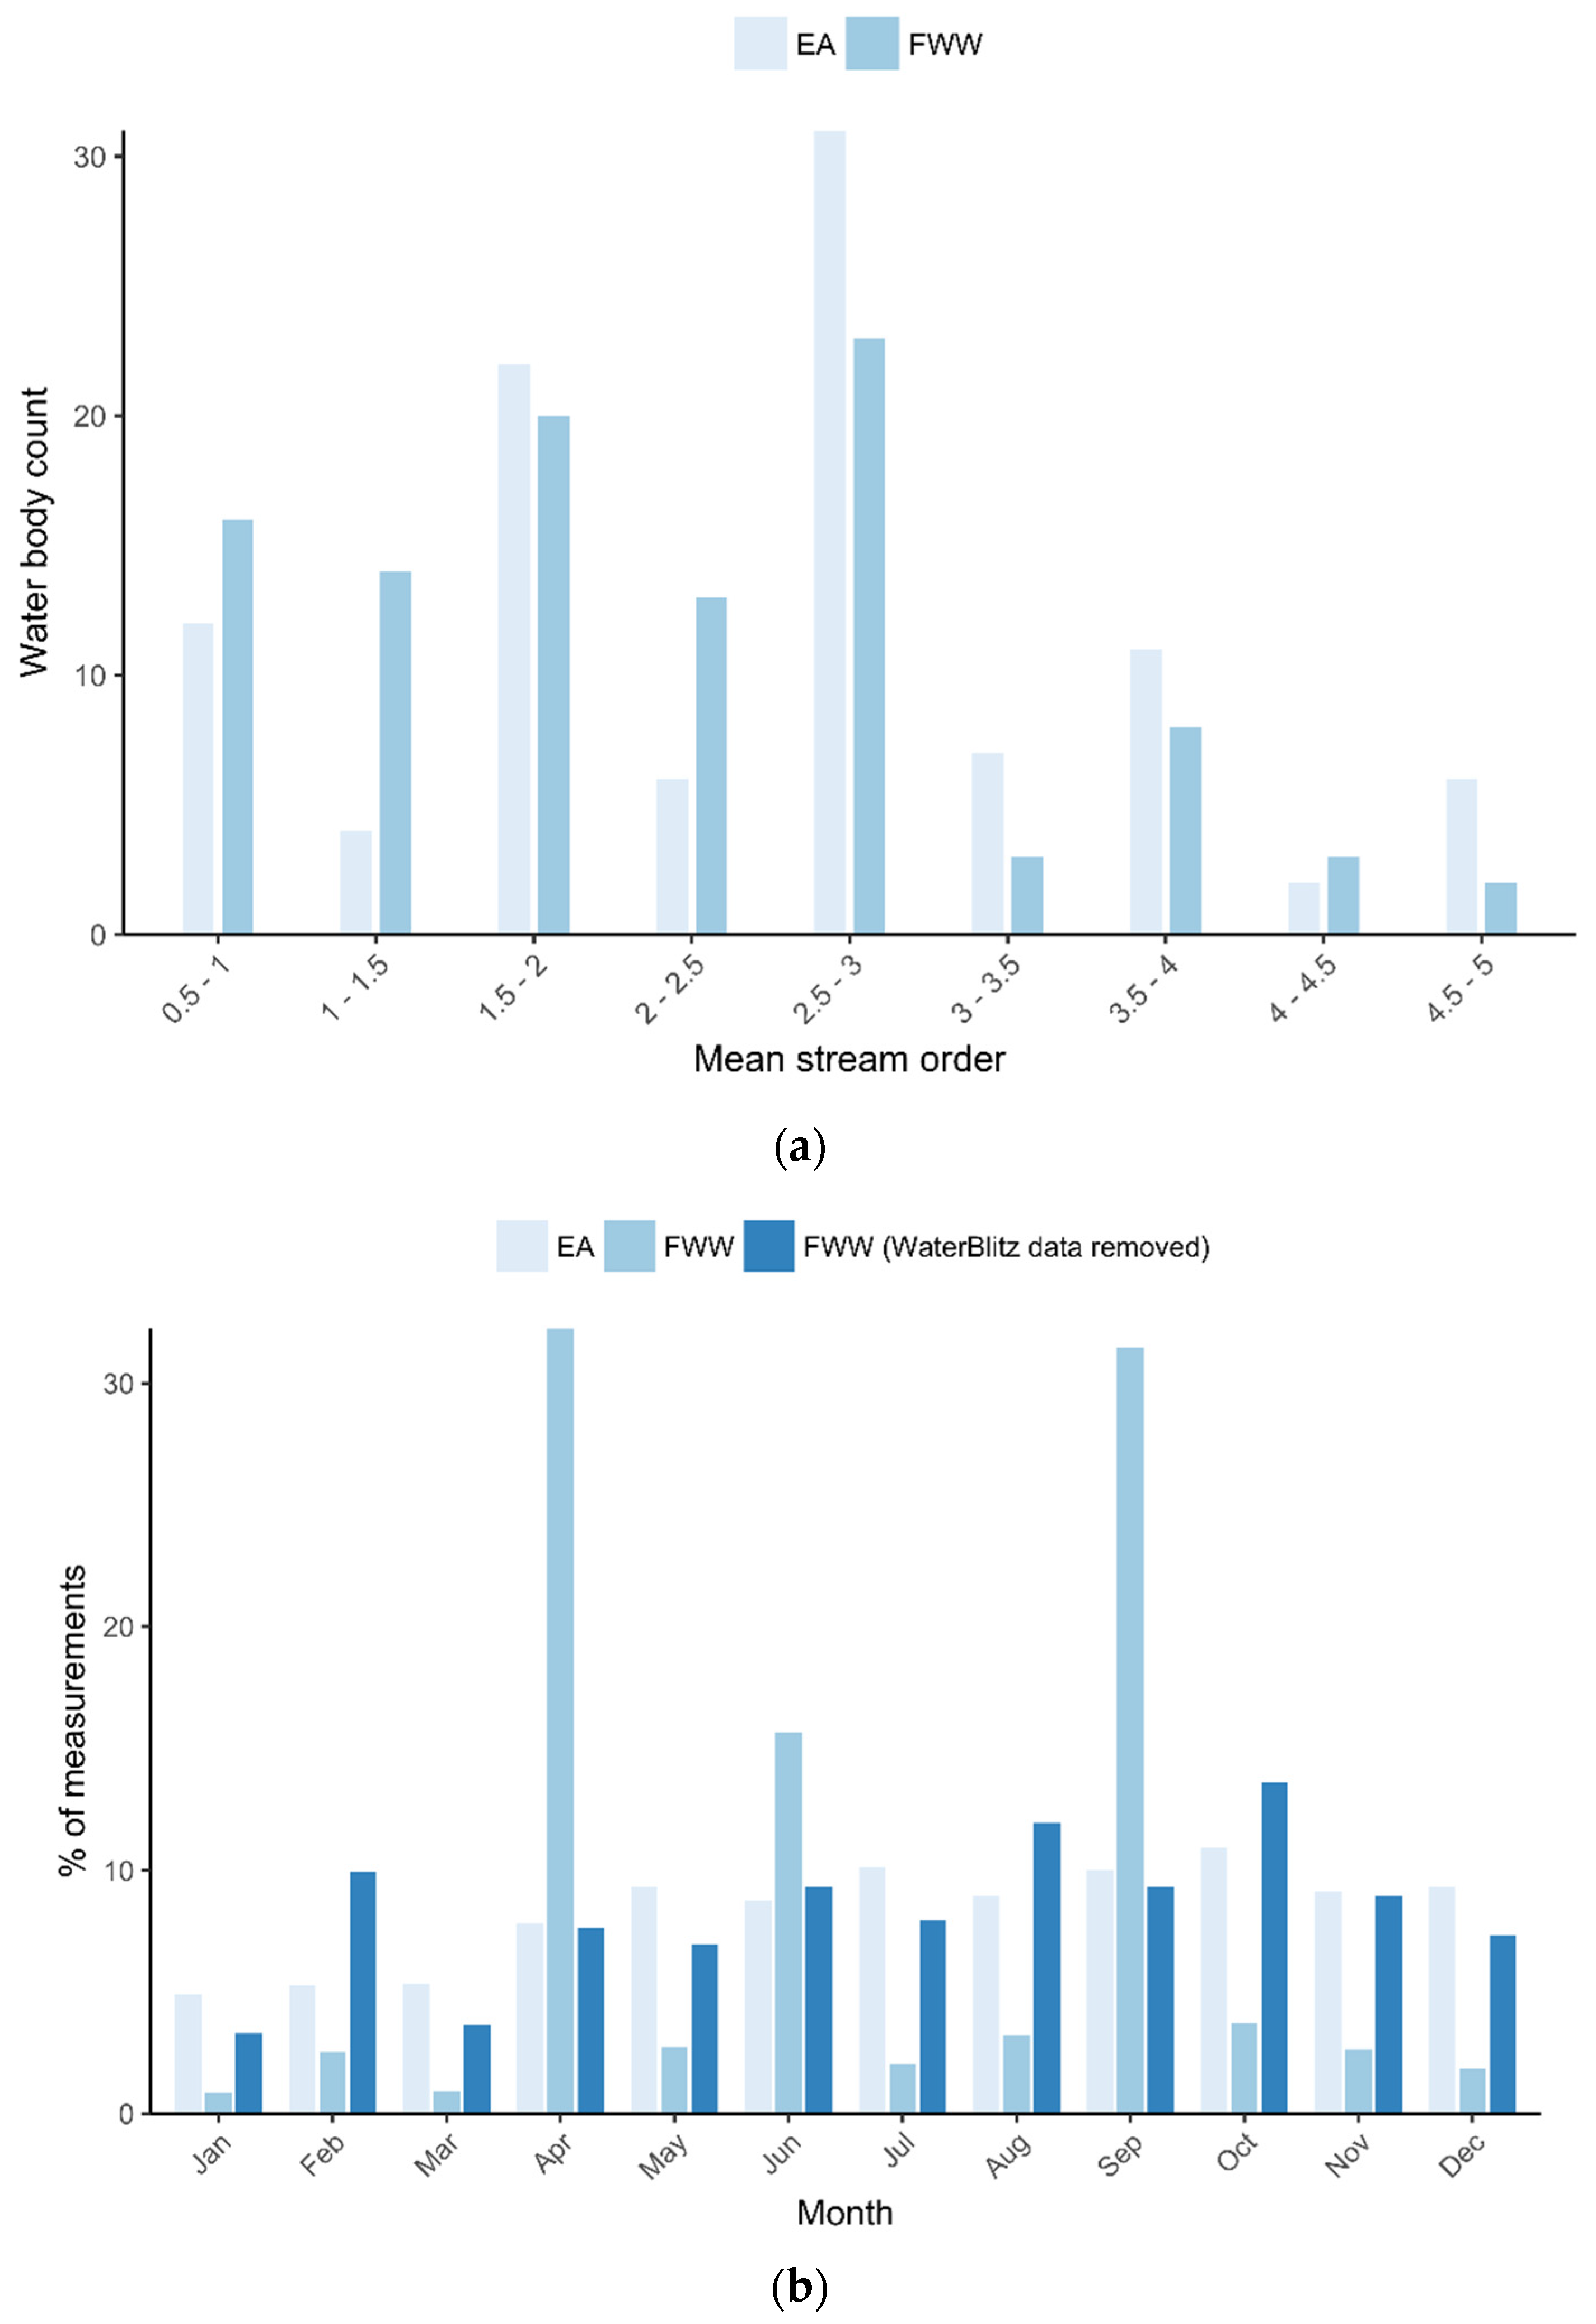
3.1. Data Coverage
3.1.1. England
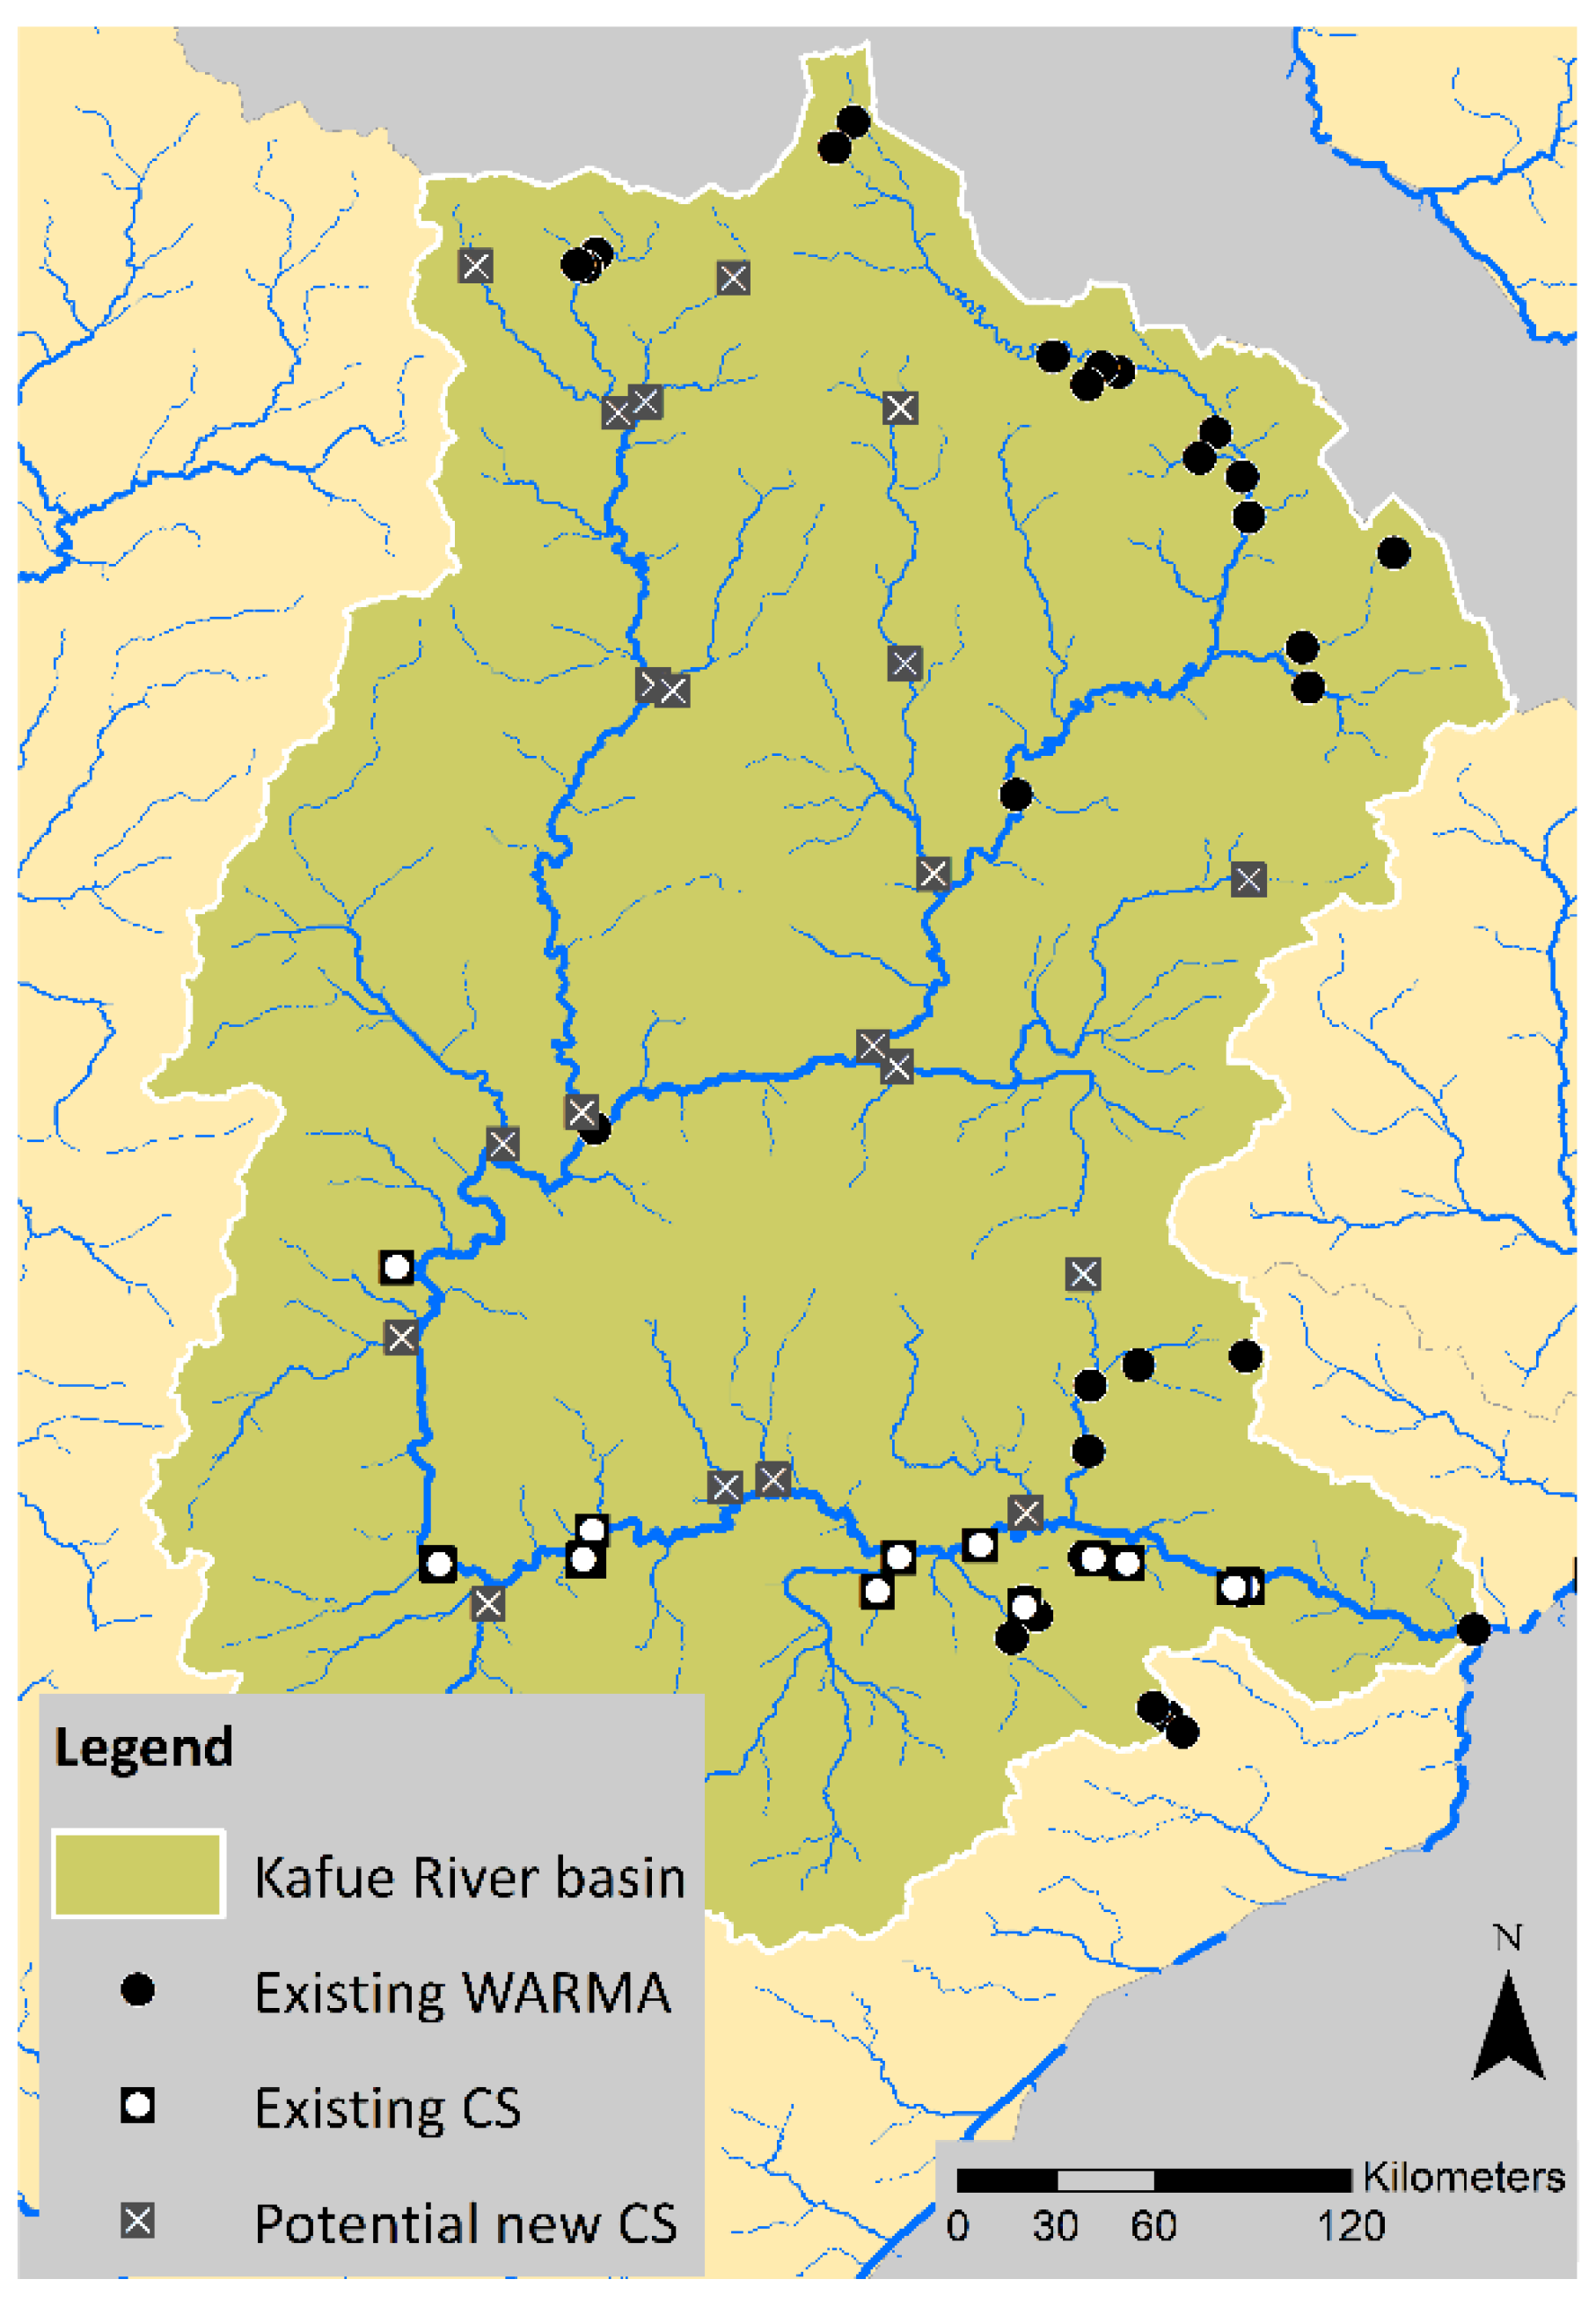
3.1.2. Zambia
3.2. Spatial and Temporal Complementarity (England)
3.3. Indicator Score Calculation
3.3.1. England
3.3.2. Zambia
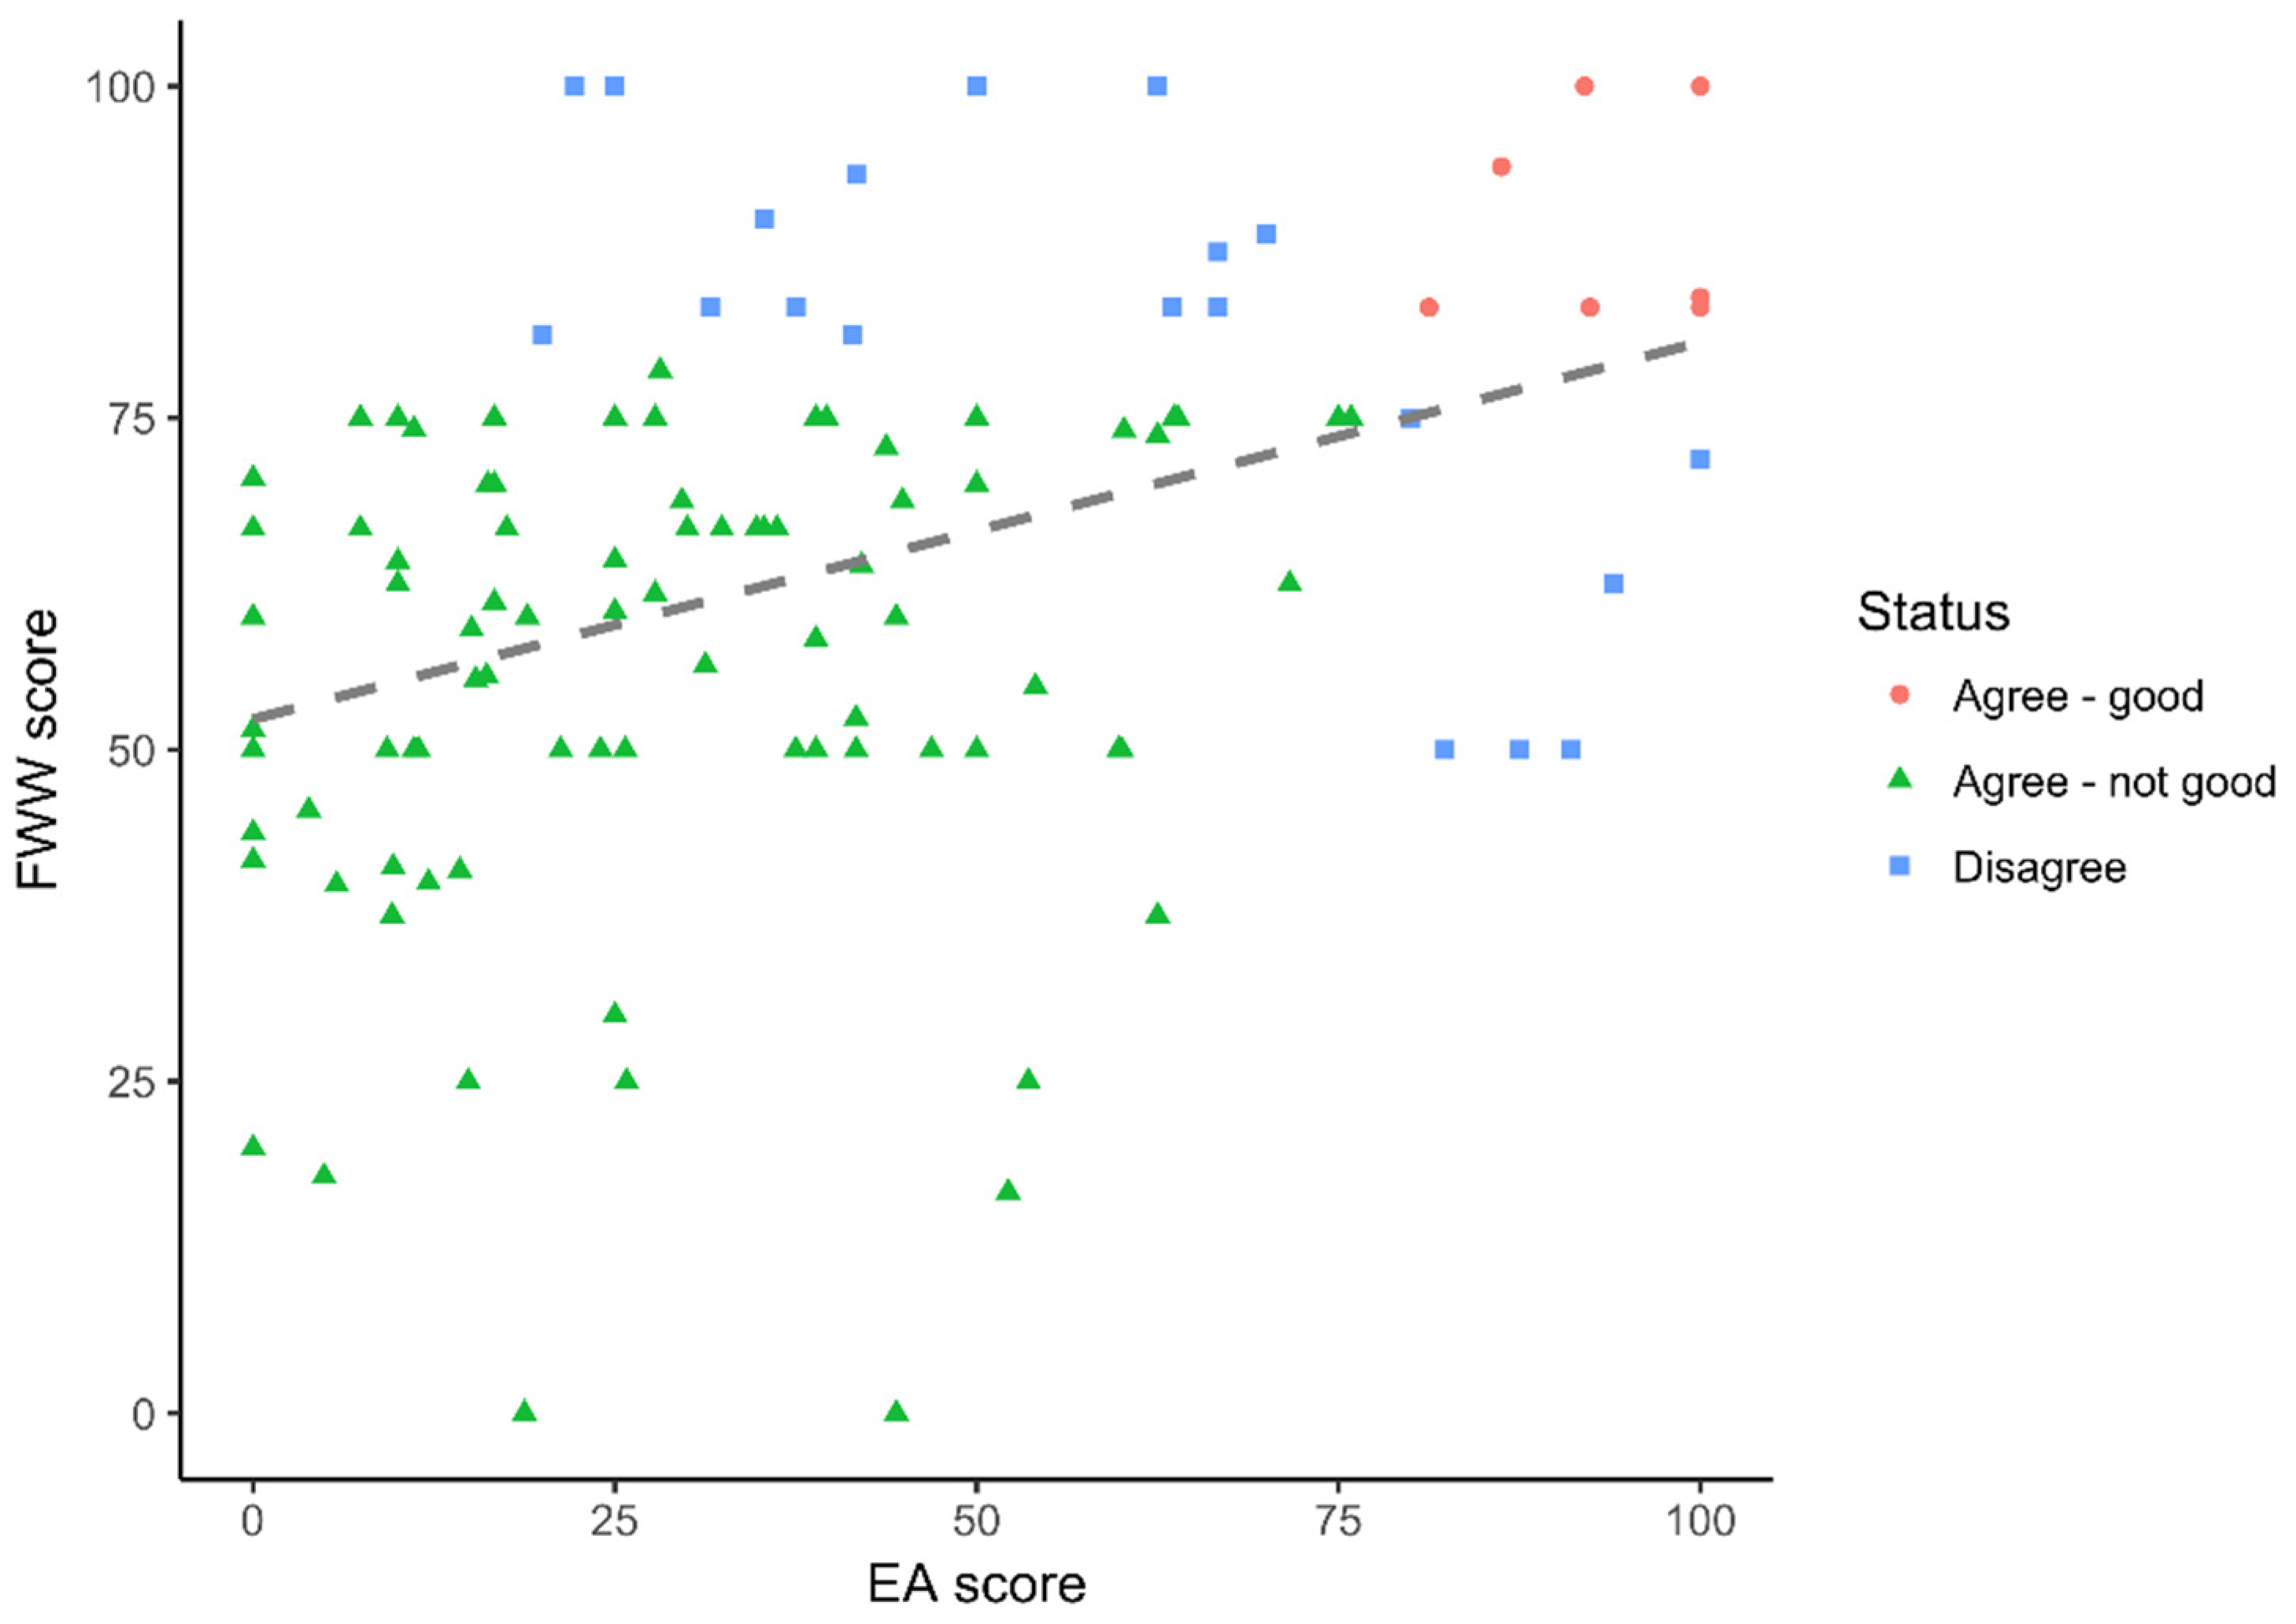
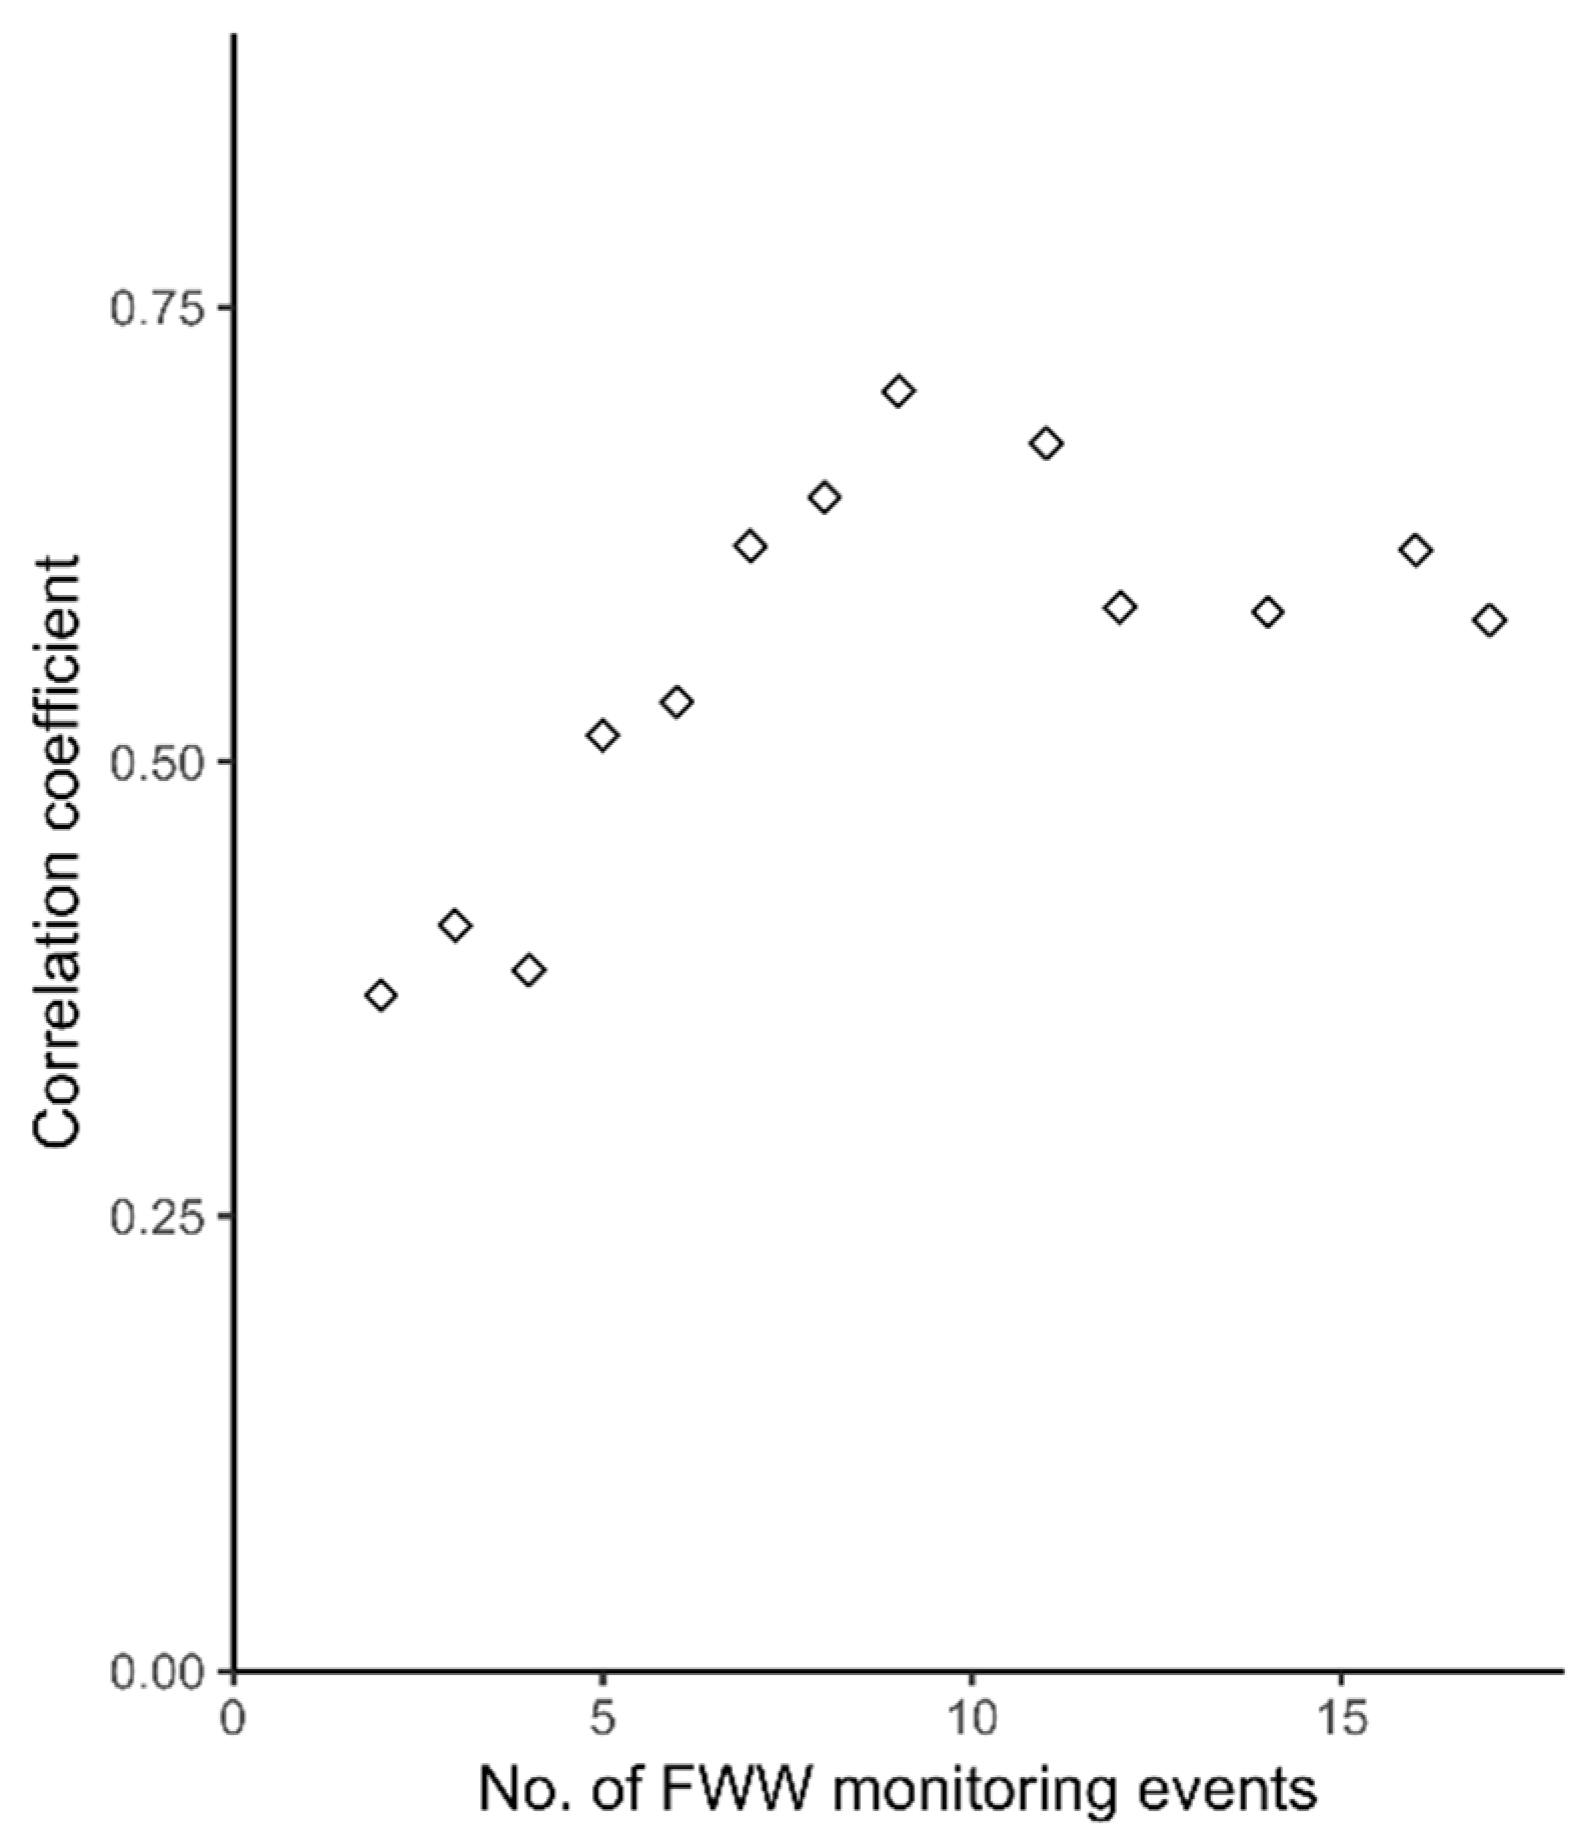
3.4. Indicator Score Agreement (England)
4. Discussion
4.1. Generating Indicator Scores Using Citizen Science Data
4.2. The Value of Integrated Citizen Science/Statutory Monitoring for Indicator 6.3.2
4.3. Recommendations for the Integration of Citizen Science
4.3.1. Consider Biases within Existing Regulatory and Citizen Science Monitoring Schemes
4.3.2. Design New Citizen Science Monitoring Schemes in Accordance with 6.3.2 Indicator Methodology
4.3.3. Design and Deliver Citizen Science Monitoring for Multiple Benefits
5. Conclusions
Author Contributions
Funding
Acknowledgments
Conflicts of Interest
References
- Fritz, S.; See, L.; Carlson, T.; Haklay, M.; Oliver, J.L.; Fraisl, D.; Mondardini, R.; Brocklehurts, M.; Shanley, L.A.; Schade, S.; et al. Citizen science and the United Nations Sustainable Development Goals. Nat. Sustain. 2019, 2, 922–930. [Google Scholar] [CrossRef]
- UN Environment. Global Environment Outlook—GEO6: Healthy Planet, Healthy People; UNEP: Nairobi, Kenya, 2019. [Google Scholar] [CrossRef] [Green Version]
- Fraisl, D.; Campbell, J.; See, L.; When, U.; Wardlow, J.; Gold, M.; Moorthy, I.; Arias, R.; Piera, J.; Oliver, J.L.; et al. Mapping citizen science contributions to the UN sustainable development goals. Sustain. Sci. 2020. [Google Scholar] [CrossRef]
- United Nations. SDG Indicators Metadata Repository 2019. Available online: https://unstats.un.org/sdgs/metadata/ (accessed on 3 September 2020).
- Council Directive 2000/60/EC of the European Parliament and of the Council of 23 October 2000 Establishing a Framework for Community Action in the Field of Water Policy. 2000. Available online: https://eur-lex.europa.eu/legal-content/EN/TXT/?uri=CELEX:32000L0060 (accessed on 28 August 2020).
- Kirschke, S.; Avellán, T.; Bärlund, I.; Bogardi, J.J.; Carvalho, L.; Chapman, D.; Warner, S. Capacity challenges in water quality monitoring: Understanding the role of human development. Environ. Monit. Assess. 2020, 192, 1–16. [Google Scholar] [CrossRef] [PubMed] [Green Version]
- United Nations. Sustainable Development Goal 6 Synthesis Report 2018 on Water and Sanitation; United Nations: New York, NY, USA, 2018. [Google Scholar]
- Buytaert, W.; Zulkafli, Z.; Grainger, S.; Acosta, L.; Alemie, T.C.; Bastiaensen, J.; De Bièvre, B.; Bhusal, J.; Clark, J.; Dewulf, A.; et al. Citizen science in hydrology and water resources: Opportunities for knowledge generation, ecosystem service management, and sustainable development. Front. Earth Sci. 2014, 2, 26. [Google Scholar] [CrossRef] [Green Version]
- August, T.A.; West, S.E.; Robson, H.; Lyon, J.; Huddart, J.; Velasquez, L.F.; Thornhill, I. Citizen meets social science: Predicting volunteer involvement in a global freshwater monitoring experiment. Freshw. Sci. 2019, 38, 321–331. [Google Scholar] [CrossRef] [Green Version]
- Quinlivan, L.; Chapman, D.V.; Sullivan, T. Validating citizen science monitoring of ambient water quality for the United Nations sustainable development goals. Sci. Total Environ. 2020, 699, 134255. [Google Scholar] [CrossRef] [PubMed]
- European Commission Best practices in Citizen Science for Environmental Monitoring. 2020. Available online: https://ec.europa.eu/environment/legal/reporting/pdf/best_practices_citizen_science_environmental_monitoring.pdf (accessed on 19 October 2020).
- Uhlendahl, T.; Salian, P.; Casarotto, C.; Doetsch, J. Good water governance and IWRM in Zambia: Challenges and chances. Water Policy 2011, 13, 845–862. [Google Scholar] [CrossRef] [Green Version]
- Nelson, L.; Kurtz, L.T.; Bray, H. Rapid determination of nitrates and nitrites. Anal. Chem. 1954, 26, 1081–1082. [Google Scholar] [CrossRef]
- Berti, B.G.; Fossati, P.; Tarenghi, G.; Musitelli, C. Enzymatic colorimetric method for the determination of inorganic phosphorus in serum and urine. Clin. Chem. Lab. Med. 1988, 26, 399–404. [Google Scholar] [CrossRef] [PubMed]
- White, T. Monitoring a watershed: Nationwide turbidity testing in Australia. Volunt. Monit. 1994, 6, 22–23. [Google Scholar]
- European Communities. Common Implementation Strategy for the Water Framework Directive (2000/60/EC) Guidance Document 2: Identification of Water Bodies; European Communities: Luxembourg, 2000; Available online: https://circabc.europa.eu/sd/a/655e3e31-3b5d-4053-be19-15bd22b15ba9/Guidance%20No%202%20-%20Identification%20of%20water%20bodies.pdf (accessed on 19 October 2020).
- UN Water. Integrated Monitoring Guide: Step-by-Step Methodology for Monitoring Water Quality (6.3.2) 2018. Available online: http://www.unwater.org/publications/step-step-methodology-monitoring-water-quality-6-3-2/ (accessed on 25 August 2020).
- Lehner, B.; Grill, G. Global river hydrography and network routing: Baseline data and new approaches to study the world’s large river systems. Hydrol. Process. 2013, 27, 2171–2186. [Google Scholar] [CrossRef]
- Warner, S.; Grant, K. Sdg Indicator 6.3.2 Technical Guidance Document NO. 1: Monitoring Programme Design. 2020. Available online: https://communities.unep.org/display/sdg632/Documents+and+Materials (accessed on 5 October 2020).
- Thornhill, I.; Loiselle, S.; Lind, K.; Ophof, D. The citizen science opportunity for researchers and agencies. Bioscience 2016, 66, 720–721. [Google Scholar] [CrossRef] [Green Version]
- Hadj-Hammou, J.; Loiselle, S.; Ophoff, D.; Thornhill, D. Getting the full picture: Assessing the complementarity of citizen science and agency monitoring data. PLoS ONE 2017, 12, e0188507. [Google Scholar] [CrossRef] [PubMed] [Green Version]
- McGoff, E.; Dunn, F.; Cachazo, L.M.; Williams, P.; Biggs, J.; Nicolet, P.; Ewald, N.C. Finding clean water habitats in urban landscapes: Professional researcher vs citizen science approaches. Sci. Total Environ. 2017, 581, 105–116. [Google Scholar] [CrossRef] [PubMed]
- Downing, J.A.; Cole, J.J.; Duarte, C.M.; Middelburg, J.J.; Melack, J.M.; Prairie, Y.T.; Kortelainen, P.; Striegl, R.G.; McDowell, W.H.; Tranvik, L.J. Global abundance and size distribution of streams and rivers. Inland Waters 2012, 2, 229–236. [Google Scholar] [CrossRef]
- Quinlivan, L.; Chapman, D.V.; Sullivan, T. Applying citizen science to monitor for the Sustainable Development Goal Indicator 6.3.2: A review. Environ. Monit. Assess. 2020, 192, 1–11. [Google Scholar] [CrossRef] [PubMed]
- Van Noordwijk, C.G.E.; Bishop, I.J.; Staunton-Lamb, S.; Oldfield, A.; Loiselle, S.; Geoghegan, H.; Ceccaroni, L. Creating positive environmental impact through citizen science. In The Science of Citizen Science; Vohland, K., Land, A., Ceccaroni, L., Lemmens, R., Perello, J., Ponti, M., Samson, R., Wagenknecht, K., Eds.; Springer: Berlin, Germany, 2020; in press. [Google Scholar] [CrossRef]
- Cooper, C. Citizen Science: How Ordinary People Are Changing the Face Of Discovery; Abrams: New York, NY, USA, 2016. [Google Scholar]
- Deutsch, W.G.; Ruiz-Córdova, S.S. Trends, challenges, and responses of a 20-year, volunteer water monitoring program in Alabama. Ecol. Soc. 2015, 20. [Google Scholar] [CrossRef] [Green Version]
- Newman, G.; Chandler, M.; Clyde, M.; McGreavy, B.; Haklay, M.; Ballard, H.; Gray, S.; Scarpino, R.; Hauptfeld, R.; Mellor, D.; et al. Leveraging the power of place in citizen science for effective conservation decision making. Biol. Conserv. 2017, 208, 55–64. [Google Scholar] [CrossRef] [Green Version]
- Muenich, R.L.; Peel, S.; Bowling, L.C.; Haas, M.H.; Turco, R.F.; Frankenberger, J.R.; Chaubey, I. The Wabash sampling blitz: A study on the effectiveness of citizen science. CSTP 2016, 1, 1–15. [Google Scholar] [CrossRef] [Green Version]
- Parker, S.S.; Pauly, G.B.; Moore, J.; Fraga, N.S.; Knapp, J.J.; Principe, Z.; Brown, B.V.; Randall, J.M.; Cohen, B.S.; Wake, T.A. Adapting the bioblitz to meet conservation needs. Conserv. Biol. 2018, 32, 1007–1019. [Google Scholar] [CrossRef] [PubMed] [Green Version]


| Indicator 6.3.2 Methodology Component | Application Note |
|---|---|
| In situ water quality measurements of physico-chemical characteristics | Applied |
| Five core (‘level 1’ parameter groups (nitrogen, phosphorus, salinity, acidity and oxygen), plus optional ‘level 2’ indicators | Data for two core indicators (nitrogen and phosphorus) and one ‘level 2’ indicator were used |
| Surface and groundwaters | Focus on lotic waters, for which most data was available. |
| Water bodies defined as discrete hydrological units such as tributaries or inter-confluence sections of river systems | England—the EA’s water body units that were defined for WFD reporting [16]. Zambia—HydroBASINS Level 09 units [18] |
| Target value concept | Target values were applied consistently to both EA and FWW data based on thresholds of CS test kits used |
| Data over a three-year period | Data from one year (2019) were selected from both datasets |
| Total no. of water bodies | 4092 |
| Total monitored | 2523 (62%) |
| Monitored by Environment Agency (EA) | 2492 (61%) |
| Monitored by FreshWater Watch (FWW) | 140 (3%) |
| Monitored by both EA and FWW | 111 (3%) |
| Monitored by FWW only | 31 (1%) |
| Monitored by EA only | 2381 (58%) |
| No. of Water Bodies Monitored | No. of Water Bodies with 632 Score > 80 (i.e., ‘Good’ Status) | Overall 632 Indicator Score | |
|---|---|---|---|
| EA | 2492 | 835 | 33.51 |
| FWW | 140 | 32 | 22.86 |
| Both datasets combined | 2523 | 833 | 33.02 |
Publisher’s Note: MDPI stays neutral with regard to jurisdictional claims in published maps and institutional affiliations. |
© 2020 by the authors. Licensee MDPI, Basel, Switzerland. This article is an open access article distributed under the terms and conditions of the Creative Commons Attribution (CC BY) license (http://creativecommons.org/licenses/by/4.0/).
Share and Cite
Bishop, I.J.; Warner, S.; van Noordwijk, T.C.G.E.; Nyoni, F.C.; Loiselle, S. Citizen Science Monitoring for Sustainable Development Goal Indicator 6.3.2 in England and Zambia. Sustainability 2020, 12, 10271. https://0-doi-org.brum.beds.ac.uk/10.3390/su122410271
Bishop IJ, Warner S, van Noordwijk TCGE, Nyoni FC, Loiselle S. Citizen Science Monitoring for Sustainable Development Goal Indicator 6.3.2 in England and Zambia. Sustainability. 2020; 12(24):10271. https://0-doi-org.brum.beds.ac.uk/10.3390/su122410271
Chicago/Turabian StyleBishop, Isabel J., Stuart Warner, Toos C. G. E. van Noordwijk, Frank C. Nyoni, and Steven Loiselle. 2020. "Citizen Science Monitoring for Sustainable Development Goal Indicator 6.3.2 in England and Zambia" Sustainability 12, no. 24: 10271. https://0-doi-org.brum.beds.ac.uk/10.3390/su122410271