Review

A Review of Energy Storage Technologies’ Application Potentials in Renewable Energy Sources Grid Integration

by
Henok Ayele Behabtu
1,2,*,
Maarten Messagie
1,
Thierry Coosemans
1,
Maitane Berecibar
1,
Kinde Anlay Fante
2,
Abraham Alem Kebede
1,2 and
Joeri Van Mierlo
1
1
Mobility, Logistics, and Automotive Technology Research Centre, Vrije Universiteit Brussels, Pleinlaan 2, 1050 Brussels, Belgium
2
Faculty of Electrical and Computer Engineering, Jimma Institute of Technology, Jimma University, Jimma P.O. Box 378, Ethiopia
*
Author to whom correspondence should be addressed.
Sustainability 2020, 12(24), 10511; https://0-doi-org.brum.beds.ac.uk/10.3390/su122410511
Submission received: 12 November 2020 / Revised: 11 December 2020 / Accepted: 11 December 2020 / Published: 15 December 2020
(This article belongs to the Special Issue Renewable Energy Sources and Sustainability)

Abstract

:
Renewable energy sources (RESs) such as wind and solar are frequently hit by fluctuations due to, for example, insufficient wind or sunshine. Energy storage technologies (ESTs) mitigate the problem by storing excess energy generated and then making it accessible on demand. While there are various EST studies, the literature remains isolated and dated. The comparison of the characteristics of ESTs and their potential applications is also short. This paper fills this gap. Using selected criteria, it identifies key ESTs and provides an updated review of the literature on ESTs and their application potential to the renewable energy sector. The critical review shows a high potential application for Li-ion batteries and most fit to mitigate the fluctuation of RESs in utility grid integration sector. However, for Li-ion batteries to be fully adopted in the RESs utility grid integration, their cost needs to be reduced.

1. Introduction

Nowadays, renewable energy generation capacity is growing at a rapid rate globally. Data from the International Renewable Energy Agency (IRENA) showed that, at the end of 2019, global RESs generation capacity amounted to 2537 GW. Hydropower accounted for the largest share of the global total, with a capacity of 1190 GW (excluding pure pumped storage); this is followed by wind energy (623 GW), solar energy (586 GW), bioenergy (124 GW), geothermal energy (14 GW), and marine energy (500 MW) [1]. Among renewable energy sources’ (RESs’) generation capacity, wind and solar energy continued to dominate renewable capacity addition in 2019 [1]. However, energy supply from such sources is often hit by fluctuations due to, for example, insufficient wind or sunshine. It is, therefore, necessary to maintain the power fluctuation of a power system integrated with a large amount of RESs such as wind and solar. Energy storage is a crucial means that mitigates such increased fluctuations or power quality problems by providing voltage support, smoothing their output fluctuations, balancing the power flow in the network, and matching supply and demand. Additionally, ESTs are offering ancillary grid services like frequency control, energy time-shifting, power quality improvement, load leveling, peak shaving, facilitation of RESs grid integration, network expansion, and overall cost reduction and operating reserves [2,3,4,5]. Moreover, with the increase of the production of power or energy from RESs, it becomes much important to look at methods or techniques of selecting the appropriate type of ESTs for RESs grid integration application. Hence, the relationship between ESTs and its application is interdependent; a knowledge of the technical characteristics of each ESTs as well as their application potential in RESs are very important toward technology adoption. Furthermore, industry and engineering are producing a variety of ESTs, but the breadth and depth of these technologies are coherently reviewed and synthesized. Our key research questions are, therefore, what are the major ESTs and how can their technical, economic, and environmental fit be evaluated? This paper addresses central questions and provides to date review for researchers, industry, and policymakers on technical, economic, and environmental characteristics of ESTs for RESs utility grid integration application.
The paper is organized as follows: Section 2 provides the methodology of the paper, i.e., it shows how the key literature and ESTs were selected and reviewed. Section 3 reviews three different types of ESTs such as mechanical, electrical, and electrochemical energy storage systems as applicable to RESs. Additionally, within the section, advantages, disadvantages, and some possible application potential of the selected ESTs for RESs grid integration are highlighted. In Section 4, the most relevant selection criteria for ESTs such as technical, economic, and environmental are compared and analyzed graphically. In Section 5, the overall discussion about the application potential of ESTs for RESs grid integration based on the result found in section four is presented. Finally, Section 6 offers the conclusion of the paper.

2. Methodology of Reviewing Literature and Selecting ESTs

Presently, the installed capacity of energy storage is continuing to increase globally at an exponential rate. According to statistics from the China Energy Storage Alliance (CNESA) global operational energy project database 2020.Q1, by the end of March 2020, global operation energy storage project capacity totaled 184.7 GW, a growth of 1.9% in comparison to 2019 [6]. As can be observed from Figure 1, a pumped hydro storage system accounts for 92.6% (171.03 GW) of all currently installed forms of ESTs, then electrochemical ESTs 5.2% (9.6 GW). Among electrochemical ESTs, lithium-ion batteries made up the largest installed capacity of 89% (8.5 GW).
There are several features and characteristics of the energy storage system required to be considered for selecting appropriate ESTs for different applications. According to [7,8] studies, ESTs used for grid applications have been classed into three categories, short, medium, and long, based on their storage duration (discharge time). The main difference between the storage duration category depends on EST application requirements (see Table 1). According to [7,9,10] studies, the typical power rating and storage duration for short duration categories are less than 1 MW and 1 min, respectively.
The medium duration categories are in the range of 10–100 MW and minutes to hours, respectively. The long duration category spans hours to days. The typical power range of this category is above 300 MW. Table 1 shows a summary of the possible application potential of ESTs, based on storage duration and power rating. Each of these applications has its specific requirements on the ESTs; some of the applications require high power and long storage duration, while other applications require the opposite. Therefore, understanding the technical characteristics of each ESTs and their application requirements are very important before adopting the technology. Generally, ESTs can be broadly categorized in terms of their functions and forms of energy stored [11,12,13,14,15]. However, the most extensively used method for categorizing ESTs is based on their form of energy stored (see Figure 2). Thus, based on their forms of energy stored, ESTs can be categorized into five major categories, i.e., mechanical, electrical, electrochemical, chemical, and thermal energy storage system [5,11]. Among different ESTs; pumped hydro storage (PHS), compressed air energy storage (CAES), flywheel energy storage (FES), supercapacitor energy storage (SCES), superconducting magnetic energy storage (SMES), electrochemical energy storage including, lead-acid (Pb-A), nickel-cadmium (Ni-Cd), sodium-sulfur (Na-S), sodium nickel chloride (NaNiCl2), lithium-ion (Li-ion), and flow battery energy storage (FBES) were selected based on the availability of technical characteristics data of energy and power density, lifetime, cost, efficiency, technology maturity, response time, self-discharge time, power rating, discharge time, and environmental impacts.
Due to a wide range of applications of ESTs, in the literature, many authors have reviewed ESTs advantages and disadvantages, classifications, and application potentials from different perspectives. In [2], investigate the role of ESTs in distribution networks, optimal energy storage systems, sizing, and operation. A group of different technical characteristics of ESTs is presented, which can help with selecting the most suited ESTs for some applications. The authors of [11] discuss the role of ESTs for various power system operations based on their technical characteristics. The authors of [12] review and compare the role of ESTs in the renewable energy sector. The review is focused on some selected ESTs such as PH, CAES, and battery energy storage. The authors of [13] review the application potential of ESTs for stationary applications. Comparison among some selected ESTs in terms of their technical characteristics and applications are covered. In [9], review and compare four categories of ESTs such as mechanical, chemical, electromagnetic, and thermal energy storage based on their technical characteristics.
In [16] review the role of ESTs for wind power grid integration application and a detailed description of ESTs with their main characteristics is presented. The authors of [17] review the role of various ESTs for wind power support. The review more focus on a planning issue, the operation, and control strategies of ESTs application for wind power support [18]. Propose an innovative ESTs selection criteria ranking framework techniques for hybrid renewable energy systems for off-grid application. The authors of [19] review EST types, categorizations, comparisons, applications, and their recent developments. The authors of [20] conduct performance investigation techniques on some selected ESTs such as mechanical, electrochemical, chemical, and electromagnetic energy storage systems. The authors of [21] provides a multi-criteria decision support framework for RESs selection. The authors of [22] reviews the techno-economic and environmental assessments for some selected ESTs. The authors of [23] presents an integrated tool to mitigate power quality problems in a microgrid which consists of RESs, conventional distributed energy sources, energy storage, electric vehicles, and linear and nonlinear loads through coordinating the operating schedule of its generating resources and loads. The authors of [24] proposes a local market design for physical storage rights. The authors of [25] proposes the techno-economic optimization and performance analysis for solar energy grid integrated system.
This review paperwork is different from other literature work reviewed before in the following way. A literature review is conducted to understand better the advantage and disadvantages of ESTs, and their potential applications in RESs grid integration applications sector. Even though there are various ESTs already reviewed in the literature, there is limited information and updated data on characteristics of ESTs and their application potential for RESs grid integration. There is also a lack of evaluating ESTs with the help of graphic comparison from a complete selection criteria perspective such as technical, environmental, and economic. Therefore, this review paper aims to address this gap by evaluating the application potential of ESTs for RESs utility grid integration based on up-to-date selected criteria such as energy and power density, lifetime, cost, efficiency, technology maturity, response time, self-discharge time, power rating, discharge time, and environmental impacts. Relevant literature data related to technical characteristics of ESTs have been collected from Scopus, ScienceDirect, and IEEE Xplore databases.
The procedures followed to select the most suited ESTs for RESs utility grid integration is as follows:
  • Up-to-date technical details and characteristics data for all selected ESTs have been collected from several peer-reviewed journal papers.
  • To evaluate the application potential of ESTs for RESs utility grid integration clearly, all selected characteristics of ESTs are graphically compared and analyzed.
  • Using graphic comparison results, the application potential of ESTs categorizations has been decided by comparing with Table 1, by considering the common characteristics of ESTs and their application area requirements.
The characteristics of the selected ESTs shown in Figure 3, Figure 4, Figure 5, Figure 6, Figure 7, Figure 8, Figure 9, Figure 10 and Figure 11 will facilitate the selection of the most suited ESTs for RESs utility grid integration. The graphic comparison was done using Microsoft Excel.

3. Overview of Energy Storage Technologies

There are various ESTs available for storing energy for RESs applications, including those based on mechanical, electrical, and electrochemical processes. Above all, the main services that the storage must provide will determine the best-adapted technology. All ESTs have their advantages and disadvantages, therefore which are the most appropriate in different circumstances and able to be adopted for RESs grid integration is the focus of this study. Following subsections cover, a review of the advantages, disadvantages, and application potential of all selected ESTs such as mechanical, electrical, and electromechanical energy storage system for RESs utility grid integration are briefly reviewed. The detailed technical characteristics data for all selected ESTs are presented in Section 4.

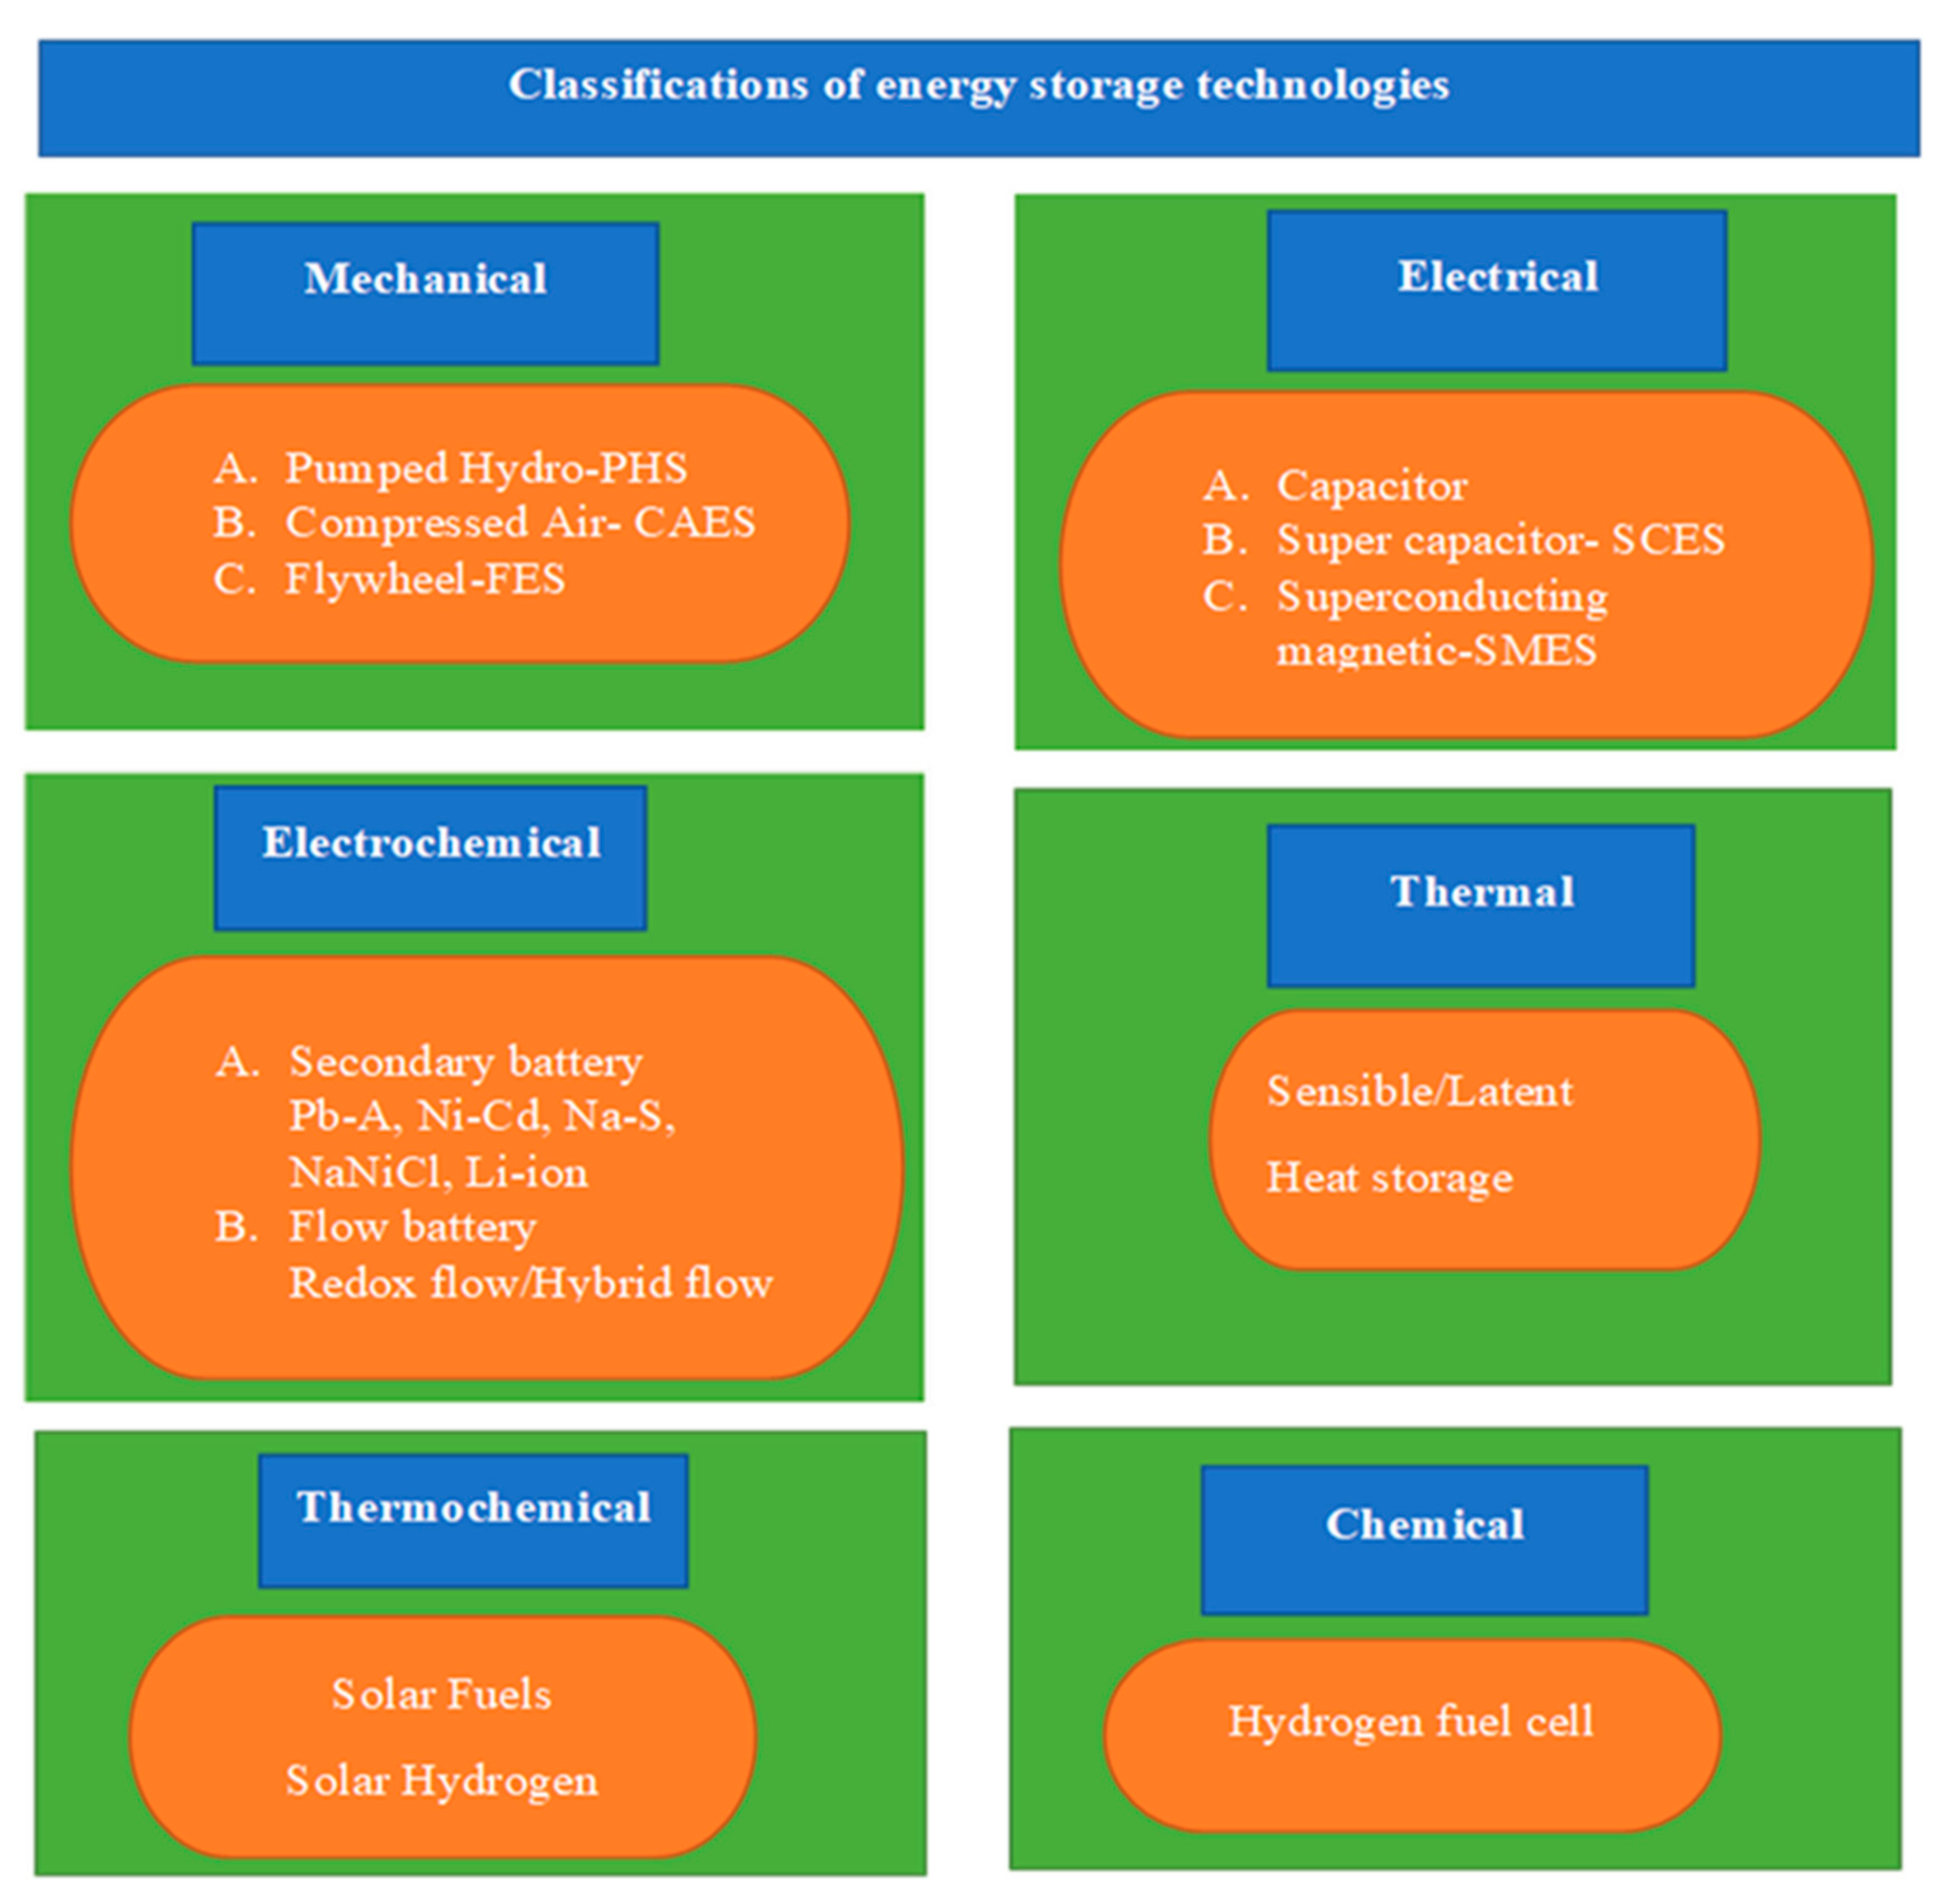
3.1. Mechanical Energy Storage

Mechanical energy storage systems are stored energy as potential energy in PHS and CAES, and as rotational kinetic energy in FES. Among the mechanical energy storage system, the PHS system is the most dominant and widely implemented energy storage system in the world; it accounts for around 92.6%(171.03 GW) of all currently deployed forms of energy storage [6]. PHS is a matured technology with large volume, long discharge duration, high efficiency, long life, relatively low capital cost per unit of energy (see Table 2, Table 3 and Table 4), highly reliable, flexible, low operation, and maintenance cost. Additionally, the rating of PHS is the highest all over the available ESTs (10–5000 MW); hence, it is generally applied for energy management. The PHS system has also application potential in RESs such as for wind power grid integration. On the other hand, since the PHS system has a slow response time, it is not appropriate for suppressing wind fluctuations [17]. The major limitations of PHS system are its dependence on topographical conditions and large land use, long development time, and long payback periods [13,30].
CAES is one of the largest energy storage systems [5–300 MW] next to the PHS systems [13]. It has a rapid start-up time, long discharge duration, low capital costs, and moderate efficiency (see Table 2, Table 3 and Table 4). The major limitations to the implementation of CAES system are its dependence on favorable geography [13], fossil fuel combustion, and CO2 emission problem during operation conditions [31]. CAES system has application potential in renewable energy such as in wind energy for energy management purposes, due to the high power and energy capacity rating of the storage [17].
FES systems have low maintenance, no carbon emission, no toxic components, high cycle life, very fast response, high cycle efficiency (90–95%), very short discharge duration, and high power density [3,11,32,33]. However, FES suffers from idling losses when the FES is on standby. This can lead to a relatively high self-discharge rate (up to ~20% of stored capacity per hour) [11,31]. In addition to this, FES have low storage capacity and high cost [3]. The most common FES application areas are power quality improvement of grid systems such as frequency and voltage regulation, uninterruptible power supply (UPS), transportation, spacecraft, military, and grid-integration of RESs such as for suppressing fast wind power fluctuation [17,32].

3.2. Electrical Energy Storage

Electrical energy storage systems are stored energy in the same way, like electrical energy and it consists of mainly two types of energy storage: SCES and SMES. Among electrical energy storage systems, SCES has long lifetime, high cycle efficiency, high power density, a very fast response time (see Table 2, Table 3 and Table 4), adaptability for diverse environments, and is unaffected by the depth of discharge (DoD) and independent of maintenance [11,14,34,35]. However, the daily self-discharge rate of SCES is high (~5–40%), and the capital cost is also high. Furthermore, SCES has a very short discharge duration and low energy density [34]. Thus, SCES is well suited for short-term storage applications. Moreover, the typical applications of SCES systems are for pulse power, bridging power to equipment, UPS devices, grid-integration of RESs [11,35]. Additionally, SCES can also mitigate fast wind power fluctuations for a short time duration [36].
SMES system has fast response time, very short discharge time, very high efficiency, its cycle life is not affected by the DoD, and a long lifetime [2,7,33,37]. However, SMES units have high capital costs, complicated cooling systems, high daily self-discharge rates (10–15%), and a negative environmental impact due to the strong magnetic field (see Table 2, Table 3 and Table 4). Due to its fast response time, and short discharge duration, SMES is more suitable for short-term applications, such as power quality problems for large industrial customers and microgrids and intermittent renewable energy mitigation [8,37].

3.3. Electrochemical Energy Storage

Electrochemical ESTs are the second-highest globally installed energy storage capacity of 9.6 GW [6] (see Figure 1). Among electromechanical ESTs, Li-ion batteries are the most widely installed capacity of 8.5 GW [6]. In this section, a review of the characteristics and application potential of various types of battery energy storage system (BESS) used for grid-scale energy storage, such as Pb-A, Ni-Cd, Na-S, NaNiCl2, Li-ion, and FBES are reviewed.
Pb-A is the oldest, cheapest, well developed, and widely used rechargeable electrochemical energy storage device. The major features of Pb-A batteries include being low cost and simple to manufacture, high reliability, high efficiency, low self-discharge rate, fast response time, easy recyclability, high specific power, and no block-wise or cell-wise battery management system required [13,14,35,38]. Pb-A is a popular choice of energy storage as a backup power supply in a range of kW to tens of MWs for power quality, UPS, data and telecommunication system applications, grid utility application, renewable energy output smoothening, and hybrid electric vehicles application [13,14]. However, its application for energy management has been very limited due to its short cycle life, low energy density, poor performance at low temperature, high maintenance requirement, and environmental impact [13,38,39].
Ni-Cd batteries have high efficiency, unaffected by DoD, very low maintenance requirements, small self-discharge rate (10% per month), and operate over a wide range of temperatures (−40 to 50 ℃) [13,14,35,40]. The major limitation of Ni-Cd battery is its impact on the environment and memory effect problem [11,35]. Currently, Ni-Cd batteries are used for power tools, portable devices, emergency lighting, UPS, telecoms, and generator starting application purposes. However, Ni-Cd batteries are not implemented in large scale power system applications yet, due to its high cost and memory effect problem [13].
Na-S batteries have a long lifetime, high energy densities, fast response, high recyclability, and high pulse power capability [14,35]. In addition to this, Na-S has a power range from several kW to a few MW and an energy range from 100 kWh or higher [41]. The most common application of Na-S battery is for high-power energy management such as the smoothing output power of wind farms, load leveling, and peak shaving [14,35,42]. However, the major limitations of Na-S batteries are their high initial capital cost, high-temperature requirements for operations, and high self-discharge per day [13,35,39].
NaNiCl2 batteries have higher cell voltage (2.58) compared to Na-S batteries [13,35], higher temperature range (270–350 ℃), longer life, higher storage capacity, and are fully recyclable [43,44]. NaNiCl2 batteries have application potential in RESs such as for smoothing the intermittent RESs in distribution grid integration, peak shaving, and time-shifting [42,43]. However, NaNiCl2 batteries have low energy density compare to Na-S batteries and safety issues due to molten sodium [13,35,44].
Li-ion batteries have a low percentage of self-discharge rate not exceeding 8% per month, high energy-to-weight ratios, high cycle life, high cycle efficiencies, a rapid response time (in milliseconds), and low environmental impact [11,13,14,42]. In addition to this, Li-ion batteries have a high power range (1 KW to 100 MW) and energy above 200 MWh [41]. These characteristics make Li-ion batteries good candidates for application where the fast response time, high power and energy density, high cycle efficiency, and lightweight are needed, such as in the renewable energy sector, plug-in hybrid electric vehicle (PHEV), and electrical vehicle (EV) applications. However, the price of a Li-ion battery is high compared to other rechargeable batteries [45,46].
FBES batteries have high response time, very low self-discharge rate, long discharge duration, high efficiency (see Table 2, Table 3 and Table 4), room temperature operation, low maintenance, and no harmful emission [14,35]. However, FBES have a low energy density and high manufacturing costs compared to other rechargeable batteries [11]. Currently, some types of FBES like vanadium redox flow battery (VRFB), zinc-bromine flow battery (ZBFB), and polysulfide bromide flow battery (PBFB), have been used or can potentially be used for RESs grid integration as well as for utility grids, such as for load balancing and standby power application [11,44].

4. Overall Comparison of Energy Storage Technologies

In this section, overall ESTs are compared and analyzed from technical, economic, and environmental criteria perspectives. Similar comparisons have been reviewed in [2,11,12,13,14,43,44,45]. Thus, in this section, the purpose of analyzing and comparing all selected ESTs is to offer an updated comparison for all selected ESTs. Additionally, to evaluate the potential applications of ESTs for RESs grid integration application clearly, all selected criteria of ESTs are graphically compared and analyzed in detail.

4.1. Technical Criteria

To evaluate the technical performance of all selected ESTs, the most relevant technical characteristics such as power range, energy density, power density, efficiency, discharge time, response time, lifetime, self-discharge, and technology maturity level are selected based on the availability of data in the works of literature. Technical characteristics for all selected ESTs are summarized in Table 2 and Table 3. Following subsections, all selected technical characteristics of ESTs are compared and analyzed graphically based on the average numeric values of Table 2 and Table 3.

4.1.1. Energy and Power Density of ESTs Comparison Result

As shown in Figure 3, compared to all selected ESTs, electrochemical energy storage systems (Pb-A, Ni-Cd, Na-S, NaNiCl2 & Li-ion) have higher energy density than others. On the other hand, the power density of FES, SMES, and SCES is higher than other types of ESTs. Among electrochemical energy storage, Li-ion, Na-S, and NaNiCl2 have higher energy density than other selected rechargeable batteries.

4.1.2. Power Rating and Discharge Time of ESTs Comparison Result

The power ratings and discharge time (E/P) of various ESTs are compared in Figure 4 using the bubble chart. As shown in Figure 4, among all selected ESTs, PHS, and CAES have a higher power range and longer discharge time than others. On the contrary, SMES, FES, and SCES have a low power range and a very short discharge time.

4.1.3. Self-Discharge Time of ESTs Comparison Result

Figure 5 illustrates the self-discharge (energy dissipation) per day for all selected ESTs.
PHS, CAES, and VRFB have a very small (almost negligible) daily self-discharge ratio compared to other types of ESTs. Among the electrochemical energy storage system, Na-S and NaNiCl2 have a high self-discharge rate per day. Similarly, the electrical energy storage system, SMES and SCES have a high self-discharge rate per day.

4.1.4. Lifetime of ESTs Comparison Result

Figure 6 shows a comparison of life span in years for all selected ESTs. Compare to all selected ESTs, PHS has the largest life span of 50 years, while electrochemical energy storage systems fall within the range of 7.5–15 years.

4.1.5. Technological Maturity of ESTs Comparison Result

Figure 7 shows a comparison of the technological maturity level for all selected ESTs. Since the data collected for the technological maturity level are a qualitative evaluation criterion, a rating scale (1–9) is implemented to score ESTs based on their level of technology maturity. Such a method of scoring criteria is conducted by following the same method that has been scoring of qualitative criteria in [9]. As shown in Figure 7, PHS, Pb-A, and Ni-Cd batteries are the most matured and fully commercialized ESTs compared to others. On the other hand, CAES, Na-S, NaNiCl2, Li-ion, VRFB, SMES, SCES, and FES are proven and commercializing technologies.

4.1.6. Round-Trip Efficiency of ESTs Comparison Result

As shown in Figure 8, FES, SMES, SCES, and Li-ion batteries have a very high cycle efficiency of above 90%, which are the top amongst ESTs. Similarly, PHS, CAES, electrochemical energy storage systems (except for Li-ion) have a cycle efficiency in a range of 74.5–90%.

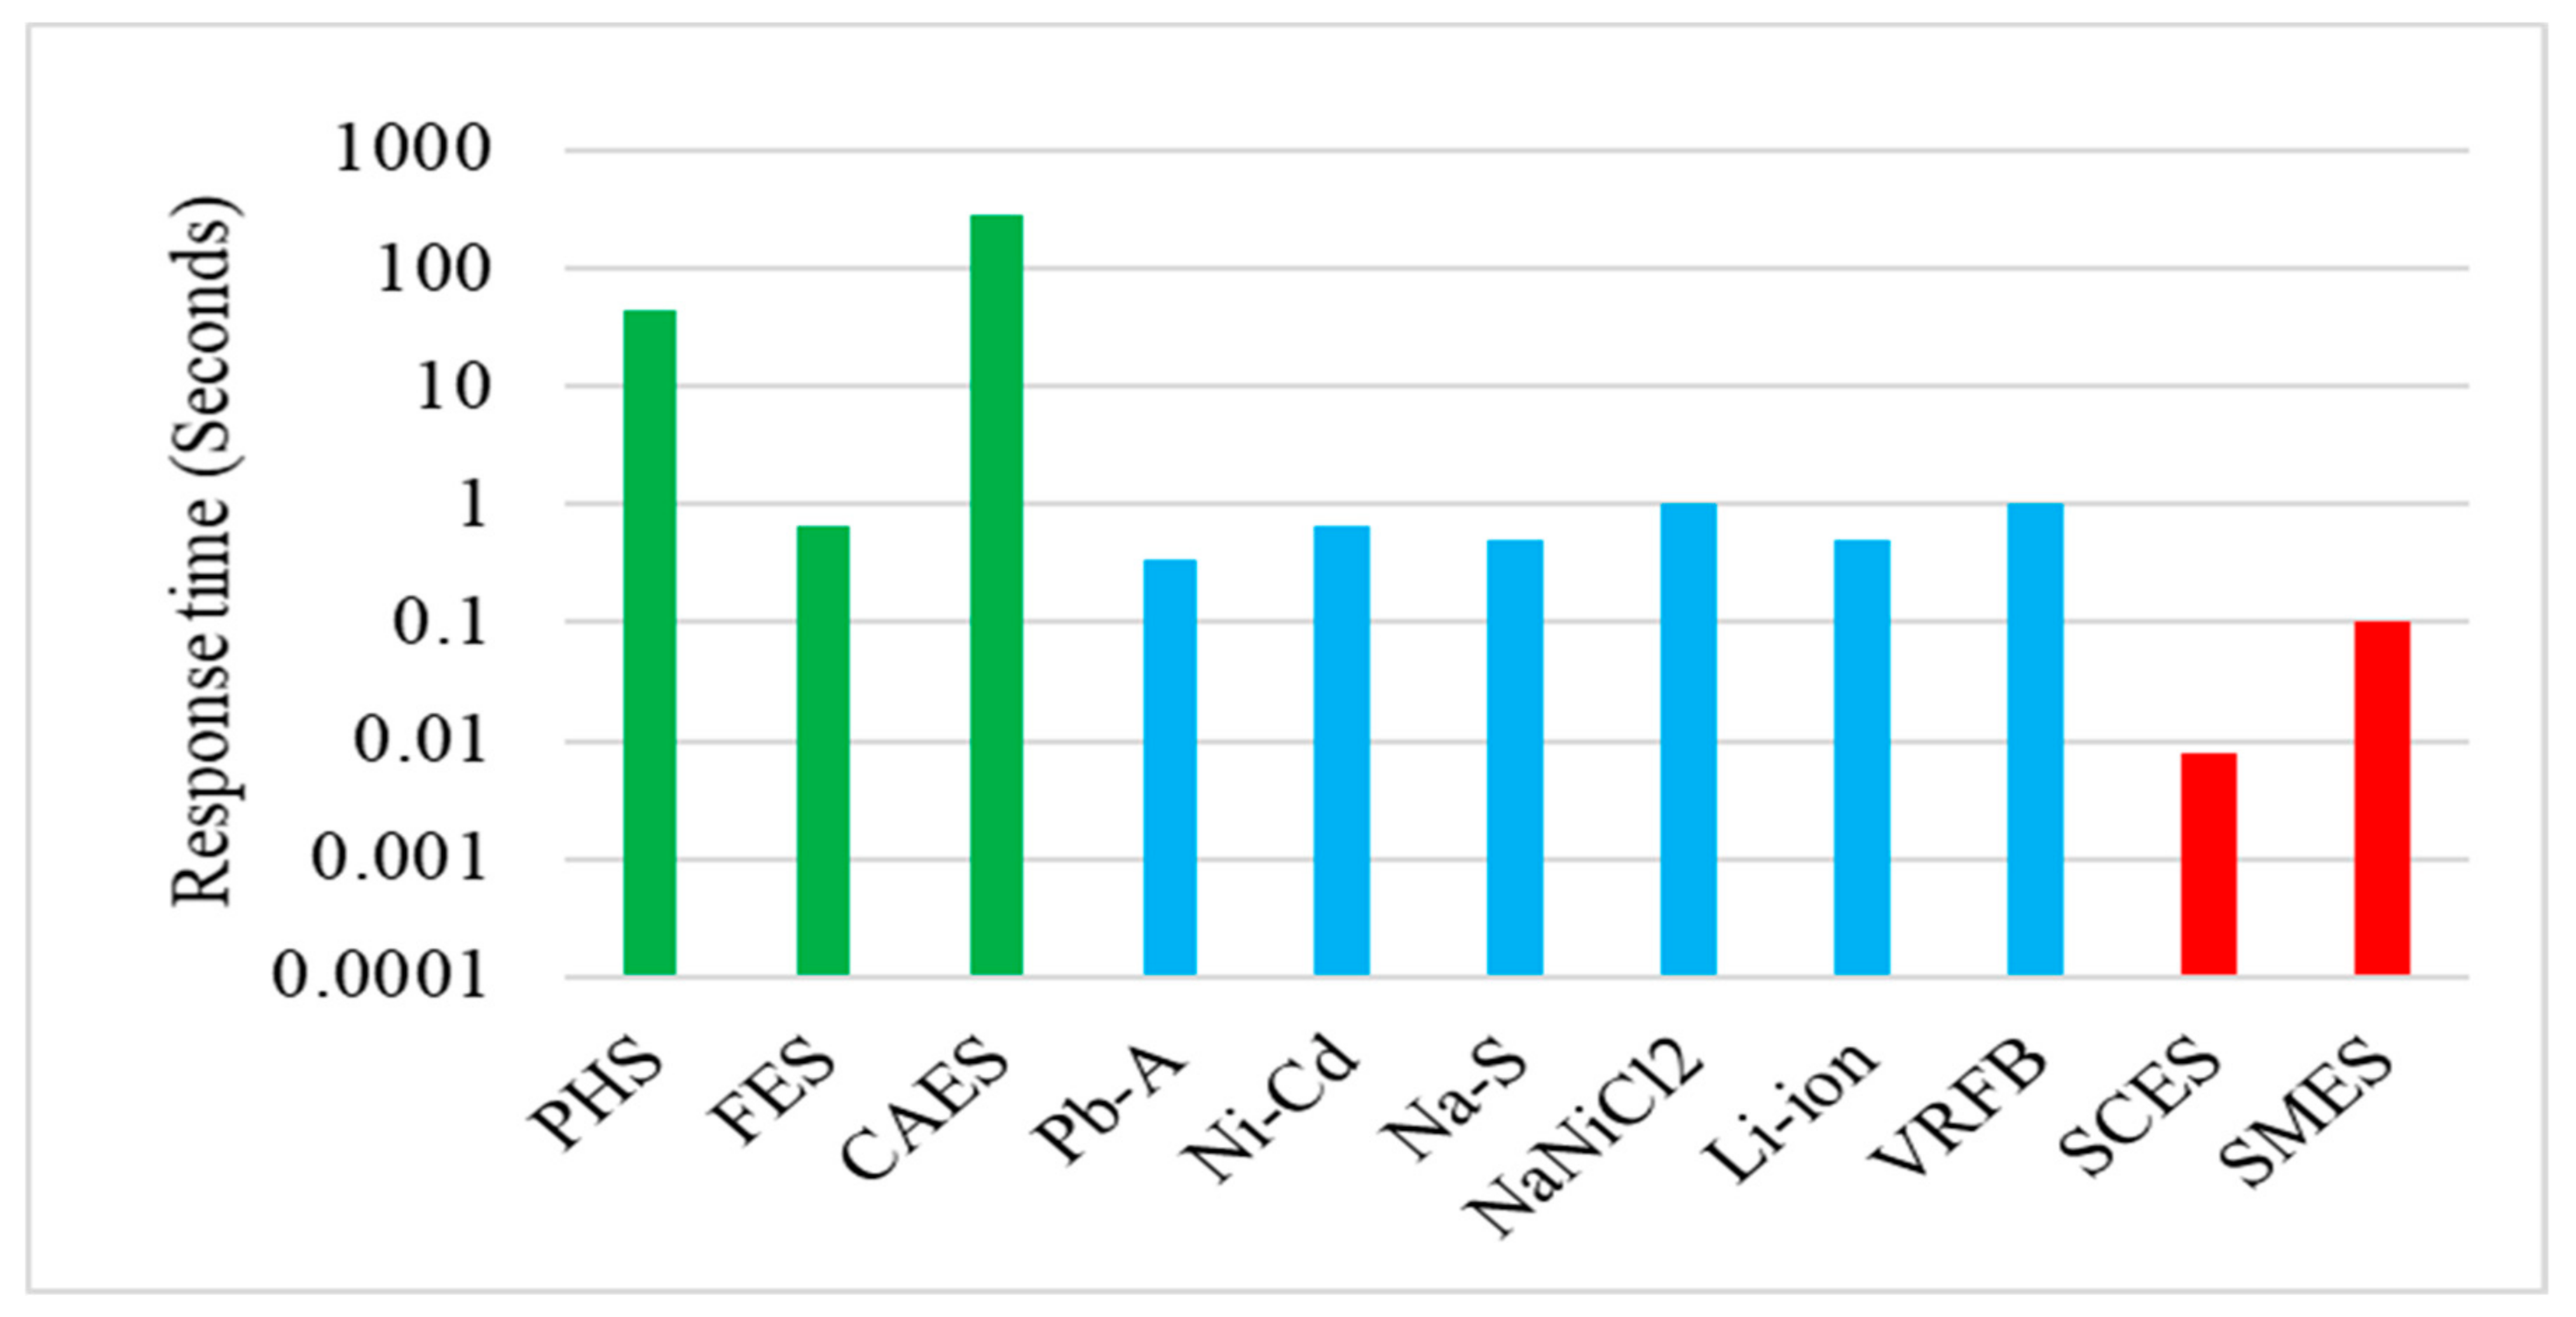
4.1.7. Response Time of ESTs Comparison Result

As shown in Figure 9, FES, SMES, and SCES offer very fast response time in milliseconds, electrochemical energy storage system response time in seconds, PHS and CAES in minutes.

4.2. Economics Criteria

Capital and Operating Costs of ESTs Comparison Result

Estimated capital costs and environmental impacts for all selected ESTs are summarized in Table 4. As shown in Figure 10, the capital cost per kWh of PHS and CAES are in the low range category compared to other types of ESTs. On the other hand, FES, SMES, and SCES have a higher capital cost per kWh. CAES has the lowest energy capital costs compared to all other technologies. Among electrochemical energy storage; Ni-Cd, Li-ion, and Na-S have a higher capital cost per kWh than other rechargeable batteries.

4.3. Environmental Criteria

Impact on Environment of ESTs Comparison Result

The impacts of all selected ESTs on the environment are shown in Figure 11. Since the data collected for the environmental impacts of ESTs is a qualitative type criterion, a rating scale from (1–8) is introduced to quantify this criterion by following the same methods that have been scoring of qualitative criteria in [9]. Thus, PHS, CAES, electrochemical energy storage systems, and SMES have a high negative impact on the environment, whereas FES and SCES have very low impacts on the environment.

5. Discussion

In this paperwork, an up to date review of current ESTs and their application potential in renewable energy sectors has been reviewed. Among different ESTs: PHS, CAES, FES, SCES, SMES, Pb-A, Ni-Cd, Na-S, NaNiCl2, Li-ion, and FBES has been selected based on the availability of their characteristics data in works of literature. The review included the advantages, disadvantages, and some possible application potential of the selected ESTs for RESs utility grid integration. In addition to this, the typical application categorizations of ESTs based on their selection criteria such as technical characteristics, economic and environmental impacts of ESTs have been evaluated. Thus, to evaluate the application potential of ESTs for RESs grid integration clearly, all selected criteria of ESTs are graphically compared and analyzed. The comparison results of the study show that:
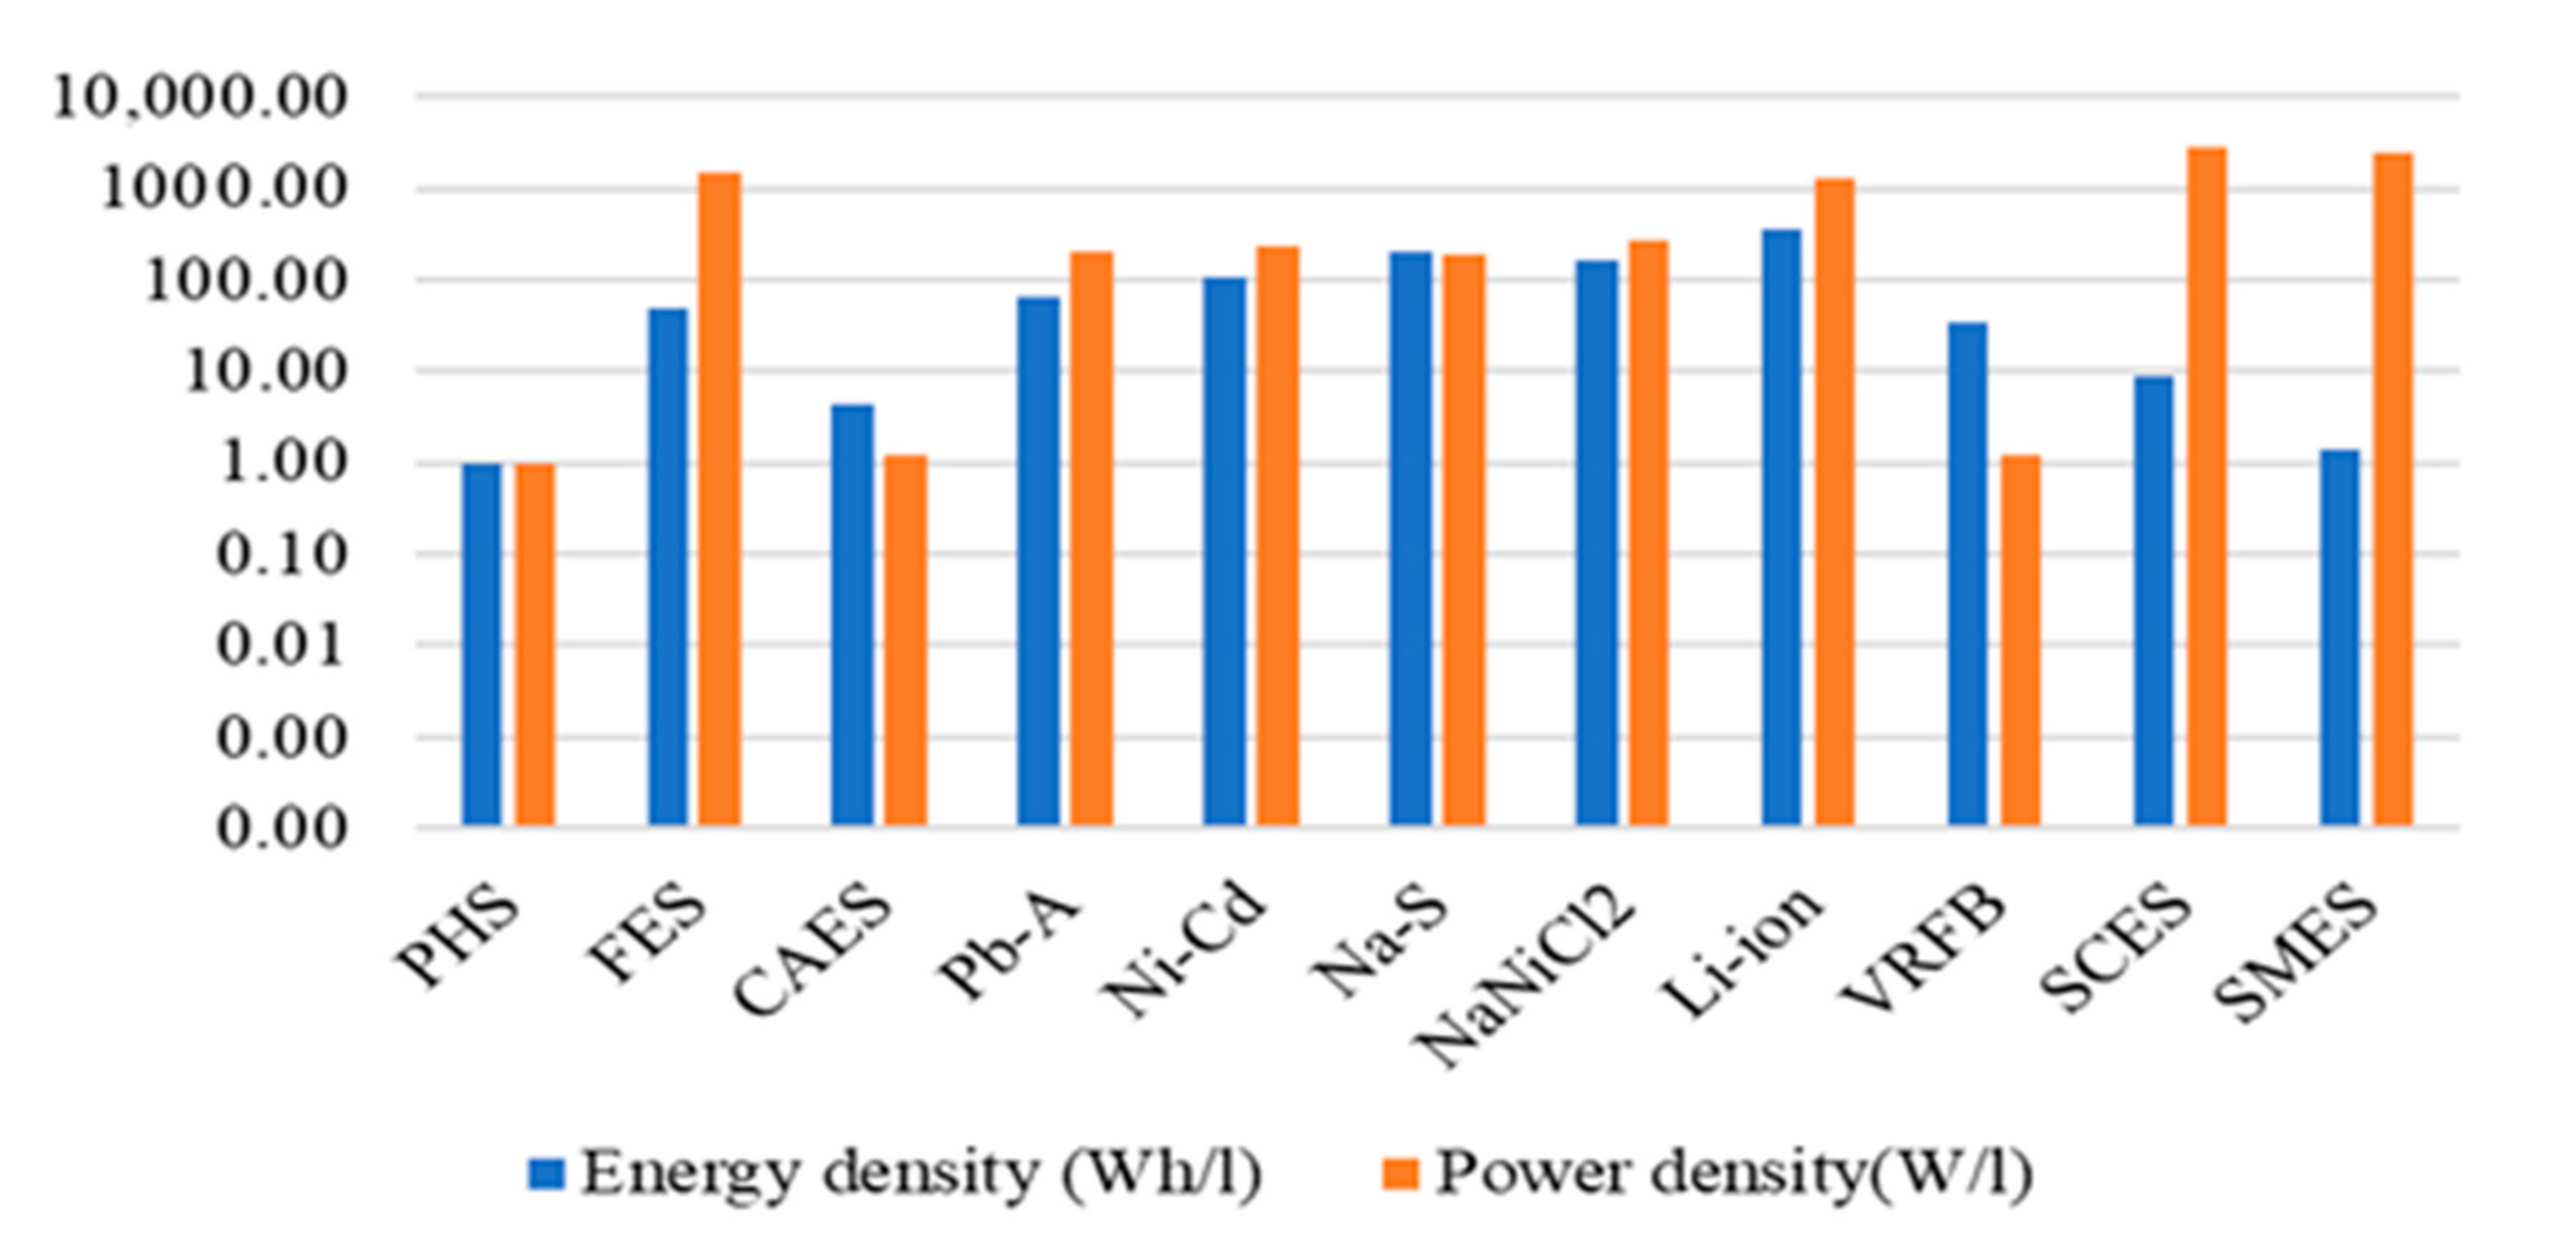
  • Electrochemical energy storage systems have higher energy density than others: As shown in Figure 3, compared to all selected ESTs, electrochemical energy storage systems (Pb-A, Ni-Cd, Na-S, NaNiCl2, and Li-ion) have higher energy density than others, which allows them to provide more energy over a long duration. Among the electrochemical energy storage system, Li-ion battery has both a higher energy density (350 Wh/l) and power density (1250 W/l), which makes it lighter in weight and smaller in size than other rechargeable batteries. In contrast, the power density of SCES (2750 W/l), SMES (2500 W/l), and FES (1500 W/l) are higher than other types of ESTs, which allows them to provide more power over a short duration. Such types of ESTs are very important in the renewable energy generation sector such as for power fluctuation mitigation application.
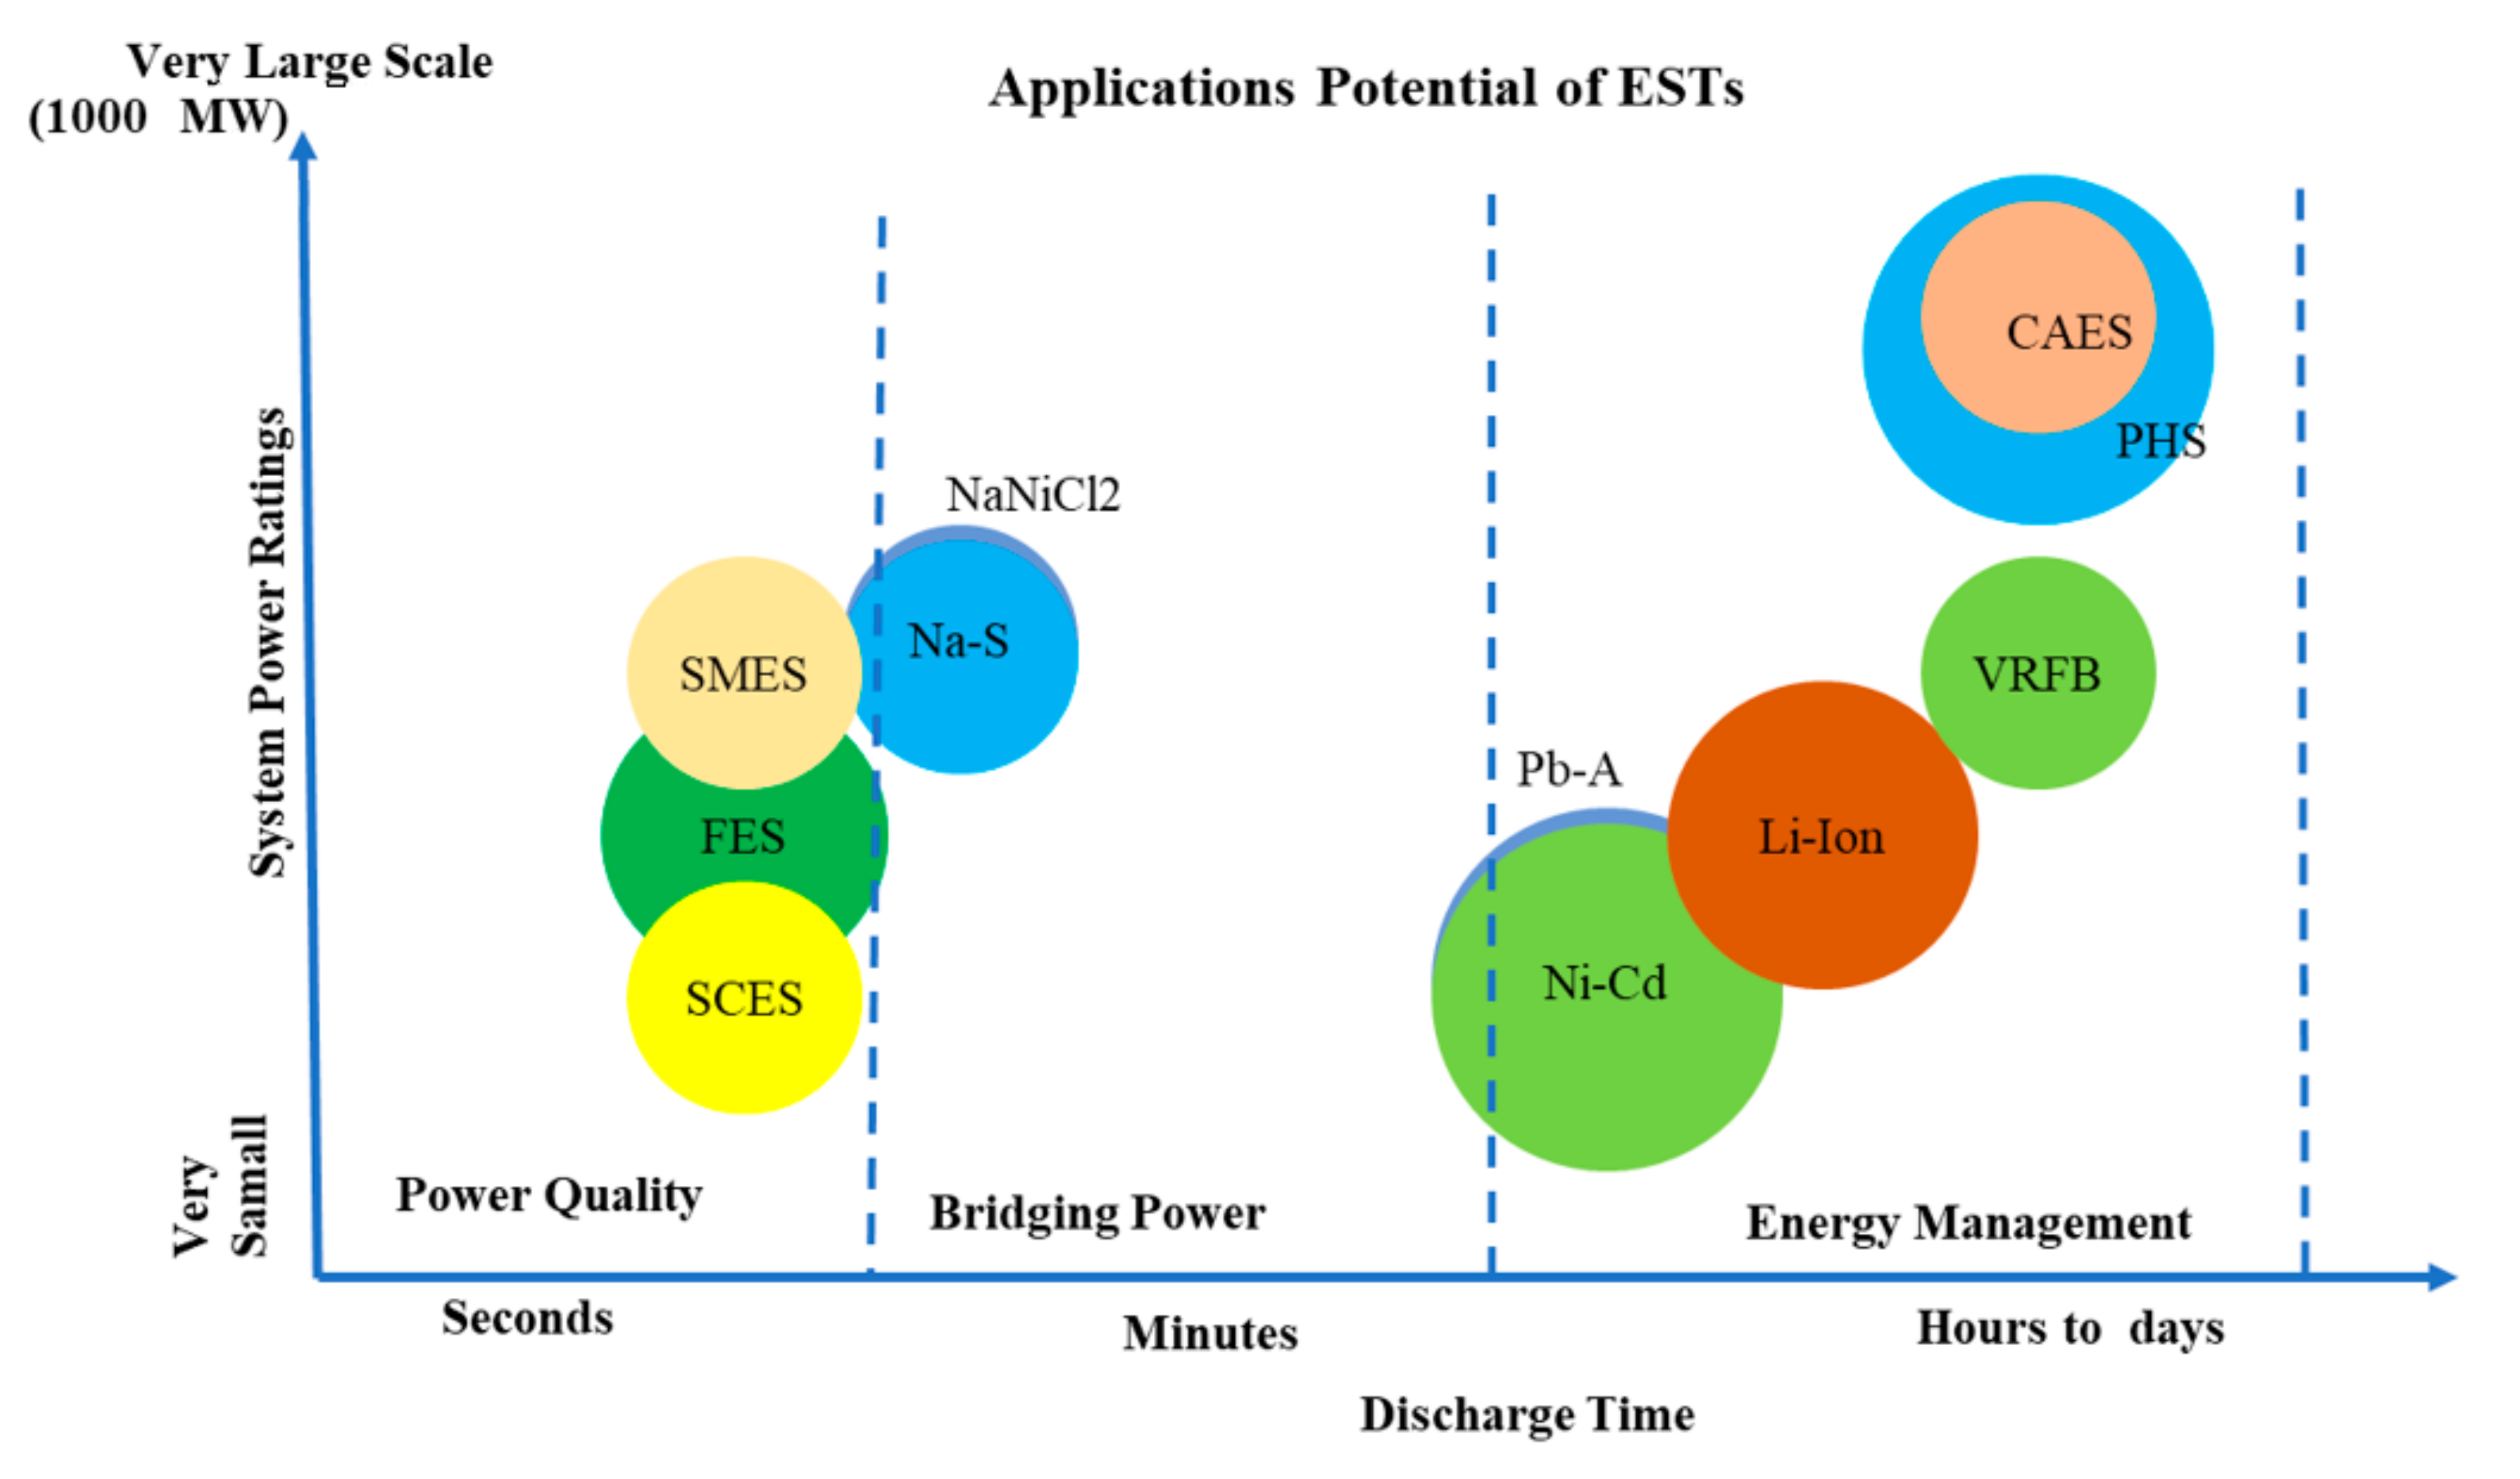
  • PHS and CAES have a higher power range and longer discharge time than others: As indicated in Figure 4 and Table 1, the storage mediums with large discharge time and very high power range, such as PHS and CAES are more suitable for energy management for large scale application. The typical power rating and discharge time duration for this kind of application is above 300 MW and hourly to days duration respectively. In addition to this, large-scale batteries such as Pb-A, Ni-Cd, Li-ion, and VRFB are more suitable for medium-scale energy management (bridging power) applications. Similarly, the typical power rating and discharge time duration for this kind of application is 10–100 MW and minute to hours duration, respectively. Moreover, ESTs with short discharge time (seconds) such as SMES, FES, and SCES are more suitable for power quality and regulation application.
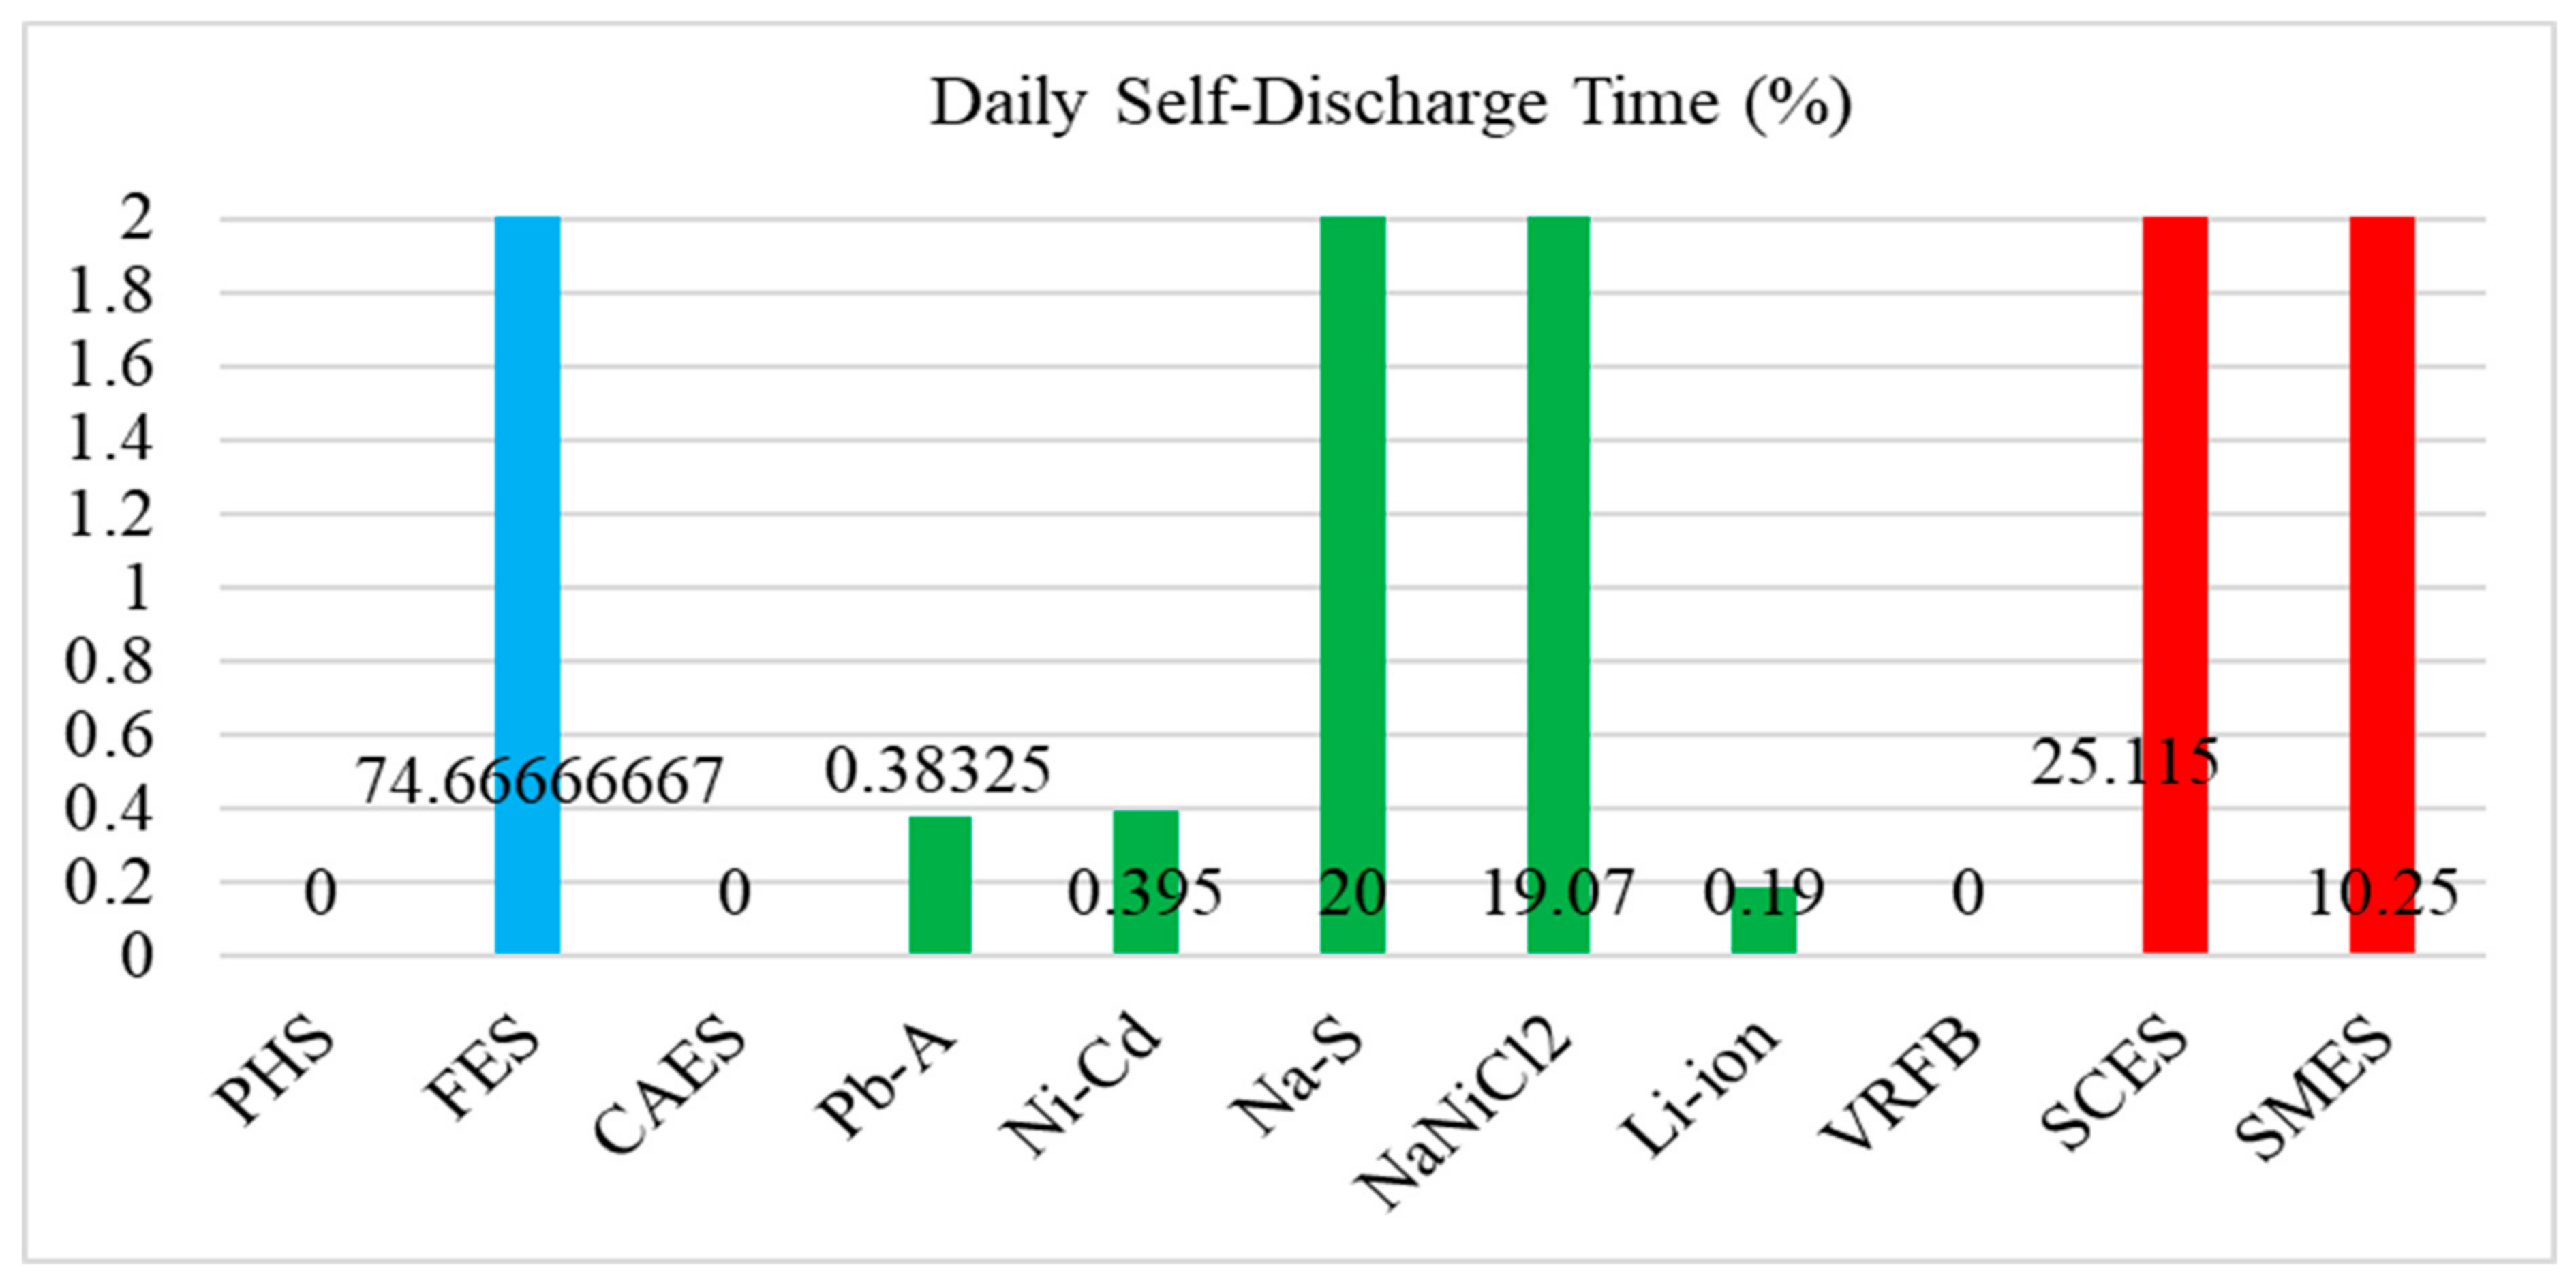
  • PHS, CAES, and VRFB have a very small (negligible) daily self-discharge time than others: As illustrated in Figure 5, PHS, CAES, and VRFB have a very small (almost negligible) daily self-discharge ratio compare to other types of ESTs. Therefore, such types of energy storage systems are more suitable for long storage duration applications such as energy management applications. Among the electrochemical energy storage system, Na-S and NaNiCl2 have the highest self-discharge rate of 20% and 19.07% per day, respectively. Moreover, compared to all selected ESTs, FES has the highest self-discharge rate of 74.67% per day. Similarly, SMES and SCES also have the highest self-discharge rate of 10.25% and 25.115% per day, respectively. Thus, such types of energy storage systems are more suitable for short time duration application (power quality and regulation) applications.
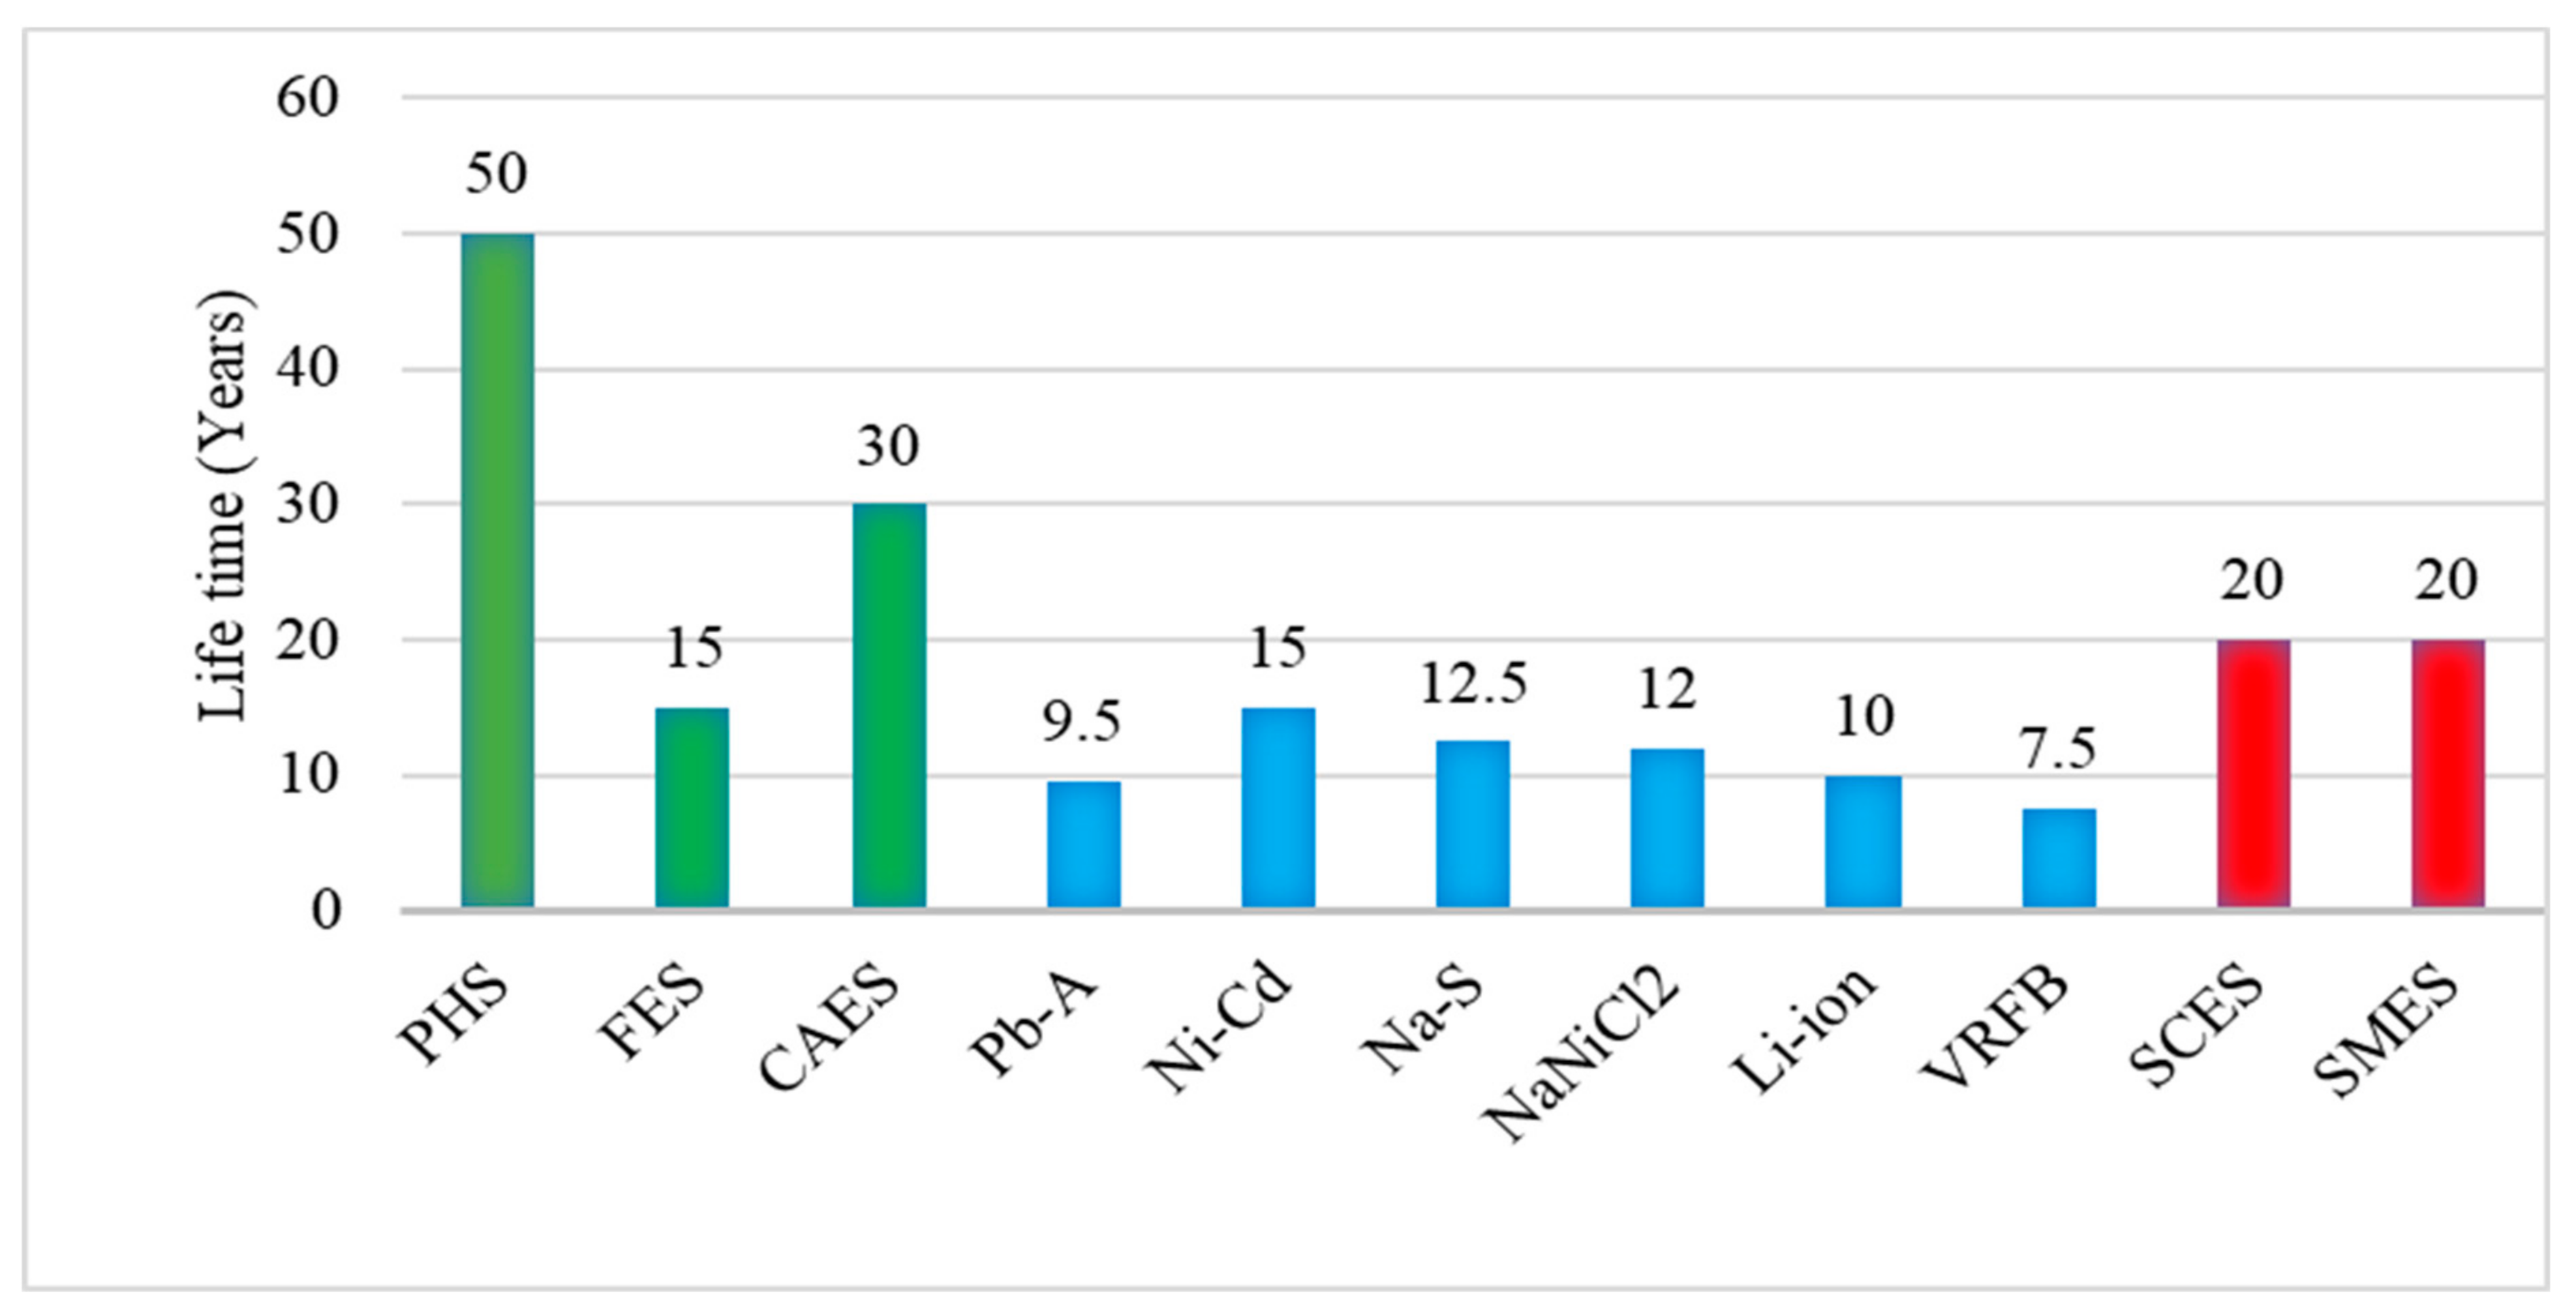
  • PHS and CAES have a longer life than others: As illustrated in 6, the mechanical energy storage system (PHS and CAES) have a longer lifetime than electrochemical and electrical energy storage system. Compare to all selected ESTs, PHS has the largest life span of 50 years, while electrochemical energy storage systems are fall within the range of 7.5–15 years. Compared to the mechanical and electrical energy storage system, the electrochemical energy storage system usually has a short lifetime due to rapid recharging, and the effect of working in high temperatures.
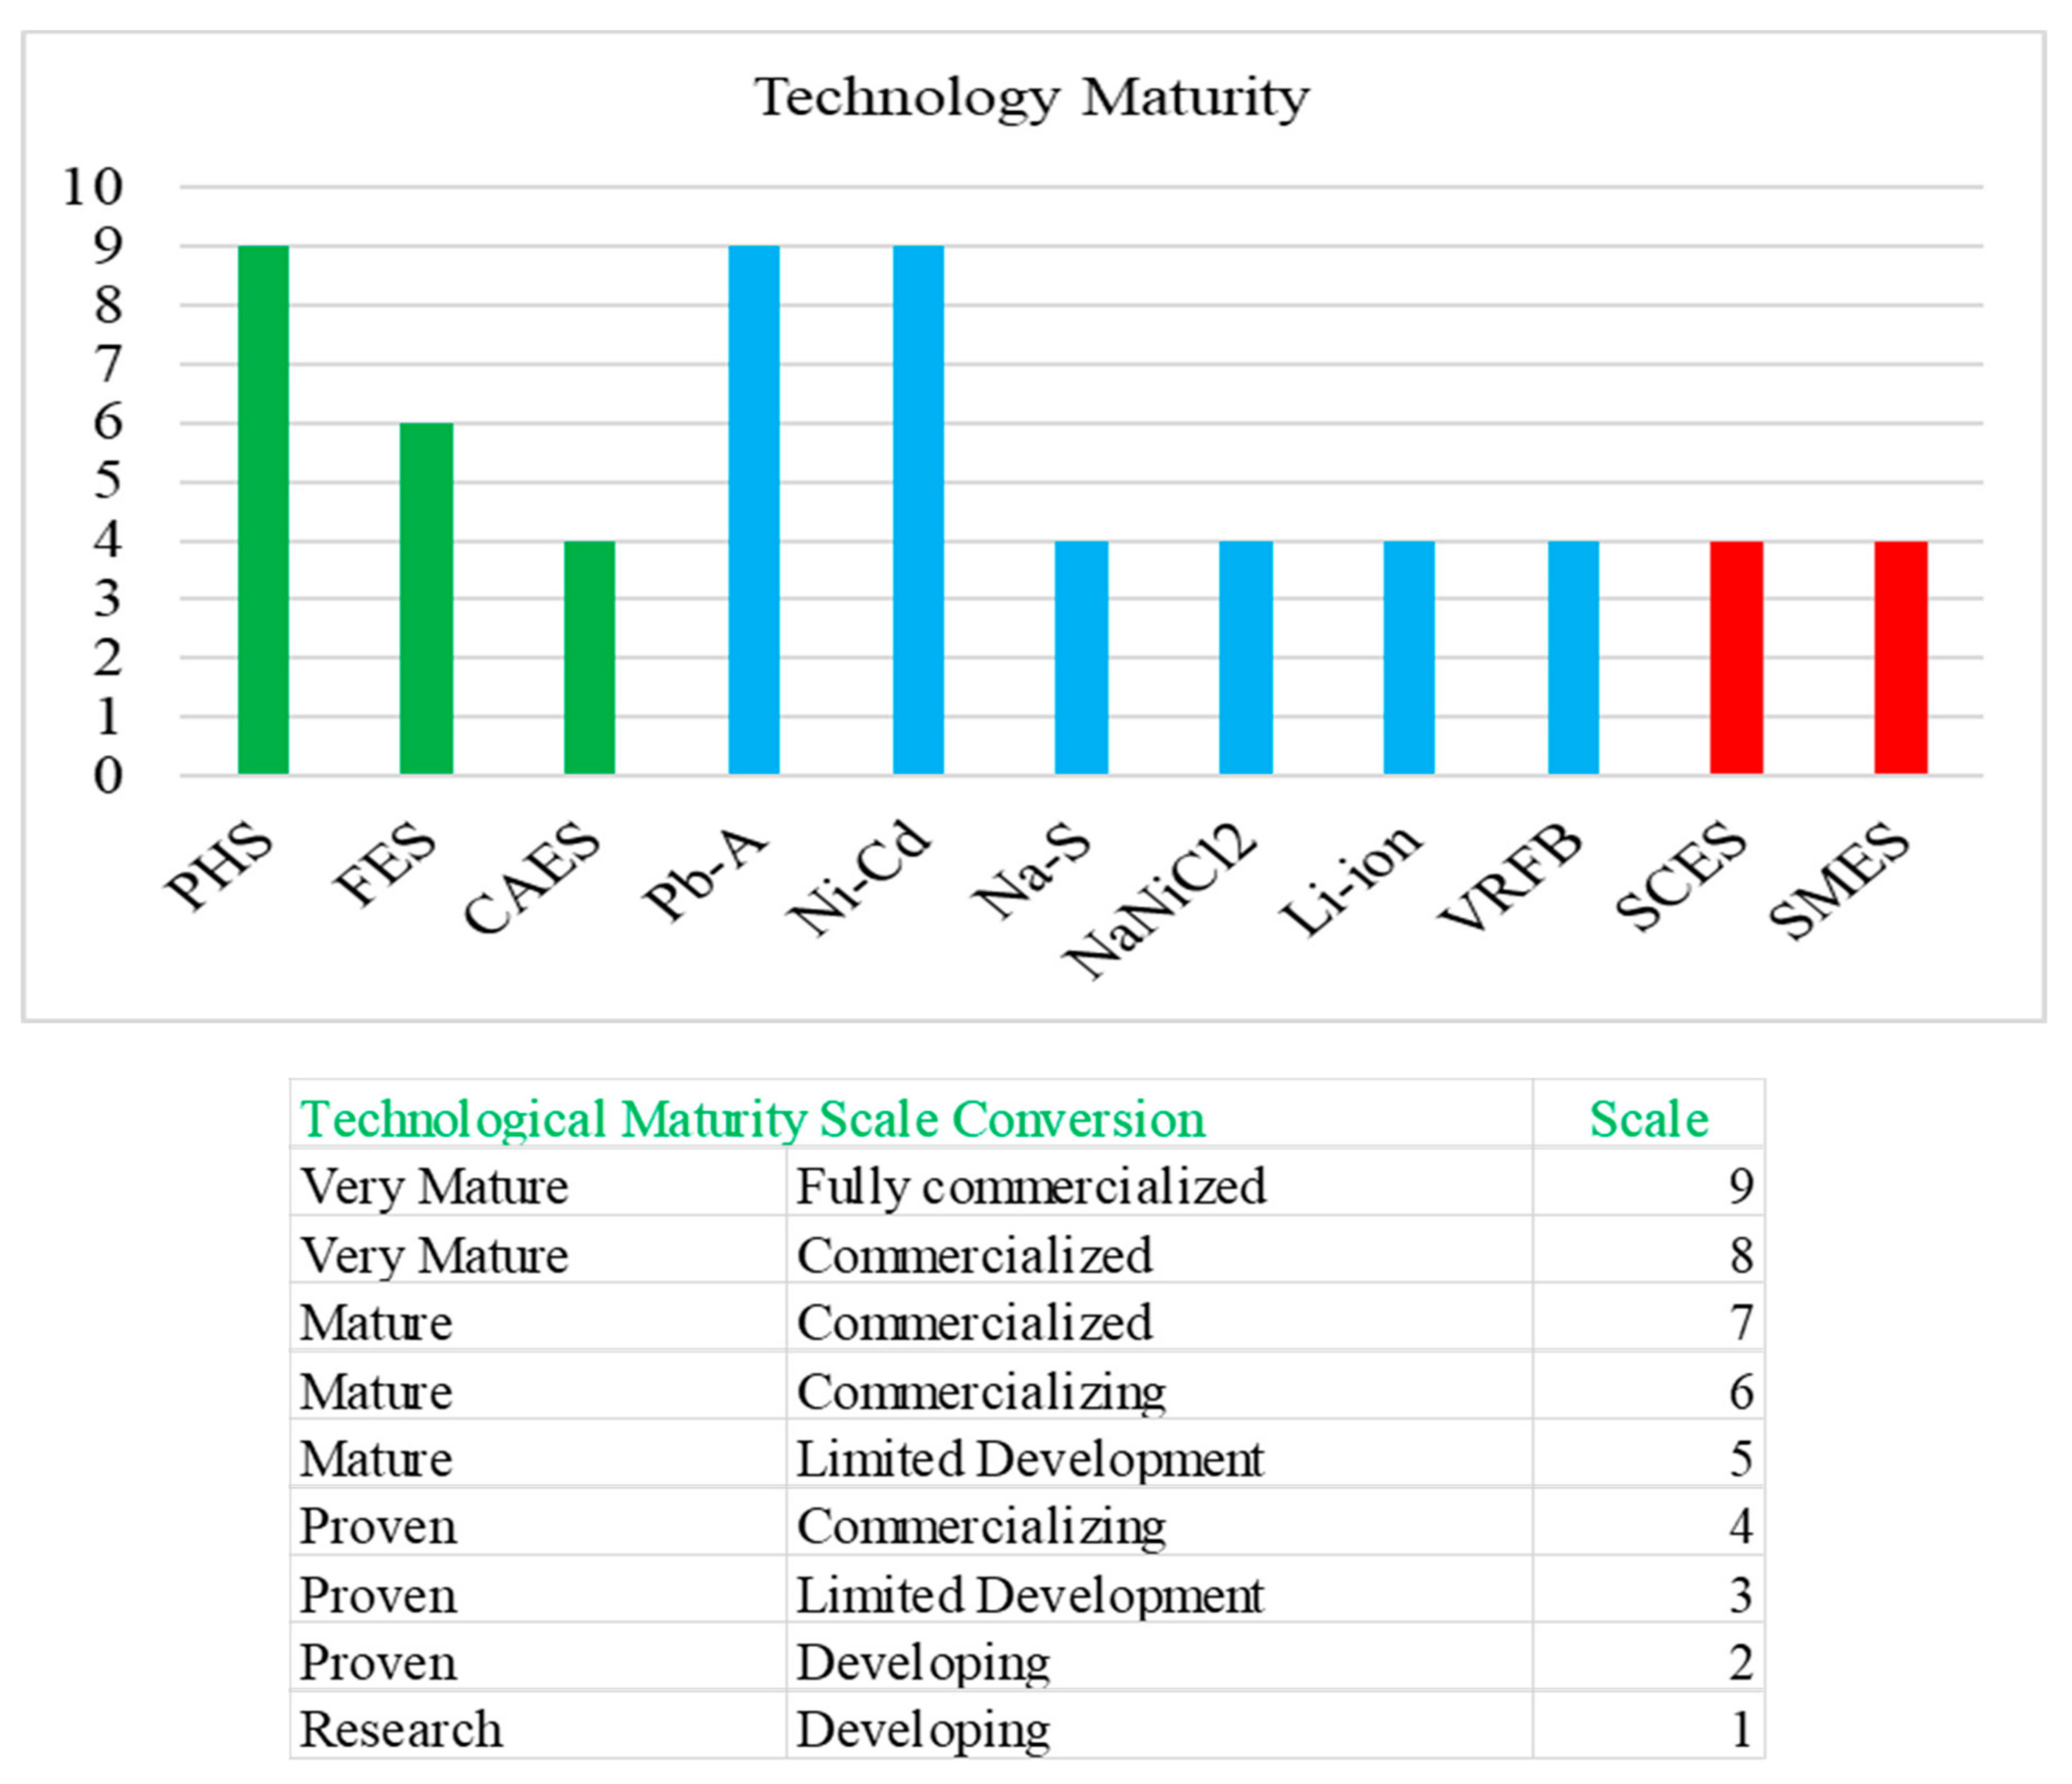
  • PHS, Pb-A, and Ni-Cd battery are the most matured technology than others: As shown in Figure 7, PHS, Pb-A, and Ni-Cd battery are the most matured and fully commercialized ESTs compared to others and have been used for over 100 years. On the other hand, CAES, Na-S, NaNiCl2, Li-ion, VRFB, SMES, SCES, FES are proven and commercializing technologies.
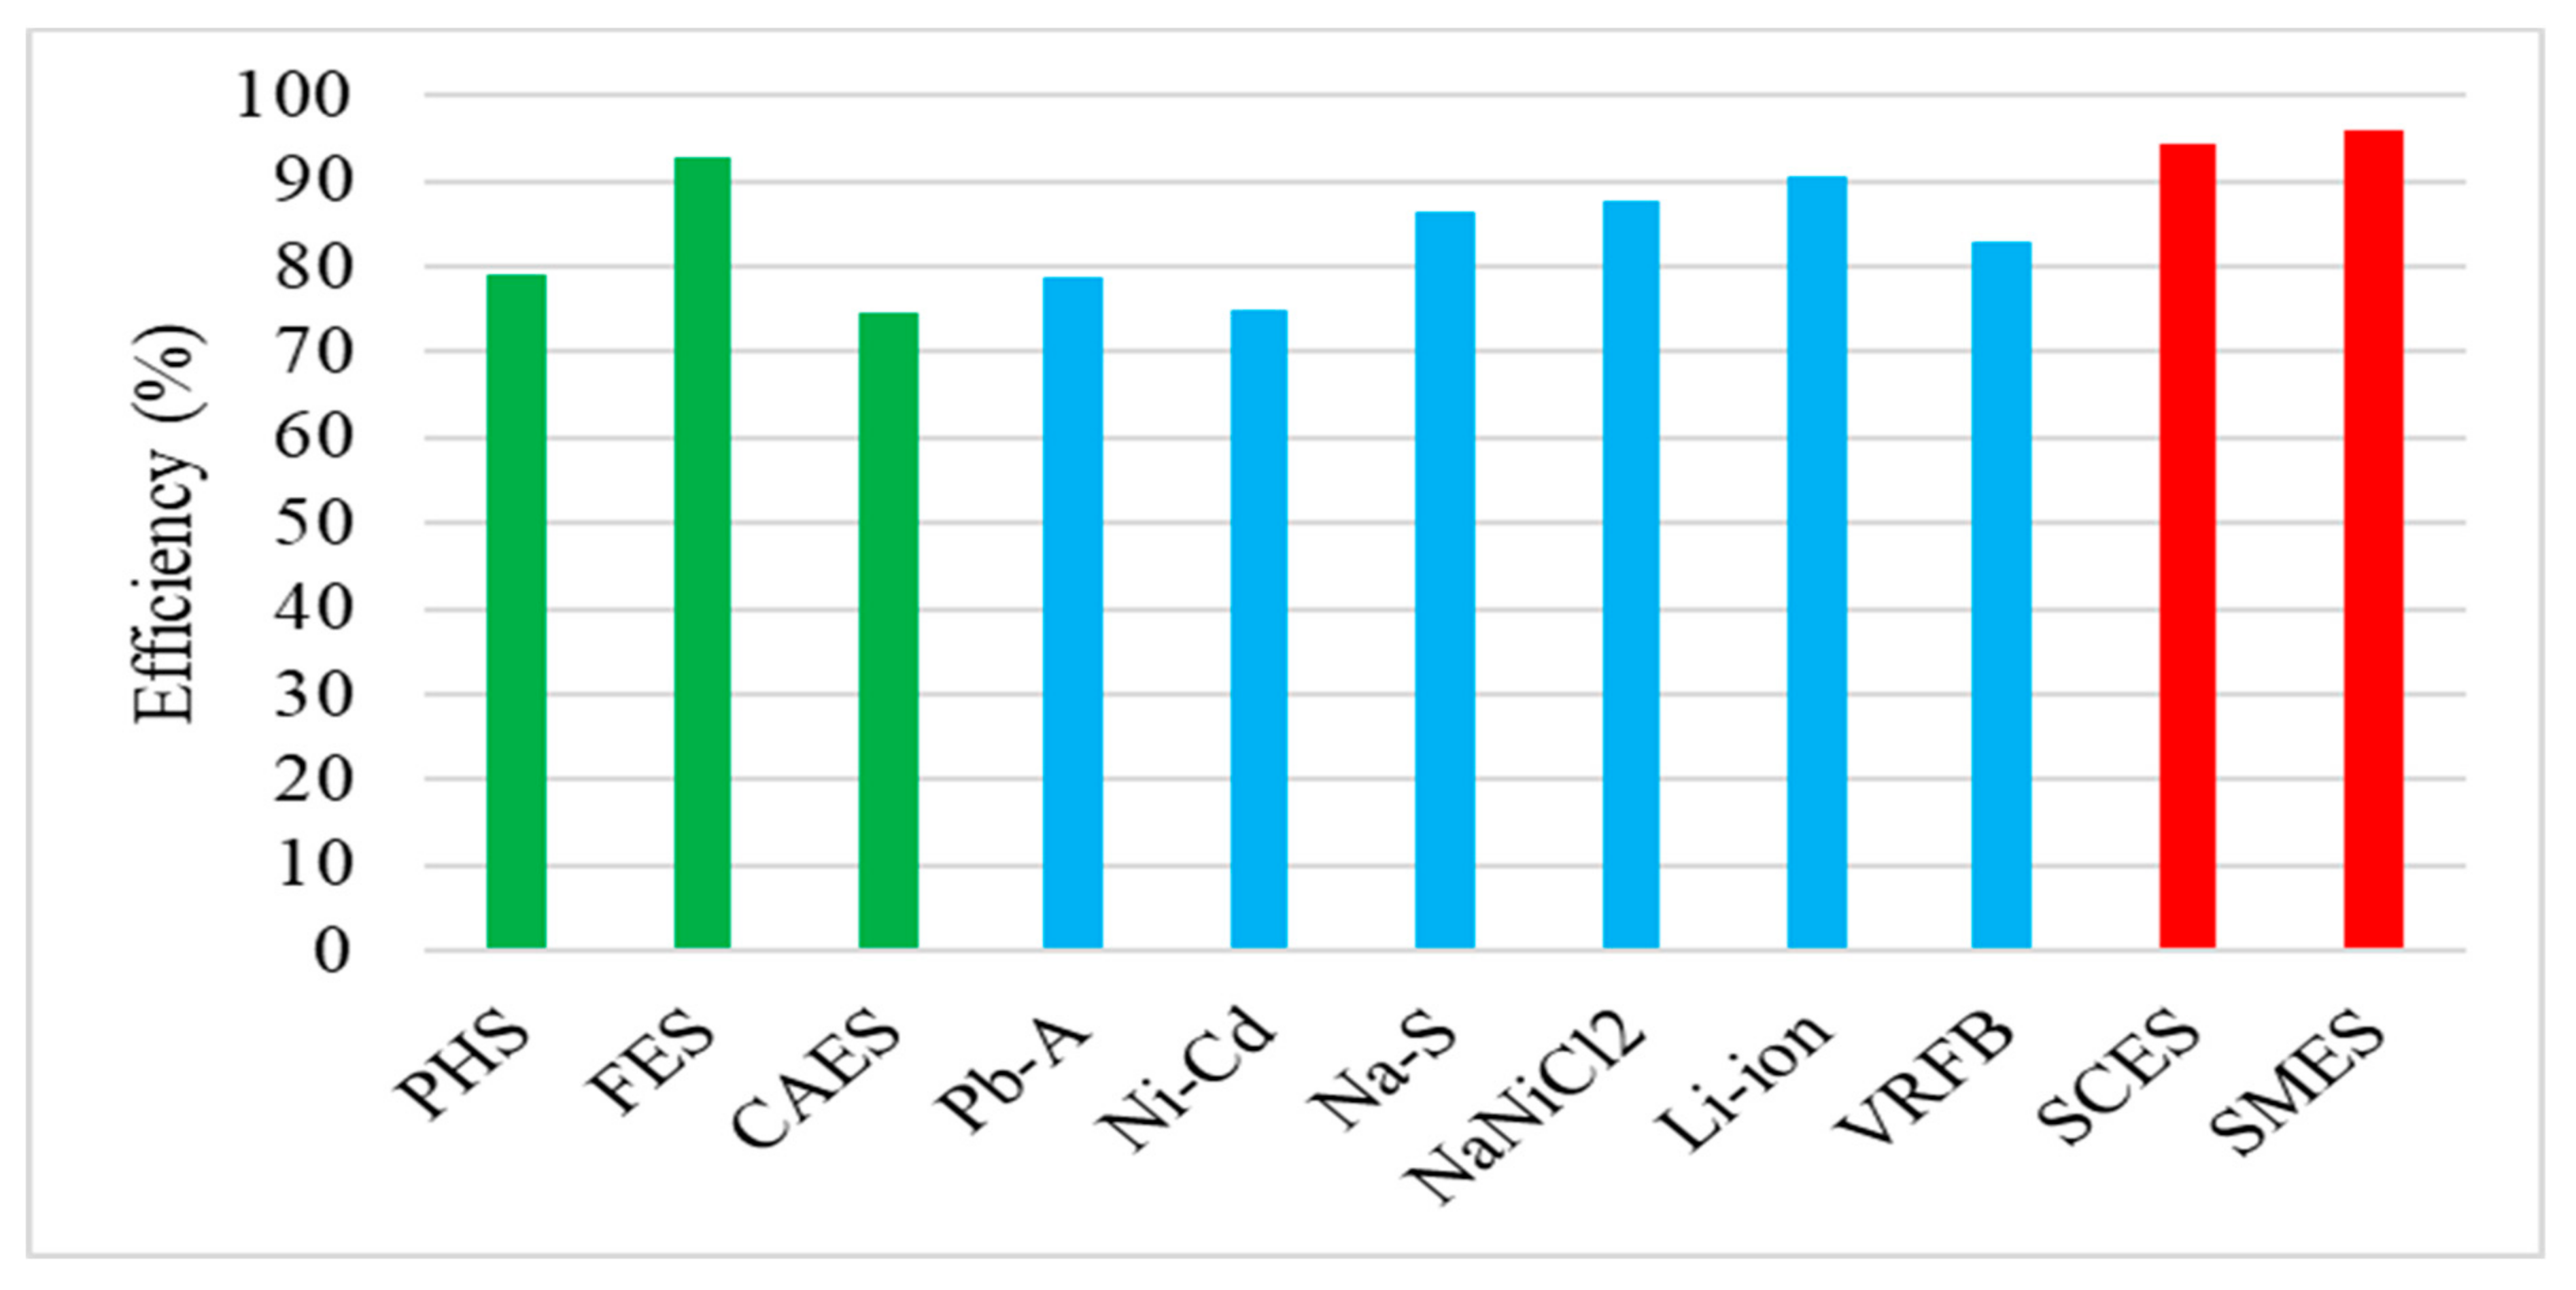
  • FES, SMES, SECES, and Li-ion batteries have very high round-trip efficiency than others: As shown in Figure 8, the round-trip efficiency of FES, SMES, SCES, and Li-ion batteries have a very high round-trip efficiency of above 90%, which are the top amongst ESTs. PHS, CAES, and electrochemical energy storage systems (Pb-A, Ni-Cd, Na-S, VRFB, and NaNiCl2), have high round-trip efficiency in the range of 74.5–90%.
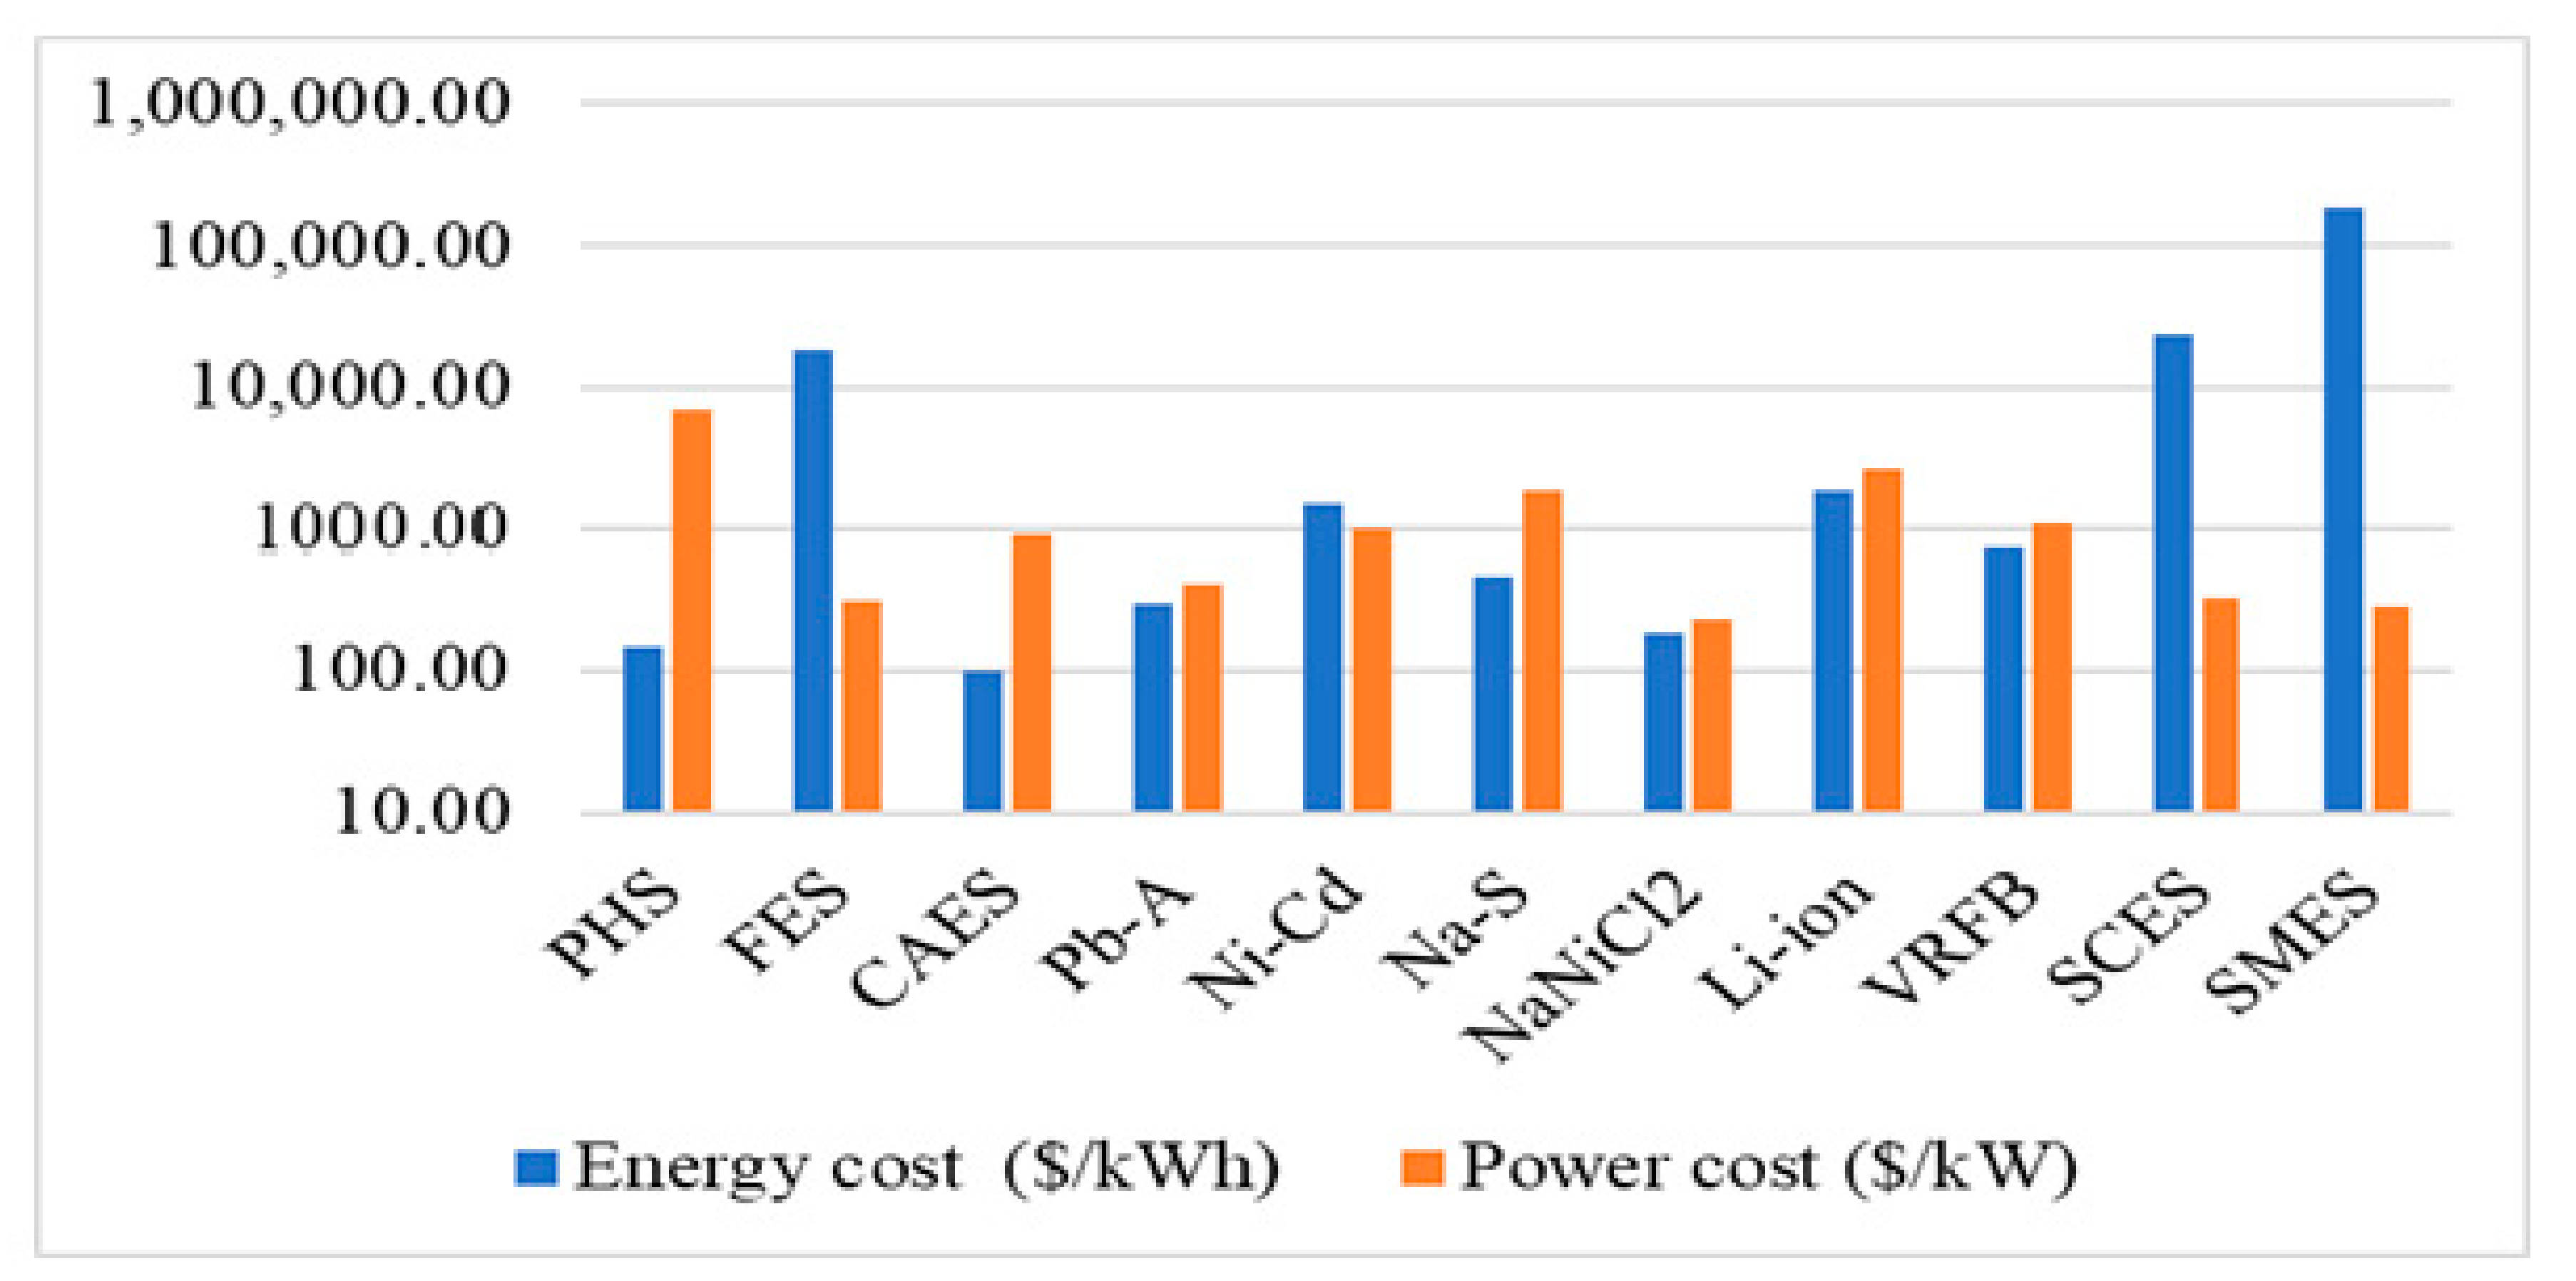
  • PHS and CAES have the lowest capital cost per kWh than others: As indicated in Figure 10, among all selected ESTs, the capital cost per kWh of PHS (147.5$/kWh) and CAES (100.4$/kWh) are in the low range. However, FES, SMES, and SCES have a higher capital cost per kWh. On the contrary, FES, SMES, and SCES have a lower capital cost per kW, such type of ESTs is applicable when higher power outputs are required.
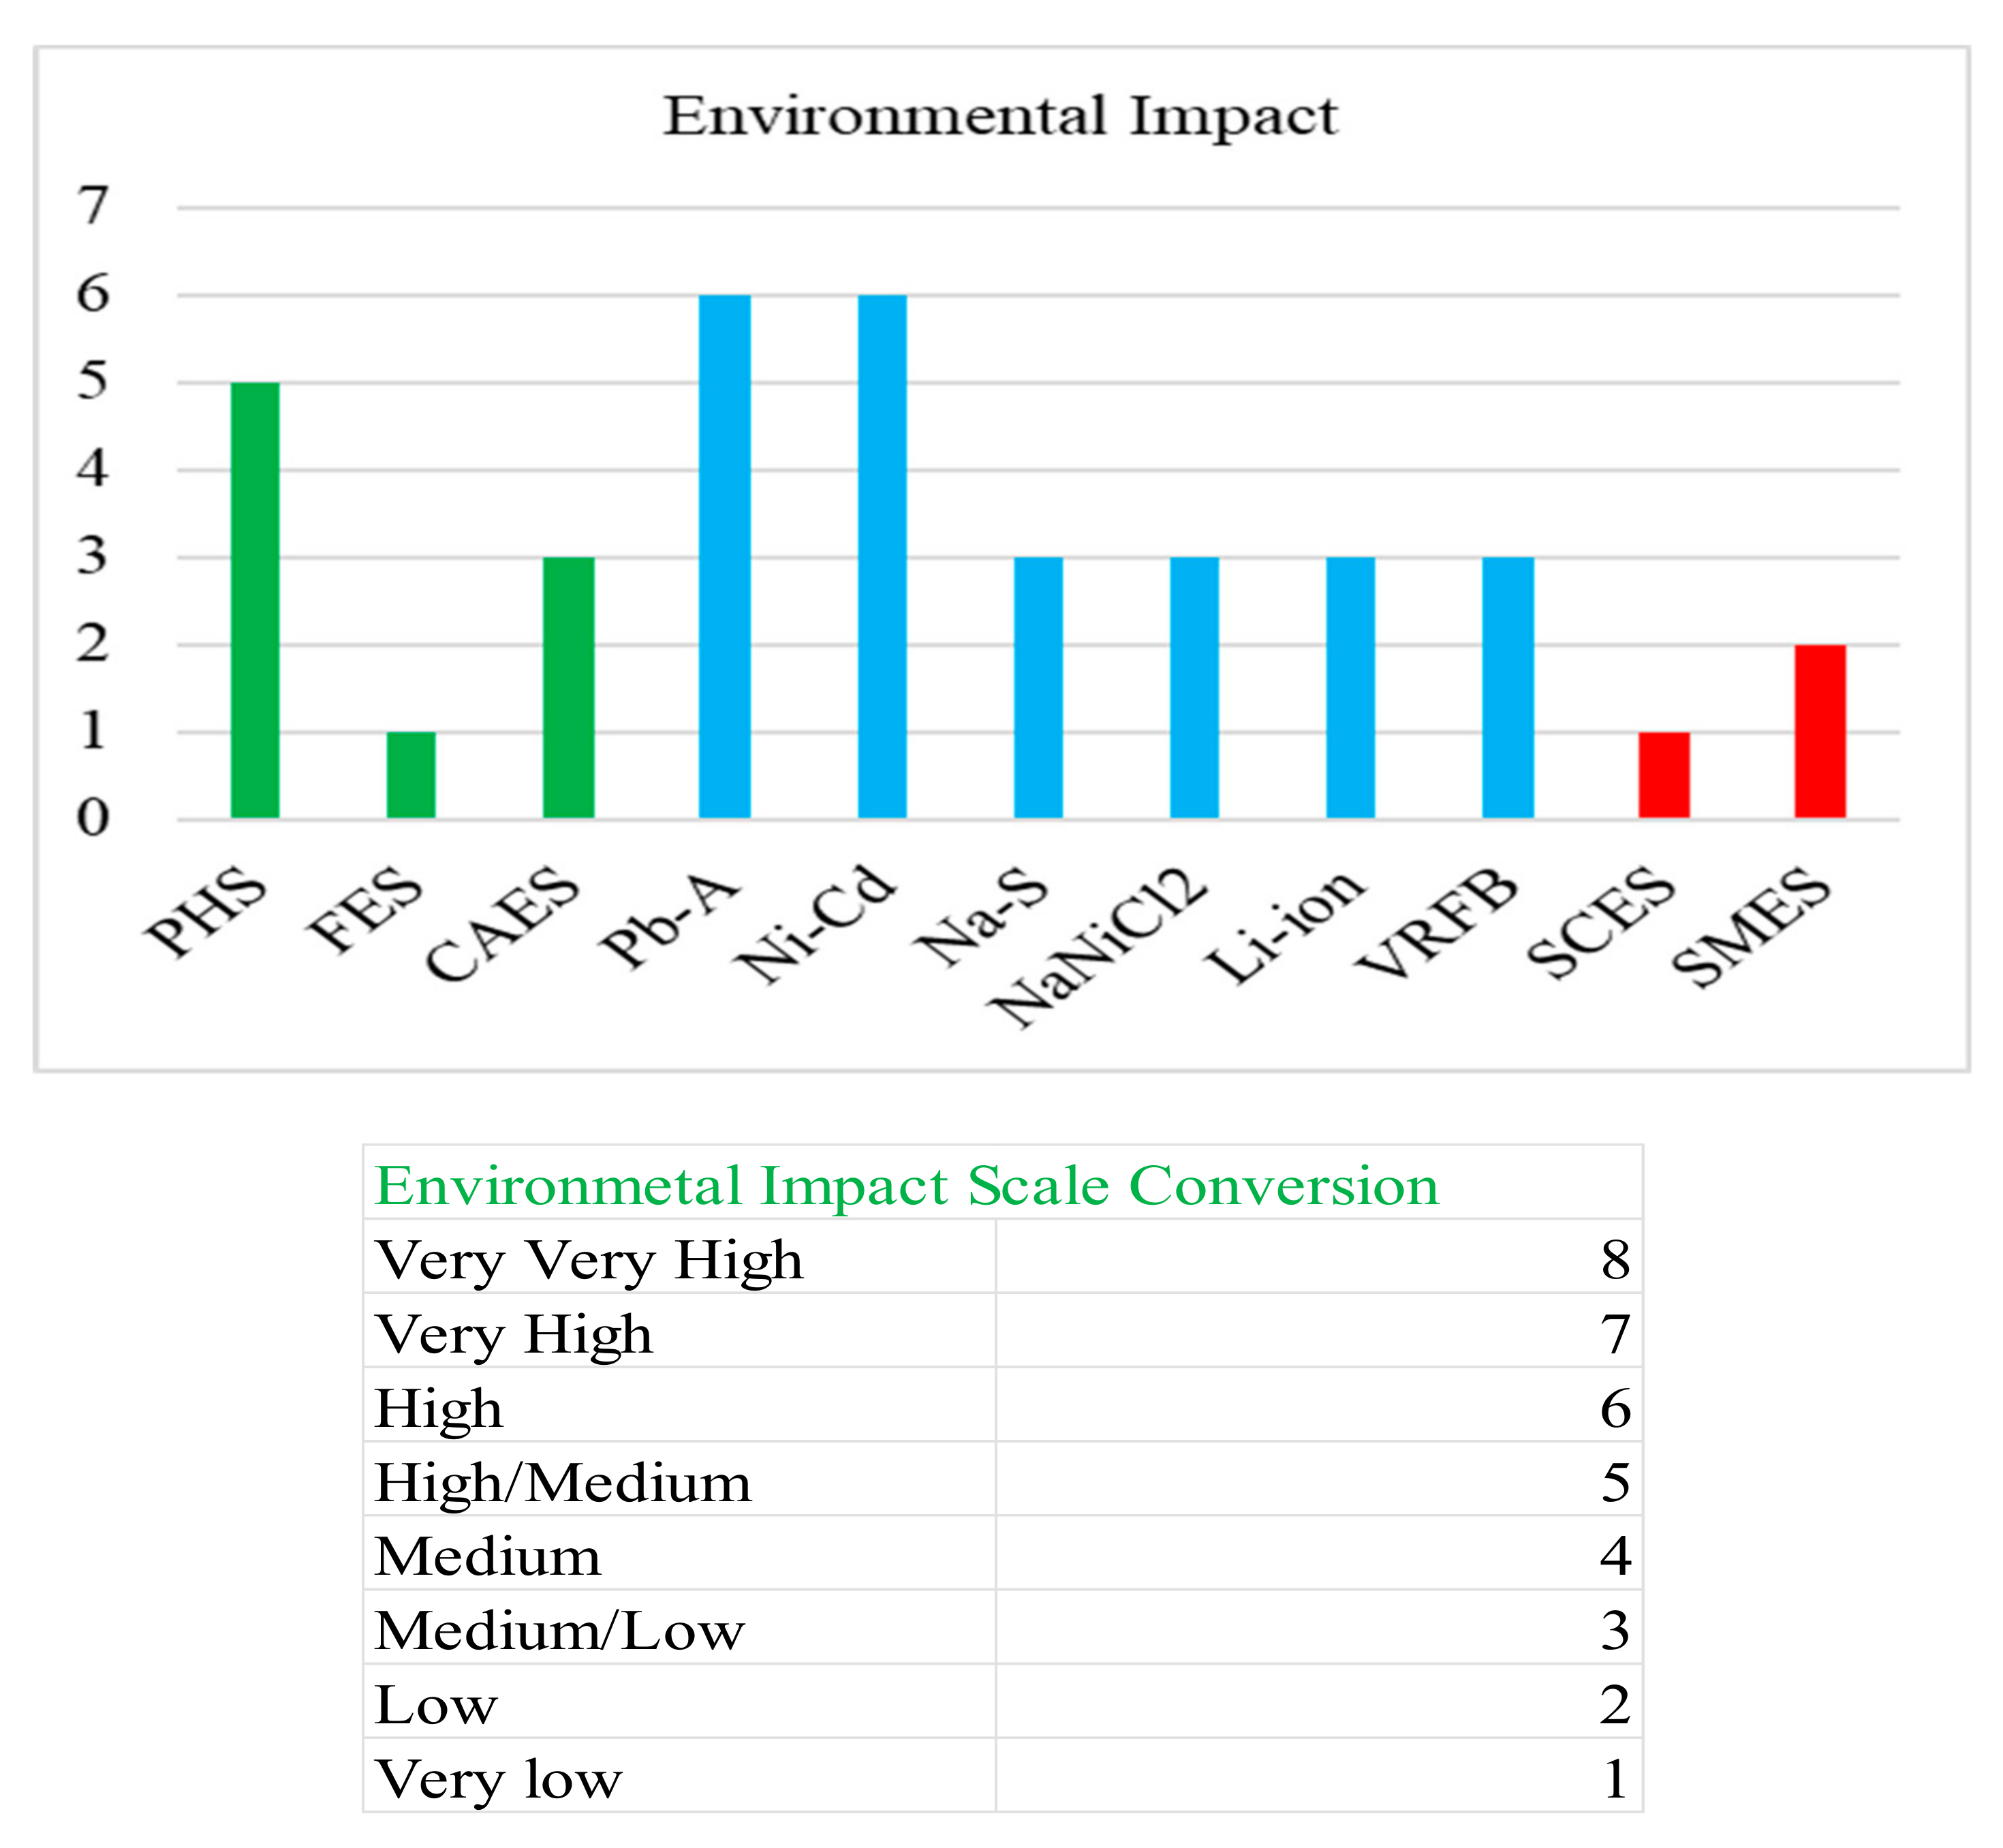
  • FES and SCES have a very low environmental impact than others: As shown in Figure 11, PHS, CAES, batteries, and SMES have high negative impacts on the environment, whereas, FES and SCES have a very small environmental impact.

6. Conclusions

Based on the review, the following conclusion has been drawn. Even if there are various ESTs commercially available, a single storage system is not meeting the requirement of all RESs constraints. A single energy storage system can be suited for specific applications in a renewable energy sector based on the characteristics of the RESs as well as the ESTs.
It is evident from the above review that electrochemical energy storage systems (batteries) are the dominant ESTs to be used when high energy and power densities, high power range, longer discharge time, fast response time, high cycle efficiency are paramount. Such types of ESTs have application potential in the renewable energy sector as well as in the power system in general such as, for energy management and bridging power application. Among electrochemical energy storage system, Li-ion batteries are considered as a more competitive option for grid-scale energy storage applications such as RESs utility grid integration due to their high energy density (350 Wh/l) and power density (1250 W/l), being lighter in weight and smaller in size, high cycle efficiency (90.5%), low daily self-discharge rate (0.19), the rapid response time (sec), and low environmental impacts. However, for Li-ion batteries to be fully adopted in the renewable energy sector, the cost of the storage device needs to be reduced. The cost of Li-ion batteries will be reduced by improving the cell technologies such as increasing the lifetime of the device, reducing the physical size of the device, and significantly increasing the production of the device. In addition to this, storage mediums with fast response time, short duration discharge time, and high-power density, such as FES, SCES, and SMES are more suitable for power quality and regulation applications such as mitigating the effect of wind speed random fluctuation. However, the daily self-discharge rate of this device is high. PHS and CAES storage systems have also application potential in the renewable energy sector since they can store more energy for a long duration and have a larger power rating. However, PHS and CAES are limited by topographic constraints.

Author Contributions

H.A.B. researched literature review, data collection from different publications, analyzing, interpretation of data and preparing the draft content of the manuscript; M.M. supervised during the study, and reviewed and edited the manuscript; T.C., K.A.F., M.B., A.A.K., and J.V.M. supervised the study, reviewed, and edited the manuscript. All authors have read and agreed to the published version of the manuscript.

Funding

This research received no external funding.

Acknowledgments

Network for Advancement of Sustainable Capacity in Education and Research in Ethiopia (NASCERE), Jimma University, Ethiopia, and Vrije Universiteit Brussel (VUB), Brussels, Belgium are acknowledged for providing a joint Ph.D. scholarship to the first author during the study.

Conflicts of Interest

The authors declare no conflict of interest.

References

  1. IRENA. Renewable Energy Capacity Highlights; Irena: New York, NY, USA, 2020. [Google Scholar]
  2. Das, C.K.; Bass, O.; Kothapalli, G.; Mahmoud, T.S.; Habibi, D. Overview of energy storage systems in distribution networks: Placement, sizing, operation, and power quality. Renew. Sustain. Energy Rev. 2018, 91, 1205–1230. [Google Scholar] [CrossRef]
  3. Palizban, O.; Kauhaniemi, K. Energy storage systems in modern grids—Matrix of technologies and applications. J. Energy Storage 2016, 6, 248–259. [Google Scholar] [CrossRef]
  4. Hadjipaschalis, I.; Poullikkas, A.; Efthimiou, V. Overview of current and future energy storage technologies for electric power applications. Renew. Sustain. Energy Rev. 2009, 13, 1513–1522. [Google Scholar] [CrossRef]
  5. Yao, L.; Yang, B.; Cui, H.; Zhuang, J.; Ye, J.; Xue, J. Challenges and progresses of energy storage technology and its application in power systems. J. Mod. Power Syst. Clean Energy 2016, 4, 519–528. [Google Scholar] [CrossRef] [Green Version]
  6. China Energy Storage Allliance (CNESA). CNESA Global Energy Storage Market Analysis—2019.Q4 (Summary). 2020. Available online: http://en.cnesa.org/latest-news/2020/5/28/cnesa-global-energy-storage-market-analysis-2020q1-summary (accessed on 15 October 2020).
  7. Leadbetter, J.; Swan, L.G. Selection of battery technology to support grid-integrated renewable electricity. J. Power Sources 2012, 216, 376–386. [Google Scholar] [CrossRef]
  8. Johal, H.; Manz, D.; O’Brien, K.; Kern, J. Grid integration of energy storage. In Proceedings of the 2011 IEEE Power and Energy Society General Meeting, Detroit, MI, USA, 24–28 July 2011; pp. 1–2. [Google Scholar] [CrossRef]
  9. Sabihuddin, S.; Kiprakis, A.E.; Mueller, M. A numerical and graphical review of energy storage technologies. Energies 2015, 8, 172–216. [Google Scholar] [CrossRef]
  10. Denholm, P.; Ela, E.; Kirby, B.; Milligan, M. The role of energy storage with renewable electricity generation. In Energy Storage: Issues and Applications; NREL: Oak Ridge, TN, USA, 2011; pp. 1–58. [Google Scholar]
  11. Luo, X.; Wang, J.; Dooner, M.; Clarke, J. Overview of current development in electrical energy storage technologies and the application potential in power system operation. Appl. Energy 2015, 137, 511–536. [Google Scholar] [CrossRef] [Green Version]
  12. Rohit, A.K.; Rangnekar, S. An overview of energy storage and its importance in Indian renewable energy sector: Part II—Energy storage applications, benefits and market potential. J. Energy Storage 2017, 13, 447–456. [Google Scholar] [CrossRef]
  13. Chen, H.; Cong, T.N.; Yang, W.; Tan, C.; Li, Y.; Ding, Y. Progress in electrical energy storage system: A critical review. Prog. Nat. Sci. 2009, 19, 291–312. [Google Scholar] [CrossRef]
  14. Nadeem, F.; Hussain, S.M.S.; Tiwari, P.K.; Goswami, A.K.; Ustun, T.S. Comparative review of energy storage systems, their roles, and impacts on future power systems. IEEE Access 2019, 7, 4555–4585. [Google Scholar] [CrossRef]
  15. Ibrahim, H.; Ilinca, A.; Perron, J. Energy storage systems-Characteristics and comparisons. Renew. Sustain. Energy Rev. 2008, 12, 1221–1250. [Google Scholar] [CrossRef]
  16. Díaz-González, F.; Sumper, A.; Gomis-Bellmunt, O.; Villafáfila-Robles, R. A review of energy storage technologies for wind power applications. Renew. Sustain. Energy Rev. 2012, 16, 2154–2171. [Google Scholar] [CrossRef]
  17. Zhao, H.; Wu, Q.; Hu, S.; Xu, H.; Rasmussen, C.N. Review of energy storage system for wind power integration support. Appl. Energy 2015, 137, 545–553. [Google Scholar] [CrossRef]
  18. Maisanam, A.K.S.; Biswas, A.; Sharma, K.K. An innovative framework for electrical energy storage system selection for remote area electrification with renewable energy system: Case of a remote village in India. J. Renew. Sustain. Energy 2020, 12. [Google Scholar] [CrossRef]
  19. Koohi-Fayegh, S.; Rosen, M.A. A review of energy storage types, applications and recent developments. J. Energy Storage 2020, 27. [Google Scholar] [CrossRef]
  20. Acar, C. A comprehensive evaluation of energy storage options for better sustainability. Int. J. Energy Res. 2018, 42, 3732–3746. [Google Scholar] [CrossRef]
  21. Liu, Y.; Du, J.L. A multi criteria decision support framework for renewable energy storage technology selection. J. Clean. Prod. 2020, 277. [Google Scholar] [CrossRef]
  22. Rahman, M.M.; Oni, A.O.; Gemechu, E.; Kumar, A. Assessment of energy storage technologies: A review. Energy Convers. Manag. 2020, 223. [Google Scholar] [CrossRef]
  23. Thomas, D.; D’Hoop, G.; Deblecker, O.; Genikomsakis, K.N.; Ioakimidis, C.S. An integrated tool for optimal energy scheduling and power quality improvement of a microgrid under multiple demand response schemes. Appl. Energy 2020, 260. [Google Scholar] [CrossRef] [Green Version]
  24. Thomas, D.; Kazempour, J.; Papakonstantinou, A.; Pinson, P.; Deblecker, O.; Ioakimidis, C.S. A Local Market Mechanism for Physical Storage Rights. IEEE Trans. Power Syst. 2020, 35, 3087–3099. [Google Scholar] [CrossRef] [Green Version]
  25. Kebede, A.A.; Berecibar, M.; Coosemans, T.; Messagie, M.; Jemal, T.; Behabtu, H.A.; Van Mierlo, J. A techno-economic optimization and performance assessment of a 10 kWP photovoltaic grid-connected system. Sustain. 2020, 12, 7648. [Google Scholar] [CrossRef]
  26. Aneke, M.; Wang, M. Energy storage technologies and real life applications—A state of the art review. Appl. Energy 2016, 179, 350–377. [Google Scholar] [CrossRef] [Green Version]
  27. Ben Elghali, S.; Outbib, R.; Benbouzid, M. Selecting and optimal sizing of hybridized energy storage systems for tidal energy integration into power grid. J. Mod. Power Syst. Clean Energy 2019, 7, 113–122. [Google Scholar] [CrossRef]
  28. IEC. IEC Electrical Energy Storage White Paper. 2009. Available online: https://www.iec.ch/whitepaper/energystorage/ (accessed on 24 October 2020).
  29. Khalid, M. A review on the selected applications of battery-supercapacitor hybrid energy storage systems for microgrids. Energies 2019, 12, 4559. [Google Scholar] [CrossRef] [Green Version]
  30. Mallick, K.; Das, S.; Sengupta, A.; Chattaraj, S. Modern Mechanical Energy Storage Systems and Technologies. Int. J. Eng. Res. 2016, V5, 727–730. [Google Scholar] [CrossRef]
  31. Kampouris, K.P.; Drosou, V.; Karytsas, C.; Karagiorgas, M. Energy storage systems review and case study in the residential sector. IOP Conf. Ser. Earth Environ. Sci. 2020, 410. [Google Scholar] [CrossRef]
  32. Amiryar, M.E.; Pullen, K.R. A review of flywheel energy storage system technologies and their applications. Appl. Sci. 2017, 7, 286. [Google Scholar] [CrossRef] [Green Version]
  33. Salkuti, S.R.; Jung, C.M. Comparative analysis of storage techniques for a grid with renewable energy sources. Int. J. Eng. Technol. 2018, 7, 970–976. [Google Scholar] [CrossRef]
  34. Argyrou, M.C.; Christodoulides, P.; Wongwises, S.A. Energy storage for electricity generation and related processes: Technologies appraisal and grid scale applications. Renew. Sustain. Energy Rev. 2018, 94, 804–821. [Google Scholar] [CrossRef]
  35. Molina, M.G. Energy Storage and Power Electronics Technologies: A Strong Combination to Empower the Transformation to the Smart Grid. Proc. IEEE 2017, 105, 2191–2219. [Google Scholar] [CrossRef]
  36. Swierczynski, M.; Teodorescu, R.; Rasmussen, C.N.; Rodriguez, P.; Vikelgaard, H. Overview of the energy storage systems for wind power integration enhancement. In Proceedings of the 2010 IEEE International Symposium on Industrial Electronics, Bari, Italy, 4 July 2010; pp. 3749–3756. [Google Scholar] [CrossRef] [Green Version]
  37. Suvire, G.O.; Mercado, P.E.; Ontiveros, L.J. Comparative analysis of energy storage technologies to compensate wind power short-term fluctuations. In Proceedings of the 2010 IEEE/PES Transmission and Distribution Conference and Exposition: Latin America, T and D-LA 2010, São Paulo, Brazil, 8–10 November 2010; pp. 522–528. [Google Scholar] [CrossRef]
  38. Asian Development Bank. Handbook on Battery Energy Storage System; ADB: Mandaluyong, Phillippines, 2018. [Google Scholar]
  39. Evans, A.; Strezov, V.; Evans, T.J. Assessment of utility energy storage options for increased renewable energy penetration. Sustain. Energy Rev. 2012, 16, 4141–4147. [Google Scholar] [CrossRef]
  40. Stroe, D.I.; Stan, A.I.; Diosi, R.; Teodorescu, R.; Andreasen, S.J. Short term energy storage for grid support in wind power applications. In Proceedings of the 2012 13th International Conference on Optimization of Electrical and Electronic Equipment (OPTIM), Brasov, Romania, 24–26 2012 May; pp. 1012–1021. [Google Scholar] [CrossRef]
  41. Mongird, K.; Viswanathan, V.V.; Balducci, P.J.; Alam, M.J.E.; Fotedar, V.; Koritarov, V.S.; Hadjerioua, B. Energy Storage Technology and Cost Characterization Report. 2019. Available online: https://www.energy.gov/sites/prod/files/2019/07/f65/Storage%20Cost%20and%20Performance%20Characterization%20Report_Final.pdf (accessed on 15 July 2020).
  42. Yekini Suberu, M.; Wazir Mustafa, M.; Bashir, N. Energy storage systems for renewable energy power sector integration and mitigation of intermittency. Renew. Sustain. Energy Rev. 2014, 35, 499–514. [Google Scholar] [CrossRef]
  43. Sufyan, M.; Rahim, N.A.; Aman, M.M.; Tan, C.K.; Raihan, S.R.S. Sizing and applications of battery energy storage technologies in smart grid system: A review. J. Renew. Sustain. Energy 2019, 11. [Google Scholar] [CrossRef]
  44. Pomper, D.E. Electricity Storage: Technologies and Applications. 2010. Available online: http://nrri.org/?wpdmdl=700 (accessed on 24 September 2020).
  45. Chowdhury, M.M.; Haque, M.; Aktarujjaman, M.; Negnevitsky, M.; Gargoom, A. Grid integration impacts and energy storage systems for wind energy applications—A review. In Proceedings of the 2011 IEEE Power and Energy Society General Meeting, Detroit, MI, USA, 24–28 July 2011; pp. 1–8. [Google Scholar] [CrossRef]
  46. Farhadi, M.; Mohammed, O. Energy Storage Technologies for High-Power Applications. IEEE Trans. Ind. Appl. 2016, 52, 1953–1961. [Google Scholar] [CrossRef]
Figure 1. Global total operational ESTs project capacity (MW) [6]. Source: CNESA Global Energy Storage Project Database.
Sustainability 12 10511 g001
Figure 2. Classification of ESTs by the form of stored energy.
Sustainability 12 10511 g002
Figure 3. Comparison of energy and power density for all selected ESTs, according to the average data collected in Table 2.
Sustainability 12 10511 g003
Figure 4. Comparison of power rating and discharge time for all selected ESTs, according to the average data collected in Table 2 and Table 3.
Sustainability 12 10511 g004
Figure 5. Comparison of self-discharge time for all selected ESTs, according to the average data collected in Table 3.
Sustainability 12 10511 g005
Figure 6. Comparison of lifetime for all selected ESTs, according to the average data collected in Table 3.
Sustainability 12 10511 g006
Figure 7. Comparison of technology maturity for all selected ESTs, according to the average data collected in Table 3.
Sustainability 12 10511 g007
Figure 8. Comparison of round-trip efficiency for all selected ESTs, according to the average data collected in Table 2.
Sustainability 12 10511 g008
Figure 9. Comparison of response time for all selected ESTs, according to the average data collected in Table 3.
Sustainability 12 10511 g009
Figure 10. Comparison of energy capital cost and power capital cost for all selected ESTs, according to the average data collected in Table 4.
Sustainability 12 10511 g010
Figure 11. Comparison of impact on environment for selected ESTs, according to the average data collected in Table 4.
Sustainability 12 10511 g011
Table 1. Typical applications of ESTs based on storage duration and power rating [9,10].
CategoryApplicationsStorage DurationPower Rating
Power Quality and RegulationFluctuation Suppression/Smoothing≤ 1 minSmall Scale
(≤1 MW)
Dynamic power Response
Low voltage Ride Through
Line Fault Ride Through
Uninterruptable Power Supply
Voltage Control Support
Reactive Power Control
Oscillation Damping
Transient Stability
Bridging PowerSpinning/Contingency Reserves1 min–1 hMedium Scale
(10–100 MW)
Ramping
Emergency Backup
Load Following
Wind Power Smoothing
Energy ManagementPeak Shaving/Generation/Time Shifting1–10 hLarge Scale
(≥300 MW
Transmission Curtailment5–12 h
Energy Arbitrage
Transmission and Distribution Deferral
Line Repair
Load Cycling
Weather Smoothing
Unit CommitmentHours-days
Load Leveling
Capacity Firming
Renewable Integration and Backup
Seasonal Storage≥4 months
Annual Smoothing
Table 2. Technical characteristics of all select ESTs.
ESTsPower Range (MW)Energy Density (Wh/l)Power Density (W/l)Round Trip Efficiency (%)
PHS10–5000
[2,12,13,26]
0.5–1.5
[12,13,14,26]
0.5–1.5 [11,27]75–85 [2],
65–87 [12,26]
70–85 [14]
FES0.1–20 [2],
< 0.25 [11],
0–0.25 [12,26]
0.01–0.25 [14]
20–80 [11,26]1000–2000 [11,26] 93–95 [2]
90–95 [14]
90–93 [27]
CAES5–1000 [2],
5–300 [12,13,26]
3–6 [12,13,26] 0.5–2 [12,13] 70–89 [2]
50–89 [12,13]
70–79 [27]
Pb-A0–40 [2],
0–20 [12,13]
50–80 [12,13] 10–400 [12,13]70–90 [2]
75–80 [12]
Ni-Cd0–40 [2,13]60–150 [2,13]150–300 [2] 60–65 [2]
85–90 [12]
Na-S0.05–34 [2]
0.05–8 [13]
150–250 [12,26]150–230 [12,26]85–90 [2]
80–90 [12,26]
NaNiCl20–3 [26]150–180 [26]220–300 [26]85–90 [26]
Li-ion0–100 [2],
0–1 [12,13]
200–500 [13,26] 500–2000 [26]85–90 [2,26]
~90–97 [11]
VRFB0.3–3 [12]16–33 [12]
20–70 [28]
0.5–2 [28]85–90 [12]
75–82 [27]
SCES0–0.3 [12,13]2.5–15 [26]500–5000 [26]90–95 [2,26]
95–98 [27]
SMES0.1–10 [12,13]0.2–2.5 [26]1000–4000 [26]95–98 [2,26]
95 [27]
Source: Authors’ (collated from difference source).
Table 3. Additional technical characteristics of all selected ESTs.
ESTsDischarge Time (ms-hr)Response Time (ms-h)Lifetime (yr)Daily Self-Discharge (%)Technology Maturity
PHS1–24 hr+
[2,12,13,14,26]
sec-min [2], min [11,14], 1–2 min [12]40–60 [2,11]–[13,26]Very small
[11,12]
0.00 [9]
Very mature/Fully commercialized [2,9,11,14]
FESms–15 min [2,14,26]< 4 ms-sec [2], sec [14]15 + [2],
15 [12,13,26]
100 [13]
24–100 [9]
Mature/Commercializing [9,11,12,14,26]
CAES1–24 hr+ [2,12,26]1–15 min [2], 1–2 min [12]20–40 [2]Small [11,12,13]
0.00 [9]
Proven/Commercializing [9,12]
Pb-Asec-hr [2,12,13]5–10 ms [2], sec [12]3–15 [2],
5–15 [12,13]
0.1–0.3 [12,13]
0.033–1.10 [9]
Very mature/Fully Commercialized
[9,11,14]
Ni-Cdsec-hrs [12]20 ms-sec [2], sec [12]10–20 [2,12]0.2–0.6 [12,13]
0.07–0.71 [9]
Very mature/Fully commercialized
[2,9,12]
Na-Ssec-hr [2,12,26]1 ms [2], sec [12]10–15 [2,12,26]20 [9,12,26]Proven/Commercializing [2,9,12]
NaNiCl2sec–h [26]< sec [28]10–14 [26]11.89–26.25 [9]Proven/Commercializing [9,26]
Li-ionmin–hr [2,12,26]20 ms-s [2]5–15 [2,12]0.1–0.3 [12,13]
0.03–0.33 [9]
Proven/Commercializing
[2,12]
VRFBsec-10
hrs [12]
Sec [12]5–10 [12]Small [12]Proven/Commercializing [9,12]
SCESms–hr [2]8 ms [2], 20 + [2,12]20–40 [2,12]
0.46–40 [9]
Proven/Commercializing [2,9]
SMESms–8 sec [2]< 100 ms [2]20 + [2,12]10–15 [2,12]
1–15 [9]
Proven/Commercializing [2,9]
Source. Authors’ (collated from difference source).
Table 4. Estimated capital cost and environmental impact for all selected ESTs.
ESTs Total Capital CostEnvironmental Impact
Power Cost $/kWEnergy Cost $/kWh
PHS2000–4300 [2],
2500–4300 [11],
600–2000 [12,26],
500–2000 [14],
2171–4342 [18]
5–100 [2,12,13,27]
1–291.20 [9],
217–271 [18]
High/Medium [2,9,12,13]
FES250–350 [2,12,26],
271–380 [18]
1000–14,000 [2],
500–1000 [12],
1000–5000 [13,26],
200–150,000 [9]
1085–5427 [18]
Very low [2,9,12,13]
CAES400–1000 [2],
400–800 [26],
1411–1628 [18]
2–120 [2],
2–50 [13],
1–140 [9]
217–271 [18]
Medium/Low [2,9,12,13]
Pb-A300–600 [2,13],
200–300 [12],
326–651 [18]
200–400 [2,13,29]
120–150 [12],
50–1100 [9],
54–337 [18]
High [9,12,13]
Ni-Cd500–1500 [2]400–2400 [2],
800–1500 [11],
330–3500 [9]
High [9,12]
Na-S1000–3000 [2,13,26],
380–3256 [18]
300–500 [2,13],
150–900 [9],
326–543 [18]
High [9,12]
NaNiCl2150–300 [26]100–200 [26]
100–345 [9]
Medium/low [9]
Li-ion900–4000 [2],
1200–4000 [12,13],
1303–4342 [18]
600–3800 [2],
300–1300 [12]
2000–4000 [9]
600–2500 [27,29]
651–2714 [18]
Medium/Low [9,12]
VRFB600–1500 [12],
651–1628 [18]
150–1000 [12,29]
100–2000 [9],
190–1085 [18]
Medium/Low [9,12]
SCES100–450 [2],
271–480 [18]
300–2000 [2],
100–94,000 [9]
Very low [9,12]
SMES200–489 [2],
200–300 [13],
217–326 [18]
1000–10,000 [13],
5000–1,080,000 [9],
1085–10854 [18]
Low [9,12]
Source: Authors’ (collated from difference source).
Publisher’s Note: MDPI stays neutral with regard to jurisdictional claims in published maps and institutional affiliations.

