Article

Lignite Improved the Quality of Composted Manure and Mitigated Emissions of Ammonia and Greenhouse Gases during Forced Aeration Composting

1
School of Agriculture and Food, Faculty of Veterinary and Agricultural Sciences, The University of Melbourne, Parkville, VIC 3010, Australia
2
Department of Earth and Atmospheric Sciences, The University of Alberta, Edmonton, AB T6G 2R3, Canada
*
Authors to whom correspondence should be addressed.
Sustainability 2020, 12(24), 10528; https://0-doi-org.brum.beds.ac.uk/10.3390/su122410528
Submission received: 19 November 2020 / Revised: 8 December 2020 / Accepted: 9 December 2020 / Published: 16 December 2020
(This article belongs to the Special Issue Environmental Science and Sustainable Waste Management)

Abstract

:
Lignite amendment of livestock manure is considered a viable ammonia (NH3) emission mitigation technique. However, its impact on the subsequent composting of the manure has not been well studied. This work compared changes in biochemical parameters (e.g., organic matter loss and nitrogen (N) transformation) and also the emissions of NH3 and greenhouse gases (GHGs) between lignite-amended and unamended cattle manure during forced aeration composting. Amending manure with lignite did not alter the time to compost stability despite delaying the onset of the thermophilic temperatures. Lignite treatments retained N in the manure by suppressing NH3 loss by 35–54%, resulting in lignite-amended manure composts having 10–19% more total N than the unamended compost. Relative to manure only, lignites reduced GHG emissions over the composting period: nitrous oxide (N2O) (58–72%), carbon dioxide (CO2) (12–23%) and methane (CH4) (52–59%). Low levels of CH4 and N2O emissions were observed and this was attributed to the continuous forced aeration system used in the composting. Lignite addition also improved the germination index of the final compost: 90–113% compared to 71% for manure only. These findings suggest that lignite amendment of manure has the potential to improve the quality of the final compost whilst mitigating the environmental release of NH3 and GHGs.

1. Introduction

The desire for efficient and improved livestock production technologies, driven by increasing global population and the demand for animal products, has stimulated the expansion of intensive livestock production systems [1,2]. These intensive systems are characterised by the generation and accumulation of large volumes of manure, often in excess of the fertiliser requirement of nearby agricultural fields [3,4]. Though this manure contains valuable organic matter (OM) and plant nutrients [5], it also accounts for a significant percentage (~39%) of anthropocentric atmospheric NH3, driven by the urease catalysed hydrolysis of urea in the manure [6,7]. The emission of NH3 from manure leads to both environmental damage (e.g., formation of particulate matter—PM2.5, eutrophication, soil acidification and the contribution to indirect N2O emissions) and economic loss (e.g., reduction in N content of manure and pollution remediation cost) [8,9,10].
A number of mitigation techniques have been shown to reduce NH3 loss from manure. These include the use of acidifying agents (e.g., alum and calcium chloride) and urease inhibitors (e.g., phenyl phosphorodiamidate and N-(n-butyl) thiophosphoric triamide). These amendments, however, require frequent application, resulting in a higher production cost [11,12]. Other mitigation techniques involve the reduction in dietary crude protein (with potential loss of animal productivity) [13] and manure compaction and covering (only applicable to harvested and stockpiled manure, which does not address the significant NH3 loss that occurs in the animal pen) [14]. Lignite (brown coal)—a product of the first stage of coalification and intermediate between peat and sub-bituminous coal [15]—has been shown to be a cost-effective, practical and potentially long-lasting alternative for mitigating N loss from manure [16].
Lignite application, 3–6 kg m−2, to the surface of feedlot cattle pens (prior to the introduction of cattle) reduced NH3 volatilisation from manure by 30 to 66%, relative to manure in untreated pens [16,17]. Dana and Ardeshir [18] reported a 47 to 91% reduction in NH3 loss from broiler litter following the application of 10 to 30% lignite. The ability of lignite to suppress NH3 loss from manure has been attributed to the high pH buffering capacity and low pH of the lignite, which shifts the NH3/NH4+ equilibrium ratio towards non-volatile NH4+. In addition, it has been suggested that NH4+ adsorption owing to the high cation exchange capacity (CEC), biological immobilisation of N due to labile C and inhibition of urease activity due to the humic acid content of the lignite leads to the reduction in NH3 volatilisation [16,17,19]. Lignite is also rich in pore structures, which contributes to its ability to retain NH4+ [20].
Composting is a major recycling option for manure generated in intensive animal production systems, as it enables the destruction of pathogens and weed seeds in the manure and also results in a stabilised product [3,21]. The characteristics of the feedstock (e.g., pH, OM and nutrient composition) have a significant influence on compost parameters such as temperature, microbial activity and OM decomposition rate during the composting process and also the quality of the final compost [22,23]. Though lignite is effective in mitigating N loss from manure, its effect on the manure composting has not been well studied. There are very limited studies detailing the influence of lignite on the biochemical process (e.g., N transformation and OM decomposition) and gaseous emissions (e.g., NH3, N2O, CO2 and CH4) that occur during composting, as well as the quality of the final compost. Cao et al. [24] observed a 25% increase in the total N content of composted lignite-amended chicken manure, compared to the unamended manure, due to the adsorption of NH4+ by acid groups in the lignite. The study, however, did not assess the effect of lignite addition on the emissions of NH3 and greenhouse gases (GHG) that occur during the composting process. Bai et al. [25], who assessed the effect of lignite on gaseous emissions during windrow composting under open field conditions, reported that lignite reduced NH3 emission by 54%, compared to manure only, but resulted in a 2.6-fold increase in total GHG emissions (N2Oand CH4). The increase in GHG emissions was suggested to be due to the lignite creating anaerobic conditions within the windrow (most likely due to the smaller particle size of the lignite, enhanced by the predominantly passive windrow aeration method used). Other studies on the use of lignite in composting have focused on the removal of antibiotic resistance genes [26] and the suppression of odorous emissions [27]. In addition, by-products or derivatives of lignite such as fly ash and humic acid extracts have been used in composting [28,29]. However, there are no studies detailing the effect of lignite on both the manure composting process and gaseous emissions under a controlled composting environment.
The objective of this study was to determine the effect of lignite amendment on cattle manure composting and the quality of the final compost by assessing (i) changes in biochemical parameters, (ii) GHG and NH3 emissions, and (iii) compost stability indices. The study was conducted using an in-vessel composting system with continuous forced aeration in order to optimise the composting process. Two lignites, one of them similar to the one used by Bai et al. [25] and another from a different open cut mine, were used in the preparation of the feedstocks for composting. This was to assess, relative to the unamended manure, if the two lignites affected manure composting differently.

2. Materials and Methods

2.1. Raw Materials and Preparation of Feedstocks for Composting

The manure was collected from a commercial beef cattle feedlot located in Victoria, Australia (36°21′18.4″ S 143°25′28.2″ E). The chemical properties of the manure are presented in Table S1 (supplementary material). Two lignites, Bacchus Marsh (BM) and Loy Yang (LY), were respectively sourced from the Maddingley and Loy Yang open cut mines located in Victoria. Representative samples were taken from stockpiles of crushed lignite (recently excavated). While both lignites were strongly acidic, the BM lignite was more saline and contained higher amounts of N and all elements (except for total C and aluminium) than the LY lignite (Table S1, supplementary material).
Lignite-amended feedstocks were prepared by mixing separate samples of manure with the BM lignite (MBM) and the LY lignite (MLY), so that the proportion of the lignite in the manure-lignite mix was 20% w/w (equivalent to 45 t dry lignite ha−1). This rate was identified as suitable for N retention based on previous studies with cattle manure by Chen et al. [16] and Sun et al. [17]. A third composting feedstock, made up of manure alone (CT), served as the control. The feedstocks were prepared so as to simulate the generation of manure in a cattle pen, with and without lignite. In a typical feedlot, it is estimated that up to 67% of excreted N in cattle manure could be lost through NH3 volatilisation from the pen surface [30]. In order to replenish the N lost prior to the manure collection and to allow for N retention by the lignite (similar to what would occur in a lignite treated cattle pen), urea solution was added, at 2-day intervals for a period of 10 days, to all feedstocks after spreading them on impervious mats. The amount of urea added (a total of ~60 g kg−1 dry manure) was based on the difference between the expected N (~5% of total solids) in freshly excreted manure [31] and the N content (2.13%) of the collected manure. The feedstock was mixed after each addition of urea to ensure uniform distribution and was collected 4 days after the final urea addition and stored under ambient conditions prior to composting.

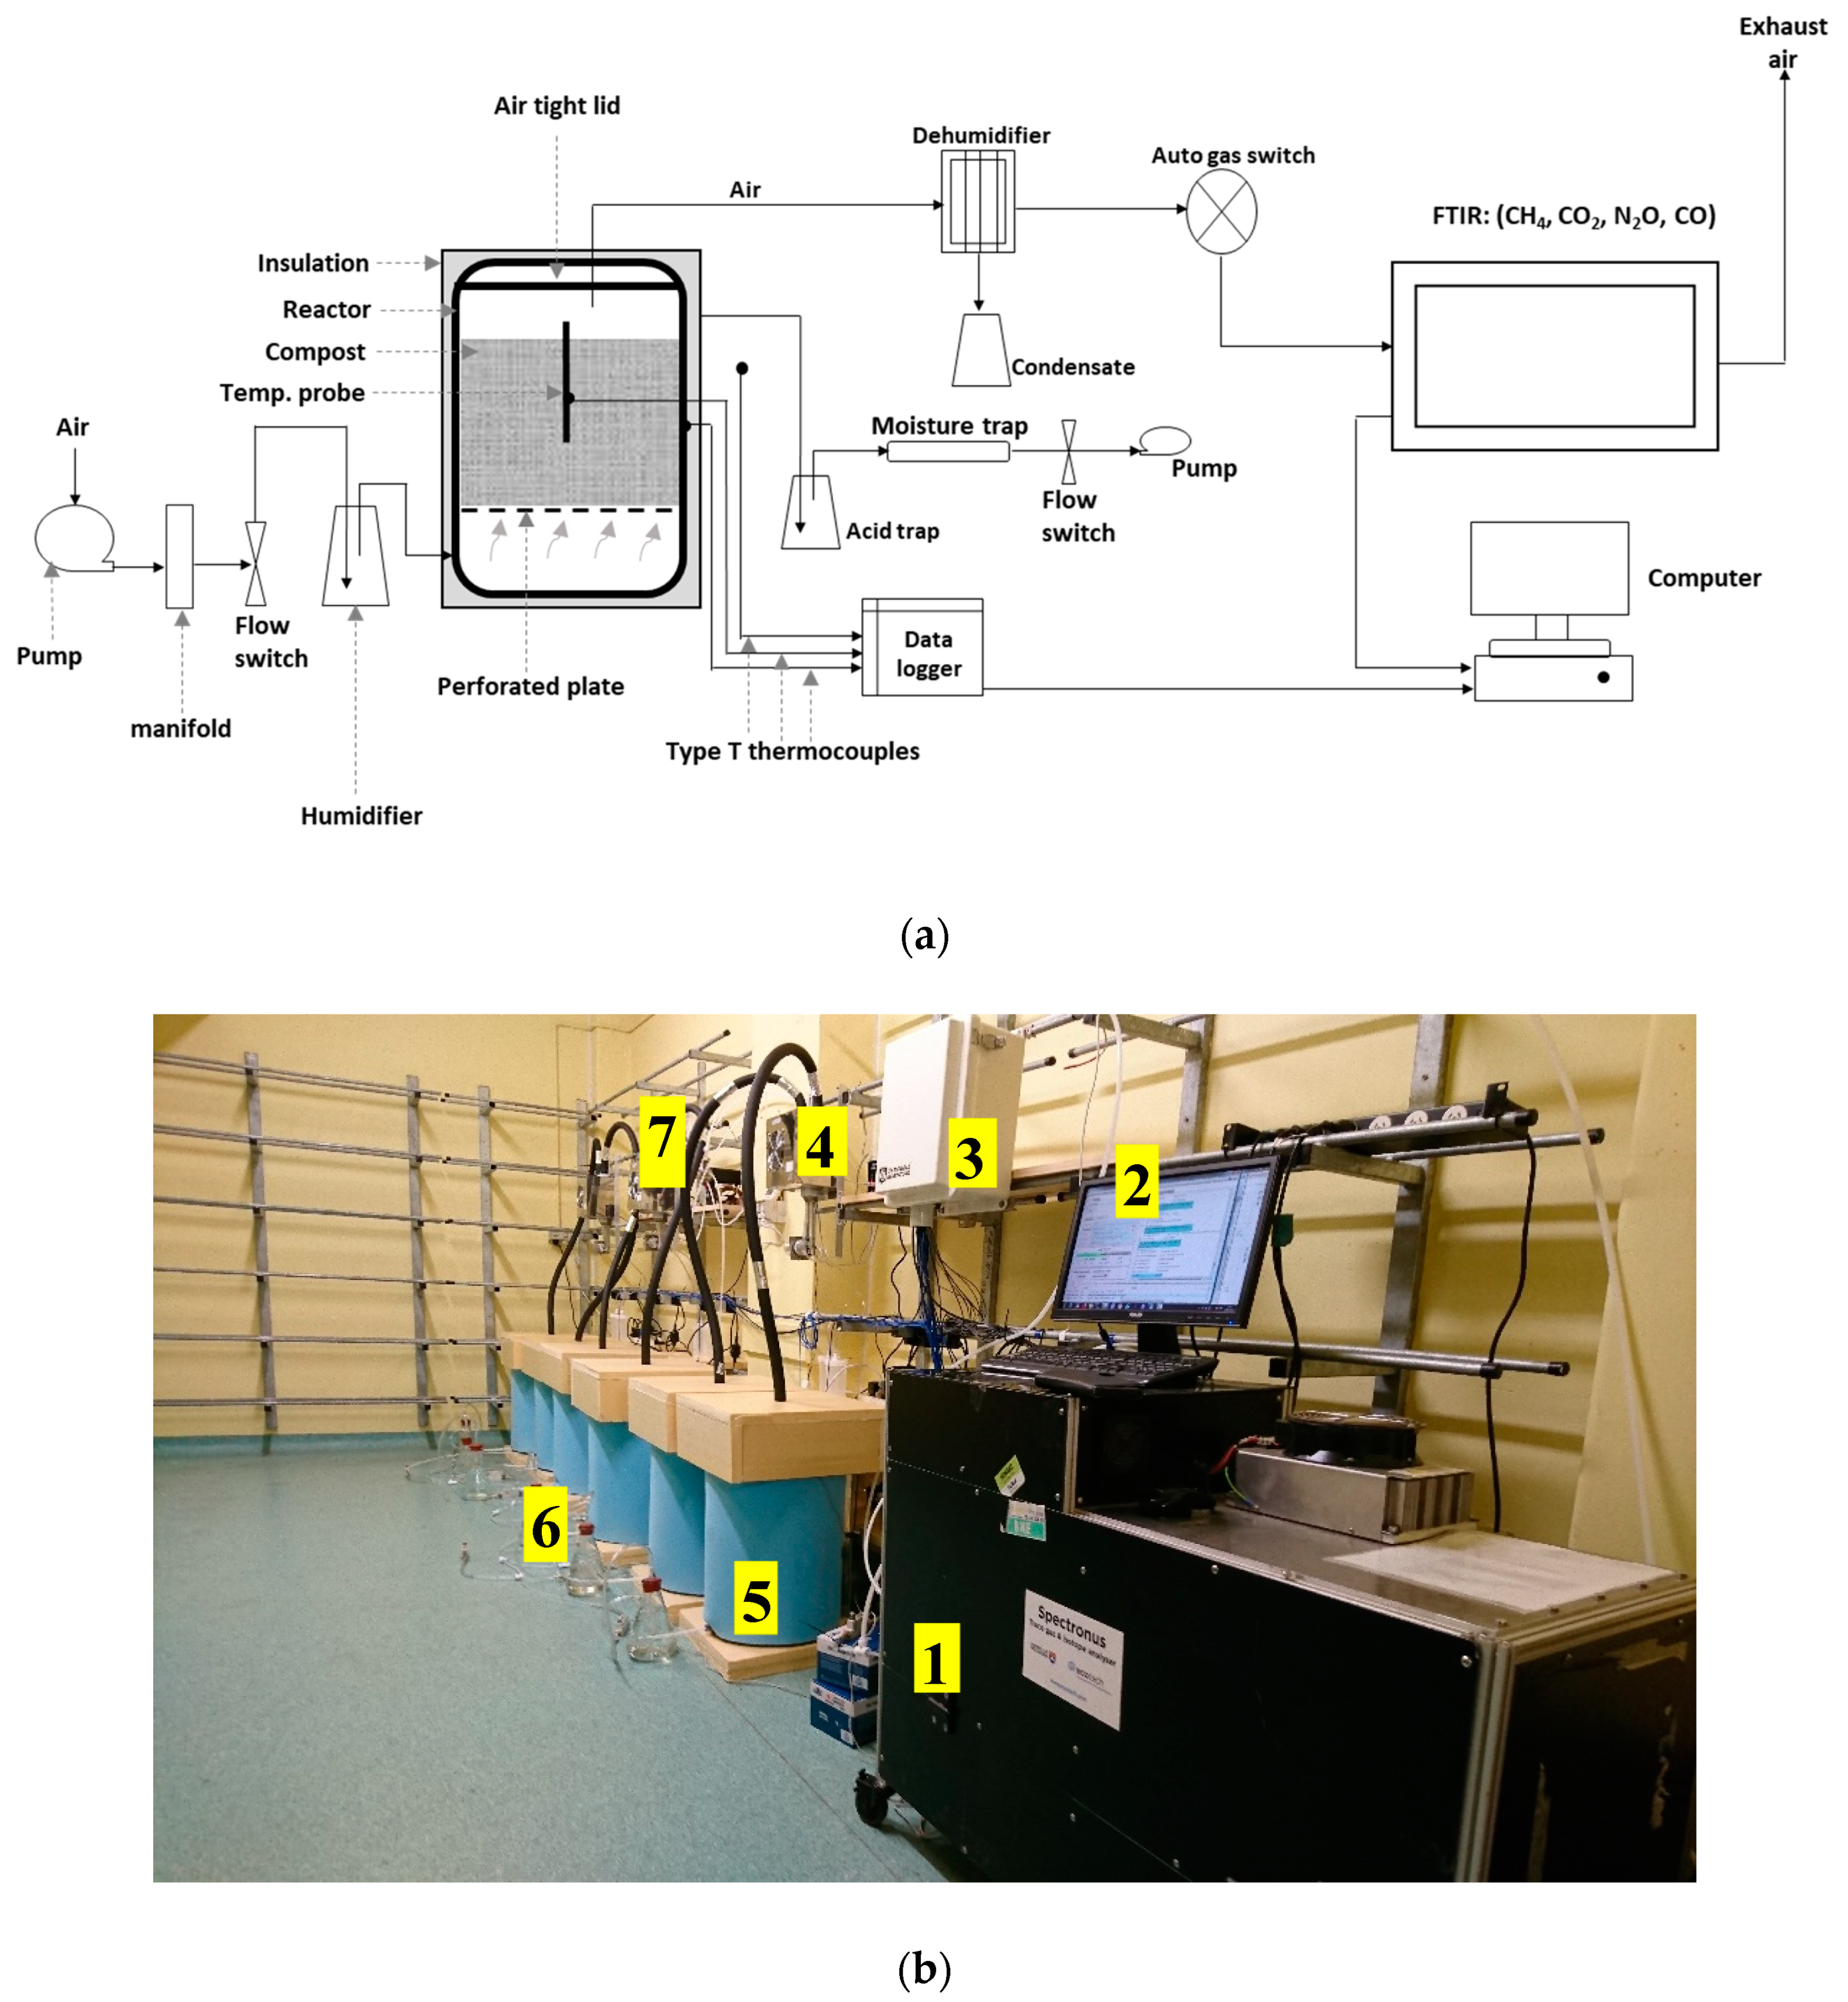
2.2. In-Vessel Composting System

The in-vessel composting system consisted of six 60 L vessels, 60 cm in depth and 40 cm in diameter. Each vessel had a perforated plate, 12 cm from the base of the vessel, for even distribution of air and two type-T thermocouples, one at the centre of the vessel and the other inside the wall of the vessel, for temperature measurements. Temperature was controlled within each vessel with a heat cable coiled around the outside of the vessel and covered with a 0.5 cm thick insulation mat. The heating cable was automatically activated by a CR23x Micrologger (Campbell Scientific Inc., Logan, UT, USA) when the vessel wall temperature was cooler than the compost temperature. The top and bottom of each vessel was capped with polystyrene to reduce heat loss. Humidified air (to minimise drying of the composting material) was continuously supplied to all vessels using a pump (KNF Neuberger, N840.3FT.18) at a constant rate of 0.21 L min−1 kg−1 initial feedstock dry matter (DMi). The air exiting the composting vessels, as well as the background air (for calibration), was dehumidified (Kelk DH-209C) and sent to a closed path Fourier Transform Infrared Spectrometer (FTIR) (Spectronus, Ecotech Group, Knoxfield, VIC, Australia) for gaseous (CO2, CH4 and N2O) measurements [32]. Air stream switching was accomplished using a Valco 8-port gas valve (Valco Instruments Co. Inc., Houston, TX, USA) set to a 30-min sampling sequence. Ammonia concentration was measured separately using an acid trap supplied with subsampled vessel air at a rate of 0.5 L min−1 and acid traps were replaced at 24 h intervals. The oxygen level of the exhaust air was monitored with an O2 sensor (SO-210, Apogee Instruments, Inc., Logan, UT, USA). A schematic diagram and photograph of the composting system are shown in Figure 1a,b, respectively.

2.3. Composting and Sampling Procedure

Six composting vessels were constructed, and, in order to attain sufficient replication, four replicates of the three treatments were put through the vessels in two batches, i.e., two replicates of each treatment per batch. Results reported are averages of the four replicates.
Prior to a composting run, the moisture content of each feedstock (CT, MBM and MLY) was adjusted to 55% w/w, before loading into each vessel at a rate of 7 kg DM per vessel. During the composting period, the vessels were opened at 3-day intervals for compost sampling. Collected samples were immediately frozen at −20 °C for subsequent analyses. Collected acid trap samples were analysed colourimetrically for NH4+-N using a Skalar SAN++ segmented flow analyser.

2.4. Sample Analysis and Gas Measurement

Subsamples of raw materials, feedstocks and compost were acidified to pH ≤ 5 with 3 M H2SO4 before oven-drying at 60 °C for 48 h for total and mineral N analyses, to minimise N loss through NH3 volatilisation [33,34]. All other analyses were conducted on unacidified samples. The electrical conductivity (EC) and pH were measured at a solid extract ratio of 1:5 w/v using a pH/EC meter (TPS, smartCHEM-LAB). The moisture and OM contents were determined after drying the samples at 105 °C for 24 h in an oven and ashing at 550 °C for a further 24 h in a muffle furnace, respectively [35]. Total C and N were analysed using a LECO Trumac CN Elemental Analyzer. Mineral N (NH4+-N and NO3-N) was analysed using a Skalar SAN++ segmented flow analyser following extraction of the samples with 2M KCl at sample to extract a ratio of 1:60 [36]. Total element concentrations were determined after the manner of Wolf et al. [36] by digesting oven-dried samples (0.5 g) with 5 mL concentrated HNO3 and 3 mL 30% H2O2 at 60 °C for 0.5 h and then at 120 °C until the digest became clear, after which they were diluted to 50 mL, filtered and analysed by ICP-OES (Perkin Elmer Optima 8300 DV-radial view). Emissions of CO2, CH4 and N2O in the exhaust air were measured using a closed path FTIR [32]. The ammonia emitted from the compost was captured by bubbling the exhaust air, at 0.5 L min−1, through a flask containing 150 mL of 0.3M H3PO4 and the NH4+ in acid was analysed with a Skalar SAN++ segmented flow analyser.

2.5. Germination Index

The germination index (GI), a compost phytotoxicity test, was used (along with CO2 evolution rate) in monitoring the stability of the compost. The GI was determined using a modified method of Tiquia [37]. Extracts from compost samples were prepared by shaking samples with distilled water at 1:10 w/v ratio end-over-end for 1 h, followed by centrifuging and filtering. Ten cress (Lepidium sativum L.) seeds were placed in a Petri dish (9 cm diameter) lined with Whatman number 42 filter paper and containing 3 mL of the filtered compost extract. Distilled water was used as the control. The Petri dishes were covered with Parafilm to minimise moisture loss whilst allowing air exchange [38] and kept in the dark in an incubator at 25 °C for 48 h. The germinated seeds were counted, and the length of the primary root measured in both the compost extract and control (water). Seeds with radicle length of >2mm were considered germinated [39].

2.6. Calculations

The flux of CO2, CH4 and N2O from each compost vessel (exhaust) and background (intake) was determined using Equation (1):
Gas   flux   ( g   min 1 ) = [ Gas ] × 10 6 × P × A × M G R × T  
where [Gas] is the concentration of the gas (ppm), P is the pressure (hPa), A is the air flow rate, MG is the molar mass of gas, R is the ideal gas constant (m3 hPa mol−1 K−1) and T is the temperature (K). The flux for the vessel is the difference between the intake and exhaust air.
Ammonia flux (F) was calculated using Equation (2) [40]:
F = R V × C A M
where RV is the air volumetric flow rate (m3 day−1), CA is the NH3 concentration in the air (g N m−3) and M is the mass of composting material. CA was derived from the measured NH3 concentration in the acid solution (CS), the volume of acid solution (VS) and volume of air passed through the acid trap (VA):
C A = C S V S V A
Losses of OM, total N and C were calculated using Equations (4) and (5). The final DM at the end of the composting period was calculated using Equation (6) [3,41];
O r g a n i c   m a t t e r   l o s s   ( % ) = 100 100 × ( X 1 ( 100 X 2 ) X 2 ( 100 X 1 ) )
T o t a l   N   o r   T o t a l   C   l o s s   ( % ) = 100 100 × ( X 1 Y 2 X 2 Y 1 )
F i n a l   d r y   m a t t e r   ( g ) = i n i t i a l   d r y   m a t t e r × X 1 X 2
where X1 and X2 are the initial and final ash contents (%), respectively, of the compost; Y1 and Y2 are the initial and final total N or total C concentrations, respectively.
The GI was calculated using Equation (7);
G I = S e e d   g e r m i n a t e d   i n   e x t r a c t   × R o o t   l e n g t h   i n   e x t r a c t   ( mm ) S e e d   g e r m i n a t e d   i n   w a t e r   ×   R o o t   l e n g t h   i n   w a t e r   ( mm ) × 100

2.7. Statistical Analysis

A one-way analysis of variance (ANOVA) test was carried out on the properties of the feedstock and final compost using GenStat 16 (VSN International UK). The Tukey HSD test was used to assess significant differences between treatment means at a 5% probability level. Gas and temperature data obtained from the FTIR and Datalogger were processed using SAS software 9.4 (SAS Inc., Cary, NC, USA).

3. Results and Discussion

3.1. Characteristics of Feedstocks

The pHwater of the feedstocks was alkaline: 7.3, 7.4 and 7.2 for CT, MBM and MLY, respectively (Table 1). Mixing manure with lignite did not create acidic pH conditions in the mix, likely due to the acidity of the lignite being neutralised by the manure. The lignite-treated feedstocks had higher total C (36.1% for MBM and 35.3% for MLY) compared to the CT (26.8%), and this was attributed to the higher total C of the lignites (57–62%). A similar observation was made with respect to the OM content of the feedstocks. Similar to other studies demonstrating lignite’s ability to retain N in manure [16,17], all lignite-amended manures had higher total and NH4+-N than the CT.

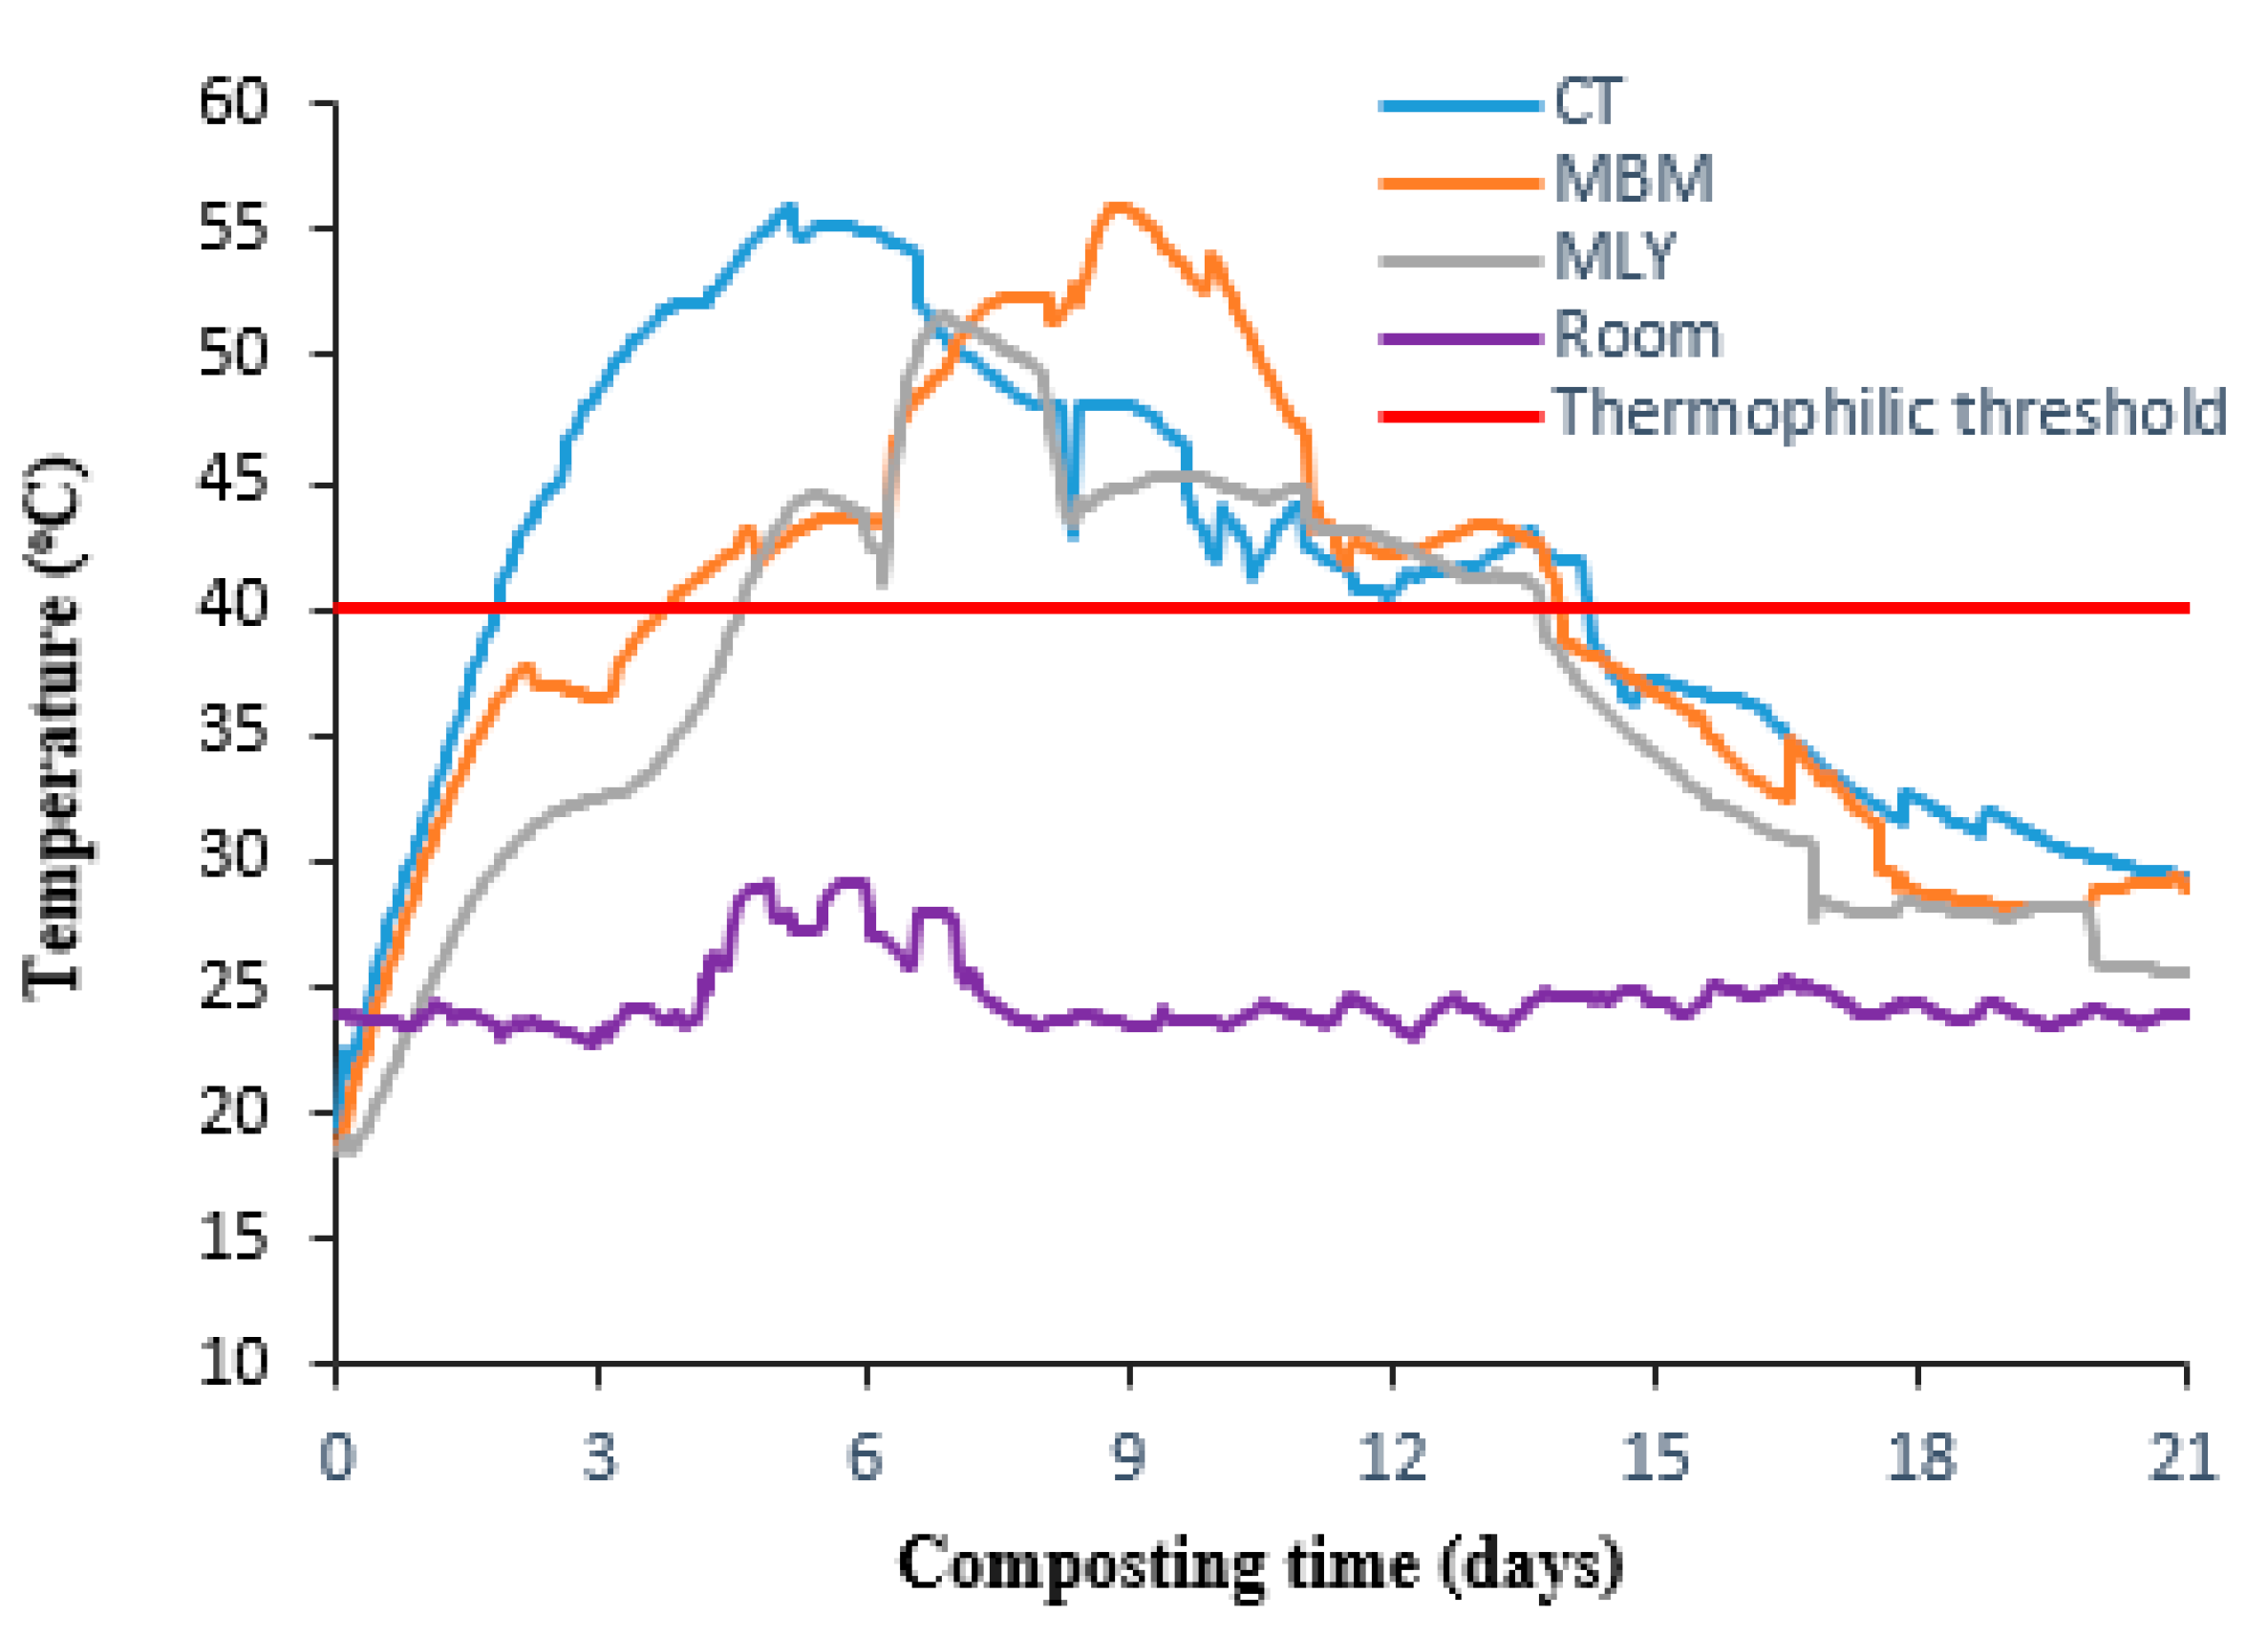
3.2. Changes of Temperature

Though the changes in compost temperature followed a similar pattern for all treatments, lignite delayed both the onset of the thermophilic phase (>40 °C) and the time taken to attain the maximum temperature (Figure 2). The average onset of the thermophilic threshold for CT was 1.8 days (lasted about 12 days) from the start of the composting process, compared to 3.6 days (lasted about 10 days) for MBM and 4.5 days (lasted about 9 days) for MLY. Likewise, the maximum temperature for the CT (56 °C) occurred 5 days from the start of composting, compared to 9 days for MBM (56 °C) and 7 days for MLY (51 °C). The rise in temperature at the beginning of composting marks the onset of the rapid breakdown of the labile fraction of OM by microorganisms [42]. The delay in the attainment of thermophilic and maximum temperatures in the lignite treatments was likely due to lower microbial activity, especially at the initial phase of the composting process (indicated by the lower evolution of CO2, see Section 3.4.2). This is supported by previous work by Tran et al. [43], who observed a significantly lower respiration rate in lignite-amended soils during the first three days of incubation, and Whiteley and Pettit [29] who reported a significant reduction in microbial O2 consumption and CO2 evolution during the decomposition of wheat straw in the presence of lignite humic acid. The authors suggested that lignite’s inhibitory effect on microbes occurs through the physical protection of the substrate, and also the release of microbial toxins from the lignite. In all treatments, the end of the thermophilic phase occurred around day 14, after which the temperature steadily declined to ambient likely due to depletion in the labile fraction of OM and reduction in microbial activity [3].

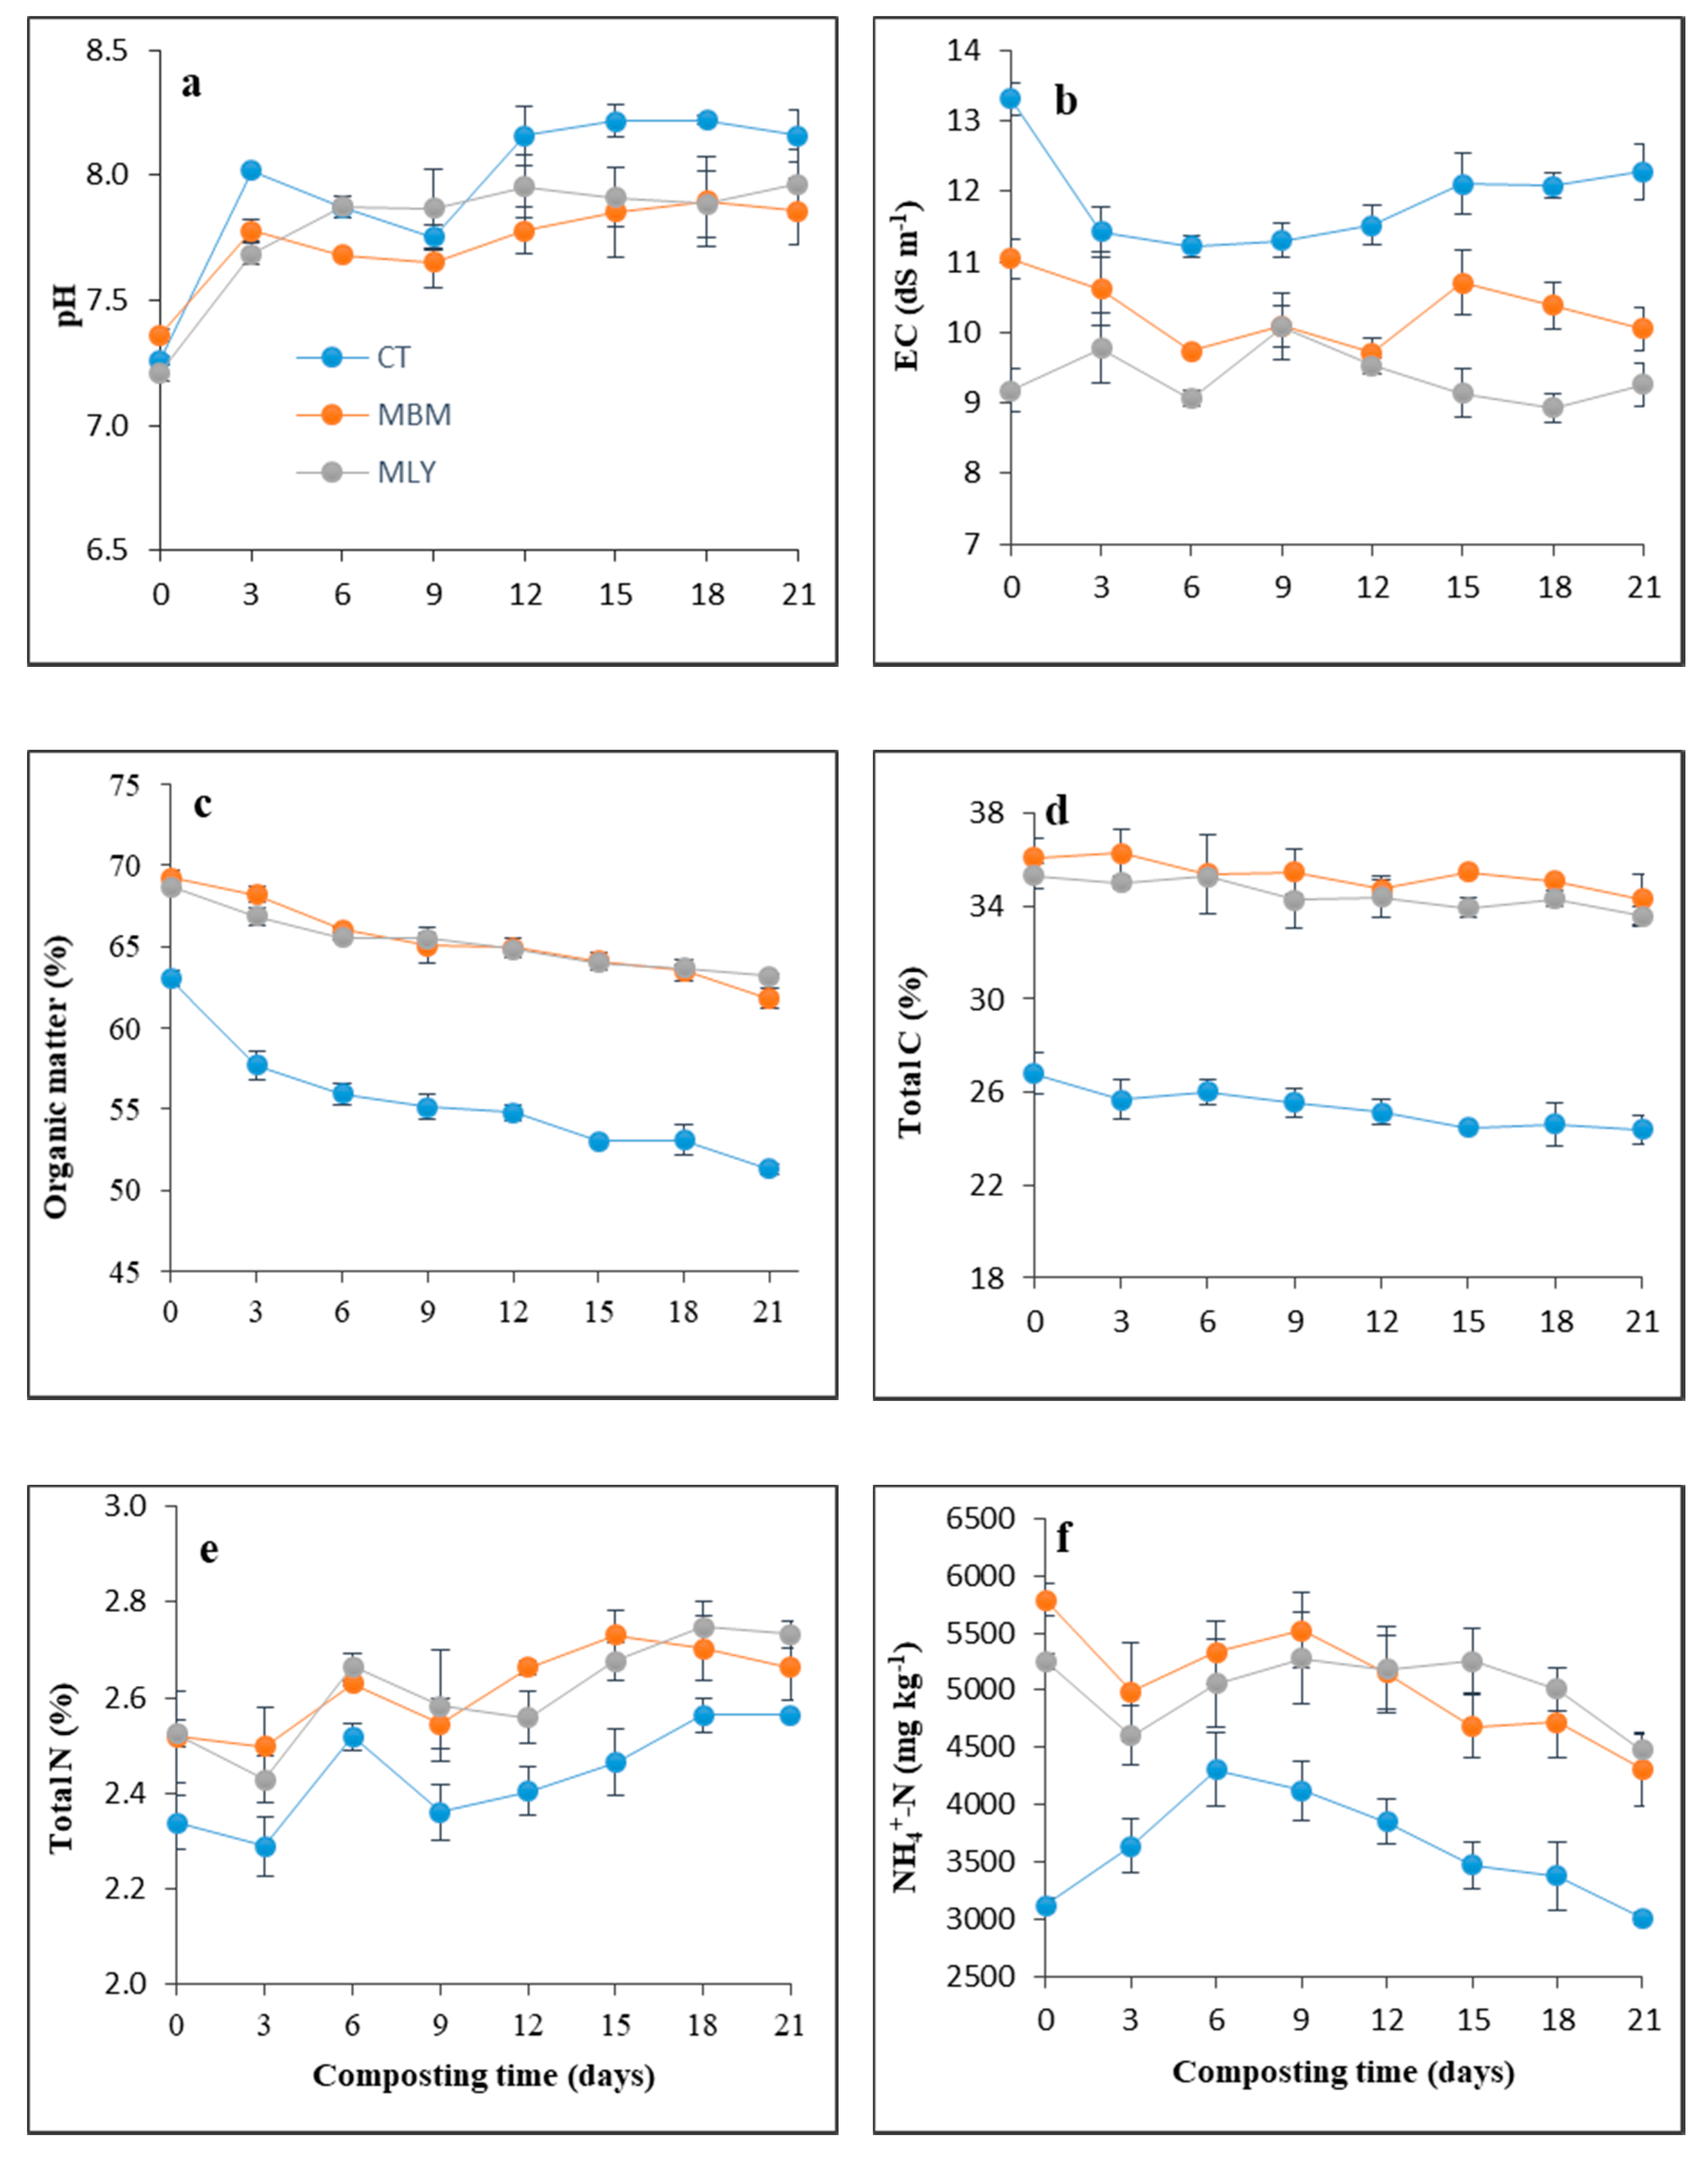
3.3. Changes of pH, Electrical Conductivity, Organic Matter, Total Carbon and Nitrogen

In all treatments, pH increased by day 3 (Figure 3a) likely due to the rapid degradation of acids, proteolysis and ammonification at the onset of composting [44,45]. The increase in pH was greater in the CT compared to the lignite treatments, attributed to the delayed onset of rapid organic matter degradation, as indicated by the slower rise in temperature in the lignite treatments (Figure 2), as well as the ability of lignite to buffer changes in pH. The drop in pH between days 3 and 9 in the CT and MBM treatments was likely due to the formation of organic acids and secondary acid metabolites, as well as the dissolution of CO2 within the compost [33,46]. The subsequent decomposition of these organic acids and secondary acid metabolites leads to a rise in pH during composting, a typical pattern for composting. There was an increase in pH, relative to the initial pH, of all treatments by the end of the composting period, with no significant difference between CT and lignite treatments: from 7.26 to 8.16 for CT, 7.36 to 7.97 for MBM and 7.21 to 7.86 for MLY.
Throughout the composting period, the EC of the lignite treatments was lower than the CT (Figure 3b), and this was as a result of the low EC of the lignites (2.1 dS m−1 for BM and 0.2 dS m−1 for LY (Table S1)) compared to the CT (13.1 dS cm−1) causing a dilution effect. Moreover, lignite’s ability to reduce microbial activity likely minimised the release of inorganic ions like NH4+ from OM mineralisation, which has been associated with increased EC [45]. The EC of the CT treatment decreased from day 0 to day 6 of composting and then increased gradually for the rest of the composting period, which can be explained by the concentration of salt due to OM loss [47]. There was no consistent trend in EC changes in lignite treatments, although the MLY generally decreased between day 9 and 21. The final compost of the CT, however, had significantly higher EC (12.3 dS m−1) compared to the lignite treatments (9.3–10.1 dS m−1) (Table 1).
The mineralisation of OM by microorganisms produces CO2, NH3, water, organic acids and heat, leading to OM loss [3]. Compared to the CT, lignite inhibited the loss of OM, corresponding to a smaller C loss, during composting (Figure 3c,d). The cumulative OM loss at the end of the composting was 38.2% (from 4412 g to 2726 g), 28.2% (from 4847 g to 3480 g) and 21.7% (from 4808 g to 3763 g) in the CT, MBM and MLY, respectively (Table 2). The corresponding loss of total C was 32.4, 23.6 and 19.7%. The smaller OM reduction in the lignite treatments could be due to the inhibition of microbial activity at the start of the composting period, as discussed under Section 3.1, above. Overall, DM loss in lignite treatments over the composting period was 14.9–19.5%, compared to 24.1% for the CT (Table 2).
A decrease in the concentration of total N during composting has been attributed mainly to NH3 volatilisation [35]. An increase in concentration, on the other hand, is a result of OM loss and increasing the concentration of N [48,49]. In the CT and MLY treatments, there was a decrease in total N between day 0 and 3 (Figure 3e). In the CT treatment, this coincided with an increase in NH3 emission (Figure 4a). There was an increase in total N in all treatments by day 6, likely due to OM loss at the thermophilic phase of composting. From day 9, changes in total N generally followed an increasing trend with composting time. However, in the MBM the total N only increased till day 15 and then decreased for the remainder of the composting period. Total N in the lignite treatments remained higher than the CT throughout the composting period due to the higher total N in lignite treatments at the start of composting, as well as the suppression of NH3 loss (see Section 3.4.1, below). Cao et al. [24] reported that composted lignite-amended manure contained 25% more total N than composted manure only, and this was attributed to the adsorption of NH4+ by acid groups in the lignite. In this study, the total N lost, relative to the initial total N, at the end of the composting period, was 16.8, 14.9 and 7.9% in the CT, MBM and MLY, respectively (Table 2). This resulted in the lignite-amended manure composts containing 10-19% more total N than the CT.
An increase in NH4+ concentration during composting, especially during the thermophilic phase, has been attributed to OM mineralisation [50]. This explains the increase in NH4+ concentration in the CT between days 0 and 6 (Figure 3f), whilst in the lignite treatments the increase occurred from day 3, due to the delayed onset of the thermophilic phase. Processes that can decrease NH4+ concentration during composting include NH3 volatilisation, nitrification of NH4+ to NO3, biological immobilisation of NH4+ into organic N and nitrification-denitrification of NH4+ to N2 or N2O [3,51]. In this study, the reduction of NH4+ was mainly a result of NH3 emission (discussed in Section 3.4.1).

3.4. Gaseous Emissions

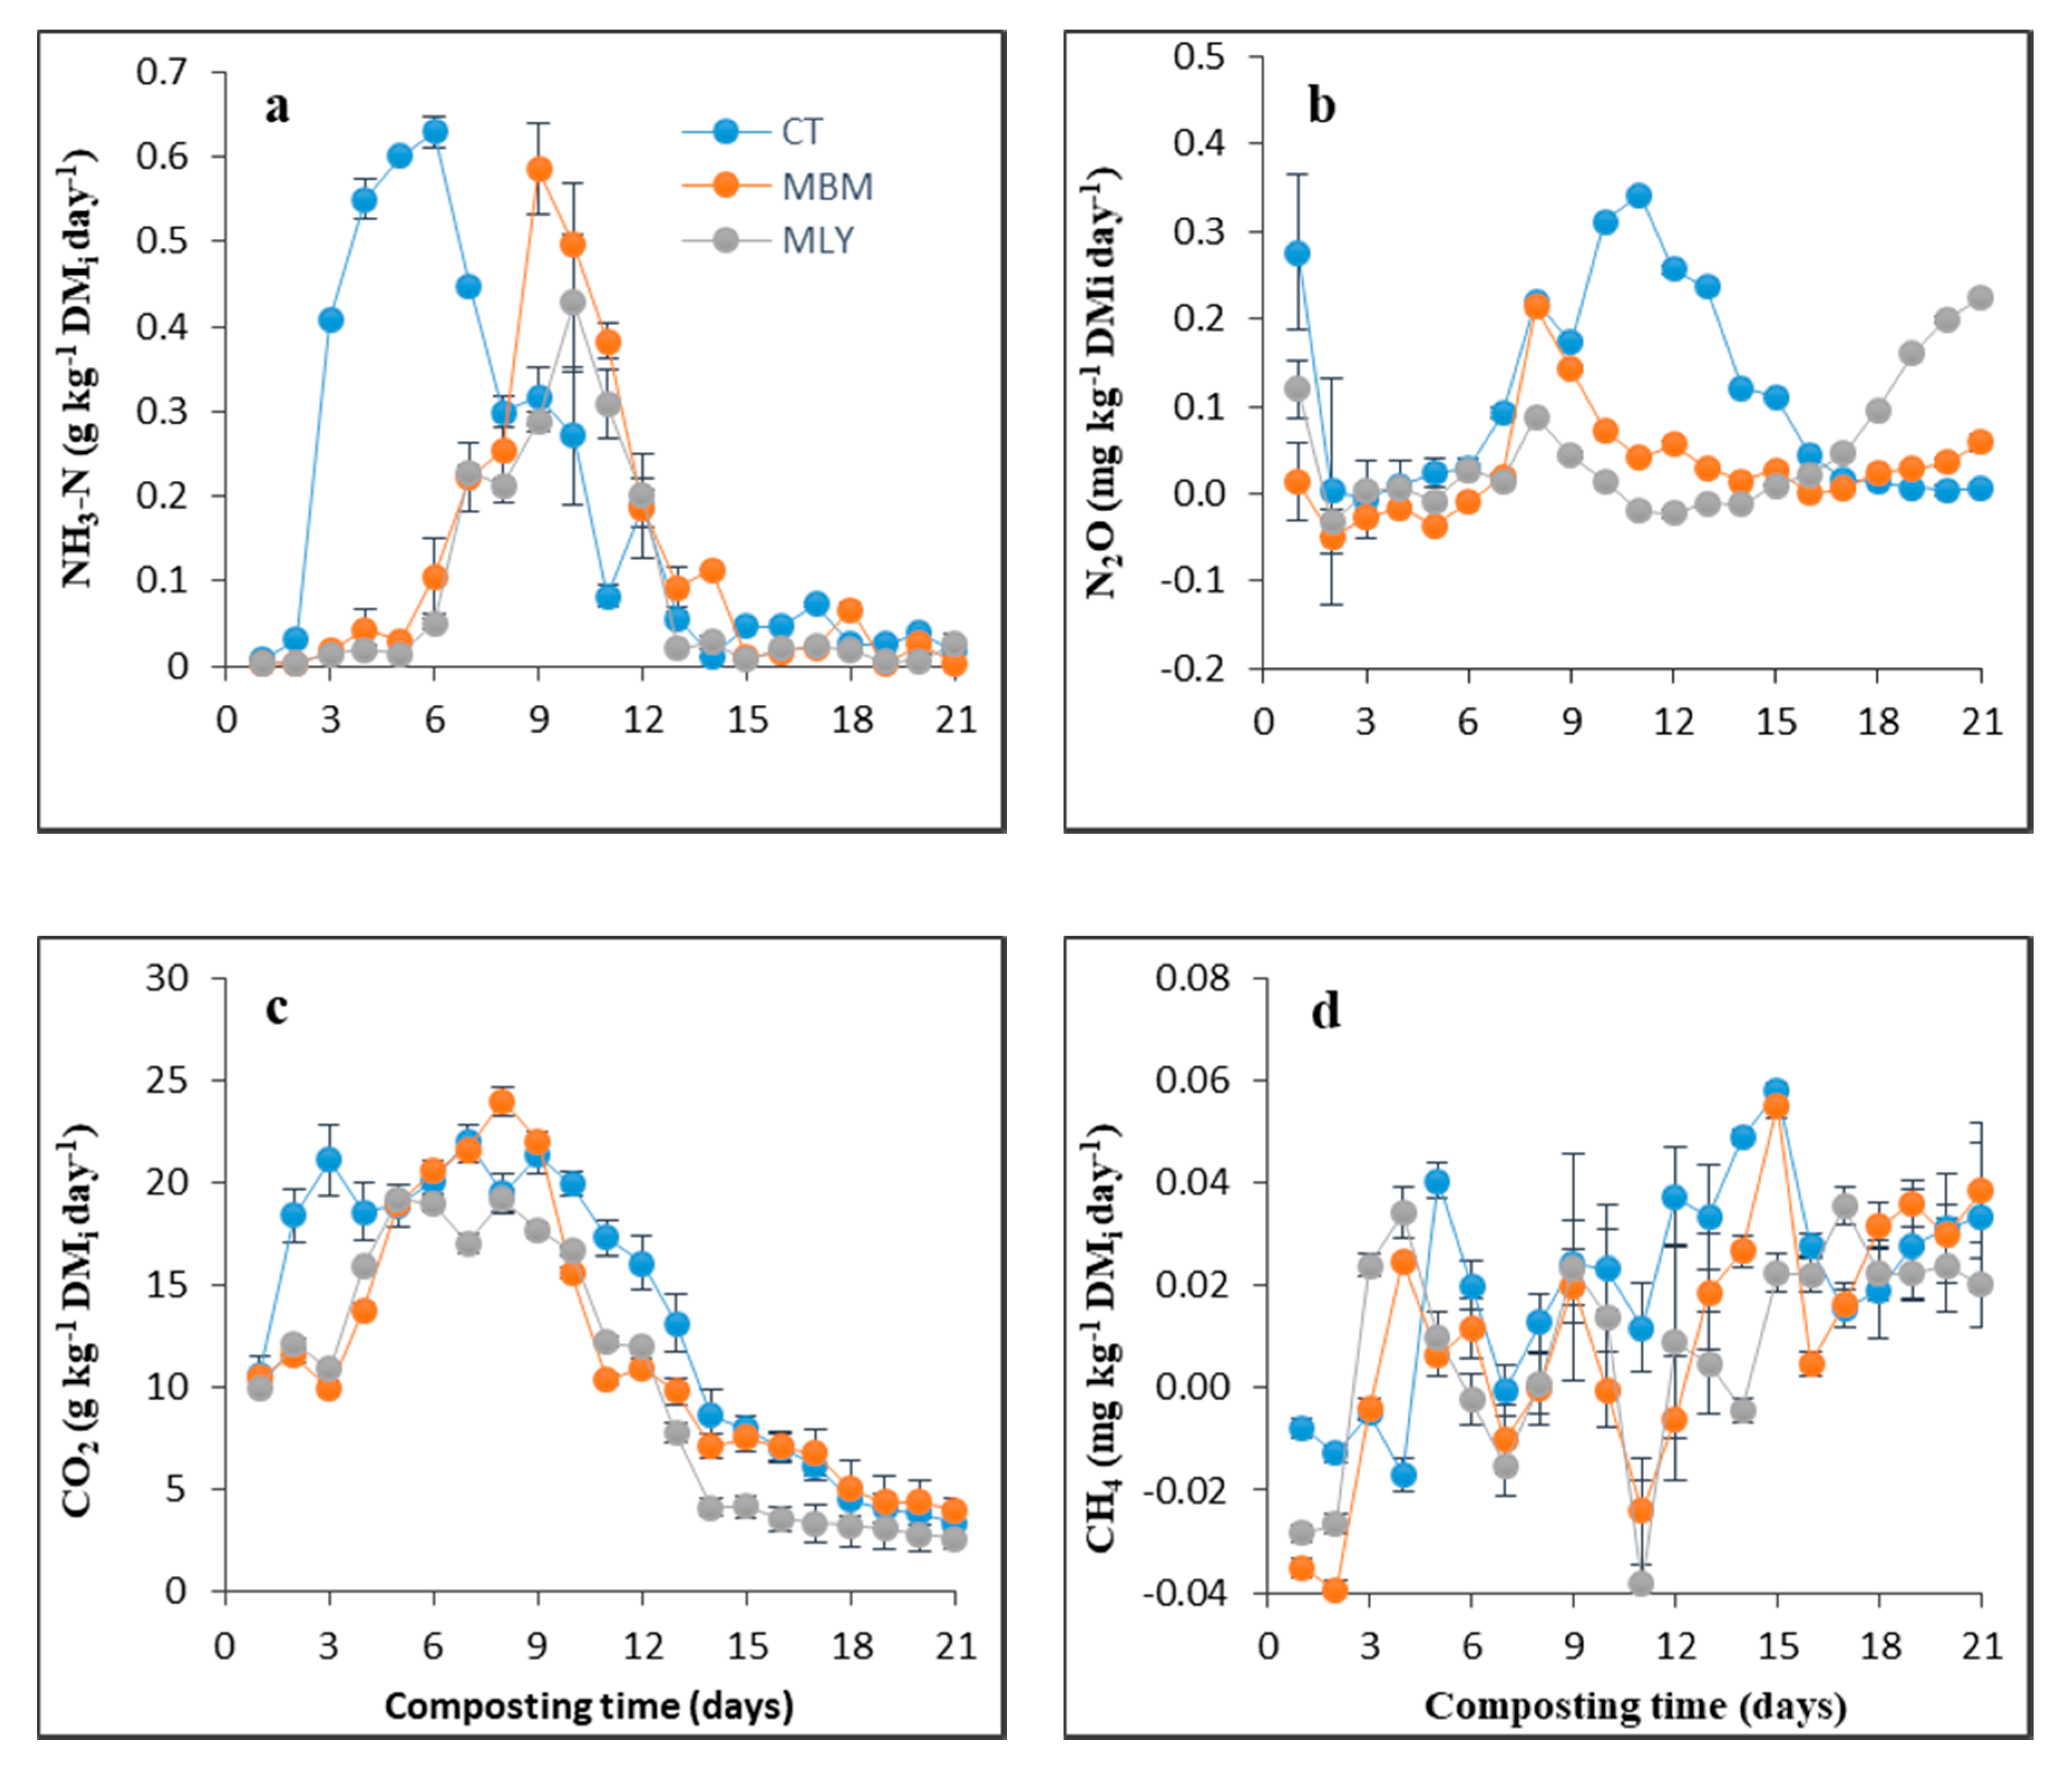
3.4.1. Ammonia (NH3) Emission

The observed increase in temperature and pH during composting will enhance the loss of NH3 by increasing the ratio of NH3 to NH4+. Following a similar trend as the temperature profile (Figure 2), the peak NH3-N emissions occurred earlier in the CT than in the lignite treatments (Figure 4a): 0.63, 0.59 and 0.43 g kg−1 DMi day−1 on days 6, 9 and 8 for CT, MBM and MLY, respectively. The cumulative NH3-N emitted by the end of the composting period was 4.19 (17.9% of initial N), 2.73 (10.8% of initial N) and 1.93 (7.6% of initial N) g kg−1 DMi for CT, MBM and MLY, respectively. This corresponds to the lignite suppressing NH3 emission, relative to the CT, by 35–54%. The capacity of lignite to suppress NH3 emission, under large-scale windrow manure composting, has been reported by Bai et al. [25]. The lignite suppressed NH3 emission most likely through the retention of NH4+ on its exchange site due to its high CEC, especially at the pH ranged (7.2–8.2) observed in this study. At this pH, the oxygen-containing functional groups in the lignite become deprotonated [52,53], and thus available for NH4+ retention. This reduces the NH4+ available for conversion to NH3 and subsequent volatilisation, particularly at high temperatures. This finding shows that the capacity of lignite to mitigate NH3 emission from raw manure (e.g., in cattle pen [16]) continues to persist even under composting conditions. Ammonia emission is one of the major drawbacks of manure composting, as up to 42% of the initial N can be lost mainly through NH3 emission [54]. Hence, lignite’s ability to reduce NH3 loss is important in terms of both improving the N content of the final compost and mitigating environmental pollution associated with NH3 emission.

3.4.2. Greenhouse Gas Emissions

The formation of N2O during composting is a result of incomplete nitrification or denitrification, which is favoured by anaerobic conditions [55,56]. During the first 8 days of composting, changes inN2O fluxes followed a similar pattern in all treatments with elevated fluxes at the start of composting, followed by a drop in the flux and a further rise (Figure 4b). The high fluxes seen at the start of composting were likely due to the release of N2O stored in anaerobic microsites within the feedstock during storage and released at the onset of composting due to increased temperature, and also due to the forced aeration [56]. In all treatments, there was higher variability in N2O fluxes among replicates during the first three days of composting (as indicated by the high error bars), likely due to the variation in the rise in temperature, than for the rest of the period (as indicated by the short error bars, masked by line symbols). In both MBM and MLY, the peak N2O flux was recorded on day 8 (0.21 and 0.09 mg kg−1 DMi day−1, respectively), whilst that of the CT treatment (0.34 mg kg−1 DMi day−1) occurred on day 11. The generation of N2O from the denitrification of NO3 usually occurs during the mesophilic phase because autotrophic nitrifier activity (which generates NO3) ceases at >40 °C [57]. However, some studies report that significant N2O emissions occur during the thermophilic phase of composting and suggested this could be due to the co-existence of aerobic and anaerobic conditions within the compost [58,59]. In this study, in all the treatments, a significant proportion of the N2O production, including the peak, happened during the thermophilic phase. Though O2 concentration was maintained at an optimum level, 15 to 20% (Figure S1, Supplementary Material) [22], throughout the composting period, it is possible that anaerobic sites existed within the compost mass, as the feedstock began to break down and compress soon after mixing/sampling. This was reflected in the trend of increasing CH4 emission with composting time (Figure 4d). The period of higher N2O emission in the CT, with the exception of day 1, coincided with the period of higher CH4 emission. The absence of NO3 in any of the treatment was most likely due to the NO3 produced being simultaneously denitrified to N2O. The cumulative N2O evolved by the end of the composting was 2.29, 0.64 and 0.89 mg kg−1 initial DM for CT, MBM and MLY, respectively. The cumulative N2O loss was much lower than the cumulative NH3 loss (1.93–4.19 g kg−1 DMi). Hence, the reduction in NH4+ concentration with composting time (discussed in Section 3.3, above) was largely a result of NH3 volatilisation rather than denitrification of NO3 to N2O. Compared to the CT, lignite reduced the cumulative N2O evolved by 58–72%.
The pattern of CO2 fluxes was similar to the temperature profile for all treatments (Figure 4c), since the pattern of both parameters reflects microbial activity [60]. The CO2 flux was higher in the CT than the lignite-amended manures in the first 4 days and also from 10 to 14 days of composting. The reduction in fluxes in all treatments from day 14 onwards coincides with the end of the thermophilic phase (<40 °C) (Figure 2). Cumulative CO2 emitted over 21 days of composting was 280.9, 246.3 and 216.6 g kg−1 DMi for CT, MBM and MLY, respectively, with lignite reducing CO2 emission from the manure by 12-23%. The lower CO2 loss in the lignite-amended manures was likely due to inhibition of microbial activity by the lignite, particularly at the initial stage of composting (discussed under Section 3.2).
The formation of CH4 occurs through the reduction of CO2 by methanogens in anaerobic pockets within the compost [56]. Under predominantly aerobic conditions, CH4 can be oxidised to CO2 as it moves out of anaerobic pockets, and thus the net CH4 flux during composting is the balance of its production from anaerobic methanogenesis and oxidation by aerobic/anaerobic methanotrophy [61]. In this study, the cumulative CH4 emissions by all treatments (0.42, 0.20 and 0.17 mg kg−1 DMi for CT, MBM and MLY, respectively) were much lower than their corresponding cumulative CO2 emissions (280.9, 246.3 and 216.6 g kg−1 DMi). The low CH4 emission was attributed to the continuous forced aeration of the compost mass throughout the composting period. The negative CH4 fluxes recorded, especially in the lignite treatments, were likely due to periods where conditions within the compost favoured the activities of methanotrophs over methanogens. In all treatments, there was no consistent pattern of CH4 fluxes, and also high variability among treatment replicates between 9 and 13 (indicated by high error bars), though there was a general increasing trend with composting time (Figure 4d). The optimum oxygen concentration was maintained throughout the composting period, and thus the overall increasing trend in CH4 emission was likely a result of the breakdown or settling of the feedstocks, leading to oxygen-deficient sites, as composting progressed. It was observed during the sampling periods that the lignite treatments were less compacted compared to the CT. Amending manure with lignite reduced cumulative CH4 emission by 52-59%.
The total GHG (CO2-e) emitted over the composting period is presented in Table 3, with N2O accounting for almost all of the emitted total GHG. The emitted CO2 was excluded in the calculation of the total GHG emitted, as CO2 is an inevitable product of the composting process. The lower values of 5.4–11.7 g kg−1 DM for total GHG emitted, compared to 33–161 g kg−1 DM [25]; 143–392 g kg−1 DM [62]; 240–401 [63], were attributed to the optimum O2 levels maintained throughout the composting period. Lignite mitigated the emission of total GHG from the manure by 37–54% primarily through a suppression of NH3 loss of 35–54% (it was assumed that 1% of the deposited NH3 will be converted to N2O and emitted to the atmosphere [64]). Bai et al. [25], on the other hand, reported that amending cattle manure with lignite resulted in a 2.6-fold increase in total GHG emissions. The increase in GHG emissions was influenced, however, by the composting method (large-scale windrow with primarily passive aeration method, accomplished through intermittent turning). This facilitated the creation of anaerobic conditions, especially within the lignite-amended manure windrow, likely due to the small particle size of the lignite, and thus resulted in higher emissions of N2O and CH4. Hence, though lignite has the capacity to mitigate the emissions of GHGs, it is important that optimum conditions, e.g., improved aeration, are established during the composting process.

3.5. Compost Stability Indices

The aerobic microbial respiration rate is considered a reliable indicator of compost stability [3,66]. As the compost stabilises, the CO2 evolution rate decreases due to the depletion of readily degradable OM. A CO2-C evolution rate of 0.5–2.2 mg g−1 OM day−1 suggests a stabilised compost for field application [67,68]. In this study, the threshold of CO2-C evolution rates (1.3–2.0 mg g−1 OM day−1) was attained by day 18 of composting, indicating a stabilised compost for all treatments by that period. In the MLY treatment, this threshold was attained 3 days earlier than the rest of the treatments. The CO2-C evolution rates recorded on day 21 were 1.47, 1.57 and 1.03 mg g−1 OM day−1 for CT, MBM and MLY, respectively.
Unstable composts contain phytotoxic substances (e.g., acetic acids and phenolic compounds) that inhibit seed germination [69]. The germination index, a factor of combined relative seed germination and relative root elongation, has been used in measuring compost phytotoxicity, with reported threshold values ranging between 50 and 110% [70,71,72]. The GI increased with composting time in all treatments (Figure 5), and this can be attributed to the decomposition of acetic acid and the reduction in NH4+ concentration [58,73]. The CT had a consistently lower GI (71% by day 21), compared to the lignite treatments (90–133% by day 21), and this can be attributed to the higher EC of the CT (Figure 3b). The accumulation of salt in seeds results in an imbalance in the uptake of nutrients and water, as well as a modification in the seed germination process [74]. An EC of 3 dS m−1 has been suggested for non-phytotoxic compost [50]. Amending manure with lignite increased the GI, even of the initial feedstock, though the EC was >3 dS m−1. This could be due to the high humic substances in lignite, which are able to reduce the inhibitory effect of EC on germination by forming salt-humate complexes, making the salt less available to accumulate in the seeds [74,75]. In addition, humic substances have been reported to increase respiration and cell division in the seeds [75]. Lignite is a rich source of humic substances and represents 10-80% of the lignite’s OM [76,77]. The GI of the raw BM and LY lignites was determined as 116 and 93%, respectively. The GI values obtained in this study suggest that a higher GI (≥90%) for lignite-amended cattle manure should be used as an indicator for stabilised compost. This GI value should be used alongside the threshold of CO2 evolution rate for stabilised compost or other stabilised compost indices.

4. Conclusions

Lignite amendment did not affect the duration of cattle manure composting despite delaying the onset of thermophilic temperatures. Lignite amendment reduced the emissions of GHGs from manure. This is contrary to a previous study that showed an increase in emissions of GHGs from lignite-amended manure under large-scale composting with predominantly passive aeration. Hence, the management of large-scale composting (e.g., improved aeration) is crucial to lignite’s capacity to minimise GHG emissions. Lignite mitigated the emissions of NH3 during the composting process and also improved the qualities of the final compost, especially the total N content and germination index. Future large-scale field studies assessing the potential of lignite amendment to improve manure composting from the standpoints of N retention and mitigation of gaseous emissions associated with the composting process are recommended. In addition, the agronomic value of lignite-amended manure compost should be determined.

Supplementary Materials

Author Contributions

R.I.: conceptualisation, methodology, investigation, formal analysis, data curation, writing—original draft preparation; A.W.: supervision, writing—review and editing, validation; T.C.: methodology, software, writing—review and editing, validation; D.C.: supervision, writing—review and editing, funding acquisition; H.S.: supervision, writing—review and editing, project administration, validation. All authors have read and agreed to the published version of the manuscript.

Funding

This research was funded by Meat and Livestock Australia (B.FLT.0148).

Acknowledgments

Analytical and technical supports were provided by the Trace Analysis for Chemical, Earth and Environmental Sciences (TrACEES) platform of The University of Melbourne, Australia. We would like to thank Kevin Wilkinson (Frontier Ag & Environment) for the design of the in-vessel composting system.

Conflicts of Interest

The authors declare no conflict of interest.

References

  1. Bradford, G.E. Contributions of animal agriculture to meeting global human food demand. Livest. Prod. Sci. 1999, 59, 95–112. [Google Scholar] [CrossRef]
  2. FAO. The future of food and agriculture—Trends and challenges. In Food and Agriculture Organization of the United Nations; FAO: Rome, Italy, 2017; p. 180. [Google Scholar]
  3. Bernal, M.P.; Alburquerque, J.A.; Moral, R. Composting of animal manures and chemical criteria for compost maturity assessment. A review. Bioresour. Technol. 2009, 100, 5444–5453. [Google Scholar] [CrossRef] [PubMed]
  4. Arriaga, H.; Viguria, M.; López, D.M.; Merino, P. Ammonia and greenhouse gases losses from mechanically turned cattle manure windrows: A regional composting network. J. Environ. Manag. 2017, 203, 557–563. [Google Scholar] [CrossRef] [PubMed]
  5. Risse, L.M.; Cabrera, M.L.; Franzluebbers, A.J.; Gaskin, J.W.; Gilley, J.E.; Killorn, R.; Radcliffe, D.E.; Tollner, W.E.; Zhang, H. Land Application of Manure for Beneficial Reuse. In Animal Agriculture and the Environment: National Center for Manure and Animal Waste White Papers; Rice, J.M., Caldwell, F.J., Humenik, F.J., Eds.; ASABE: St. Joseph, MI, USA, 2006. [Google Scholar]
  6. Clarisse, L.; Clerbaux, C.; Dentener, F.J.; Hurtmans, D.; Coheur, P.F. Global ammonia distribution derived from infrared satellite observations. Nat. Geosci. 2009, 2, 479–483. [Google Scholar] [CrossRef]
  7. Reddy, K.R.; Khaleel, R.; Overcash, M.R.; Westerman, P.W. A Nonpoint Source Model for Land Areas Receiving Animal Wastes: II. Ammonia Volatilization. Trans. ASAE 1979, 22, 1398–1405. [Google Scholar] [CrossRef]
  8. Sutton, M.A.; Erisman, J.W.; Dentener, F.; Möller, D. Ammonia in the environment: From ancient times to the present. Environ. Pollut. 2008, 156, 583–604. [Google Scholar] [CrossRef]
  9. Wu, Y.; Gu, B.; Erisman, J.W.; Reis, S.; Fang, Y.; Lu, X.; Zhang, X. PM2.5 pollution is substantially affected by ammonia emissions in China. Environ. Pollut. 2016, 218, 86–94. [Google Scholar] [CrossRef] [Green Version]
  10. Vanderstelt, B.; Temminghoff, E.J.; Vanvliet, P.; VanRiemsdijk, W. Volatilization of ammonia from manure as affected by manure additives, temperature and mixing. Bioresour. Technol. 2007, 98, 3449–3455. [Google Scholar] [CrossRef]
  11. Parker, D.B.; Pandrangi, S.; Greene, L.W.; Almas, L.K.; Cole, N.A.; Rhoades, M.B.; Koziel, J.A. Rate and frequency of urease inhibitor application for minimizing ammonia emissions from beef cattle feedyards. Trans. ASAE 2005, 48, 787–793. [Google Scholar] [CrossRef]
  12. McCrory, D.F.; Hobbs, P. Additives to reduce ammonia and odor emissions from livestock wastes: A review. J. Environ. Qual. 2001, 30, 345–355. [Google Scholar] [CrossRef] [Green Version]
  13. Cole, N.A.; Clark, R.N.; Todd, R.W.; Richardson, C.R.; Gueye, A.; Greene, L.W.; McBride, K. Influence of dietary crude protein concentration and source on potential ammonia emissions from beef cattle manure1,2,3. J. Anim. Sci. 2005, 83, 722–731. [Google Scholar] [CrossRef] [Green Version]
  14. Chadwick, D. Emissions of ammonia, nitrous oxide and methane from cattle manure heaps: Effect of compaction and covering. Atmos. Environ. 2005, 39, 787–799. [Google Scholar] [CrossRef]
  15. Závodská, L.; Lesný, J. Recent Development in Lignite Investigation; HEJ Manuscript, No. ENV-061026-A, HU ISSN; HEJ: Karachi, Pakistan, 2006; pp. 1418–7108. [Google Scholar]
  16. Chen, D.; Sun, J.; Bai, M.; Dassanayake, K.B.; Denmead, O.T.; Hill, J. A new cost-effective method to mitigate ammonia loss from intensive cattle feedlots: Application of lignite. Sci. Rep. 2015, 5, 16689. [Google Scholar] [CrossRef] [PubMed] [Green Version]
  17. Sun, J.; Bai, M.; Shen, J.; Griffith, D.W.T.; Denmead, O.T.; Hill, J.; Lam, S.K.; Mosier, A.R.; Chen, D. Effects of lignite application on ammonia and nitrous oxide emissions from cattle pens. Sci. Total Environ. 2016, 565, 148–154. [Google Scholar] [CrossRef] [PubMed]
  18. Dana, M.M.; Ardeshir, A. Reducing ammonia loss from broiler litter with lignite coal and biochar. In Enhancing Productivity in a Changing Climate; American Society of Agronomy: Madison, WI, USA; Crop Science Society of America: Fitchburg, Mi, USA, 2018. [Google Scholar]
  19. Dong, L.; Córdova-Kreylos, A.L.; Yang, J.; Yuan, H.; Scow, K.M. Humic acids buffer the effects of urea on soil ammonia oxidizers and potential nitrification. Soil Biol. Biochem. 2009, 41, 1612–1621. [Google Scholar] [CrossRef] [Green Version]
  20. Tu, Y.; Feng, P.; Ren, Y.; Cao, Z.; Wang, R.; Xu, Z. Adsorption of ammonia nitrogen on lignite and its influence on coal water slurry preparation. Fuel 2019, 238, 34–43. [Google Scholar] [CrossRef]
  21. Larney, F.J.; Olson, A.F.; DeMaere, P.R.; Handerek, B.P.; Tovell, B.C. Nutrient and trace element changes during manure composting at four southern Alberta feedlots. Can. J. Soil Sci. 2008, 88, 45–59. [Google Scholar] [CrossRef] [Green Version]
  22. Bernal, M.P.; Sommer, S.G.; Chadwick, D.; Qing, C.; Guoxue, L.; Michel, F.C. Current approaches and future trends in compost quality criteria for agronomic, environmental, and human health benefits. Adv. Agron. 2017, 143–233. [Google Scholar] [CrossRef]
  23. Himanen, M.; Hänninen, K. Composting of bio-waste, aerobic and anaerobic sludges—Effect of feedstock on the process and quality of compost. Bioresour. Technol. 2011, 102, 2842–2852. [Google Scholar] [CrossRef]
  24. Cao, Y.; Bai, M.; Han, B.; Impraim, R.; Butterly, C.; Hu, H.; He, J.; Chen, D. Enhanced nitrogen retention by lignite during poultry litter composting. J. Clean. Prod. 2020, 277, 122422. [Google Scholar] [CrossRef]
  25. Bai, M.; Impraim, R.; Coates, T.; Flesch, T.; Trouvé, R.; Van Grinsven, H.; Cao, Y.; Hill, J.; Chen, D. Lignite effects on NH3, N2O, CO2 and CH4 emissions during composting of manure. J. Environ. Manag. 2020, 271, 110960. [Google Scholar] [CrossRef] [PubMed]
  26. Cao, Y.; Hu, H.W.; Guo, H.G.; Butterly, C.; Bai, M.; Zhang, Y.S.; Chen, D.; He, J.Z. Lignite as additives accelerates the removal of antibiotic resistance genes during poultry litter composting. Bioresour. Technol. 2020, 315, 123841. [Google Scholar] [CrossRef] [PubMed]
  27. Georgacakis, D.; Tsavdaris, A.; Bakouli, J.; Symeonidis, S. Composting solid swine manure and lignite mixtures with selected plant residues. Bioresour. Technol. 1996, 56, 195–200. [Google Scholar] [CrossRef]
  28. Manyapu, V.; Mandpe, A.; Kumar, S. Synergistic effect of fly ash in in-vessel composting of biomass and kitchen waste. Bioresour. Technol. 2018, 251, 114–120. [Google Scholar] [CrossRef] [PubMed]
  29. Whiteley, G.M.; Pettit, C. Effect of lignite humic acid treatment on the rate of decomposition of wheat straw. Biol. Fertil. Soils 1994, 17, 18–20. [Google Scholar] [CrossRef]
  30. Bierman, S.; Erickson, G.E.; Klopfenstein, T.J.; Stock, C.R.A.; Shain, D.H. Evaluation of nitrogen and organic matter balance in the feedlot as affected by level and source of dietary fiber. J. Anim. Sci. 1999, 77, 1645–1653. [Google Scholar] [CrossRef] [Green Version]
  31. Watts, P.J.; McGahan, E.; Bonner, S.L.; Wiedemann, S. Feedlot Mass Balance and greenhouse gas emissions—A literature review. (No. B.FLT.0361). In MLA Report; Meat & Livestock Australia: Sydney, Australia, 2011; p. 125. [Google Scholar]
  32. Griffith, D.W.T.; Deutscher, N.M.; Caldow, C.; Kettlewell, G.; Riggenbach, M.; Hammer, S. A Fourier transform infrared trace gas and isotope analyser for atmospheric applications. Atmos. Meas. Tech. 2012, 5, 2481–2498. [Google Scholar] [CrossRef] [Green Version]
  33. An, C.; Huang, G.; Yao, Y.; Sun, W.; An, K. Performance of in-vessel composting of food waste in the presence of coal ash and uric acid. J. Hazard. Mater. 2012, 203, 38–45. [Google Scholar] [CrossRef]
  34. Van Vliet, P.C.J.; Bloem, J.; Goede, R.G.M. Microbial diversity, nitrogen loss and grass production after addition of Effective Micro-organisms® (EM) to slurry manure. Appl. Soil Ecol. 2006, 32, 188–198. [Google Scholar] [CrossRef]
  35. Awasthi, M.K.; Pandey, A.K.; Bundela, P.S.; Khan, J. Co-composting of organic fraction of municipal solid waste mixed with different bulking waste: Characterization of physicochemical parameters and microbial enzymatic dynamic. Bioresour. Technol. 2015, 182, 200–207. [Google Scholar] [CrossRef]
  36. Wolf, A.; Watson, M.; Wolf, N. Digestion and dissolution methods for P, K, Ca, Mg and trace elements. In Recommended Methods for Manure Analysis; Peters, J., Ed.; University of Wisconsin: Madison, WI, USA, 2003; pp. 3–38. [Google Scholar]
  37. Tiquia-Arashiro, S.M. Reduction of compost phytotoxicity during the process of decomposition. Chemosphere 2010, 79, 506–512. [Google Scholar] [CrossRef] [PubMed]
  38. Wu, L.; Ma, L.Q.; Martinez, G.A. Comparison of methods for evaluating stability and maturity of biosolids compost. J. Environ. Qual. 2000, 29, 424–429. [Google Scholar] [CrossRef] [Green Version]
  39. Marcu, D.; Damian, G.; Cosma, C.; Cristea, V. Gamma radiation effects on seed germination, growth and pigment content, and ESR study of induced free radicals in maize (Zea mays). J. Biol. Phys. 2013, 39, 625–634. [Google Scholar] [CrossRef] [PubMed] [Green Version]
  40. Woodley, A.L.; Drury, C.F.; Reynolds, W.; Calder, W.; Yang, X.M.; Oloya, T.O. Improved acid trap methodology for determining ammonia volatilization in wind tunnel experiments. Can. J. Soil Sci. 2018, 98, 193–199. [Google Scholar] [CrossRef]
  41. Larney, F.J.; Ellert, B.H.; Olson, A.F. Carbon, ash and organic matter relationships for feedlot manures and composts. Can. J. Soil Sci. 2005, 85, 261–264. [Google Scholar] [CrossRef]
  42. Brito, L.M.; Coutinho, J.; Smith, S. Methods to improve the composting process of the solid fraction of dairy cattle slurry. Bioresour. Technol. 2008, 99, 8955–8960. [Google Scholar] [CrossRef] [PubMed]
  43. Tran, C.K.T.; Rose, M.; Cavagnaro, T.R.; Patti, A.F. Lignite amendment has limited impacts on soil microbial communities and mineral nitrogen availability. Appl. Soil Ecol. 2015, 95, 140–150. [Google Scholar] [CrossRef]
  44. Caceres, R.; Flotats, X.; Marfa, O. Changes in the chemical and physicochemical properties of the solid fraction of cattle slurry during composting using different aeration strategies—Bicarbonates. Waste Manag. 2006, 26, 1081–1091. [Google Scholar] [CrossRef]
  45. Li, X.; Shi, X.S.; Lu, M.Y.; Zhao, Y.Z.; Zhou, J.; Peng, H. Improved nitrogen conservation capacity during composting of dairy manure amended with oil shale semi-coke as the porous bulking agent. J. Hazard. Mater. 2020, 388, 121742. [Google Scholar] [CrossRef]
  46. Li, X.; Shi, X.S.; Yang, Z.M.; Xu, X.H.; Zhou, J. Effects of recyclable ceramsite as the porous bulking agent during the continuous thermophilic composting of dairy manure. J. Clean. Prod. 2019, 217, 344–351. [Google Scholar] [CrossRef]
  47. Li, R.; Wang, J.J.; Zhang, Z.; Shen, F.; Zhang, G.; Qin, R.; Li, X.; Xiao, R. Nutrient transformations during composting of pig manure with bentonite. Bioresour. Technol. 2012, 121, 362–368. [Google Scholar] [CrossRef] [PubMed]
  48. Zhu, N. Effect of low initial C/N ratio on aerobic composting of swine manure with rice straw. Bioresour. Technol. 2007, 98, 9–13. [Google Scholar] [CrossRef]
  49. Sánchez-Monedero, M.Á.; Roig, A.; Paredes, C.; Bernal, M. Nitrogen transformation during organic waste composting by the Rutgers system and its effects on pH, EC and maturity of the composting mixtures. Bioresour. Technol. 2001, 78, 301–308. [Google Scholar] [CrossRef]
  50. Gao, M.; Liang, F.; Yu, A.; Li, B.; Yang, L. Evaluation of stability and maturity during forced-aeration composting of chicken manure and sawdust at different C/N ratios. Chemosphere 2010, 78, 614–619. [Google Scholar] [CrossRef] [PubMed]
  51. De Guardia, A.; Mallard, P.; Teglia, C.; Marin, A.; Le Pape, C.; Launay, M.; Benoist, J.; Petiot, C. Comparison of five organic wastes regarding their behaviour during composting: Part 2, nitrogen dynamic. Waste Manag. 2010, 30, 415–425. [Google Scholar] [CrossRef] [PubMed] [Green Version]
  52. Skodras, G.; Kokorotsikos, P.; Serafidou, M. Cation exchange capability and reactivity of low-rank coal and chars. Open Chem. 2014, 12, 33–43. [Google Scholar] [CrossRef]
  53. Pehlivan, E.; Arslan, G. Comparison of adsorption capacity of young brown coals and humic acids prepared from different coal mines in Anatolia. J. Hazard. Mater. 2006, 138, 401–408. [Google Scholar] [CrossRef]
  54. Eghball, B.; Power, J.F.; Gilley, J.E.; Doran, J.W. Nutrient, carbon, and mass loss during composting of beef cattle feedlot manure. J. Environ. Qual. 1997, 26, 189–193. [Google Scholar] [CrossRef] [Green Version]
  55. Barthod, J.; Rumpel, C.; Dignac, M.F. Composting with additives to improve organic amendments. A review. Agron. Sustain. Dev. 2018, 38, 17. [Google Scholar] [CrossRef] [Green Version]
  56. Yang, F.; Li, G.X.; Yang, Q.Y.; Luo, W.H. Effect of bulking agents on maturity and gaseous emissions during kitchen waste composting. Chemosphere 2013, 93, 1393–1399. [Google Scholar] [CrossRef]
  57. Fukumoto, Y.; Osada, T.; Hanajima, D.; Haga, K. Patterns and quantities of NH3, N2O and CH4 emissions during swine manure composting without forced aeration––Effect of compost pile scale. Bioresour. Technol. 2003, 89, 109–114. [Google Scholar] [CrossRef]
  58. Jiang, T.; Schuchardt, F.; Li, G.; Guo, R.; Zhao, Y. Effect of C/N ratio, aeration rate and moisture content on ammonia and greenhouse gas emission during the composting. J. Environ. Sci. 2011, 23, 1754–1760. [Google Scholar] [CrossRef]
  59. Jarvis, Å.; Sundberg, C.; Milenkovski, S.; Pell, M.; Smårs, S.; Lindgren, P.-E.; Hallin, S. Activity and composition of ammonia oxidizing bacterial communities and emission dynamics of NH3and N2O in a compost reactor treating organic household waste. J. Appl. Microbiol. 2009, 106, 1502–1511. [Google Scholar] [CrossRef] [PubMed]
  60. Sanchezgarcia, M.; Alburquerque, J.; Sánchez-Monedero, M.; Roig, A.; Cayuela, M.L. Biochar accelerates organic matter degradation and enhances N mineralisation during composting of poultry manure without a relevant impact on gas emissions. Bioresour. Technol. 2015, 192, 272–279. [Google Scholar] [CrossRef] [PubMed]
  61. Chen, R.; Wang, Y.; Wei, S.; Wang, W.; Lin, X. Windrow composting mitigated CH4 emissions: Characterization of methanogenic and methanotrophic communities in manure management. FEMS Microbiol. Ecol. 2014, 90, 575–586. [Google Scholar] [CrossRef] [PubMed] [Green Version]
  62. Bai, M.; Flesch, T.; Trouvé, R.; Coates, T.; Butterly, C.; Bhatta, B.; Hill, J.; Chen, D. Gas emissions during cattle manure composting and stockpiling. J. Environ. Qual. 2020, 49, 228–235. [Google Scholar] [CrossRef]
  63. Larney, F.J.; Sullivan, D.M.; Buckley, K.E.; Eghball, B. The role of composting in recycling manure nutrients. Can. J. Soil Sci. 2006, 86, 597–611. [Google Scholar] [CrossRef]
  64. De Klein, C.; Novoa, R.S.; Ogle, S.; Smith, K.A.; Rochette, P.; Wirth, T.C.; McConkey, B.G.; Mosier, A.; Rypdal, K.; Walsh, M.; et al. N2O emissions from managed soils, and CO2 emissions from lime and urea application. In IPCC Guidelines for National Greenhouse Gas Inventories; National Greenhouse Gas Inventories Programme: Hamaya, Japan, 2006; Volume 4, pp. 1–54. [Google Scholar]
  65. Myhre, G.; Shindell, D.; Pongratz, J. Anthropogenic and Natural Radiative Forcing, in Climate Change 2013: The Physical Science Basis. In Contribution of Working Group I to the Fifth Assessment Report of the Intergovernmental Panel on Climate Change; Stocker, T.F., Ed.; Cambridge University Press: Cambridge, UK; Cambridge, NY, USA, 2013; p. 82. [Google Scholar]
  66. Hue, N.; Liu, J. Predicting compost stability. Compos. Sci. Util. 1995, 3, 8–15. [Google Scholar] [CrossRef]
  67. Michel, F.C., Jr.; Pecchia, J.A.; Rigot, J.; Keener, H.M. Mass and nutrient losses during the composting of dairy manure amended with sawdust or straw. Compost Sci. Util. 2004, 12, 323–334. [Google Scholar] [CrossRef]
  68. Nakhshiniev, B.; Biddinika, M.K.; Gonzales, H.B.; Sumida, H.; Yoshikawa, K. Evaluation of hydrothermal treatment in enhancing rice straw compost stability and maturity. Bioresour. Technol. 2014, 151, 306–313. [Google Scholar] [CrossRef] [PubMed]
  69. Gómez-Brandón, M.; Lazcano, C.; Domínguez, J. The evaluation of stability and maturity during the composting of cattle manure. Chemosphere 2008, 70, 436–444. [Google Scholar] [CrossRef] [PubMed]
  70. Tambone, F.; Terruzzi, L.; Scaglia, B.; Adani, F. Composting of the solid fraction of digestate derived from pig slurry: Biological processes and compost properties. Waste Manag. 2015, 35, 55–61. [Google Scholar] [CrossRef] [PubMed]
  71. Tian, W.; Li, L.; Liu, F.; Zhang, Z.; Yu, G.; Shen, Q.; Shen, B. Assessment of the maturity and biological parameters of compost produced from dairy manure and rice chaff by excitation–emission matrix fluorescence spectroscopy. Bioresour. Technol. 2012, 110, 330–337. [Google Scholar] [CrossRef] [PubMed]
  72. Tiquia, S.; Tam, N.; Hodgkiss, I. Effects of composting on phytotoxicity of spent pig-manure sawdust litter. Environ. Pollut. 1996, 93, 249–256. [Google Scholar] [CrossRef]
  73. Guo, R.; Li, G.; Jiang, T.; Schuchardt, F.; Chen, T.; Zhao, Y.; Shen, Y. Effect of aeration rate, C/N ratio and moisture content on the stability and maturity of compost. Bioresour. Technol. 2012, 112, 171–178. [Google Scholar] [CrossRef]
  74. Masciandaro, G.; Ceccanti, B.; Ronchi, V.; Benedicto, S.; Howard, L. Humic substances to reduce salt effect on plant germination and growth. Commun. Soil Sci. Plant. Anal. 2002, 33, 365–378. [Google Scholar] [CrossRef]
  75. Ouni, Y.; Ghnaya, T.; Montemurro, F.; Abdelly, C.; Lakhdar, A. The role of humic substances in mitigating the harmful effects of soil salinity and improve plant productivity. Int. J. Plant Prod. 2014, 8, 353–374. [Google Scholar]
  76. Nasir, S.; Sarfaraz, T.B.; Verheyen, T.V.; Chaffee, A.L. Structural elucidation of humic acids extracted from Pakistani lignite using spectroscopic and thermal degradative techniques. Fuel Process. Technol. 2011, 92, 983–991. [Google Scholar] [CrossRef]
  77. Woskoboenko, F.; Satcy, W.; Raisbeck, D. Physical structure and properties of brown coal. In The Science of Victorian Brown Coal: Sturcture, Properties and Consequences for Utilization; Durie, R.A., Ed.; Butterworth-Heinemann Ltd.: Oxford, UK, 1991; pp. 152–235. [Google Scholar]
Figure 1. (a) Schematic diagram; (b) photograph of the in-vessel composting system: 1. Closed path Fourier Transfer Infrared spectroscopy (FTIR) for gas measurement; 2. Computer with FTIR operating programme; 3. Data logger for storing temperature data and for controlling heating cable; 4. Dehumidifier for stripping moisture from air exiting the vessels; 5. Insulated composting vessel with polystyrene sheets at both ends; 6. Humidifier to minimise moisture loss from compost; 7. Insulated tubes carrying gas from vessels to FTIR.
Sustainability 12 10528 g001
Figure 2. Temperature (average of four replicates) recorded during composting (hourly measurement) showing the thermophilic phase threshold.
Sustainability 12 10528 g002
Figure 3. (a) pH, (b) EC, (c) organic matter, (d) total carbon, (e) total N, (f) NH4+-N content of manure and lignite-amended manure during composting. Bars represent the standard error of the mean (n = 4).
Sustainability 12 10528 g003
Figure 4. Daily fluxes of (a) NH3, (b) N2O, (c) CO2, (d) CH4 during composting of manure and lignite-amended manure. Bars represent the standard error of the mean (n = 4).
Sustainability 12 10528 g004
Figure 5. Germination index of manure and lignite-amended manure samples collected during composting. Bars represent the standard error of the mean (n = 4).
Sustainability 12 10528 g005
Table 1. Properties of the feedstock (after addition of urea) and mature compost. Values represent mean (n = 3 for raw feedstocks and n = 4 for final compost) ± standard error of the mean.
FeedstocksFinal Composts
CT MBMMLYCT MBMMLY
pHH2O7.26 ± 0.02 a7.36 ± 0.03 a7.21 ± 0.03 a8.16 ± 0.10 b7.86 ± 0.13 b7.79 ± 0.14 b
EC (dS cm−1)13.31 ± 0.26 d11.05 ± 0.28 bc9.18 ± 0.31 a12.28 ± 0.39 c10.05 ± 0.30 ab9.30 ± 0.31 a
TC (%)26.8 ± 0.88 a36.1 ± 0.81 c35.3 ± 0.52 bc24.39 ± 1.21 a34.30 ± 1.10 bc33.57 ± 0.45 b
OM (%)63.0 ± 0.45 b69.2 ± 0.43 c68.7 ± 0.15 c51.3 ± 0.33 a61.77 ± 0.61 b63.19 ± 0.16 b
TN (%)2.34 ± 0.06 a2.52 ± 0.10 ab2.52 ± 0.03 ab2.56 ± 0.01 b2.66 ± 0.07 b2.73 ± 0.03 b
CN ratio11.5 ±0.12 b14.7 ± 0.1 d14.0 ± 0.2 cd9.51 ± 0.43 a12.88 ± 0.49 bc12.29 ± 0.07 b
NH4+-N (mg kg−1)3118 ± 60 a5786 ± 69 c5252 ± 139 c3004 ± 62 a4308 ± 141 b4479 ± 325 b
Total element concentration (mg kg−1)
Al 10,653 ± 169 b 9076 ± 426 a 9235 ± 376 a13,649 ± 215 c 8583 ± 344 a11,182 ± 179 b
Fe5412 ± 153 bc5154 ± 213 a5219 ± 418 b6514 ± 55 d6124 ± 306 cd5357 ± 66 bc
Mg6528 ± 81 c5450 ± 27 a5173 ± 85 a9431± 77 e8105 ± 135 d6752 ± 190 b
Na13,274 ± 66 c10,702 ± 147 a10,658 ± 63 a15,163 ± 109 e13,884 ± 96 d12,239 ± 137 b
K14,485 ± 100 c11,480 ± 178 a11,458 ± 98 a16,711 ± 117 d14,011 ± 168 c13,357 ± 97 b
Ca16,291 ± 38 c11,568 ± 134 a11,032 ± 161 a20,433 ± 407 d17,046 ± 417 c14,619 ± 424 b
P7086 ± 17 c4824 ± 102 a4488 ± 86 a8867 ± 188 d5591± 143 b5690 ± 274 b
S5136 ± 26 ab6799 ± 112 b4764 ± 27 a6094 ± 103 b 10,453 ± 116 c5357 ± 103 ab
Zn 171.6 ± 0.1 d126.6 ± 4.8 ab119.21 ± 4.3 a213.6 ± 6.9 e142.2 ± 1.9 bc149.4 ± 5.7 c
Mn 170.6 ± 2.6 c123.6 ± 3.0 a116.93 ± 1.9 a207.8 ± 5.4 d171.9 ± 1.4 c147.4 ± 3.4 b
Cu 32.1 ± 0.2 c24.7 ± 1.1 ab22.67 ± 0.5 a37.9 ± 1.4 d27.0 ± 0.5 b27.8 ± 0.7 b
B64.6 ± 6.6 abc45.5 ± 2.9 ab38.49 ± 4.7 a82.5 ± 21.1 bc96.2 ± 6.3 c69.8 ± 15.6 abc
Values in the same row followed by same letters are not significantly different (p = 0.05). CT = cattle manure only; MBM = cattle manure + Bacchus Marsh lignite; MLY = cattle manure + Loy Yang lignite.
Table 2. Summary of dry matter, organic matter, total carbon and total nitrogen, as well as their losses over the composting period. Values represent mean (n = 4) ± standard error of the mean.
CTMBMMLY
Dry matter
Initial 1 dry matter (g)700070007000
Final 2 dry matter (g)5314 ± 1455633 ± 1155955 ± 42
Loss of DM (% of initial)24.119.514.9
Organic Matter
Initial concentration (%)63.0 ± 0.469.2 ± 0.468.7 ± 0.2
Initial amount (g)4412 ± 3134847 ± 2994808 ± 107
Final concentration (%)51.3 ± 0.361.8 ± 0.663.2 ± 0.2
Final amount (g)2726 ± 1753480 ± 3443763 ± 97
Loss of OM (% of initial)38.2 28.2 21.7
Total Carbon
Initial concentration (%)26.8 ± 0.936.1 ± 0.835.3 ± 0.5
Initial amount (g)1876 ± 622528 ± 562472 ± 37
Final concentration (%)24.4 ± 0.634.2 ± 1.133.6 ± 0.5
Final amount (g)1268 ± 321932 ± 611986 ± 27
Loss of total C (% of initial)32.42 23.55 19.67
Total Nitrogen
Initial concentration (%)2.34 ± 0.062.52 ± 0.102.52 ± 0.05
Initial amount (g)163.7 ± 4.7176.3 ± 8.1176.7 ± 2.3
Final concentration (%)2.56 ± 0.042.66 ± 0.072.73 ± 0.03
Final amount (g)136.3 ± 5.2150.0 ± 3.7162.7 ± 1.7
Loss of total N (% of initial)16.77 14.92 7.94
1 per vessel at the start of composting. 2 per vessel at the end of composting.
Table 3. Total greenhouse gas emitted (CO2-e) over the composting period.
GHG (g kg−1 DMi) §CTMBMMLY
N2O §§ 11.727.405.36
CH4 0.0120.0060.005
Total GHG 11.737.415.37
§ Global warming potential (over a 100-year timescale) [65]: 28 for CH4, and 265 for N2O. §§ Direct plus indirect N2O emissions. For indirect emission, it was assumed 1% of deposited NH3 will be converted to N2O and emitted to the atmosphere [64]).
Publisher’s Note: MDPI stays neutral with regard to jurisdictional claims in published maps and institutional affiliations.

