Article

Environmental Sustainability Enhancement of Waste Disposal Sites in Developing Countries through Controlling Greenhouse Gas Emissions

1
Institute of Environmental Technology and Energy Economics, Sustainable Resource and Waste Management, Hamburg University of Technology, Blohmstr. 15, 21073 Hamburg, Germany
2
Department of Energy and Environment Engineering, Dawood University of Engineering and Technology, New M.A Jinnah Road, Karachi 74800, Pakistan
*
Author to whom correspondence should be addressed.
Sustainability 2021, 13(1), 151; https://0-doi-org.brum.beds.ac.uk/10.3390/su13010151
Submission received: 24 November 2020 / Revised: 22 December 2020 / Accepted: 22 December 2020 / Published: 25 December 2020
(This article belongs to the Special Issue Sustainable Waste Disposal Systems)

Abstract

:
Sustainable management of municipal solid waste is one of the major challenges for authorities in developing countries. Current waste disposal methods in Pakistan and other developing countries are not meeting standards of any proper waste management system opted for in the developed world. This mismanagement of waste is leading to serious environmental problems at local as well as global levels. This study aims to investigate the methane emissions from waste dumpsites in the city of Karachi, Pakistan, and to propose an effective approach to enhance their environmental sustainability. The methane emissions from waste disposal sites were assessed by simulating four different landfill situations during the landfill simulation reactor experiment. The residual methane reduction potential of each waste disposal approach was assessed by a biochemical methane test of waste after the experiment. It is estimated that in the present situation, about 11,500 tons of CO2-eq methane is released annually from waste disposal sites in Karachi. The convectional anaerobic landfill with methane capturing facilities and post-aeration operation was found to be the most environmentally sustainable approach with controlling 65% of residual methane emissions in comparison with the present scenario. For the development of new landfill sites, we recommend the bioreactor landfill approach with methane recovery and post-care (in-situ aeration).

1. Introduction

Sustainable management of municipal solid waste (MSW) is one of the major challenges municipal authorities are facing in developing countries [1,2,3]. Sustainable management of waste can be defined as the handling of waste generated by the means of collection, transfer/transport, re-use, re-cycling, disposing and landfilling concurrently, and considering the costs and effects on public health and the ecosystem [4,5]. Open disposal and uncontrolled burning of MSW is commonly practiced in developing countries [6]. Landfills and waste disposal sites are some of the key contributors in anthropogenic emissions of methane globally [7,8]. In comparison with other human-caused greenhouse gases (GHGs), methane (CH4) has the second highest potential for a climate change effect after carbon dioxide (CO2) [9]. The GHG emissions from the waste sector in developing countries are anticipated to increase in coming years [10]. The global emissions of non-CO2 GHGs (N2O and CH4) rose by up to 10% during the period of 1990–2005, and are estimated to increase by up to 43% till 2030 [11]. The Climate Watch [12] stated that, in 2016, the worldwide waste sector accounted for 1560 million tons of carbon dioxide equivalent (Mt CO2-eq) (3.1% of global GHG emissions) of which 91% was methane (CH4). According to a report by the Intergovernmental Panel on Climate Change (IPCC) [13], if no step is taken to control the continuously rising GHG emissions, the global temperature will rise by 6.4 °C in the 21st century.
Developing countries were responsible for 29% of global GHG emissions in the year 2000, and this percentage is estimated to increase by up to 64% and 76% by the year 2030 and 2050, respectively, with waste landfills as a key contributor in these emissions due to uncontrolled waste disposal [14]. The latest GHG inventory of waste sectors, reported by different developing countries, is given in Table 1.
To control the GHG emissions from waste sectors, various waste management technologies have been developed, including composting, incineration with energy recovery, anaerobic digesters, landfill bioreactors, landfill gas (LFG) capturing, refuse-derived fuels (RFD), and combustion in cement burners [33,34].
Pakistan is a developing country and lacks any sustainable waste disposal mechanism or technologies [35]. Pakistan accounted for 0.81% in global GHG emissions in the year 2016 [12]. The latest reported national GHG inventory of Pakistan is summarized in Table 2.
The per capita GHG emission in Pakistan was 0.85 tons of CO2-eq in 2016 [36], which was much less than China (6.65 tons of CO2-eq) and India (1.65 tons of CO2-eq) [37]. Pakistan accounted for more than 650 million tons of CO2-eq in 2020 containing 54% CO2, 36% CH4, 9% NOX, 0.7% CO, and 0.3% other volatile organic carbons (VOCs) [36]. The waste sector in Pakistan adds 3.9% to the GHG inventory of the country [15]. The share of different sectors in the greenhouse gas inventory of Pakistan is shown in Figure 1.
Karachi is the most populous and largest city of Pakistan, producing about 15,000 tons of MSW every day [38,39]. In Karachi, 60% of MSW is being collected and openly disposed of in waste dumpsites [40]. The open dumping and burning of municipal solid waste is a widespread method of waste disposal in Pakistan [35,38,41].
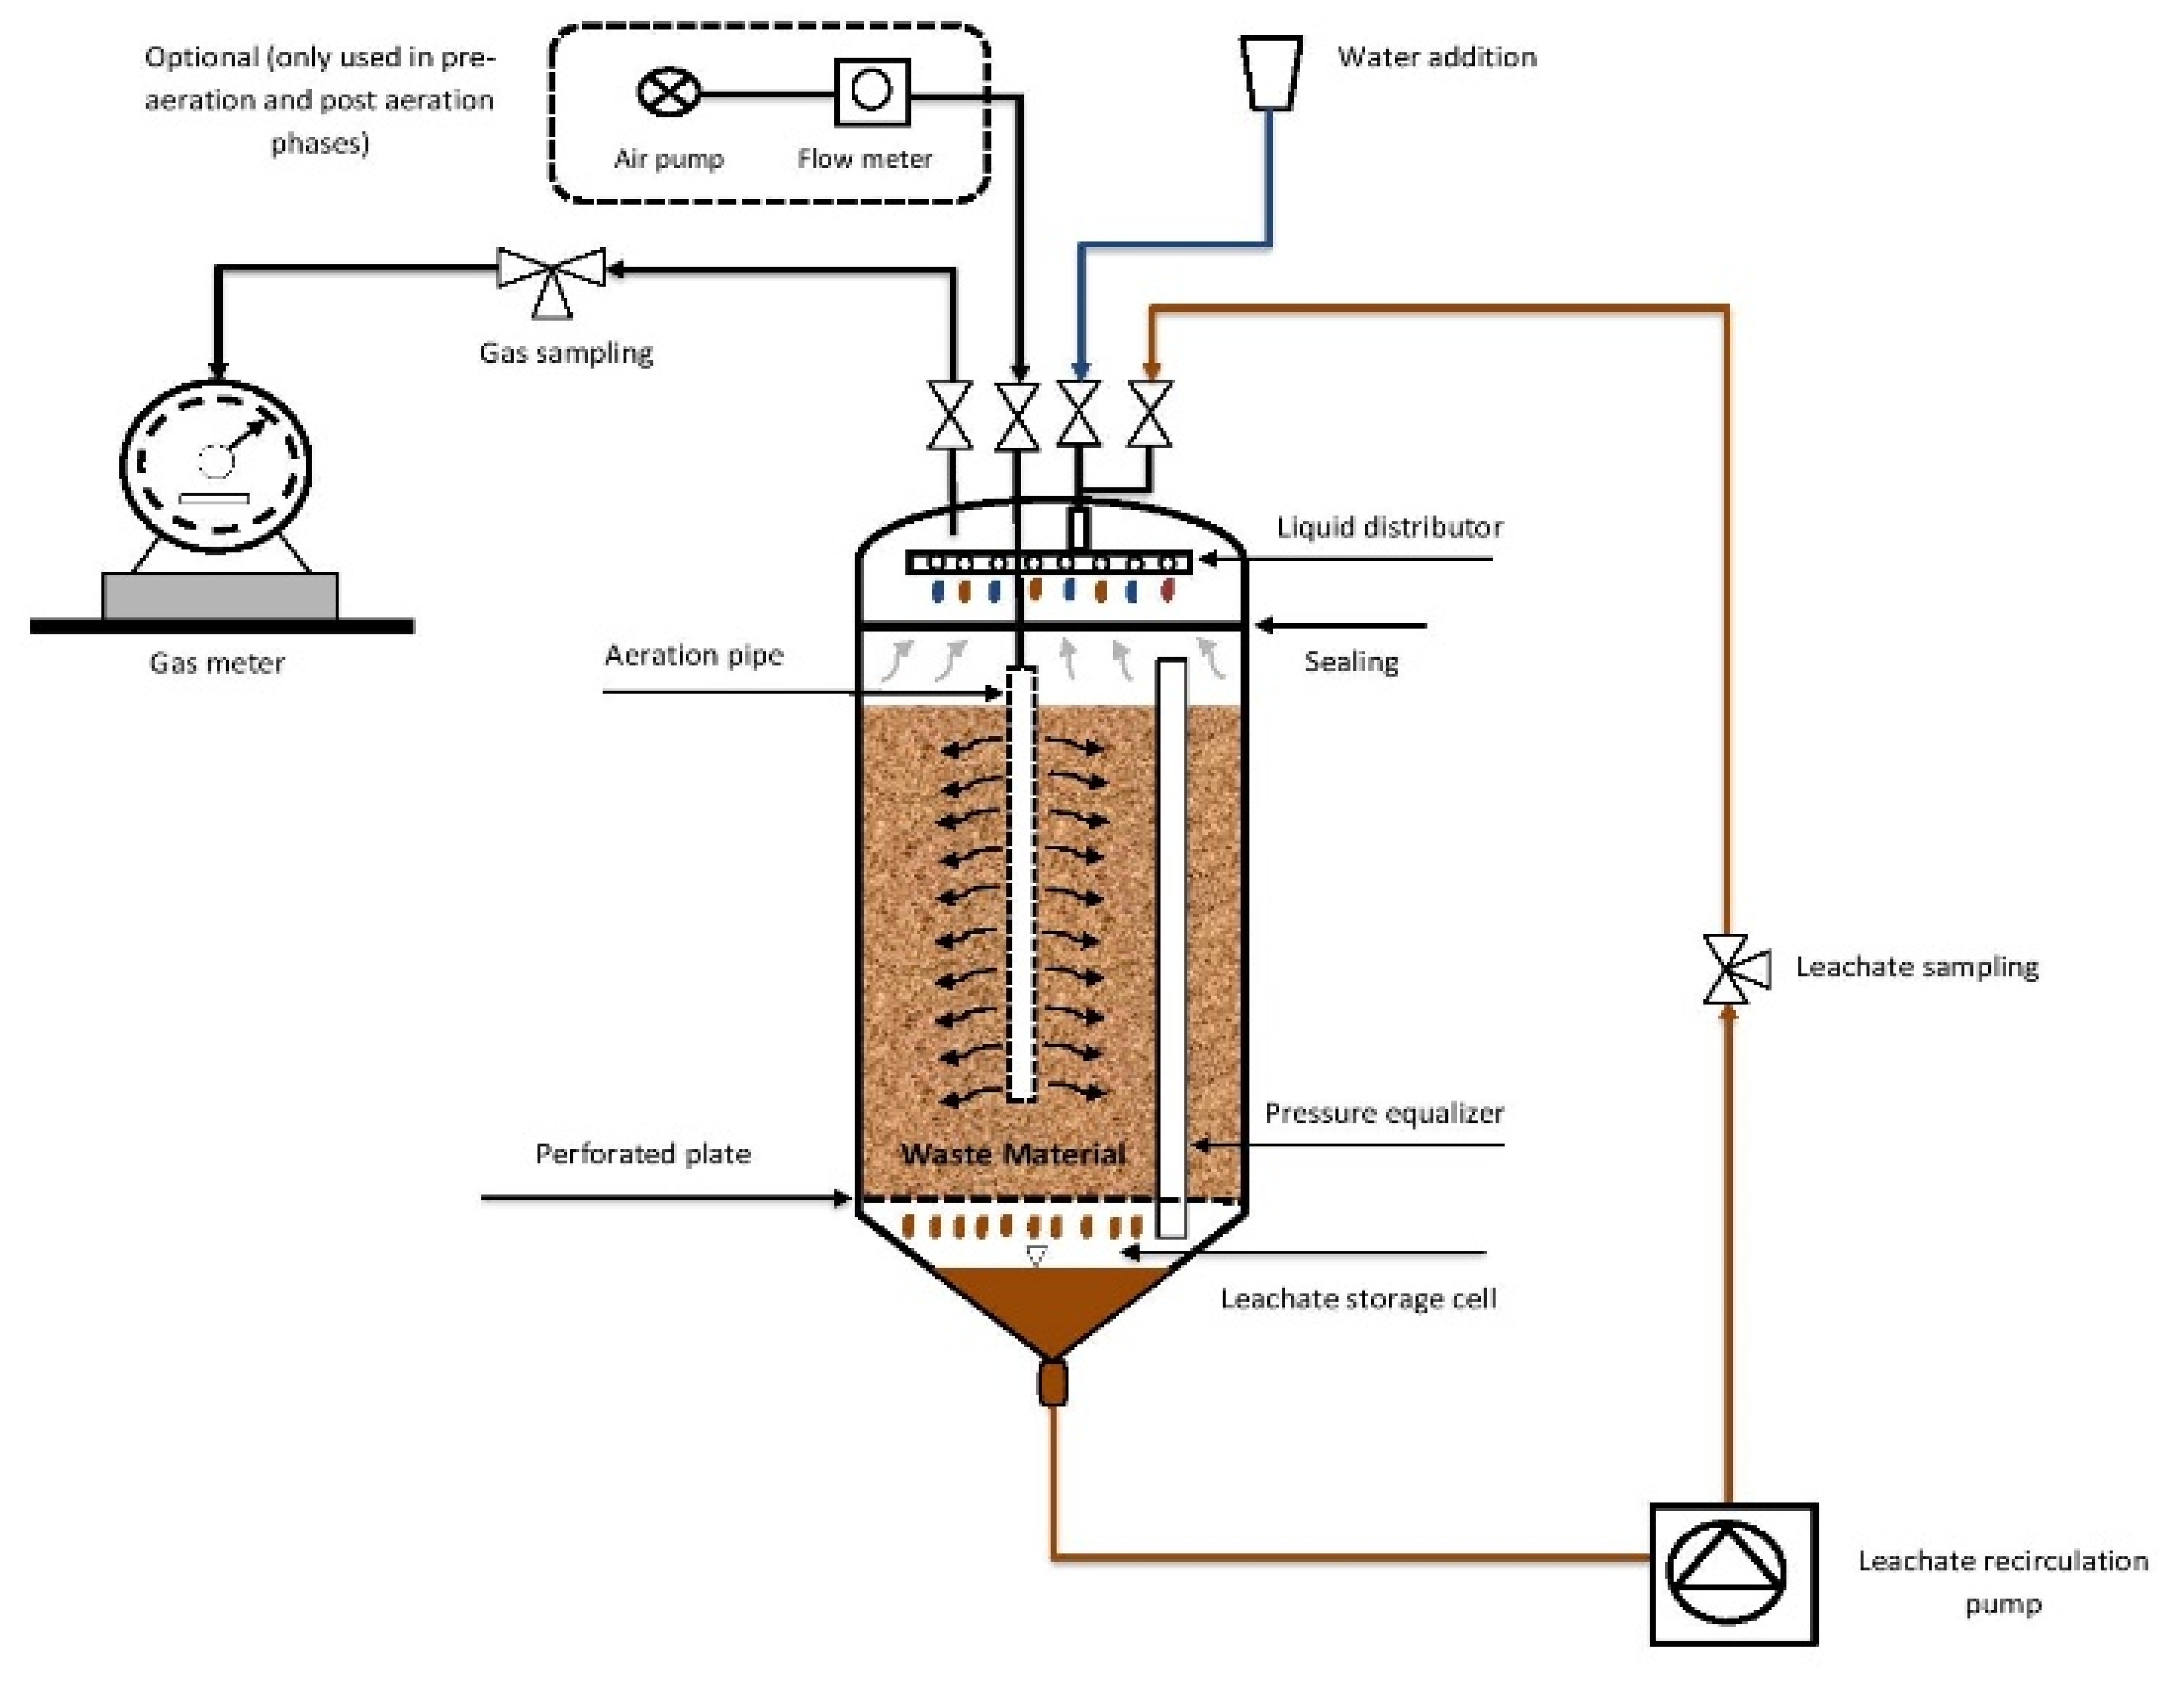
This study has been conducted to estimate the GHG (methane) emissions from waste disposal sites in Karachi, and propose suitable and environmentally sustainable waste disposal options to control methane emissions. This study was conducted through simulating conditions (by considering climate and waste composition) prevailing at MSW dumpsites in the city. In parallel to the existing situation, three different scenarios were simulated for comparison. The comparison of environmental sustainability in each scenario is made on the basis of a reduction in residual methane formation potential by conducting a biochemical methane potential (BMP21) assessment of waste after the experiment.

2. Materials and Methods

2.1. Municipal Solid Waste Sample Preparation

Model waste sample representing MSW composition in Karachi (reported by [42]) was prepared in the laboratory at the Institute of Environmental Technology and Energy Economics, Hamburg University of Technology, Hamburg, Germany. The composition of synthetic MSW sample used in this study is given in Table 3.
The synthetic MSW sample was modeled by collecting and mixing all of the waste components according to their fraction as reported in Table 2 [43]. For lab-scale small landfill simulation reactors used in this experiment, the size of waste components was reduced and waste mixture was shredded to <25 mm in order to load representative samples of MSW in the reactors [39,43]. Various other landfill simulation studies [44,45] used shredded waste samples in the reactors. The initial moisture content of waste sample was noted as 42.7%. The moisture content of waste mixture was optimized by adding 10 L of tap water and rigorously mixing the waste specimen (for equal moisturization of waste material) [43]. The physicochemical properties of the synthetic MSW sample are reported in Table 4.
Before and after the loading of waste samples in landfill simulation reactors, all reactors were weighed to determine the waste quantity loaded in each reactor [43]. Table 5 shows the basic data of waste samples loaded in the reactors.

2.2. Landfill Simulation Experiment

In order to simulate different landfill conditions, including the existing situation at waste disposal sites in Karachi city, four glass reactors (with an average height and diameter of 38.6 cm and 14.7 cm, respectively) were used and operated under controlled climate conditions at 36 °C ± 1 [43]. The illustration of the landfill simulation reactor setup is shown in in Figure 2.
At the start of the landfill simulation experiment, a brief pre-aeration phase was realized for 2 weeks in all reactors to avoid a long lag phase and acid accumulation due to the high organic fraction in waste samples [43,46]. The landfill simulation reactors (LSRs) were operated under anaerobic conditions to simulate the landfill ecosystem. Two reactors (R1 and R2) simulating actual conditions of waste disposal sites in Karachi were operated under limited water additions of 56 mL/week to realize the annual rainfall of 176 mm in the city [43,47]. The remaining two reactors (R3 and R4) were operated under highly moisturized conditions with leachate recirculation to simulate bioreactor landfill conditions [43].
Thereafter, post-aeration was realized in two reactors (R1 and R3) to compare the impact of post-aeration under the respective operational conditions. The summary of landfill simulation reactor operations is given in Table 6. The biogas/off-gas quantity was measured (by milli-gas counters in the anaerobic phase and drum gas meters in the post-aeration phase) and quality was analyzed (by Gas Chromatography) on a weekly basis till the end of the experiment.

2.3. Biochemical Methane Potential (BMP21) Test

Environmental sustainability assessment of applied approaches was analyzed by a BMP21 test of solid waste samples acquired from landfill simulation reactors after completion of the experiment. The BMP21 test of waste samples was conducted in accordance with the protocol given by the association of German Engineers VDI 4630 2016 [48]. The experimental procedure followed the BMP21 test as reported in a research article [39]. The schematic diagram of the biochemical methane potential (BMP21) test experiment setup is shown in Figure 3.
The quantity of waste sample used in the BMP21 test was calculated according to a substrate-to-inoculum ratio (SIR) of 1:2 as reported in [48]. The quality and quantity of waste samples used in the BMP21 test is reported in Table 7.
During the BMP21 assessment, the volume of biogas produced during the test was measured by the displacement method through the mean of the eudiometer tube as shown in Figure 3 and reported in [39]. The biogas composition (CH4 and CO2) was analyzed at the time of every measurement of the gas volume. The details of other analytical methods used to examine different parameters of solid waste samples are summarized in Table 8.

3. Results and Discussion

The estimations for methane emissions from different MSW landfilling scenarios designed in this study were made by considering the MSW management situation (generation, composition, and disposal rate) and climate conditions in Karachi. The basic data used for estimation of methane emissions and power generation from waste disposal sites in the city are given in Table 9.
During the anaerobic operation mode of the landfill simulation reactors, lower methane emissions were recorded from the reactor (R2) simulating existing conditions of waste disposal sites in Karachi. The methane production rate from reactor R2 was calculated as 0.24 L/kg DM/d and in reactors R1, R3, and R4 the methane production rate was 0.38 L/kg DM/d, 0.37 L/kg DM/d and 0.19 L/kg DM/d, respectively, as shown in Table 9. After 252 days of operation, the anaerobic phase in reactors R1 and R3 was ended when the weekly landfill gas (LFG) generation rate in reactors decreased to 0.3% and 0.06% of the cumulative LFG production, respectively. In comparison, the landfill gas production rate in R2 and R4 decreased to 0.23% and 0.09% of the cumulative LFG production, respectively, at the end of the experiment, after 448 days in R2 and 364 days in R4.
It can be observed from the results that the LFG gas production rate in the reactors simulating bioreactor landfill conditions (R3 and R4) reached lower values in less time than R1 and R2. This rapid LFG production was due to the accelerated waste biodegradation process in the result of leachate recirculation [53,54]. Table 10 provides the detailed calculations for estimation of methane emissions analyzed in existing situations of waste disposal sites and other scenarios developed in the study.
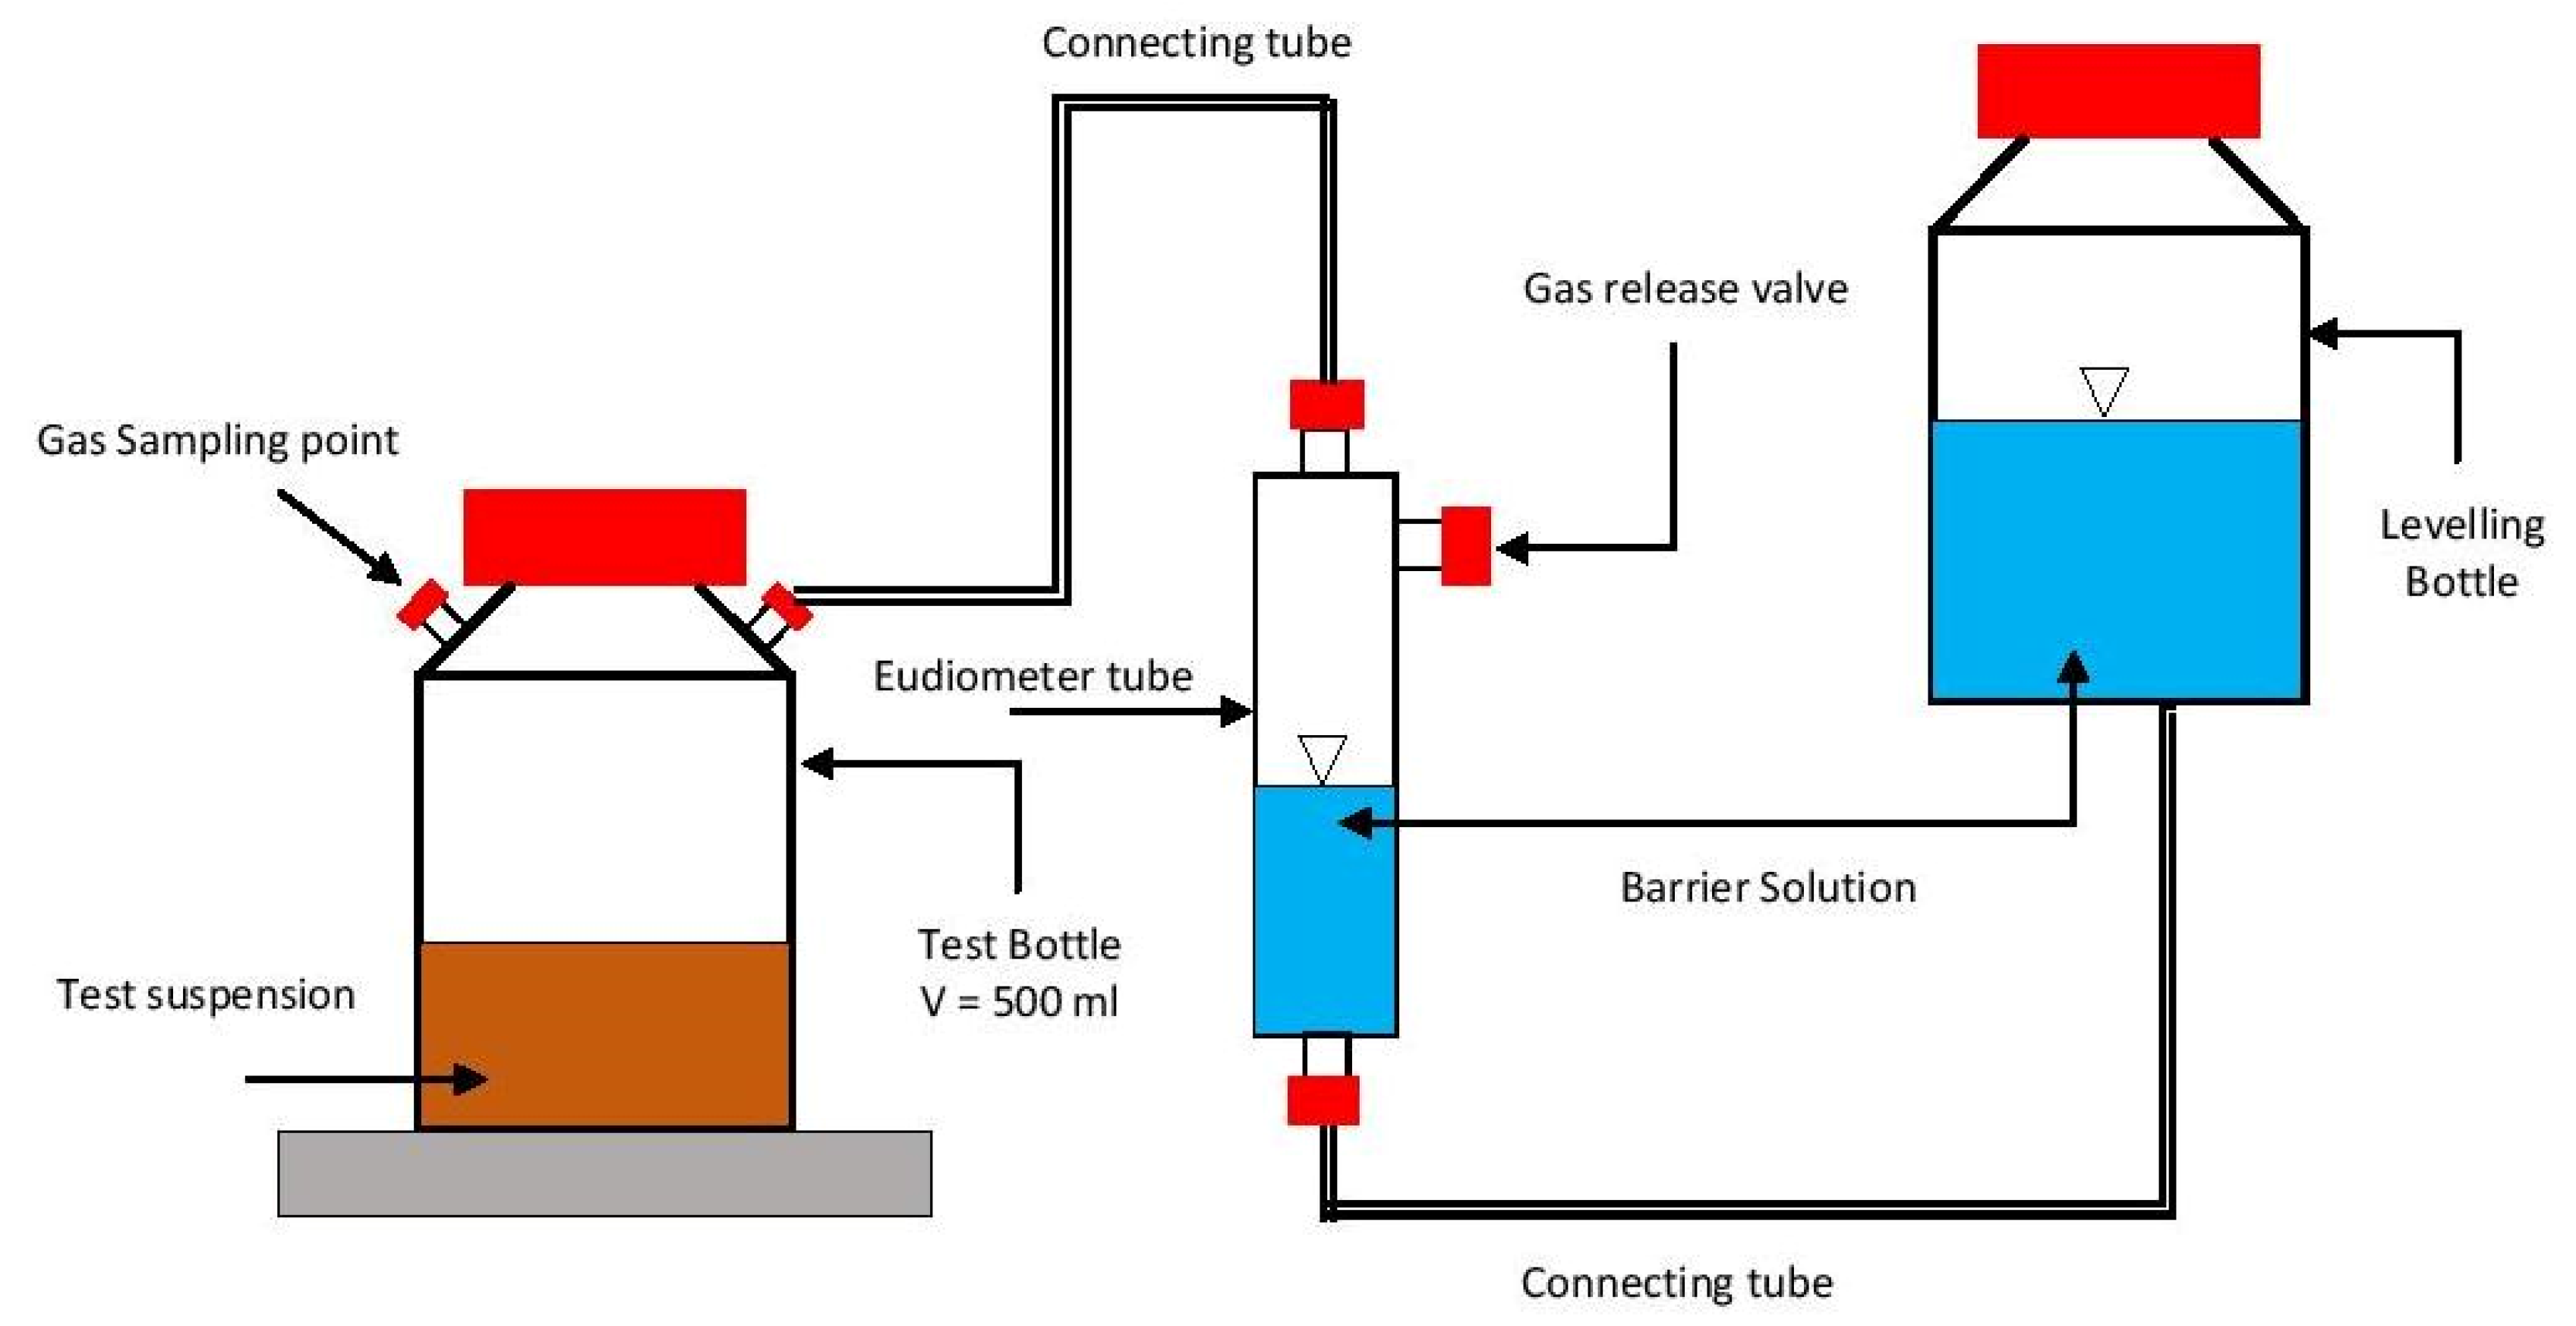
The test results of the BMP21 assessment of the waste samples were analyzed with the data of MSW generated in Karachi (as given in Table 9) to know the total methane emissions potential of MSW disposed in waste dumpsites in the city. The BMP21 test results were also used to observe the residual methane reduction efficacy of different landfill approaches simulated in this study.
In consequence of low methane formation in anaerobic operation in reactor R2, higher residual methane emission was noticed from the waste sample extracted from the reactor during the BMP21 test. These results indicate that waste disposal sites in Karachi have prolonged methane emission potential due to unfavorable conditions for waste biodegradation at dumpsites, e.g., limited moisture availability and formation of acidic conditions due to the high organic fraction in the MSW [43,44].
The waste sampled from reactor R1 produced a lower quantity of residual methane than reactor R3, showing a higher impact of aeration operation on waste stabilization in the presence of limited water than in the presence of high moisture content. However, waste sampled form reactor R3 (bioreactor (BRL) with post-aeration) shows a higher residual methane reduction than R4 (BRL without post-care). The lower residual methane emissions from R3 were the result of increased decomposition of organic matter due to the post-aeration phase observed in the reactor. Table 11 gives the detailed calculation of the residual methane emission potential from different landfill approaches assessed in this study.
In control of residual gas emissions, low methane emissions were noticed from reactors R1 and R3 during the BMP21 test due to the post-aeration operation. However, reactor R4 (BRL approach) shows less residual gas emissions than reactor R2 during the BMP21 assessment test due to enhanced in-situ biodegradation of waste in the result of leachate recirculation [55,56]. Figure 4 shows the comparison of cumulative methane emissions from different landfill conditions during the LSR experiment and the BMP21 assessment test.
Through analysis of results from the LSR experiment (given in Table 10), the BMP21 test (given in Table 11), and the data on waste management in Karachi (given in Table 9), it is estimated that about 11,500 MgCO2-eq/year of methane enters the atmosphere from waste dumpsites in Karachi. The amount of methane emissions from waste disposal sites in Karachi is about 0.1% of the total quantity of methane emissions accounted for by the waste sector in Pakistan. The extent of methane emission reduction through applied approaches is summarized in Table 12.
For the comparison of power generation potential, two cases (1 and 3) are considered. In the first case, power generation is evaluated from a conventional sanitary landfill approach, and in the second, it is evaluated from a bioreactor landfill approach. In both cases, anaerobic conditions in landfill simulation reactors were switched to aerobic in order to simulate a post-aeration phase at the time when the weekly methane production rate decreased to <0.5% of the cumulative methane produced till that period. The power generation is estimated till reaching <0.5% of the methane production rate by assuming that after that period, utilization of produced methane for power generation will not be profitable and/or technically viable as described by [57]. In reactor R3 (which used the bioreactor landfill approach) the limit of <0.5% of cumulative methane production was reached in only 140 days from starting with anaerobic operation. In contrast, in reactor R3 (which used the conventional landfill approach) this limit was reached in 231 days. At first, the thermal power (Pt) production from methane is determined by considering the energy content of methane to be 890.8 kJ/mol, the density to be 660 g/m3, and the calorific value of methane to be 55,526 MJ/ton as reported by [39,50]. The electric power generation is calculated by Equation (1) as reported by [39,52].
Pe = Pt × r × ηe
where Pe is electric power produced, Pt is thermal power, r is the methane recovery rate, and ηe is the electric efficiency of the generator. The methane recovery rate is assumed to be 70% and the electric efficiency of generator is assumed to be 35%, as given in Table 9. The estimated electrical energy generation potential of methane produced from conventional anaerobic and bioreactor landfill sites in Karachi is given in Table 13.
Furthermore, the power generation potential from conventional landfill (case 1) and bioreactor landfill (case 3) conditions in different waste disposal rates in Karachi was also estimated and is given in Table 14. It was estimated that the power generation can be enhanced by improving the MSW collection and disposal rate in the city.
The results show that the post-aeration approach can be efficiently used in the present dumpsite to control methane emission. If waste dumpsites were to be transformed into conventional sanitary landfills and equipped with methane capturing and power generation facilities, 4.4 MWh of electric power could be generated on a daily basis. Afterwards, landfill in-situ aeration can be used as a post-care method to control residual methane emissions when energy generation from methane is no longer possible or economical. Furthermore, it was estimated that through the BRL approach, 7.0 MW of power can be generated, which is 30% more than through conventional landfill.

4. Conclusions and Implications

According to the methane emissions estimated in this study by simulating different landfill situations, it is concluded that in existing operating conditions of open waste disposal, landfills in Karachi are emitting a significant amount methane into the environment. Through the results obtained from simulation of other landfill scenarios, it was also observed that the environmental sustainability of existing MSW dumpsites in Pakistan and other developing countries can be successfully enhanced by transforming open waste disposal sites into sanitary landfills. This study shows that in-situ aeration would be a promising approach for reclamation of old dumpsites to control prolonged methane emissions. Energy can be generated through capturing and utilization of methane produced from sanitary (conventional anaerobic) landfills. Furthermore, it was estimated that through reclamation of existing waste disposal sites in Karachi, 65% of present methane emissions can be controlled.
For the development of new landfill sites, bioreactor landfill with the post-care (in-situ aeration) approach is recommended. The bioreactor landfill approach, when combined with a landfill gas recovery system, offers rapid waste stabilization, enhanced landfill gas production, and more power generation. Through opting for the bioreactor approach with landfill gas recovery facilities, 30% more power can be generated as compared with the conventional anaerobic landfilling approach. Furthermore, power generation from conventional sanitary and bioreactor landfills can be increased through improving waste collection rates.
Further research into the selection of a more suitable water regime for the bioreactor landfilling approach, with awareness of the composition and physicochemical characteristics of MSW generated in Karachi and other cities of developing countries, should be done in order to generate more power and optimize the effect of post-care operations on waste stabilization.

Author Contributions

I.S.: Conceptualization, Methodology, Formal analysis, Investigation, Writing—Original Draft, Writing—Review & Editing, Validation, and Visualization M.R.: Conceptualization, Methodology, Writing—Review & Editing, Validation, and Supervision, K.K.: Resources, Visualization, Supervision, and Funding acquisition S.Ö.C.: Formal analysis, Investigation, Validation, Visualization, and Writing—review & editing. All authors have read and agreed to the published version of the manuscript.

Funding

The PhD study of Ihsanullah Sohoo was funded by the Higher Education Commission (HEC) of Pakistan Incorporation with DAAD, Germany.

Data Availability Statement

Data Availability Statements in section refered.

Acknowledgments

Publishing fees supported by the Funding Programme * Open Access Publishing * of Hamburg University of Technology (TUHH), Hamburg, Germany.

Conflicts of Interest

The authors declare no conflict of interest.

References

  1. Cetrulo, T.B.; Marques, R.C.; Cetrulo, N.M.; Pinto, F.S.; Moreira, R.M.; Mendizábal-Cortés, A.D.; Malheiros, T.F. Effectiveness of solid waste policies in developing countries: A case study in Brazil. J. Clean. Prod. 2018, 205, 179–187. [Google Scholar] [CrossRef]
  2. Aleluia, J.; Ferrão, P. Characterization of urban waste management practices in developing Asian countries: A new analytical framework based on waste characteristics and urban dimension. Waste Manag. 2016, 58, 415–429. [Google Scholar] [CrossRef] [PubMed]
  3. Ziraba, A.K.; Haregu, T.N.; Mberu, B. A review and framework for understanding the potential impact of poor solid waste management on health in developing countries. Arch. Publ. Heal. 2016, 74, 1–11. [Google Scholar] [CrossRef] [PubMed] [Green Version]
  4. Tchobanoglous, G.; Kreith, F. Handbook of Solid Waste Management, 2nd ed.; McGraw-Hill Education: New York, NY, USA, 2002; ISBN 0071500340. [Google Scholar]
  5. Ayodele, T.R.; Alao, M.A.; Ogunjuyigbe, A.S.O. Effect of collection efficiency and oxidation factor on greenhouse gas emission and life cycle cost of landfill distributed energy generation. Sustain. Cities Soc. 2020. [Google Scholar] [CrossRef]
  6. Ferronato, N.; Torretta, V. Waste mismanagement in developing countries: A review of global issues. Int. J. Environ. Res. Publ. Health 2019, 16, 1060. [Google Scholar] [CrossRef] [PubMed] [Green Version]
  7. Ritzkowski, M.; Stegmann, R. Controlling greenhouse gas emissions through landfill in situ aeration. Int. J. Greenh. Gas Control 2007, 1, 281–288. [Google Scholar] [CrossRef]
  8. Lou, X.F.; Nair, J. The impact of landfilling and composting on greenhouse gas emissions–A review. Bioresour. Technol. 2009. [Google Scholar] [CrossRef]
  9. Shakoor, A.; Ashraf, F.; Shakoor, S.; Mustafa, A.; Rehman, A.; Altaf, M.M. Biogeochemical transformation of greenhouse gas emissions from terrestrial to atmospheric environment and potential feedback to climate forcing. Environ. Sci. Pollut. Res. 2020, 27, 38513–38536. [Google Scholar] [CrossRef]
  10. Friedrich, E.; Trois, C. Quantification of greenhouse gas emissions from waste management processes for municipalities–A comparative review focusing on Africa. Waste Manag. 2011, 31, 1585–1596. [Google Scholar] [CrossRef]
  11. Roche, L.; Forrestal, P.J.; Lanigan, G.J.; Richards, K.G.; Shaw, L.J.; Wall, D.P. Impact of fertiliser nitrogen formulation, and N stabilisers on nitrous oxide emissions in spring barley. Agric. Ecosyst. Environ. 2016. [Google Scholar] [CrossRef]
  12. Watch, C. Global Historical Emissions. Available online: https://www.climatewatchdata.org/ghg-emissions?end_year=2016&start_year=1990 (accessed on 12 November 2020).
  13. Stocker, T.F.; Qin, D.; Plattner, G.K.; Tignor, M.M.B.; Allen, S.K.; Boschung, J.; Nauels, A.; Xia, Y.; Bex, V.; Midgley, P.M. Climate Change 2013 The Physical Science Basis: Working Group I Contribution to The Fifth Assessment Report of The Intergovernmental Panel on Climate Change; Cambridge University Press: Cambridge, MA, USA, 2013; ISBN 9781107415324. [Google Scholar]
  14. Monni, S.; Pipatti, R.; Lehtila, A.; Savolainen, I.; Syri, S. Global Climate Change Mitigation Scenarios for Solid Waste Management; VTT Publications: Espoo, Finland, 2006; Volume 603, ISBN 4567890123456. [Google Scholar]
  15. Ministry of Climate Change, Government of Pakistan. Pakistan’s Second National Communication on Climate Change-to United Nations Framework Convention on Climate Change (UNFCCC); Ministry of Climate Change: Islamabad, Pakistan, 2018.
  16. Ministry of Environment, Forest and Climate Change, Government of India. India: Second Biennial Update Report to the UNFCCC; Ministry of Environment, Forest and Climate Change, Government of India: Jor Bagh Road, New Delhi, India, 2018; ISBN 9788193853122.
  17. UNFCCC. The People’s Republic of China Second Biennial Update Report on Climate Change Unofficial Translation For Reference Use Only; UNFCCC: Bonn, Germany, 2018. [Google Scholar]
  18. UN. World Economic Situation and Prospects. J. Chem. Inf. Model. 2020, 53, 1689–1699. [Google Scholar]
  19. USAID. Greenhouse Gas (GHG) Emissions by Sector in Bangladesh; USAID: Washington, DC, USA, 2016; pp. 2015–2017.
  20. USAID. Greenhouse Gas Emissions in Sri Lanka; USAID: Washington, DC, USA, 2015; pp. 2014–2015.
  21. Ministry of Natural Resources and Environment Malaysia. Malaysia Biennial Update Report to the United Nations Framework Convention on Climate Change (UNFCCC); Ministry of Natural Resources and Environment Malaysia: Putrajaya, Malaysia, 2015; ISBN 9789670250236.
  22. USAID. Greenhouse Gas Emissions in Indonesia; USAID: Washington, DC, USA, 2017; pp. 2016–2017.
  23. Ministry of Natural Resources and Environment (Thailand). Thailand’s Third National Communication (TNC) to the United Nations Framework Convention on Climate Change; Ministry of Natural Resources and Environment: Bangkok, Thailand, 2013.
  24. United Nations Climate Change Secretariat. Summary of GHG Emissions for Russian Federation; United Nations Climate Change Secretariat: Bonn, Germany, 2012. [Google Scholar]
  25. USAID. Greenhouse Gas Emissions in Brazil; USAID: Washington, DC, USA, 2019.
  26. Department of Environmental Affairs Republic of South Africa. GHG National Inventory Report South Africa 2000–2015; Department of Environmental Affairs Republic of South Africa: Pretoria, South Africa, 2018; pp. 1–296.
  27. UNFCCC Colombia’s INDC. UN. 2015, pp. 1–10. Available online: https://www4.unfccc.int/sites/ndcstaging/PublishedDocuments/Colombia%20First/Colombia%20iNDC%20Unofficial%20translation%20Eng.pdf (accessed on 24 December 2020).
  28. Ministry of Environment and Urbanization. Fourth Biennial Report of Turkey; Ministry of Environment and Urban Planning: Ankara, Turkey, 2019.
  29. Ministry of Environment, Egyptian Environmental Affairs Agency. Egypt’s First Biennial Update Report to the United Nations Framework Convenstion on Climate Change; Egyptian Environmental Affairs Agency: Cairo, Egypt, 2018; ISBN 2022524616.
  30. USAID. Greenhouse Gas Emissions in Mexico. Fact Sheet; USAID: Washington, DC, USA, 2017; pp. 2015–2017.
  31. USAID. Greenhouse Gas (GHG) Emissions by Sector 1 Change in GHG Emissions in Mexico (1990–2013); USAID: Washington, DC, USA, 2015; pp. 8–9.
  32. USAID. Greenhouse Gas Emissions in the Philippines; USAID: Washington, DC, USA, 2014; pp. 2015–2016. [Google Scholar] [CrossRef]
  33. Kristanto, G.A.; Koven, W. Estimating greenhouse gas emissions from municipal solid waste management in Depok, Indonesia. City Environ. Interact. 2019. [Google Scholar] [CrossRef]
  34. Pariatamby, A.; Tanaka, M.; Islam, A.; Rasul, G.; Manandhar, P.; Parveen, J.A.; Ahmed, N. Municipal Solid Waste Management in Asia and the Pacific Islands; Springer: Berlin/Heidelberg, Germany, 2015. [Google Scholar]
  35. Korai, M.S.; Mahar, R.B.; Uqaili, M.A. The feasibility of municipal solid waste for energy generation and its existing management practices in Pakistan. Renew. Sustain. Energy Rev. 2017, 72, 338–353. [Google Scholar] [CrossRef]
  36. Rashid, M.I.; Benhelal, E.; Rafiq, S. Reduction of greenhouse gas emissions from gas, oil, and coal power plants in Pakistan by carbon capture and storage (CCS): A Review. Chem. Eng. Technol. 2020, 43, 2140–2148. [Google Scholar] [CrossRef]
  37. Kumar, R.; Jilte, R.; Nikam, K.C.; Ahmadi, M.H. Status of carbon capture and storage in India’s coal fired power plants: A critical review. Environ. Technol. Innov. 2019, 13, 94–103. [Google Scholar] [CrossRef]
  38. Ihsanullah, S. China Banned Plastic Waste. Review of prospectives and solutions for plastic waste recycling in Pakistan under circular economy approach. In Proceedings of the ISWA-SWIS Winter School Proceedings; Hossain, M.D., Brenda, A.H., Kamler, A.V., Eds.; Solid Waste Institute for Sustainability (SWIS); The University of Texas at Arlington: Arlington, TX, USA, 2020. [Google Scholar]
  39. Sohoo, I.; Ritzkowski, M.; Heerenklage, J.; Kuchta, K. Biochemical methane potential assessment of municipal solid waste generated in Asian cities: A case study of Karachi, Pakistan. Renew. Sustain. Energy Rev. 2021, 135. [Google Scholar] [CrossRef]
  40. Korai, M.S.; Mahar, R.B.; Uqaili, M.A. Optimization of waste to energy routes through biochemical and thermochemical treatment options of municipal solid waste in Hyderabad, Pakistan. Energy Convers. Manag. 2016, 124, 333–343. [Google Scholar] [CrossRef]
  41. Korai, M.S.; Ali, M.; Lei, C.; Mahar, R.B.; Yue, D. Comparison of MSW management practices in Pakistan and China. J. Mater. Cycles Waste Manag. 2019. [Google Scholar] [CrossRef]
  42. Shahid, M.; Nergis, Y.; Siddiqui, S.A.; Farooq Choudhry, A. Environmental impact of municipal solid waste in Karachi city. World Appl. Sci. J. 2014, 29, 1516–1526. [Google Scholar] [CrossRef]
  43. Sohoo, I.; Ritzkowski, M.; Kuchta, K. Evaluation of behavior of waste disposal sites in karachi, pakistan and effects of enhanced leaching on their emission potential. Detritus 2019, 7, 96–103. [Google Scholar] [CrossRef]
  44. Cossu, R.; Raga, R.; Rossetti, D. The PAF model: An integrated approach for landfill sustainability. Waste Manag. 2003, 23, 37–44. [Google Scholar] [CrossRef]
  45. Morello, L.; Raga, R.; Lavagnolo, M.C.; Pivato, A.; Ali, M.; Yue, D.; Cossu, R. The S. An. A.® concept: Semi-aerobic, Anaerobic, Aerated bioreactor landfill. Waste Manag. 2017. [Google Scholar] [CrossRef] [PubMed]
  46. Ali, M.; Zhang, J.; Raga, R.; Lavagnolo, M.C.; Pivato, A.; Wang, X.; Zhang, Y.; Cossu, R.; Yue, D. Effectiveness of aerobic pretreatment of municipal solid waste for accelerating biogas generation during simulated landfilling. Front. Environ. Sci. Eng. 2018. [Google Scholar] [CrossRef]
  47. World Meteorological Organization. World Weather Information Service. Available online: http://worldweather.wmo.int/en/city.html?cityId=892 (accessed on 23 May 2017).
  48. Verein Deutscher Ingenieure Fermentation of Organic Materials. Characterisation of the Substrate, Sampling, Collection of Material Data, Fermentation Tests; VDI Guideline 4630; Verein Deutscher Ingenieure: Düsseldorf, Germany, 2016. [Google Scholar]
  49. Ritzkowski, M.; Walker, B.; Kuchta, K.; Raga, R.; Stegmann, R. Aeration of the teuftal landfill: Field scale concept and lab scale simulation. Waste Manag. 2016, 55, 99–107. [Google Scholar] [CrossRef]
  50. Engineering ToolBox. Methane–Thermophysical Properties. 2008. Available online: https://www.engineeringtoolbox.com/methane-d_1420.html (accessed on 17 October 2019).
  51. United States Environmental Protection Agency (EPA). LFG energy project development handbook. Energy 2017, 94. [Google Scholar] [CrossRef]
  52. Zuberi, M.J.S.; Ali, S.F. Greenhouse effect reduction by recovering energy from waste landfills in Pakistan. Renew. Sustain. Energy Rev. 2015, 44, 117–131. [Google Scholar] [CrossRef]
  53. Rastogi, M.; Hooda, R.; Nandal, M. ChemInform abstract: Review on anaerobic treatment of municipal solid waste with leachate recirculation. Chem. Inform. 2015, 46. [Google Scholar] [CrossRef]
  54. Liu, W.; Liu, Y.; Zhu, B.; Li, X. Enhanced biogas production from a stimulated landfill bioreactor for the co-disposal of municipal solid waste and coal wastes. Energy Sour. Part A Recover. Util. Environ. Eff. 2014, 36, 1186–1194. [Google Scholar] [CrossRef]
  55. Francois, V.; Feuillade, G.; Matejka, G.; Lagier, T.; Skhiri, N. Leachate recirculation effects on waste degradation: Study on columns. Waste Manag. 2007, 27, 1259–1272. [Google Scholar] [CrossRef]
  56. Nwaokorie, K.J.; Bareither, C.A.; Mantell, S.C.; Leclaire, D.J. The influence of moisture enhancement on landfill gas generation in a full-scale landfill. Waste Manag. 2018. [Google Scholar] [CrossRef] [PubMed]
  57. Ritzkowski, M.; Heyer, K.U.; Stegmann, R. Fundamental processes and implications during in situ aeration of old landfills. Waste Manag. 2006, 26, 356–372. [Google Scholar] [CrossRef] [PubMed]
Figure 1. Share of GHG emissions by sector in Pakistan [15].
Sustainability 13 00151 g001
Figure 2. Schematic and setup of landfill simulation reactors modified from [43].
Sustainability 13 00151 g002
Figure 3. Schematic diagram of the biochemical methane potential (BMP21) test setup modified from [39].
Sustainability 13 00151 g003
Figure 4. Estimation of residual methane emissions from different landfill scenarios.
Sustainability 13 00151 g004
Table 1. Greenhouse gas (GHG) inventory of municipal solid waste sectors in developing countries.
CountryTotal GHG EmissionGHG Emissions from the MSW SectorShare of the MSW Sector in GHG EmissionsReporting YearReference
Mt CO2-eqMt CO2-eq(%)
Pakistan329.512.452.22015[15]
India2607.4914.860.572014[16]
China11,18610412014[17,18]
Bangladesh19018.28102012[19]
Sri Lanka4512.47282011[20]
Malaysia290.2334.32122011[21]
Indonesia216164.732013[22]
Thailand318.6611.823.72013[23]
Russia2297.1553.412.332012[18,24]
Brazil1357.1845.523.42014[25]
South Africa542.5815.762.92015[26]
Colombia22413.716.12010[27]
Turkey527.279.11.722017[28]
Egypt325.6113.1942015[29]
Mexico665.330.94.62013[30]
Cambodia51.670.390.72013[31]
The Philippines 157.610.472012[32]
Worldwide49,36015603.12016[12]
Table 2. National GHG inventory of Pakistan for the year 2015 [15].
SectorEnergyIndustryAgricultureWastesLand-Use Change and Forestry (LUCF)
GHG emissions (Mt CO2-eq)184.021.85174.5615.6510.39
Table 3. The composition of synthetic MSW sample used in this landfill simulation experiment [42].
MSW ComponentFood WasteGreen WastePaperGlassMetalPlasticFinesNappiesTextileTetra PackWood
Fraction (%)26.11785.61.183.79.87.6103.1
Table 4. Physicochemical properties of the synthetic MSW sample. [39,43].
SampleMoisture ContentVolatile Solids (VS)Total Organic Carbon (TOC)Particle Size
(% Fresh mass, FM)(% Dry mass, DM)(% DM)(mm)
Fresh MSW55.583.141.2~25
Table 5. Basic data of waste loaded in the landfill simulation reactors [43].
Waste Loading DataUnitR1R2R3R4
Fresh mass(kg)2.833.42.8
Dry mass(kg)1.241.331.511.24
Organic dry mass(kg)1.031.101.251.03
Volume(L)4.524.164.654.26
Wet density(L/kg)0.620.720.730.66
Dry density(L/kg)0.280.320.320.29
Table 6. Summary of landfill simulation reactor (LSR) operations.
LSR#Landfill ApproachOperation Time
(An-Aerobic/Aerated)
Average Water AdditionLeachate Recirculation Aeration Rate
(days)(mL/week)(daily)(L/h)
R1Con. An-A with post-aeration448 (252/196)56-0.45
R2Existing Situation44856--
R3BRL with post-aeration364 (252/112)165Twice0.42
R4BRL without post-aeration364165Twice-
Con. An-A, Conventional anaerobic; BRL, Bioreactor.
Table 7. Quality and quantity of waste samples used for the BMP21 test after the LSR experiment.
LSRTotal solids (TS)VSTOCQuality of Waste
#(% FM)(% DM)(% DM)(g FM)(g VS)
R133.2456.7430.349.541.8
R236.0374.0939.656.741.8
R326.762.3436.4210.811.8
R426.0469.5440.069.941.8
Table 8. Summary of parameters and analytical methods.
ParameterAnalytical Method/StandardMaterialReference
Total solids (TS)DIN 38 414-S 2Solid waste[43]
Volatile solids (VS)DIN 38 409-H 1-3Solid waste[43]
Total organic carbon (TOC)Difference between TC and TIC (TC-TIC)Solid Waste/Leachate[49]
Total carbon (TC)DIN EN 15936 Multi EA 4000 AnalyzerSolid waste[49]
Total inorganic carbon (TIC)DIN EN 15936 Multi EA 4000 AnalyzerSolid waste[49]
Biogas composition (N2, O2, CO2, CH4)Gas Chromatography (HP-5890), AgilentLandfill/Off-gas[39]
Table 9. Basic MSW data used for estimation of methane emissions and power generation from waste disposal sites in Karachi.
DataUnitValueReference
MSW generation(tons/day)15,220[39]
MSW landfilled(%)60[41]
MSW landfilled, FM(tons/day)9132
Organic fraction in MSW(%)58.2[43]
Organic mass landfilled, FM(tons/day)5310.3
Dry mass (DM) content(%)44.4
Organic dry mass (ODM) content in MSW(%)83.1[43]
Dry mass landfilled(tons/day)4056.4
Annual rainfall rate in Karachi(mm/year)176[47]
Density of methane(g/m3)660[50]
Calorific value of methane(Mj/ton)55,526[39]
Global warming potential of methane(CO2-eq)23[51]
1 kWh =(Mj)3.6
Electric efficiency (η)(%)35[52]
Methane recovery rate (r)(%)75[51,52]
Table 10. Calculation of methane emissions in different landfill approaches and existing MSW situations in Karachi.
LSR Experiment Result AnalysisLandfill ApproachConventional with Post-Aeration Existing SituationsBioreactor with Post-AerationBioreactor without Post-Aeration
ScenarioCase-1Case-2Case-3Case-4
UnitR1R2R3R4
Cumulative methane production(L/kg DM)95.0108.093.368.0
An-A operation duration(days)252448252364
Methane production rate(L/kg DM/d)0.380.240.370.19
Volume of methane produced(m3/year)558,162.2356,930.0547,997.7276,392.0
Quantity of methane produced(tons/year)368.4235.2361.7182.4
Methane emissions(tons of CO2-eq/year)8472.95418.28318.64195.6
Table 11. Calculation of residual methane potential of waste from landfill approaches estimated from the BMP21 test.
BMP21 Test Result AnalysisLandfill ApproachConventional with Post-AerationExisting SituationBioreactor with Post-AerationBioreactor without Post-Aeration
ScenarioCase 1Case 2Case 3Case 4
UnitR1R2R3R4
Cumulative methane production(L/kg DM)3.459.874.887.01
BMP21 test duration(days)21212121
Methane production rate(L/kg DM/d)0.160.470.230.33
Volume of methane produced(m3/year)141,444.8404,655.0200,072.6287,399.3
Quantity of methane produced(tons/year)93.4267.1132.0189.7
Residual methane emissions(tons of CO2-eq/year)2147.16142.73037.14362.7
Table 12. Summary of the methane emission reduction in different scenarios.
ScenarioApproachLSR#CH4 Emission Reduction Compared to Case-2 (%)
Case 1Conventional landfill with post-careR165
Case 3Bioreactor landfill (BRL) with post-careR351
Case 4Bioreactor landfill (BRL) without post-careR429
Case 2Existing situation (open dumping)R20.00
Table 13. Calculation for electrical energy generation potential estimations in the present situation in Karachi by considering ≤0.5% CH4.
LSR Experiment Results AnalysisLandfill ApproachConventional with Post-Aeration Bioreactor with Post-Aeration
ScenarioCase-1Case-3
UnitR1R3
Cumulative CH4 generation from LSRs(L/kg DM)94.090.0
Weekly CH4 production reached <0.5% of cumulative CH4 produced(days)231140
CH4 production rate(L/kg DM/d)0.410.64
Volume of CH4 produced(m3/d)1650.72607.7
Quantity of CH4 quantity produced(tons/d)1.11.7
Energy potential of CH4 recovered(Mj/d)60,492.495,565.1
Thermal power of CH4 recovered(MWh)16.826.55
Estimated electric power(MWh)4.47.0
Table 14. Estimation of power generation from conventional and bioreactor landfill approaches.
Daily MSW Disposal Rate(%)60 *708090100
Daily electric power generation in case 1(MWh)4.45.15.96.67.4
Daily electric power generation in case 3(MWh)7.08.19.310.511.6
* Present waste disposal rate in Karachi.
Publisher’s Note: MDPI stays neutral with regard to jurisdictional claims in published maps and institutional affiliations.

