Article

Study on the Spatial Pattern of Migration Population in Egypt and Its Flow Field Characteristics from the Perspective of “Source-Flow-Sink”

1
Department of Arabic, Faculty of Arts, Alexandria University, Alexandria 11445, Egypt
2
School of Architecture, Southeast University, Nanjing 210096, China
*
Author to whom correspondence should be addressed.
Sustainability 2021, 13(1), 350; https://0-doi-org.brum.beds.ac.uk/10.3390/su13010350
Submission received: 2 December 2020 / Revised: 29 December 2020 / Accepted: 29 December 2020 / Published: 2 January 2021
(This article belongs to the Special Issue Urban Growth and Demographic Dynamics)

Abstract

:
Based on the provinces as the spatial nodes of population migration, a “Source-Flow-Sink” analysis framework of population migration flow in Egypt was established by “Source-Sink” Theory and Flow Field Theory to study the migration population in Egypt. It reveals the spatial pattern of the migration population in Egypt and its flow field characteristics and provides theoretical basis for the formulation of population development policies and regional spatial governance planning. The results show that: (1) there are significant spatial differences in the size and rate of migration in Egypt. In 2017, the migration population in Egypt exceeded 2.2 million in total, with a migration rate of 2.33%, and the extreme multiple reached 80 and 12. (2) According to the spatial pattern of geographical distribution, the Source System is divided into five types: axis type, layer type, fan type, oblique symmetry type, and scattered jump type. There are only three types in Sink System, namely wide area coverage type, local development type, and scattered jump type. Source Places lie in the middle, Sink Places are symmetrical from east to west, and Exchange Places are concentrated along the Mediterranean coast in the north of Cairo on the whole, with the initial formation of a “core-periphery” spatial pattern. (3) The interprovincial population migration flow in Egypt is dominated by neighborhood penetration and polarization of high-rank nodes (capitals or regional economic centers), giving rise to 7 modes of central system spatial structures and 3 modes of pole-core interaction. The central system of flow fields with clear priorities and the streamline channel network with layered trunks and branches basically take shape, overall characterized by stepped runoff from east to west, and local convection from south to north.

1. Introduction

As an important representation and carrier of regional social and economic activities, population flow has become very common with the improvement of the level of economic and social development and the improvement of transportation infrastructure conditions, and it promotes the fast flow and optimization of material, capital, information, technology, and other factors in the regional production network. Scholars at home and abroad have paid great attention to the research on the spatial behavior of population mobility and have made a lot of achievements in the macro pattern and micro location characteristics of population flow and the reasons for their appearance.
The first is the tracking study of the spatial characteristics of population flow and migration in spatial units or cities at different levels in all countries, especially China. Yingyi Cao analyzed the Evolution Characteristics of Spatial Concentration Patterns of Interprovincial Population Migration in China from 1985 to 2015 [1]. Cindy and Kuninori Otsubo analyzed the spatial characteristics of interprovincial population flow in China from 1990 to 2000 and its relationship with regional development [2,3]. Liang Zai analyzed the geographic pattern of the floating population in 2000 and the reasons for their migration [4,5]. Qiao Luyin analyzed the characteristics of the temporal and spatial changes of the net floating population in counties in China from 2000 to 2010, arguing that population mobility and agglomeration have increased significantly, and the west has already ushered in a small-scale net inflow due to the benefit of the western development strategy as a net outflow region for a long time [6]. Wu Jiawei studied the changes in the distribution of the floating population in Chinese cities from 2010 to 2016 and their influencing factors, finding that the spatial agglomeration of population mobility reached its peak in 2010, and inland provincial capital cities and coastal cities with relatively backward economic development have become the new concentration of floating population [7]. Wang Lucang analyzed the temporal and spatial characteristics of the floating population in different cities and their influencing factors, believing that the imbalances in areas of population mobility are further intensifying, and the mobility is positively correlated with the size of the city [8]. Shenghe Liu established a method for identifying the regional types of floating population and analyzed the spatial pattern of floating population in China [9]. Hiroto Kuninaka analyzed the rank-size characteristics of the floating population in Japan based on Zipf’s law [10]. Ruliang Liu built a population flow model and simulated the population flow in Jiangxi Province based on the system dynamics [11].
The second is the empirical analysis of the interaction between the floating population and multiple factors. According to Meifeng Zhao, the urban bus system is an important factor affecting the space distribution of the urban population, and the expansion of the urban subway system has a greater impact on the floating population in the Beijing metropolitan area than local residents [12]. Bayona-i-Carrasco Jordi analyzed the characteristics of commuting population flow in the Barcelona metropolitan area and found the obvious spatial agglomeration effect in population mobility [13]. According to Wang Xuming, the GDP per capita is related to the size of the floating population by a linear or power law relationship, and the distribution of relative migration intensity is controlled by a shifted power law relationship [14]. Shi Guang found that air pollution is transferred along with the spatial movement of floating population [15]. Based on the example of Ukraine, Levytska Olha analyzed the impact of the factors such as public health, education, and employment on population migration in Eastern Europe [16].
The third is the study of the spatial and social effects of population mobility. Shi Qiujie and Duanjun Gao analyzed the spatial pattern of the floating population in China, believing that a new regional development model and a spatial combination with Chinese characteristics have emerged under the influence of the floating population, which has an great impact on the future urbanization process and regional planning in China [17,18]. Luo Jiaojiao, from the perspective of land for production and land for living, analyzed the relationship between floating population and urban land expansion based on the Structural Equation Model [19]. Based on the geospatial network analysis, Ruoxin Zhu made a quantitative analysis of the population migration network in China before and after the Spring Festival, revealing the imbalance of urban and regional development and social perception in China [20]. Jeanty P Wilner established a spatial simultaneous equation model between population migration and housing prices based on the data from the Michigan census, and the analysis concluded that there is a complex spatial dependence between the floating population and the housing prices [21].
The fourth is the analysis of the spatial dispersion characteristics of international migration. According to Gou Wensha, the global population migration network showed the characteristics of clustering and dispersion from 1960 to 2015, and a “core-peripheral” hierarchical structure has come into being [22]. Jaesun Wang, based on the samples of refugees from Africa and the Middle East having flooded into Europe, analyzed how interpersonal relationships and life satisfaction affect immigration’s acceptance of social policies [23]. Huete Garcia Maria Angeles analyzed the community integration policy of Seville’s international immigrant population and developed four models of the neighborhood [24].
From the perspective of social development, the population migrates when individuals or families seek a new residence place to meet their particular needs, which will change their income and lifestyle [25], and migrants constitute an important part of the floating population. Compared with the temporary population flow, the “flow” formed by population migration has a higher temporal and spatial stability, and the migration is often subject to the influence of social and political factors, such as residence, settlement, and the schooling of children. From the perspective of geographic space, population migration refers to the movement of people’s living location in space across the boundary of a certain region. The spatial differentiation of population migration is an intuitive social expression of spatial interaction between source and destination, showing regional differences in economic levels, investment intensity, and related employment opportunities. Therefore, population migration flow mainly refers to the geographical movement of population across different spatial units under the positive and negative action of “potential” difference and distance resistance in economic and employment opportunities between regions, which is the most representative population flow.
Compared with temporary population flow, the population migration flow has a space distribution that can reflect characteristics of social and economic relations most directly between administrative areas at different levels, and better reflect the comprehensive influence of social, economic and political factors on regional relations and the relatively stable spatial relations developed under the long-term action. Scholars at home and abroad have also developed a strong interest in the spatial behavior of population migration and made a number of high-level research achievements in the field of space distribution characteristics of the population migration and residential intention of the population migration and their influencing factors. Taking Bari and its surrounding towns in Italy as an example, Aquilino Mariella monitored and analyzed the space distribution of the migration population [26]. Nayef conducted a spatial simulation of population migration in Kuwait, revealing the preference of the floating population for new cities [27]. Raymer James analyzed the source and changes of the immigration population in Australia from 1981 to 2016 [28,29]. Liliana Perez simulated the decision-making of new immigrants to resettle new families in Montreal Island, Canada, analyzed the spatial pattern of population distribution, and applied it to urban planning [30]. Liang Zai analyzed the changes of migration patterns in China from 1987 to 1995 and from 2000 to 2010 and their influence [31]. Shukui Tan focused on the urban residential intention of the floating population and its influencing factors [32]. Taking Jiangsu Province as an example, Tang Shuangshuang found that small cities have become the second most popular destination of floating population between urban and rural areas second following big cities [33]. According to Wang Ning, cities above the prefecture level in China, especially large cities and megacities, have obvious advantages in the total agglomeration of floating population, and small towns have played an active role in agglomeration of floating population from the surrounding countryside [34]. Joan studied the evolution characteristics of the space distribution of the migration population in the Barcelona metropolitan area and according to the analysis based on the spatial lag model and the spatial error model, found that family income, small-scale housing and migrant diversity were the most important factors affecting the growth of the migration population [35]. Carles Martori Joan analyzed the spatial segregation patterns of the migration population in the metropolitan area of Barcelona and calculated five segregation indexes [36]. Now, the research on the distribution dynamics of population movement and migration in Egypt has attracted much attention with a number of exploratory research results achieved. Based on the GIS tool, Stewart quantitatively evaluated the population density change patterns in Greater Cairo from 1986 to 1996 and analyzed the urban and population spatial structure of Greater Cairo [37]. Barry McCormick and Jackline Wahba analyzed the geographical inequality of return international migration in Egypt [38]. Based on expert interviews, questionnaire survey on the migration population and statistical data analysis of the Central Agency for Public Mobilization and Statistics, Tamer Afifi tried to establish the relationship between Egyptian international migration and desertification (including soil degradation, soil salinity, soil erosion and sand dunes) [39]. With a view that migration is a major living strategy of a family, Arouri Mohamed analyzed the push as well as pull effects of wealth inequality on Egyptian migrants based on gravity models [40]. Dalia M. Ibrahiem analyzed the causal relationship between road energy consumption, economic growth, urbanization and population growth in Egypt from 1980 to 2011 through Johansen Co-Integration Method [41]. Ghada Gomaa A. Mohamed analyzed the dynamic relationship between Egyptian population growth and economic development from 1981 to 2007 and suggested taking different measures to achieve resource balance rather than to suppress the population growth [42]. Mohamed R. Ibrahim analyzed the selection of the place of residence of Egyptian immigrants and its influencing factors based on the example of Alexandria [43]. Siham Gourida took Egypt as an example to analyze the reasons, policies and aspects of Arab immigration [44]. Ayman Zohry, from the perspective of the immigrating country, analyzed the migrants in Egypt, mainly refugee communities, and their social, economic, and political conditions [45]. In general, the domestic and international migration and population mobility studies in Egypt have attracted the attention of scholars, and they have analyzed the economic and social characteristics, reasons for migration, choice of residence, and economic and spatial effects of migrants based on a variety of methods. However, the study on the spatial pattern and flow field characteristics of the migration population in Egypt is still blank. Scholars and policy makers also have little knowledge of the geographical characteristics and spatial differences of the “source-flow-sink” of the migrant population in Egypt and its provinces, leading to the lack of sufficient basis in making the Egyptian population development policy and regional spatial governance planning.
Population migration is a typical spatial behavior, which plays an important role in social and economic activities. The research on the spatial characteristics and regional differences of population migration and the analysis of its “source-flow-sink” system in different regions are helpful to reveal the interaction between population resources and different economic and social spaces, and to provide scientific reference for the optimal allocation of national population resources, to achieve the sustainable development of population and space. Academics have now carried out exploratory analysis on the regional population source and sink system, including Ai Tinghua’s analysis on the migration size, migration direction and migration preference index of interprovincial floating population in China based on the OD diagram [46]. KUMO analyzed the spatial characteristics of interregional population migration in Russia using an origin to destination matrix [47]. To sum up, the research on the population migration in Egypt is in the ascendant. There have been a number of valuable research results now, but there are still some deficiencies in these studies, such as the lack of special research on the spatial pattern of the “source-flow-sink” system of the population migration in Egypt, and they have a weak support for the formulation of Egypt’s population development strategic planning and spatial governance policies. What are the characteristics of the space distribution of interprovincial migration population in Egypt? What differences are there in the migration population flow field between different provinces? What differences are there in the spatial pattern and regional structure of “source-flow-sink” of population migration in different provinces? To answer the above questions, this paper conducted an empirical research on Egypt and analyzed the spatial characteristics of the “source-flow-sink” of the migration population in Egypt at the provincial and economic region spatial scales based on the government census data, which is helpful to deepen the understanding of the space distribution law of the migration and floating population in Egypt.

2. Research Methods and Data Sources

2.1. “Source-Sink” Theory

The “Source-Sink” theory originated from environmental science and matured in the study of landscape ecology. It asserts that there are two systems of “source” and “sink” during the temporal and spatial change in matter and landscape. Here, “source” refers to the starting point and head stream of a process, and “sink” refers to the place where a process disappears. The essence of the “Source-Sink” theory is to give a process meaning to the landscape in the conventional sense from the perspective of spatial pattern analysis, that is, to analyze the process law of material diffusion, evolution and digestion by analyzing the space distribution balance of “source” and “sink” landscape or elements, to further explore the ways and methods conducive to the regulation and control of ecological or social processes. The “Source-Sink” theory is an important theoretical method to identify the law of the spatial development process of matters, and now it has been widely used in multidisciplinary study. In terms of biological sciences, Matthieu Paquet analyzed the habitat source-sink dynamic characteristics of the farmland passerine population [48]; Kokko analyzed the impact of source-sink dynamics on the habitat use strategy of regional organisms [49]; Sample Christine proposed a generalized modeling method to quantify the spatial structure of the population source sink habitat system [50]. In terms of landscape ecology science, Nicola Zaccarelli analyzed the Source/Sink Patterns of Disturbance and Cross-Scale Mismatches in a Panarchy of Social-Ecological Landscapes [51]; Ruiming Ma and Pramanik evaluated the urban heat island landscape patterns of Shenzhen, China and Delhi, India based on the “Source-Sink” theory respectively [52,53]. In terms of environmental science, Zhang X, Jiang Mengzhen and Xin Zhang analyzed the source-sink landscape pattern of non-point source pollution [54,55,56]. In terms of resource science, Wei Huang analyzed the grain source-sink system of prefecture level cities in China [57]; Wu X D analyzed the source-sink system of the world’s arable land [58]; Wu X F analyzed the source and sink systems of world crude oil and coal supply chain [59,60]. In terms of transportation and tourism science, Wu Tong evaluated the landscape pattern of the area around Xiamen’s main roads (within 1 km) based on the source-sink landscape influence [61]; Liu Yuliu conducted an identification analysis of the taxi traffic source-sink regions in Shanghai [62]; Qiushi Gu analyzed and mapped the source and sink of the regional tourist flow [63]. In terms of land use science, Felzer Benjamin S. analyzed the source-sink patterns of land use and land cover changes in the United States since 1700 [64]; Qin Menglin analyzed changes in the spatial structure of carbon sources and carbon sinks in the urban fringe [65]. In terms of climate change, Sakalli A identified carbon sinks and carbon sources in Europe and their impact on climate change [66]; Johnston Craig analyzed the carbon sequestration model of global forestry sectors and its source and sink system changes [67]. In terms of floating population and population migration, there have been a small number of exploratory studies based on the Source-Sink theory, although the empirical analysis is still not deep and broad enough. Kawecki Tadeusz J, Brawn Jeffrey D, and Gundersen G analyzed the impact of source-sink dynamics on population statistics [68,69,70]; Wang Yuxia [71] studied the spatial pattern of the sources and sinks of the migration population during the Spring Festival in China.
According to Haggett, spatial structure pattern and order analysis can be decomposed into six geometric elements, that is, motion mode, path, node, nodal level, domain and diffusion [72]. Based on the “Source-Sink” theory and the decomposition concept of six elements proposed by Haggett, this article establishes a spatial analysis framework of the “source-flow-sink” of the migration population and tries to use it to explore the regular characteristics of the space distribution and development process of population migration. Administrative units at different levels of cities, provinces, and economic regions are the spatial nodes of population flow and migration; population inflow and outflow constitute the spatial movement mode of population, and the infrastructure corridors such as roads and rivers carrying the population flow constitute the spatial constitute the path of population migration. Floating population and migrant population interact and disperse in space, and gradually form nodal levels and domains in geographical distribution. In the “source-flow-sink” spatial analysis framework, “source” and “sink” are spatial nodes with opposite population flow characteristics. According to the direction and intensity of the population flow, spatial nodes are divided into three types: source places, sink places, and exchange places. “Source place” refers to a geographical spatial unit where population outflow is greater than population inflow, which is a spatial type of “source” promoting the development of population migration. “Sink place” refers to a geographical spatial unit where population inflow is greater than population outflow. It is a gathering place for accepting the floating and migration population, and a spatial type that prevents and retards the development of population flow and migration process. “Exchange place” specifically refers to a spatial unit with large-scale population inflow and outflow, where the two are relatively balanced. “Flow” refers to the channel and its network for diffusion and convergence of floating and migration population between “source places” and “sink places”. By analyzing the game between the expansion “source place” and the resistance “sink” and the characteristics of “flow” network by classifying source places, sink places and exchange places based on different administrative units at the levels of cities, provinces and economic regions as nodes, it can reveal the process of competitive control and coverage of space by floating and migration populations, and can couple the distribution pattern of migration population with the dynamic process, thus providing a scientific basis for proposing effective population flow and migration control policies, and a reference for the establishment of national and regional spatial governance strategies and development plans.
Based on the quantitative determination of the property of Egyptian provincial nodes according to the ratio of population immigration to emigration, the provincial nodes are divided into three types in this paper, that is, “source places”, “sink places” and “exchange places”. The equation for calculating the ratio of population immigration to emigration is as follows:
R i = O p i I p i
where R i represents the ratio of population immigration to emigration,   O p i represents the immigrant population size, and I p i represents the emigrant population size. In an ideal setting, R i > 1 indicates that emigration population is larger than immigration population in the space i (city, province, economic region), and it can be determined that i is a “source place”, where it is more of “source” with the value of R i growing; on the contrary, if R i < 1, it is determined that i is a “sink place”; R i = 1 indicates that the emigrant population size is equal to the immigrant population size in the space i , and it can be determined that i is an “exchange place”; if R i = 0, that is, O p i = 0 and I p i ≠ 0, it indicates that the population in the space i only moves in unidirectionally with no population moving out, and it can be determined that i is a “one-way sink place”; when R i tends to ∞, that is, I p i = 0 and I p i ≠ 0, it indicates that the population in the space i only moves out unidirectionally with no population moving in, and it can be determined that i is a “one-way source place”. There is rarely a clear distinction between “source places” and “sink places” during the actual development, that is, it’s a rare case when R i = 1. For the determination of an exchange place, it is not practical to use R i = 1 directly, so an interval value instead of a certain value should be depended on for analysis. To improve the accuracy and applicability of the analysis, the interval value of the index R i for the exchange place determination should be determined based on the actual analysis and trial calculation results of interprovincial population migration network in Egypt. The median of R i is 0.81 in the overall network analysis of interprovincial population migration in Egypt, and the median of R i in the analysis of interprovincial population migration network is 1.36 and 1.59, respectively, in Cairo and Alexandria, with a large migration population. To sum up, detailed criteria for determining “source places”, “sink places”, “exchange places” and other node attributes of the migration population in Egypt based on R i in this paper are shown in Table 1.

2.2. Flow Field Theory

As a physical concept originally, “field” refers to the spatial flow and distribution law of the migration population, including the flow and direction of migration population, and the space distribution pattern of population migration flow, when applied to the area of population migration. The flow, that is, the total migration population, is represented by the sum of the current and original population of a province and calculated based on the equation T i = O p i + I p i . A larger flow suggests more active population migration with a greater influence. Flow direction indicates where the migrant population moves. It is represented by the net value of immigrants and emigrants in a province, calculated based on the equation T i = O p i + I p i . N i > 0 indicates dominance by outflow and N i < 0 indicates by inflow. N i = 0 indicates that the outflow and inflow are equivalent (convection) or there is no population migration (no flow), which is a special case, extremely rare in reality. In the flow field analysis, outflow, inflow and convection in the flow direction correspond to source places, sink places and exchange places respectively. In space, the movement track of the migration population from the source to the sink can be regarded as the “path line” of the flow field, and the flow size represents the spatial influence of the flow field.

2.3. Research Steps

The main research steps are as follows:
The first step is to download the census statistics on migration in Egypt from the website of Central Agency for Public Mobilization and Statistics, and to carry on communication exchanges on data collection and its indexical meaning for abnormal or missing data by email and phone. The second step is to calculate the immigrant population size and the emigrant population size of 27 provinces and calculate the interprovincial immigrant and emigration population sizes in Egypt at the national level by summation. The third step is to calculate R i of 27 provinces and in the state of Egypt based on the equation in Section 2.1, and determine the spatial attributes of the provinces in accordance with the parameters in Table 1, to define the source, sink, and exchange places of the migration population. The fourth step is to project the results of the third step to the map of Egypt and analyze the spatial pattern characteristics of the “source-sink” of the migration population in Egypt. The fifth step is to calculate the interprovincial population migration flow in Egypt, draw Sankey diagram and pyramid diagram, and analyze the flow direction and flow field characteristics, to reveal the spatial pattern of population migration flow in Egypt based on the spatial pattern of source and sink in the fourth step.

2.4. Data Sources

The data in this paper are mainly from the Statistical Yearbook-Housing, Statistical Yearbook-Population and General Indicators, Egypt in Figures-Population published by the Central Agency for Public Mobilization and Statistics, and collection of migration population and total population of all provinces in Egypt in 2017.

3. Results

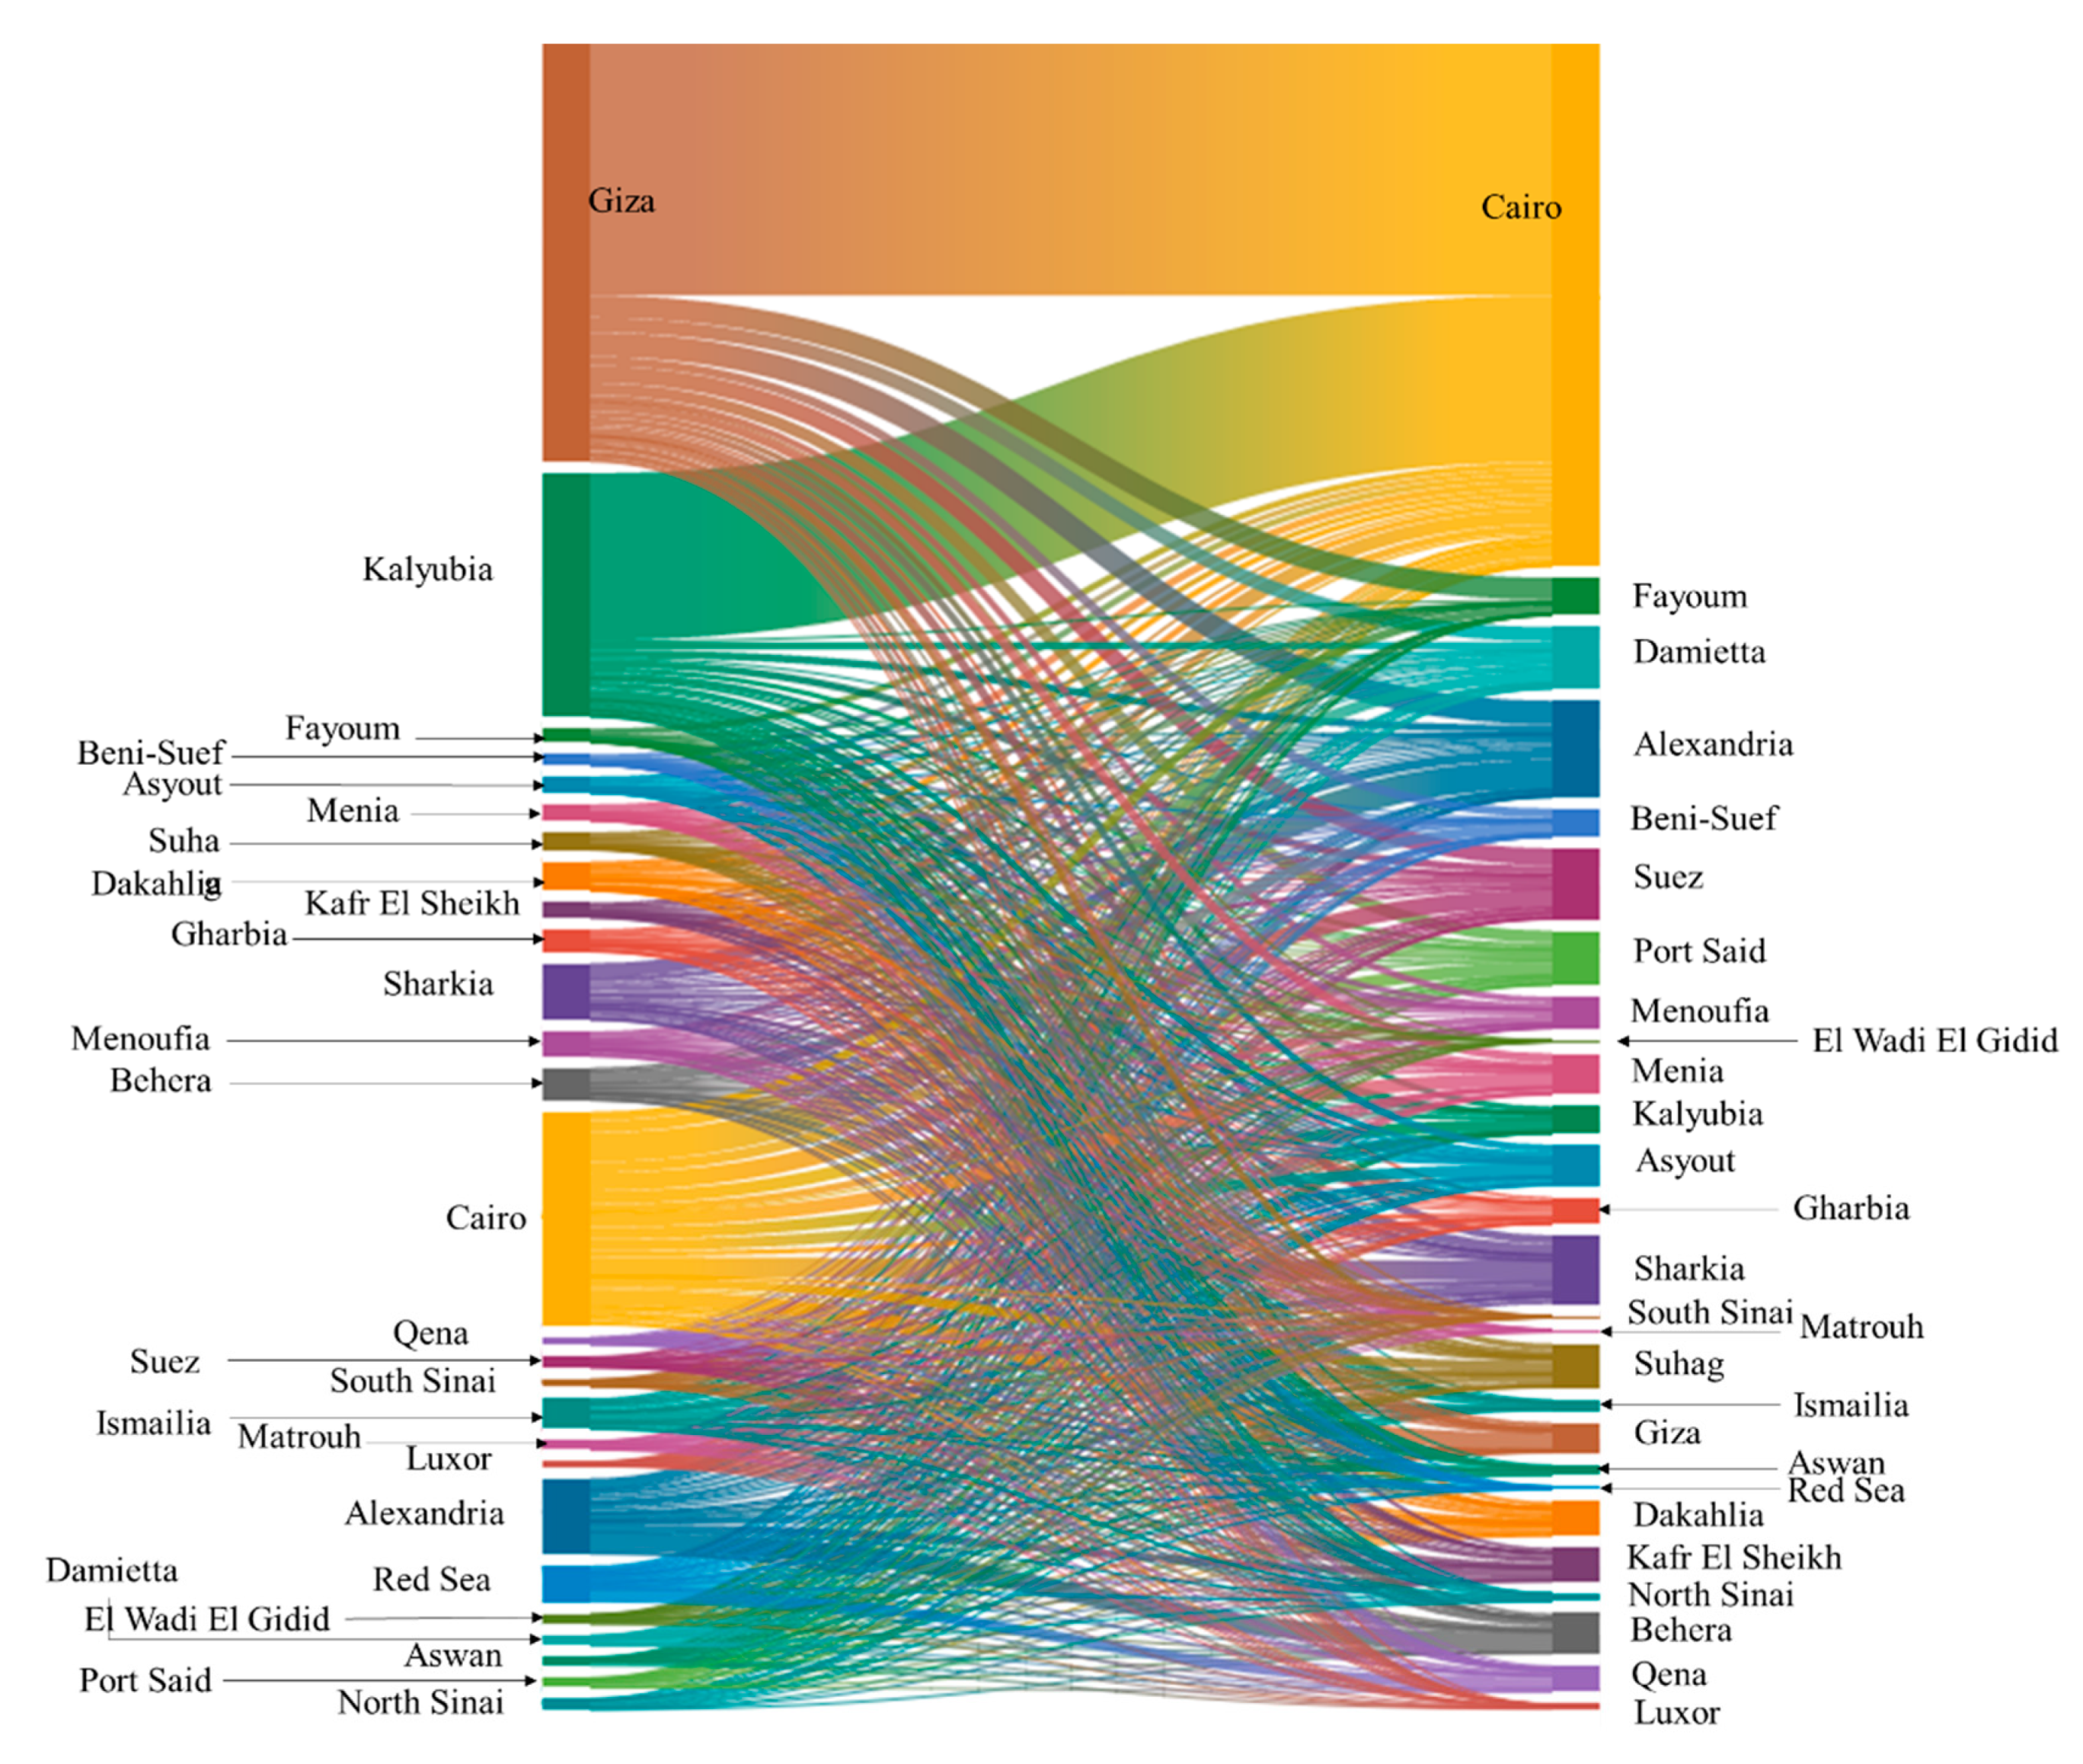
3.1. Overall Analysis

There are significant differences in the migration population size and rate of migration in Egypt. Table 2 shows that the total interprovincial migration population size in Egypt is 2.2091 million. Cairo has the largest migration flow at over 600,000, followed by Giza, Kalyubia, Alexandria, and Sharkia with more than 100,000, and South Sinai has the smallest, less than 8000, with an extreme multiple (maximum/minimum) of 80. The overall migration rate (migration population/total population) is 2.33% in Egypt. Suez and the Red Sea have the largest value at about 9%, followed by more than 6% in South Sinai, Port Said and Cairo, and Luxor has the smallest, only 0.72%, with an extreme multiple of 12. In terms of the immigrant population size, Giza is the largest (about 350,000), followed by Kalyubia and Cairo (about 200,000), and Luxor is the smallest, about 4000, with an extreme multiple of 82. In terms of immigration rate, Red Sea is the largest (over 8%), followed by South Sinai (over 6%) and Giza (less than 5%, mainly because of the large population base), and Qena is the smallest, only 0.21%, with an extreme multiple of 40. In terms of the emigrant population size, Cairo is the largest (over 400,000), followed by Alexandria, Suez, Sharkia and Damietta (50,000–100,000), and El Wadi El Gidid is the smallest, less than 1000, with an extreme multiple of 463. In terms of emigration rate, Suez is the largest (about 8%), followed by Port Said and Cairo (about 5%), and Giza is the smallest, only 0.28%, with an extreme multiple of 28.
The interprovincial migration flow in Egypt is complex. The flow network composed of multi center flow field and multi-channel streamline begins to take shape. Figure 1 shows that the interprovincial population migration is directional. The migration pairs (the connection line between the two provinces) reflects coverage and exchange density of the population migration flow field and provides perspective into the complexity of migration flow network. Ideally, there should be 702 exchange pairs in 27 provinces of Egypt, but in fact there are 658, accounting for more than 90%. The development of a migration network is already complicated at present. The interprovincial population migration space in Egypt has given rise to a flow field system with 3 gathering fields and 2 diffusion fields as the center, and a migration flow network with 2 trunk streams and 8 tributaries as the framework. The gathering field with Giza as the core and the diffusion field with Cairo as the core constitute the first-order center of the flow field system. The gathering field with Cairo and Kalyubia as the core and the diffusion field with Alexandria as the core constitute the second-order center of the flow field system. The gathering field with Alexandria and Sharkia as the core and the diffusion field with Suez, Sharkia, and Damietta as the core are still in the process of development, only constituting a rudiment of the third-order center of the flow field. Cairo-Kalyubia and Cairo-Giza are the “trunk streams” of interprovincial migration in Egypt, while Cairo-Alexandria, Giza-Alexandria, Giza-Fayoum, Cairo-Suez, Giza-Suez, Giza-Fayoum, Cairo-Sharkia, and Behera-Alexandria constitute tributaries.
The “Source-Exchange-Sink” system of Egypt has taken shape, and the communities are concentrated and contiguous in the form of cluster. Figure 2 shows that Cairo, Port Said, Suez, Damietta, Kafr El Sheikh, Beni-Suef, Fayoum, Menia, Asyout, Suhag, and Qena are Source Places; Kalyubia, Ismailia, Giza, Red Sea, El Wadi El Gidid, Matrouh, and South Sinai are Sink Places; Alexandria, Dakahlia, Sharkia, Gharbia, Menoufia, Behera, Aswan, Luxor, and North Sinai are Exchange Places. There are no Pure-Sink Places or Pure-Source Places. From the perspective of the quantity of regions, Source Places > Exchange Places > Sink Places. Source Places lie in the middle, Sink Places are symmetrical from east to west, and Exchange Places are concentrated along the Mediterranean coast in the north of Cairo, with the initial formation of a “core-periphery” spatial pattern. Basically, with Cairo and Suez as the sources, Source Places extend southward along the Nile River, with the formation of continuous distribution of the source space clusters. Sink Places are mainly in the western desert region of Egypt and in North Sinai and South Sinai that are less developed along the Red Sea coast. They are symmetrical from east to west with Source Places as the axis. Exchange Places are concentrated in the Cairo-Alexandria urban corridor, excluding Cairo. It is worth noting that, limited by the total population size and the administrative area, Aswan, North Sinai, and Luxor are small in size of both immigrant and emigrant populations. They are Exchange Places, but far from mature development.

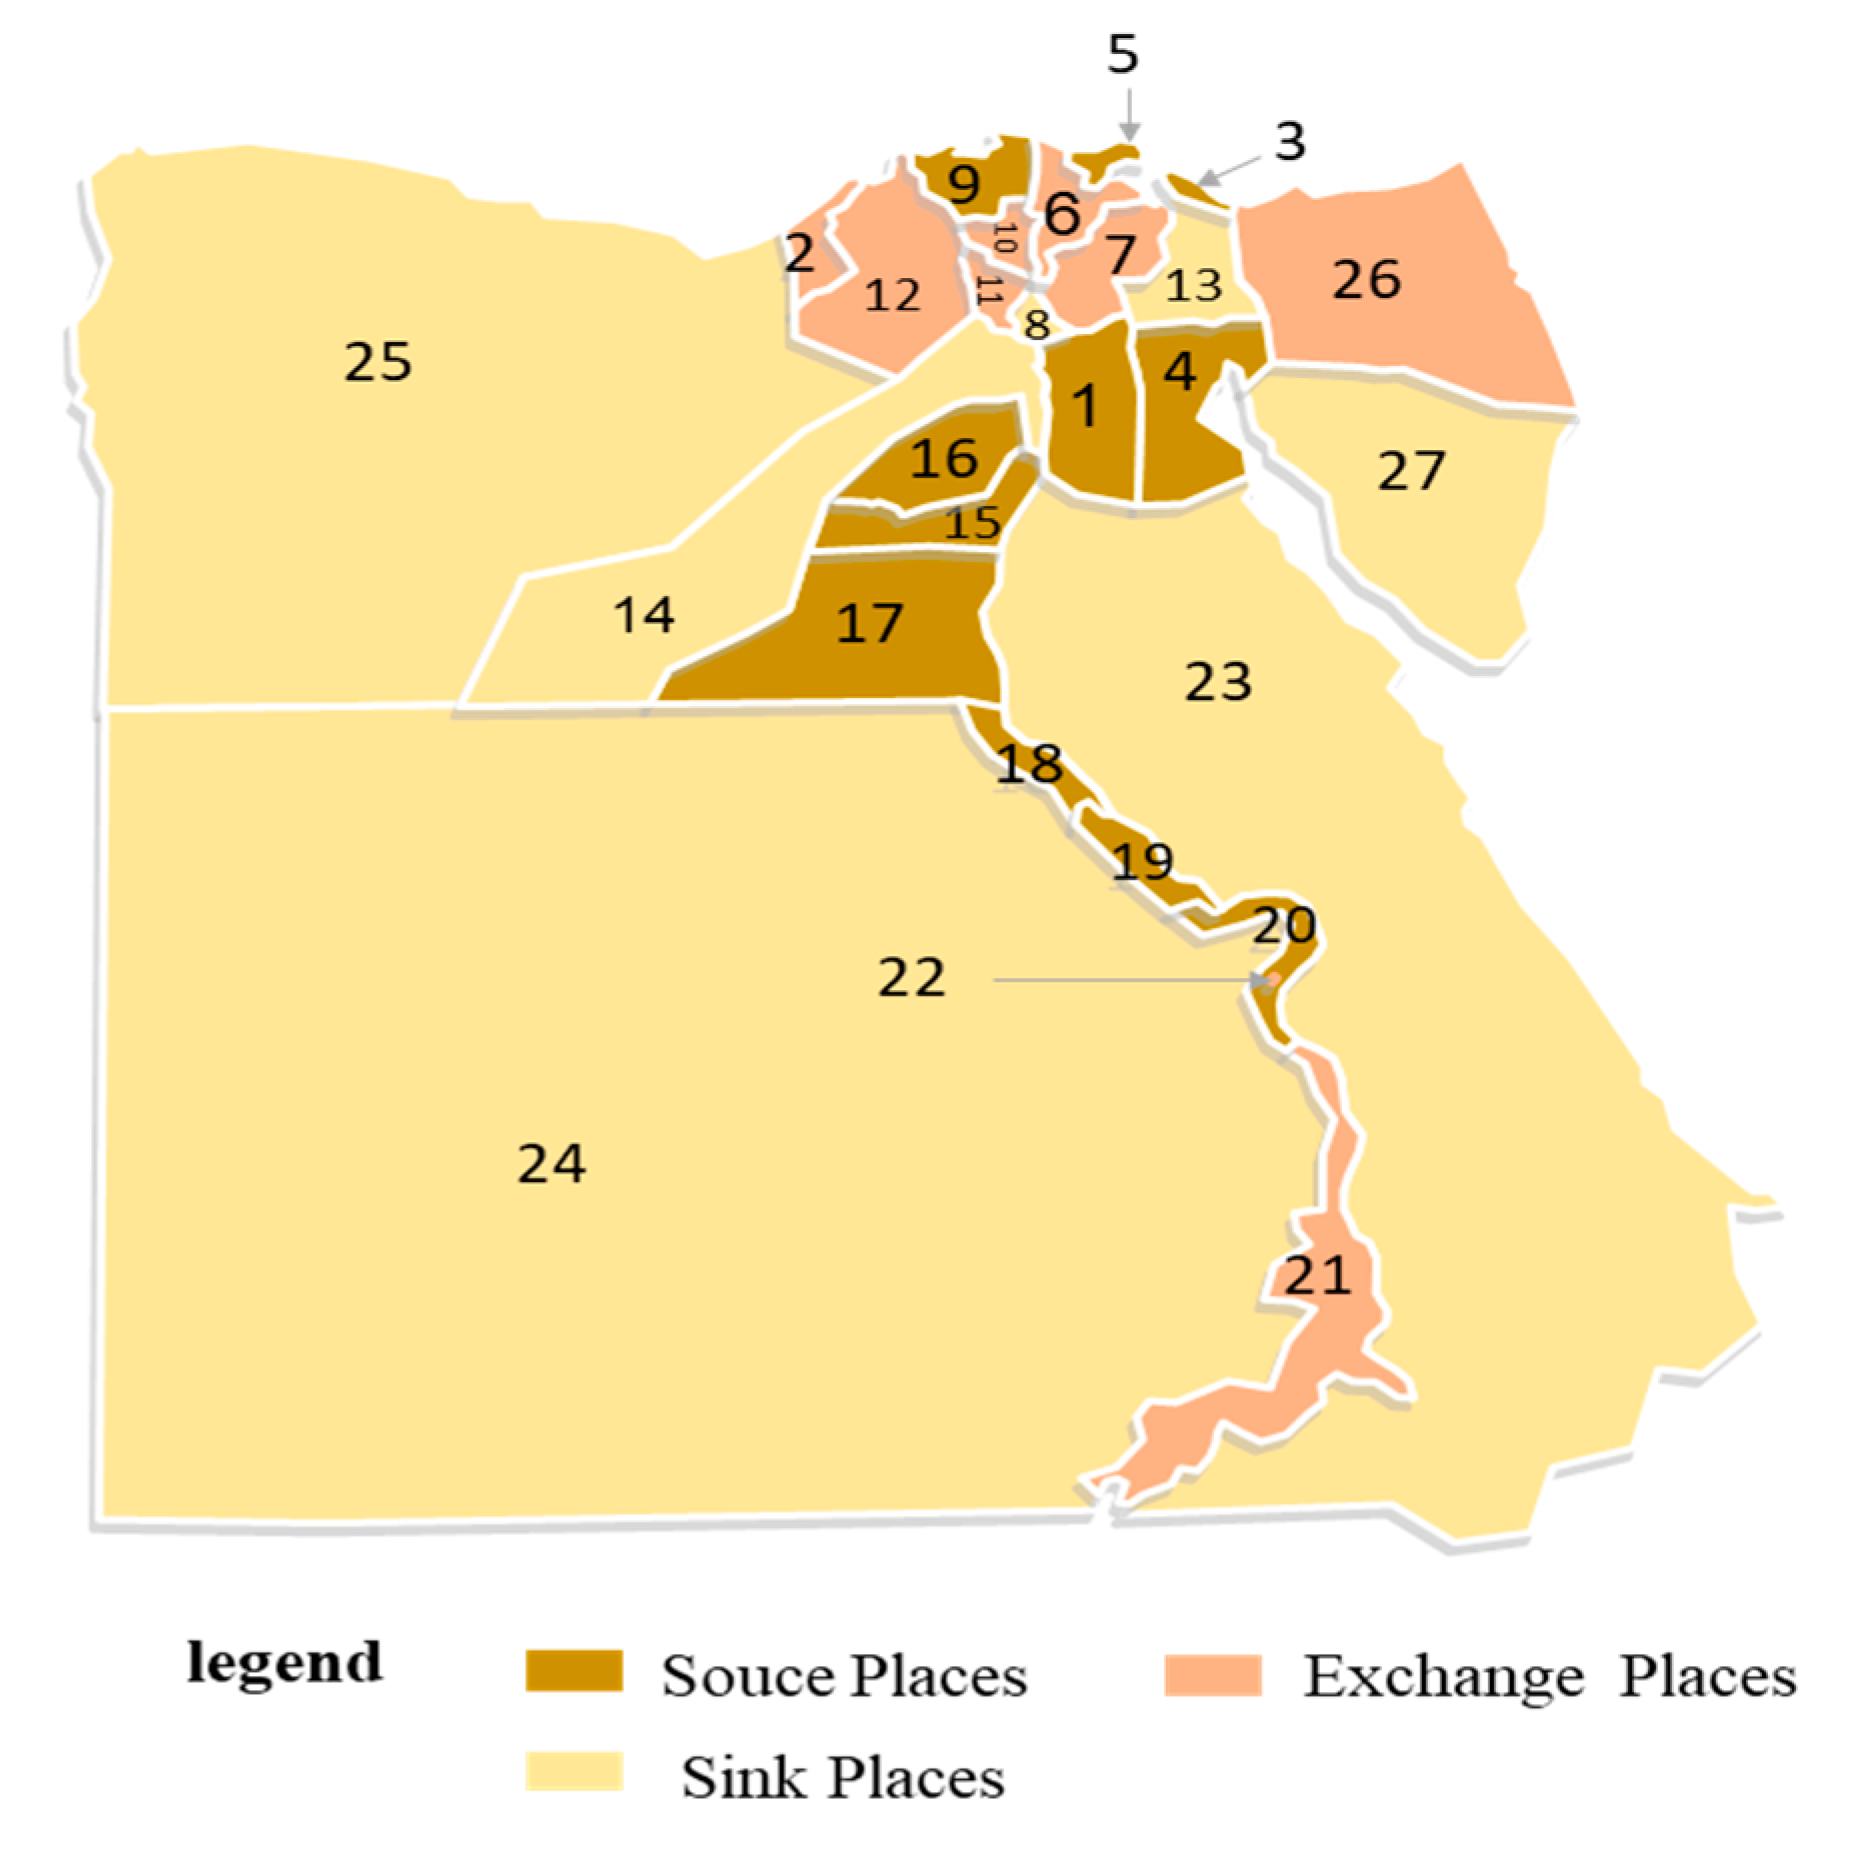
3.2. Source System: Source Places and Pure-Source Places

The development level of Source System varies greatly in the provinces of Egypt. The spatial patterns of geographical distribution can be divided into five types, that is, axis type, layer type, fan type, oblique symmetry type and scattered jump type. Figure 3 shows that Port Said, Suez, Damietta, and Suhag have a very narrow geographic distribution range for the Source System with population migration limited to a few regions, immature in development. Red Sea, El Wadi, El Gidid, Matrouh, North Sinai, and South Sinai have a very wide geographical distribution range for the Source System with a large population moving to the hinterland, mature in development. The rest provinces have moderate geographic coverage for the Source System with striking spatial distribution characteristics, and they are also in a good state of development, especially Kalyubia, Ismailia, and Giza. The axis type covers Cairo, Dakahlia, Gharbia, and Luxor, and they extend southward along the Nile coastal provinces with the North Sinai-Suez-North Upper Egypt corridor as the principal axis. The layer type covers Kalyubia, Ismailia and Giza, and they overflow around with themselves as the center and extend southward along the Nile coastal provinces, in a shape of “tadpole”. According to the development level, the fan type pattern can be divided into two subgroups: single-side double-fan ring and north-south symmetrical double sector. Alexandria and Behera have developed single-side double-fan ring, while Sharkia and Menoufia have developed into north-south symmetrical double sector. Menia, Beni-Suef, and Fayoum are also in the north-south symmetrical double sector pattern, but low in the development level with discontinuous spatial distribution of Source Places. The oblique symmetry type covers Aswan, Red Sea, El Wadi El Gidid, Matrouh, North Sinai, South Sinai, Source Places, and Pure-Source Places, and they penetrate into the neighboring provinces and expand geographical coverage with the province at the longest distance diagonally as the origin. Port Said, Suez, Damietta, Suhag, Qena, Asyout, and Kafr El Sheikh are of the scattered jump type.
Pure-Source Places nodes are found in about 52% of the provinces in Egypt. Lagging economic development, small population size (large desert provinces or small provinces along the Nile River), and certain security risks (Sinai Peninsula region) are common characteristics for judging provinces as Pure-Source Places. Figure 3 shows North Sinai has become the Pure-Source Places common to Port Said, Suez, Damietta, Kalyubia, Beni-Suef, Fayoum, Qena and Aswan. Luxor, Red Sea, El Wadi El Gidid, Matrouh, North Sinai and South Sinai have multiple Pure-Source Places, and the geographical distribution is characterized by oblique symmetry, which is closely related to spatial distance and development level. Pure-Source Places of Luxor include Port Said, Kafr El Sheikh, and North Sinai in northern Egypt, the provinces furthest from Luxor. Pure-Source Places of El Wadi El Gidid have a larger geographic coverage compared with Red Sea, but the two-share similar spatial patterns, as both of them are concentrated in the northeast and northwest of Egypt, generally the provinces furthest away from them with lagging economic development. Pure-Source Places of Matrouh are densely in the northeast and southwest of Egypt, including Kafr El Sheikh, Menoufia, Behera, Beni-Suef, Fayoum, Aswan, Luxor, Matrouh, North Sinai, and South Sinai. Pure-Source Places of North Sinai are mainly in the southwest of Egypt, mainly in the desert provinces farthest from it or provinces along the Nile River with a small administrative area, including all the provinces in Central Upper Egypt and the regions along the Nile in South Upper Egypt. Pure-Source Places of South Sinai have the largest coverage, including all provinces in Central Upper Egypt and North Upper Egypt, as well as Matrouh province.

3.3. Sink System: Sink Places and Pure-Sink Places

The development level of Sink System also varies greatly in the provinces of Egypt. The spatial patterns of geographical distribution can be divided into three types, that is, wide area coverage type, local development type and scattered jump type. Figure 3 shows that the wide area coverage type covers Alexandria, Port Said, Suez, Damietta, Kafr El Sheikh, Gharbia, Menoufia, Behera, Beni-Suef, Fayoum, Dakahlia, Asyout, Suhag, and Qena with more optional regions for the population to move out, mature in development. The local development type covers Sharkia, Menia, Aswan, and Luxor. The emigration places are mainly in the western desert region of Egypt and along the coast of the Red Sea in the east, with more concentrated spatial distribution, and they are also in a good state of development. The scattered jump type covers Cairo, Ismailia, Kalyubia, Giza, Matrouh, North Sinai, and South Sinai, which are scattered about in space and poorly developed with a small number of sinks. It is worth noting that there are no Sink Places in the Red Sea or El Wadi El Gidid.
There are Pure-Sink Places nodes in about 48% of the provinces in Egypt, which are mainly located outside the Nile Valley. Figure 3 shows that the Red Sea is a Pure-Sink Place of Damietta and Matrouh at the same time; El Wadi El Gidid is a Pure-Sink Place of Kafr El Sheikh, Menoufia and Behera at the same time; Pure-Sink Places of Asyout and Menia are North Sinai and South Sinai, respectively. For provinces with many Pure-Sink Places, Beni-Suef, Luxor, and Aswan have a small number and they are scattered. Port Said and North Sinai have a similar spatial structure, and they are in a spatial pattern along the northwest-southeast axis.

3.4. Exchange Places
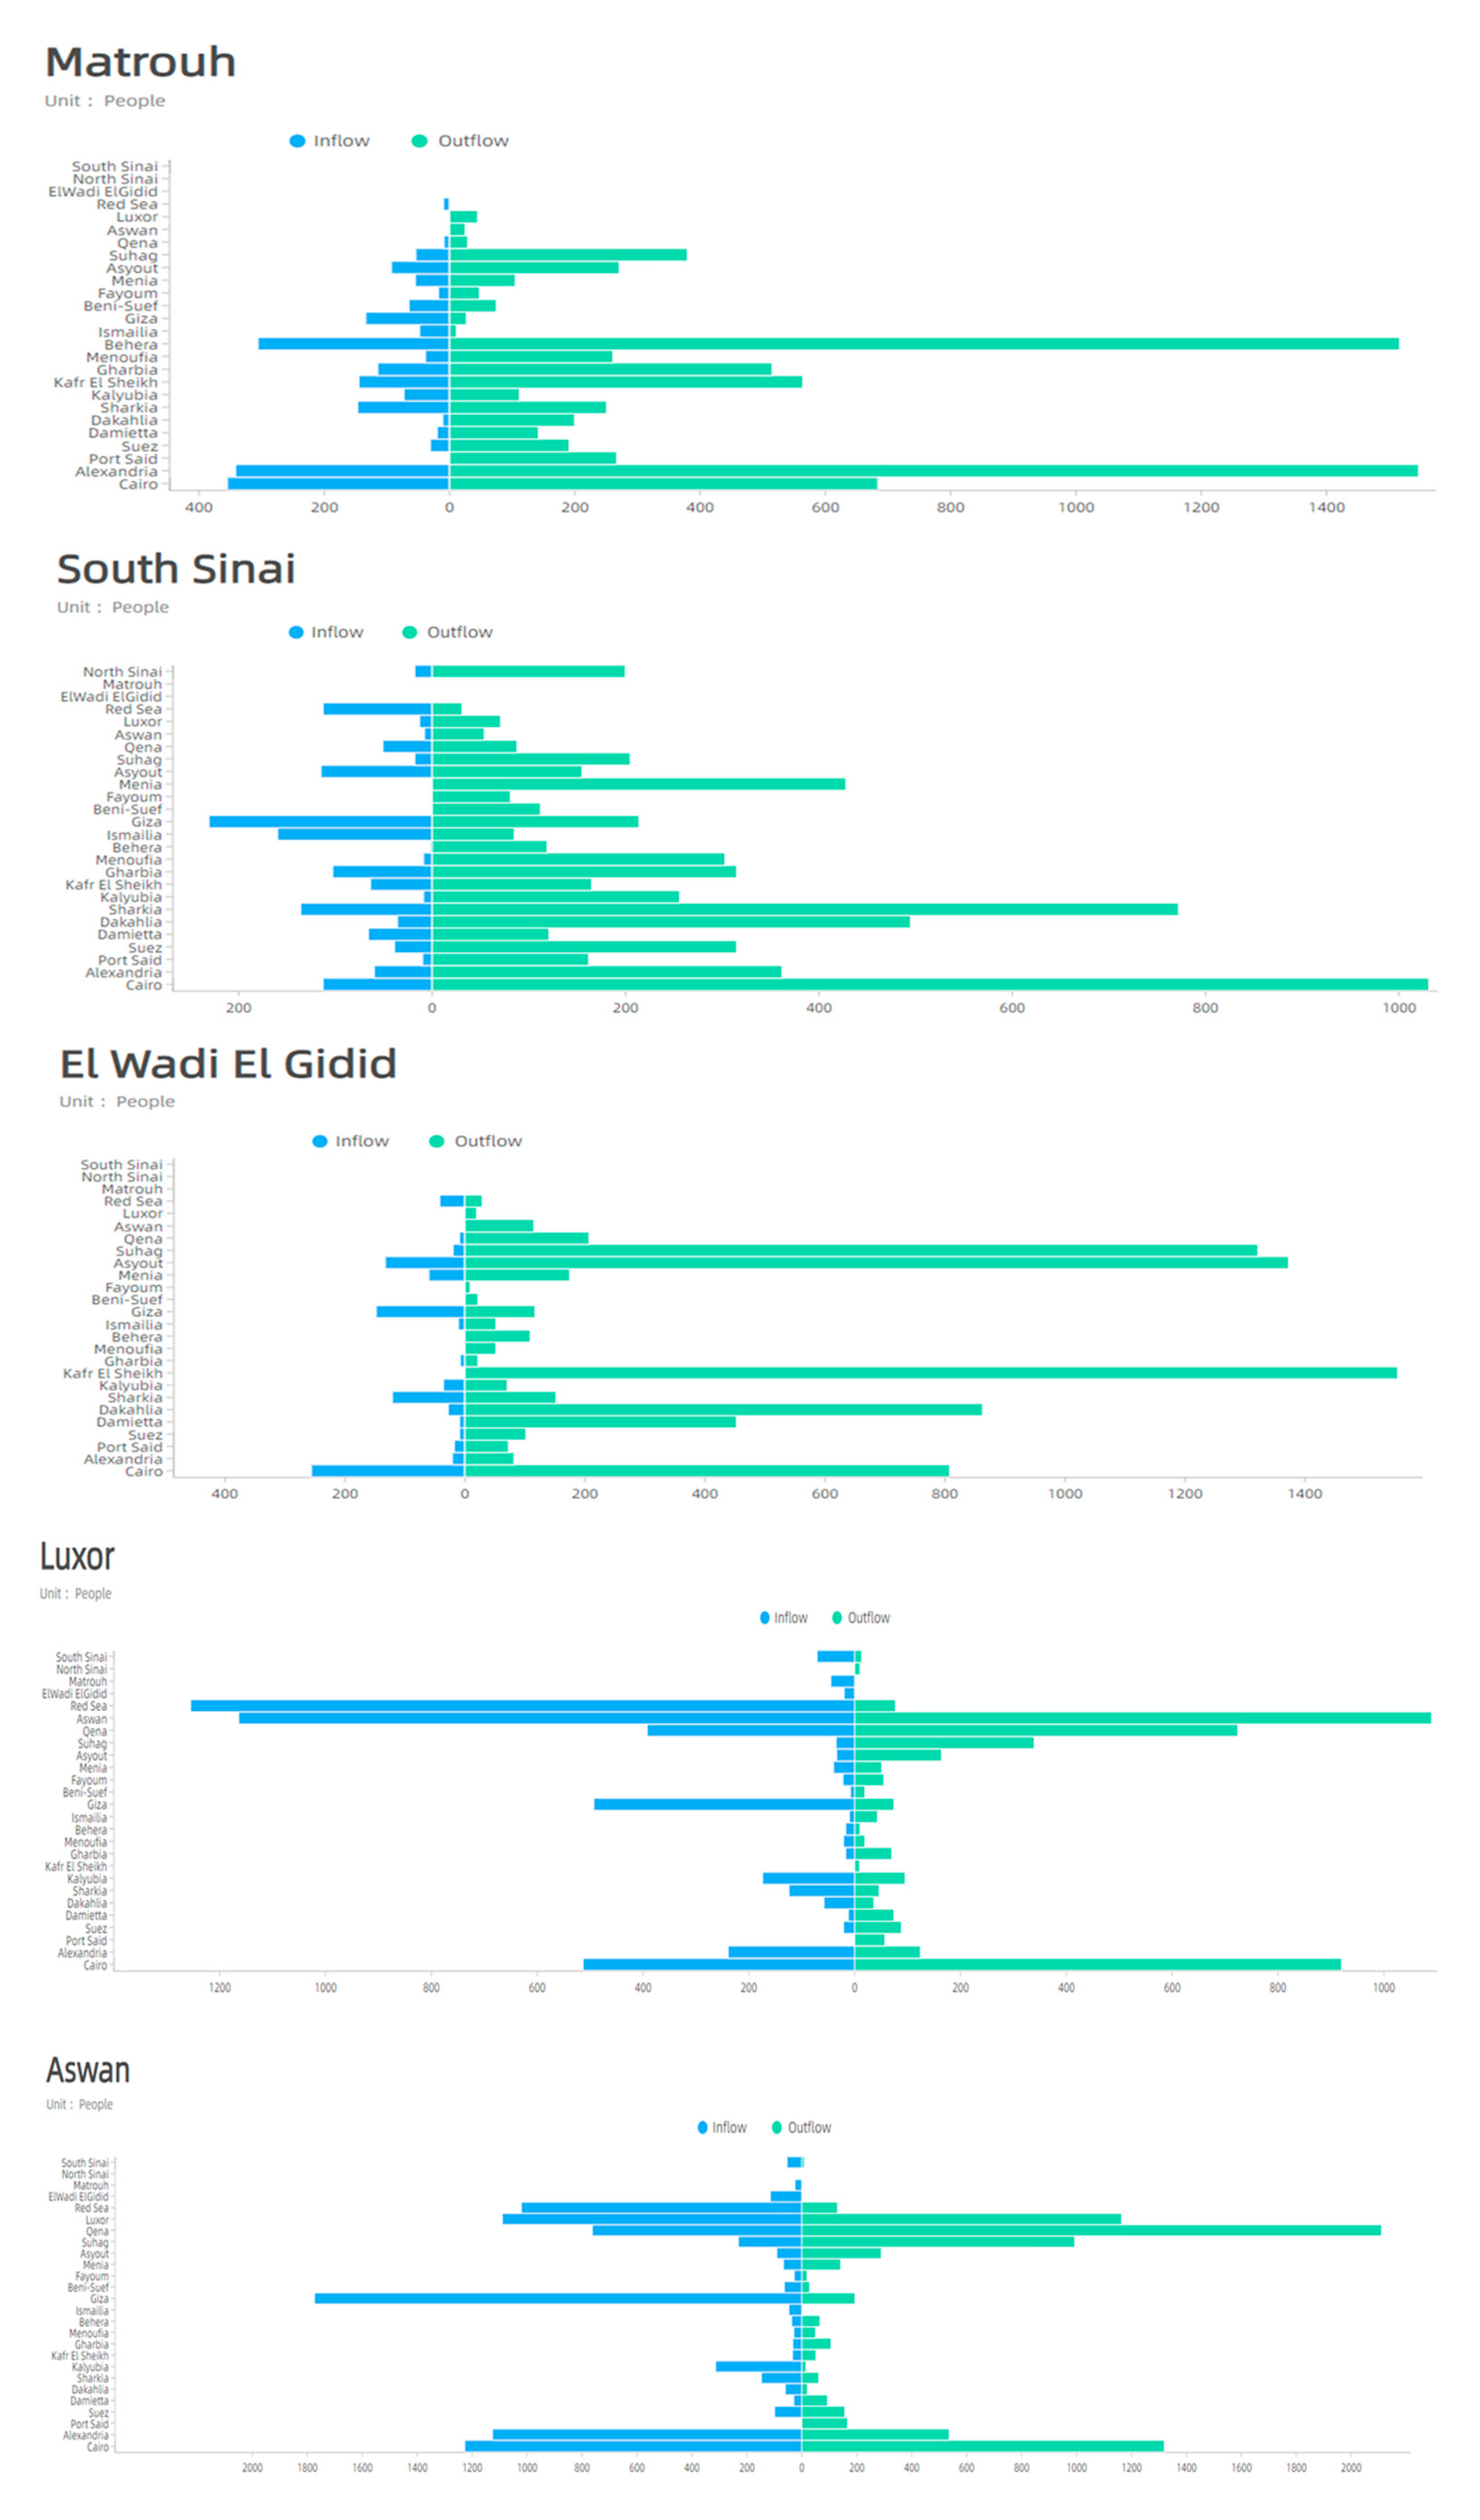
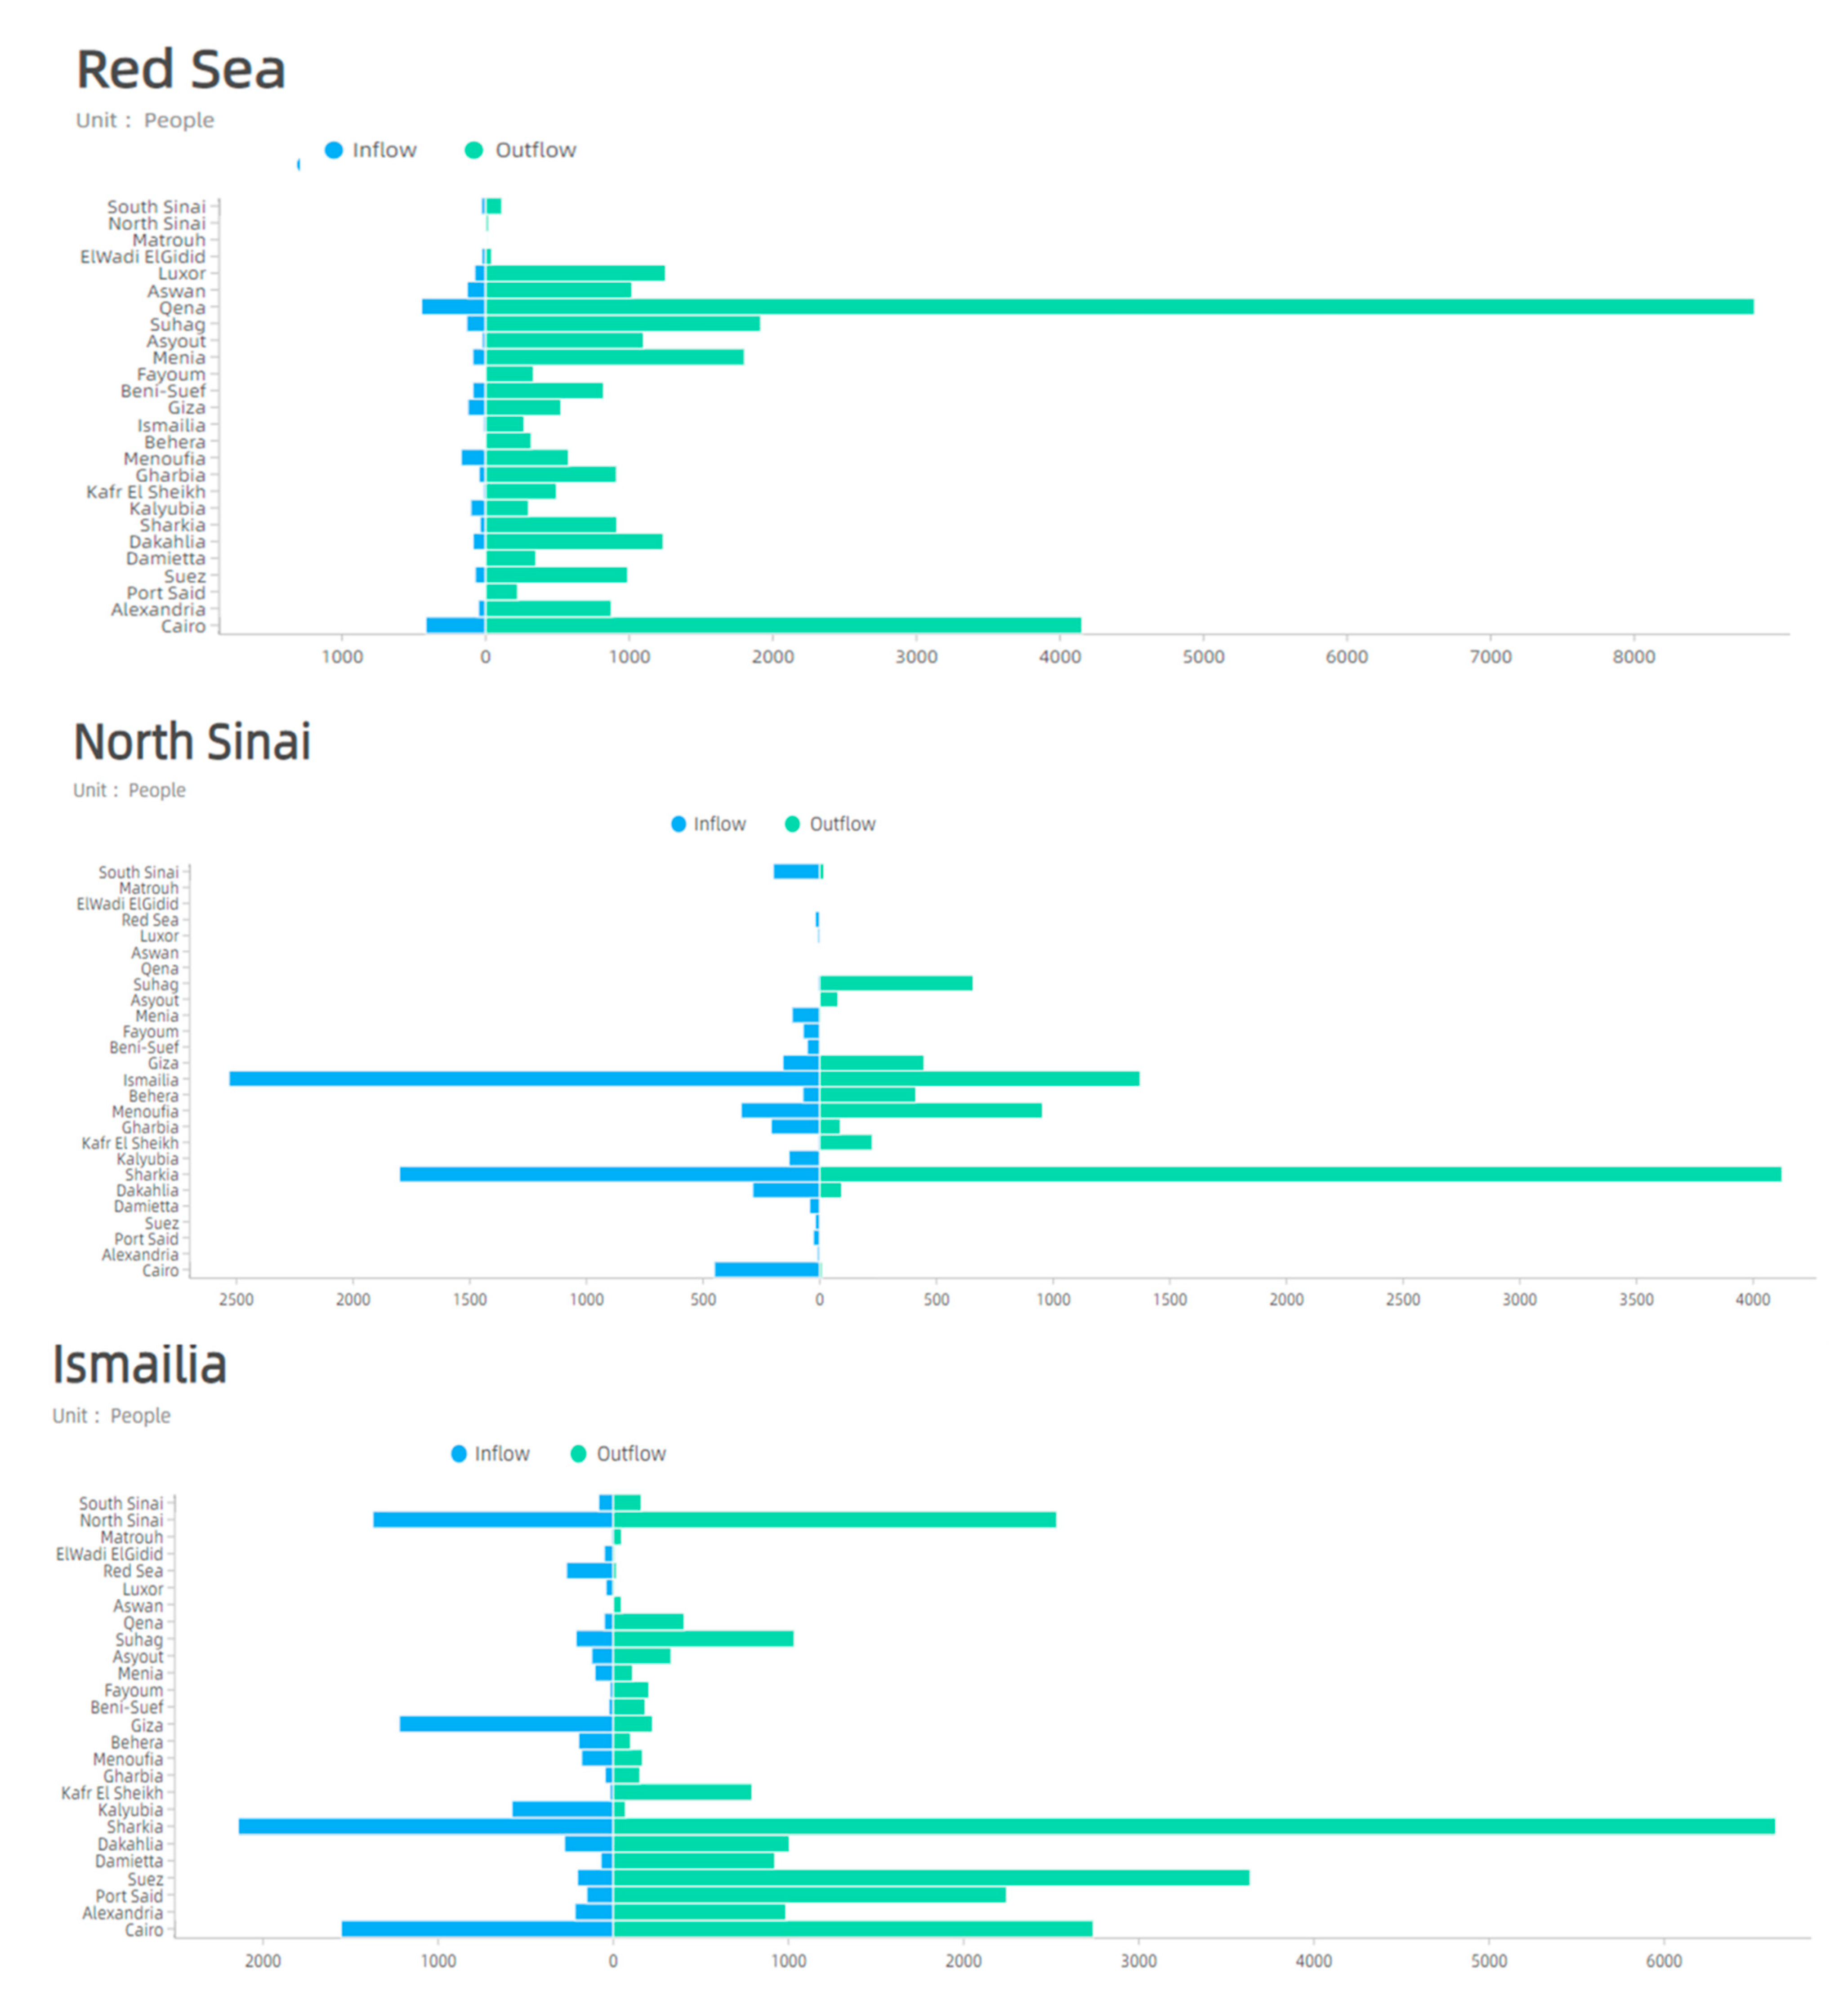
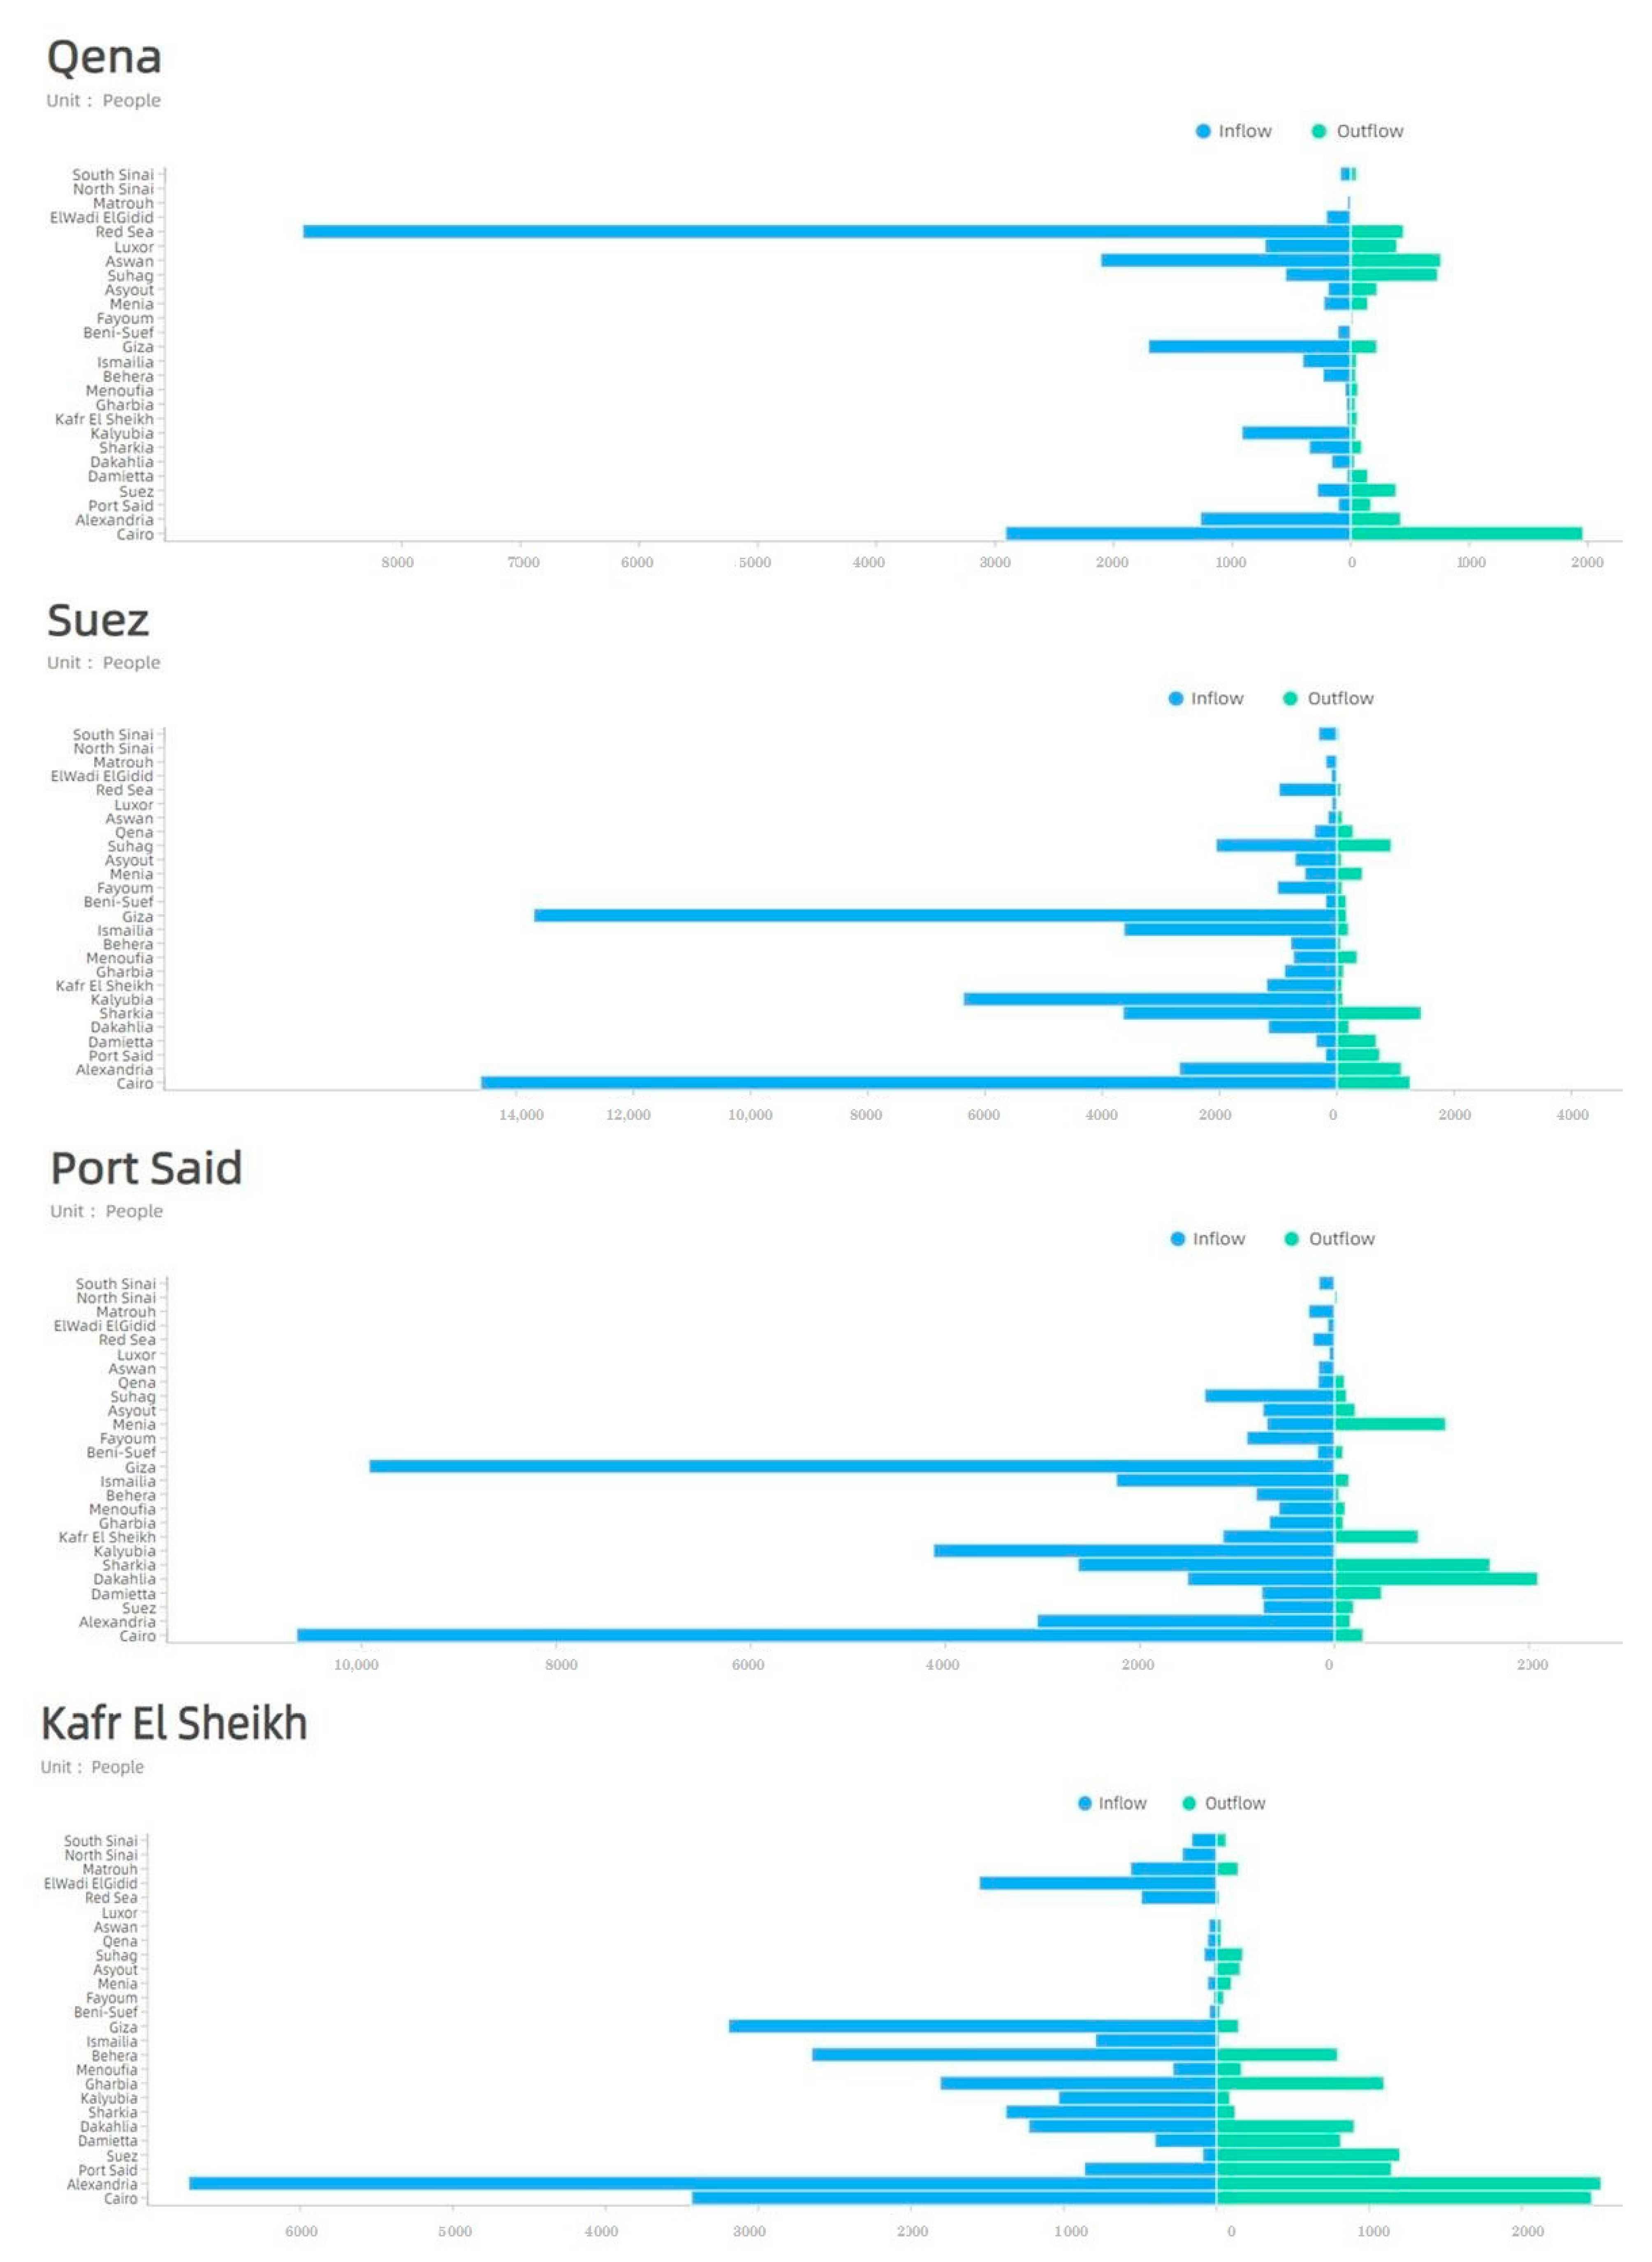
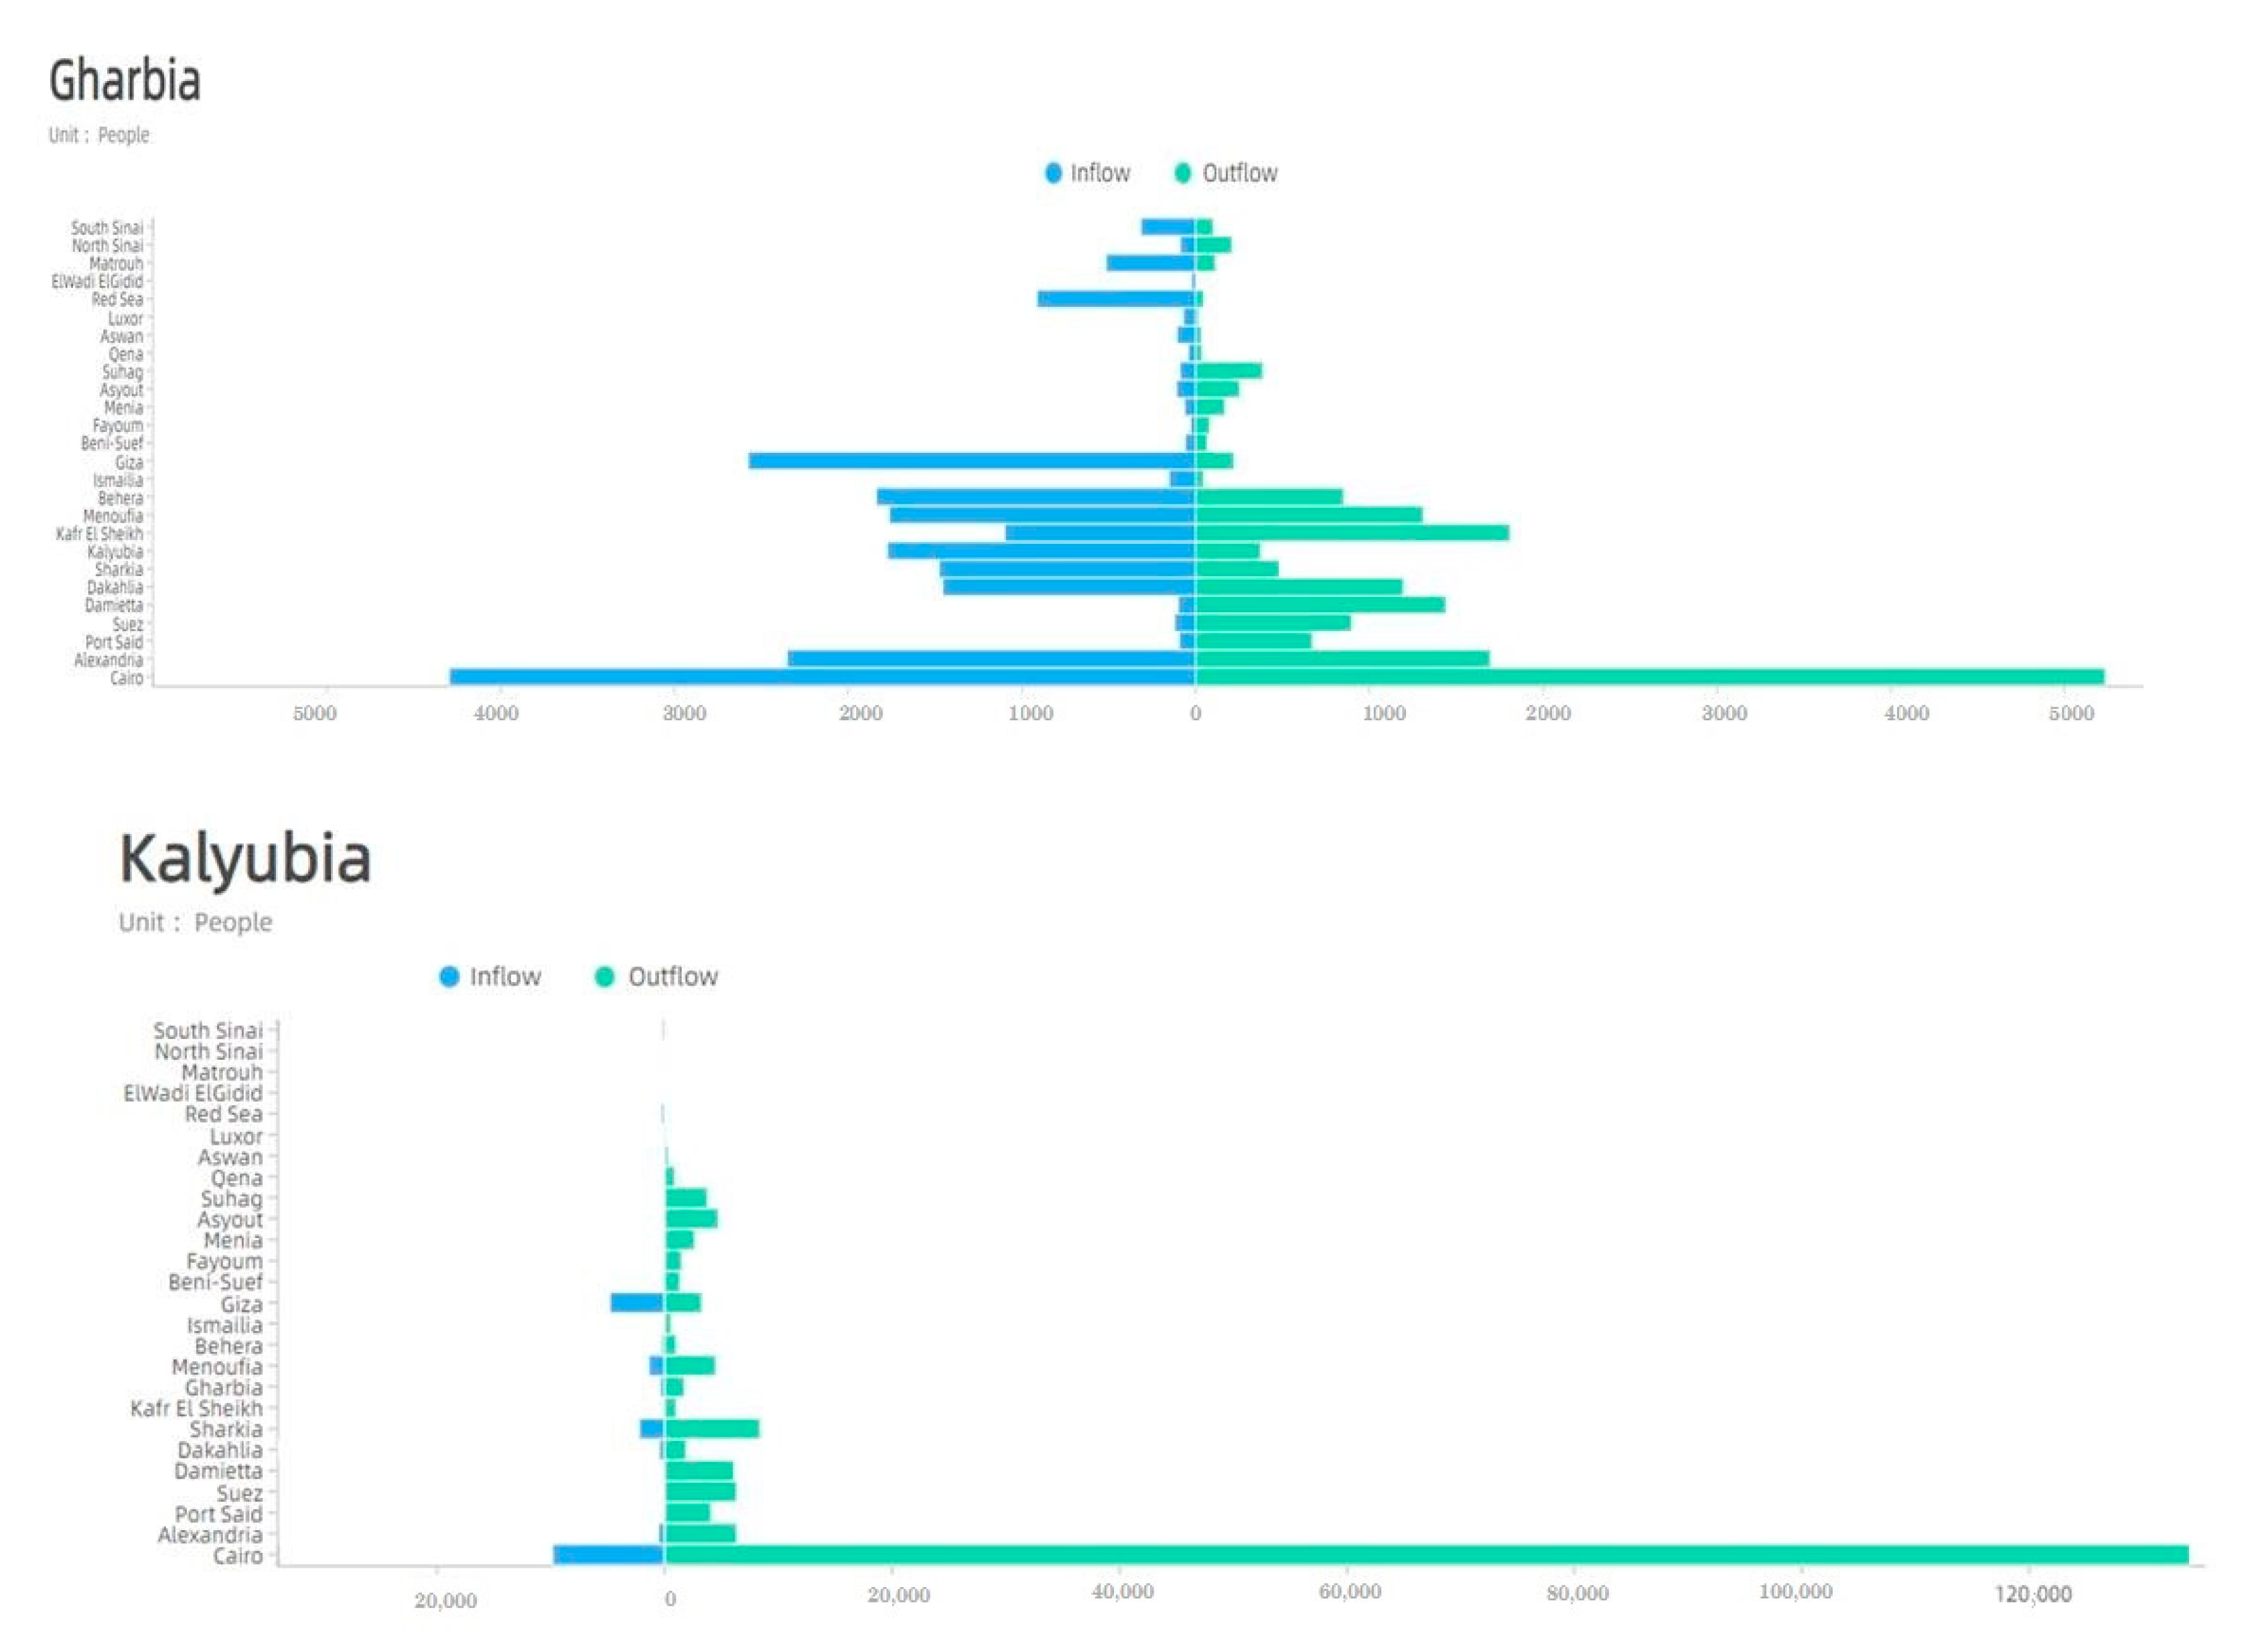
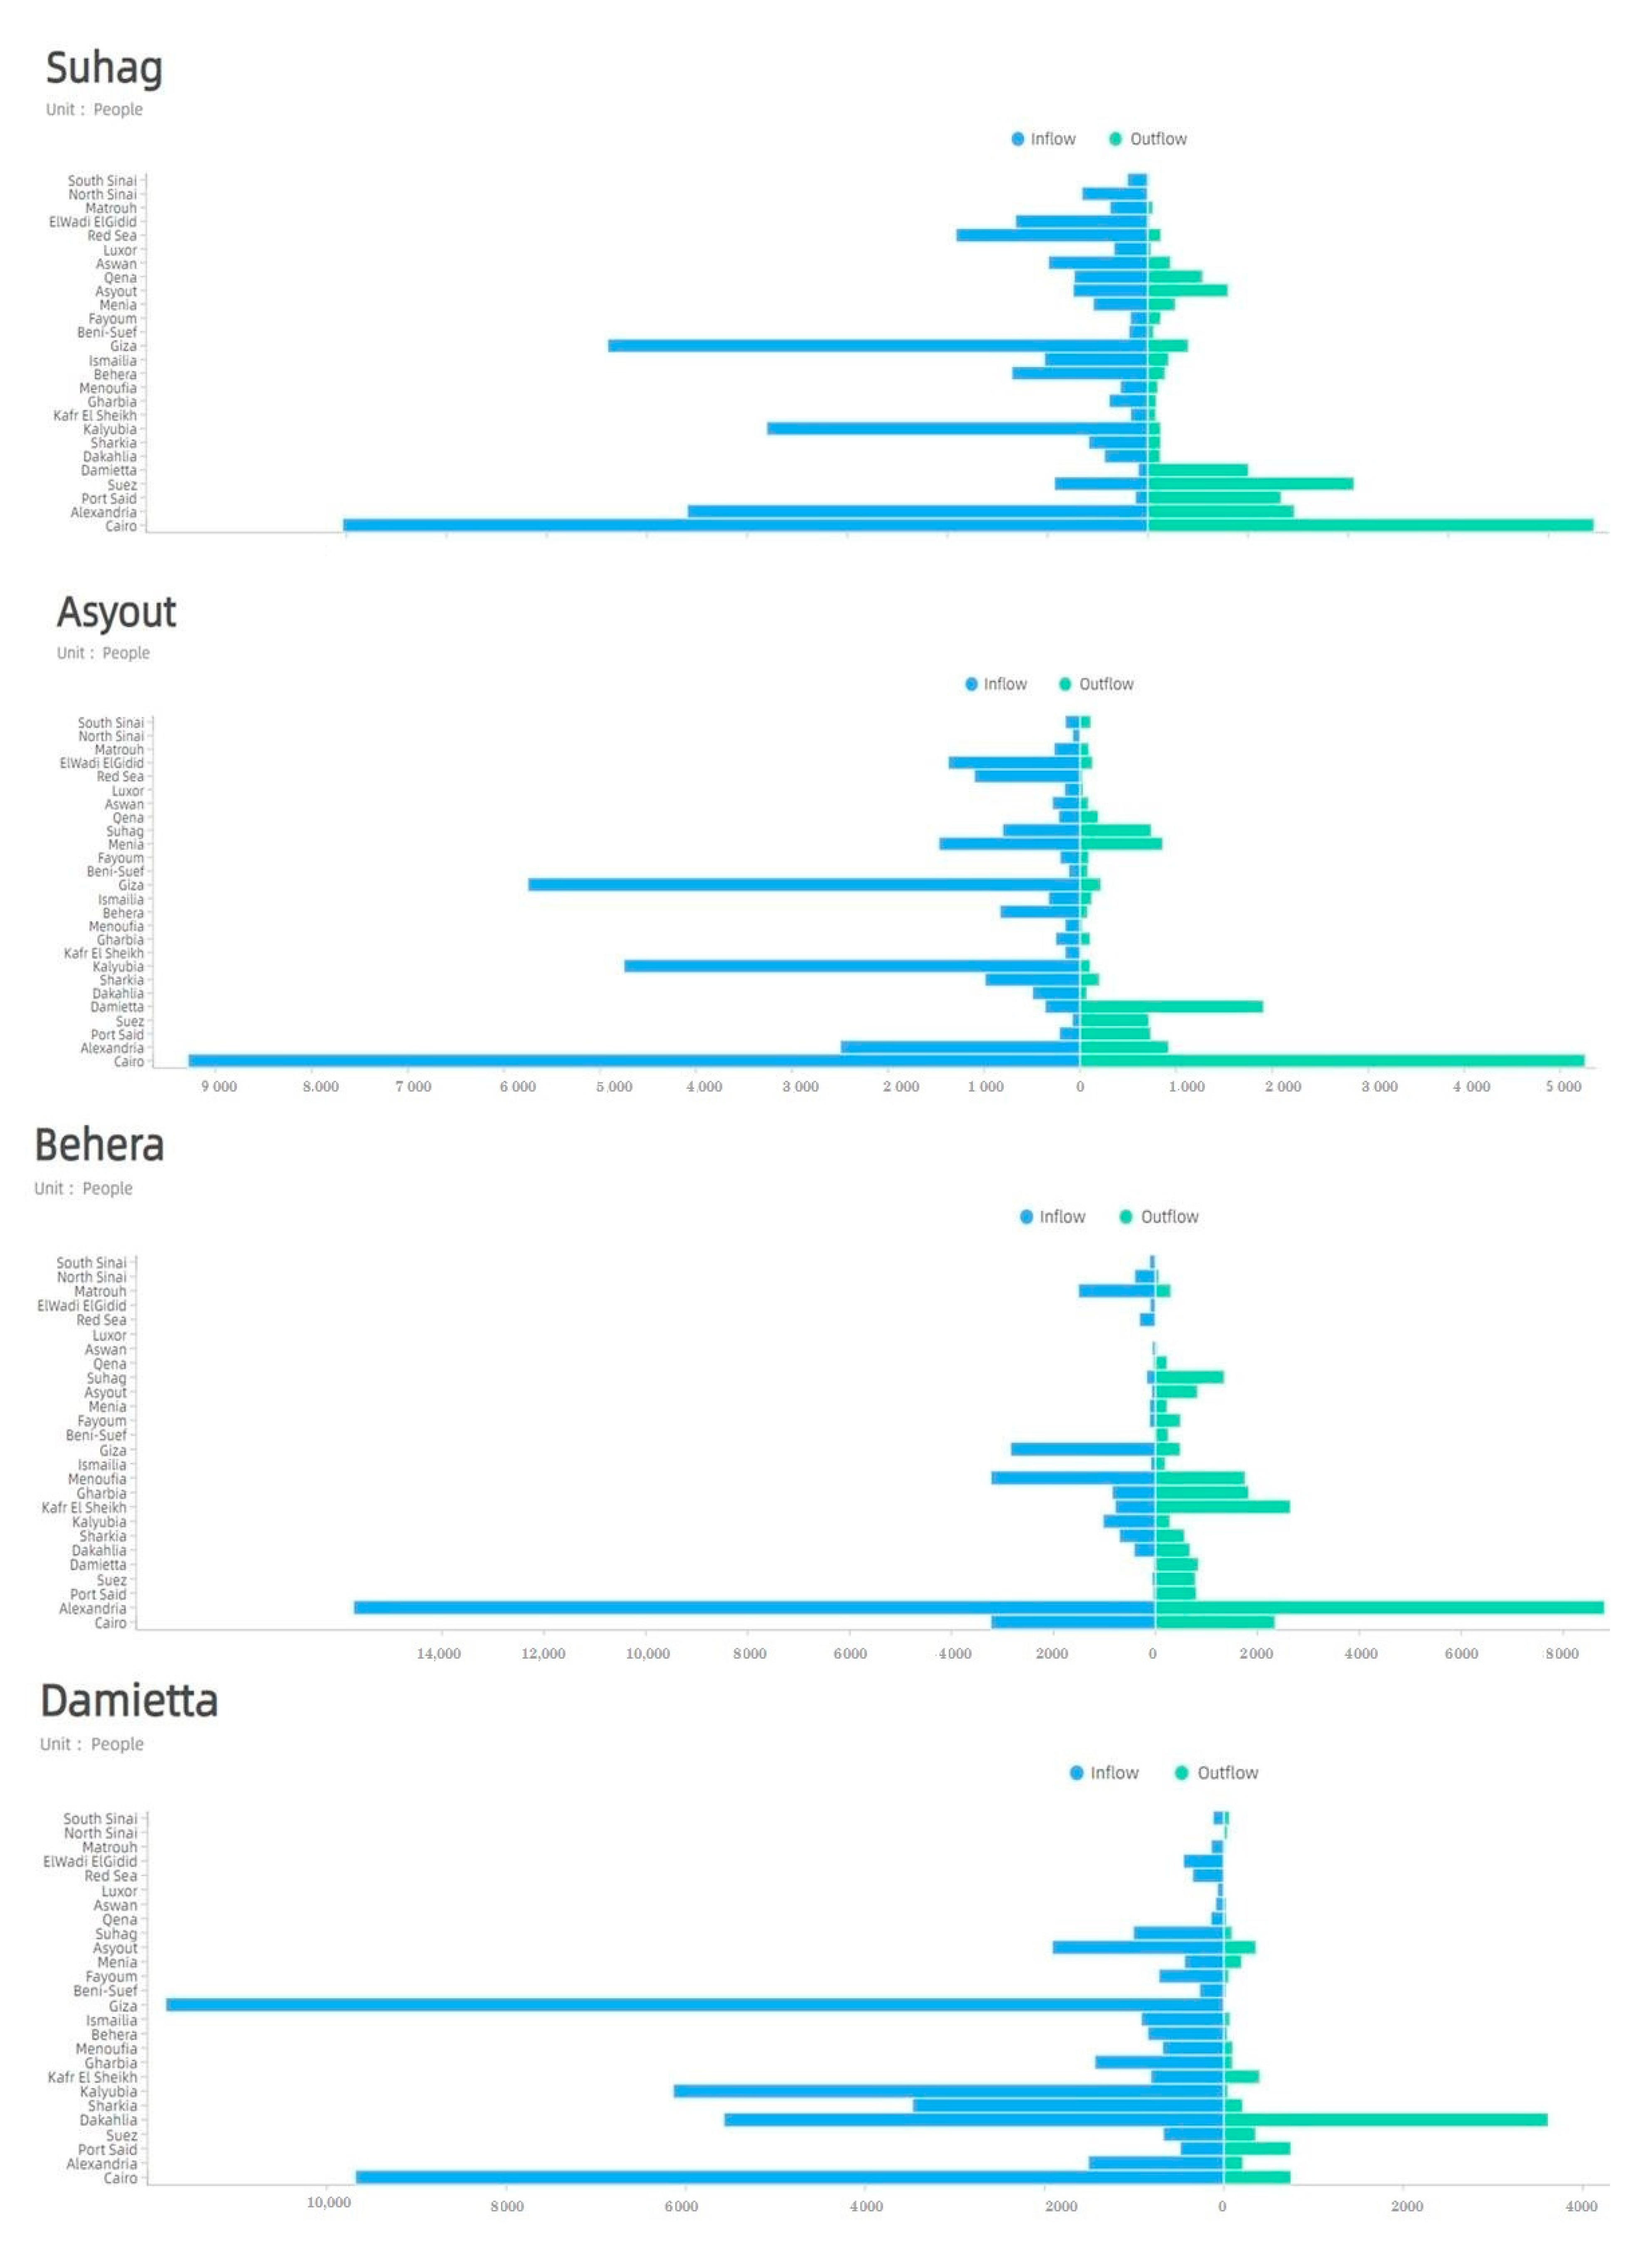
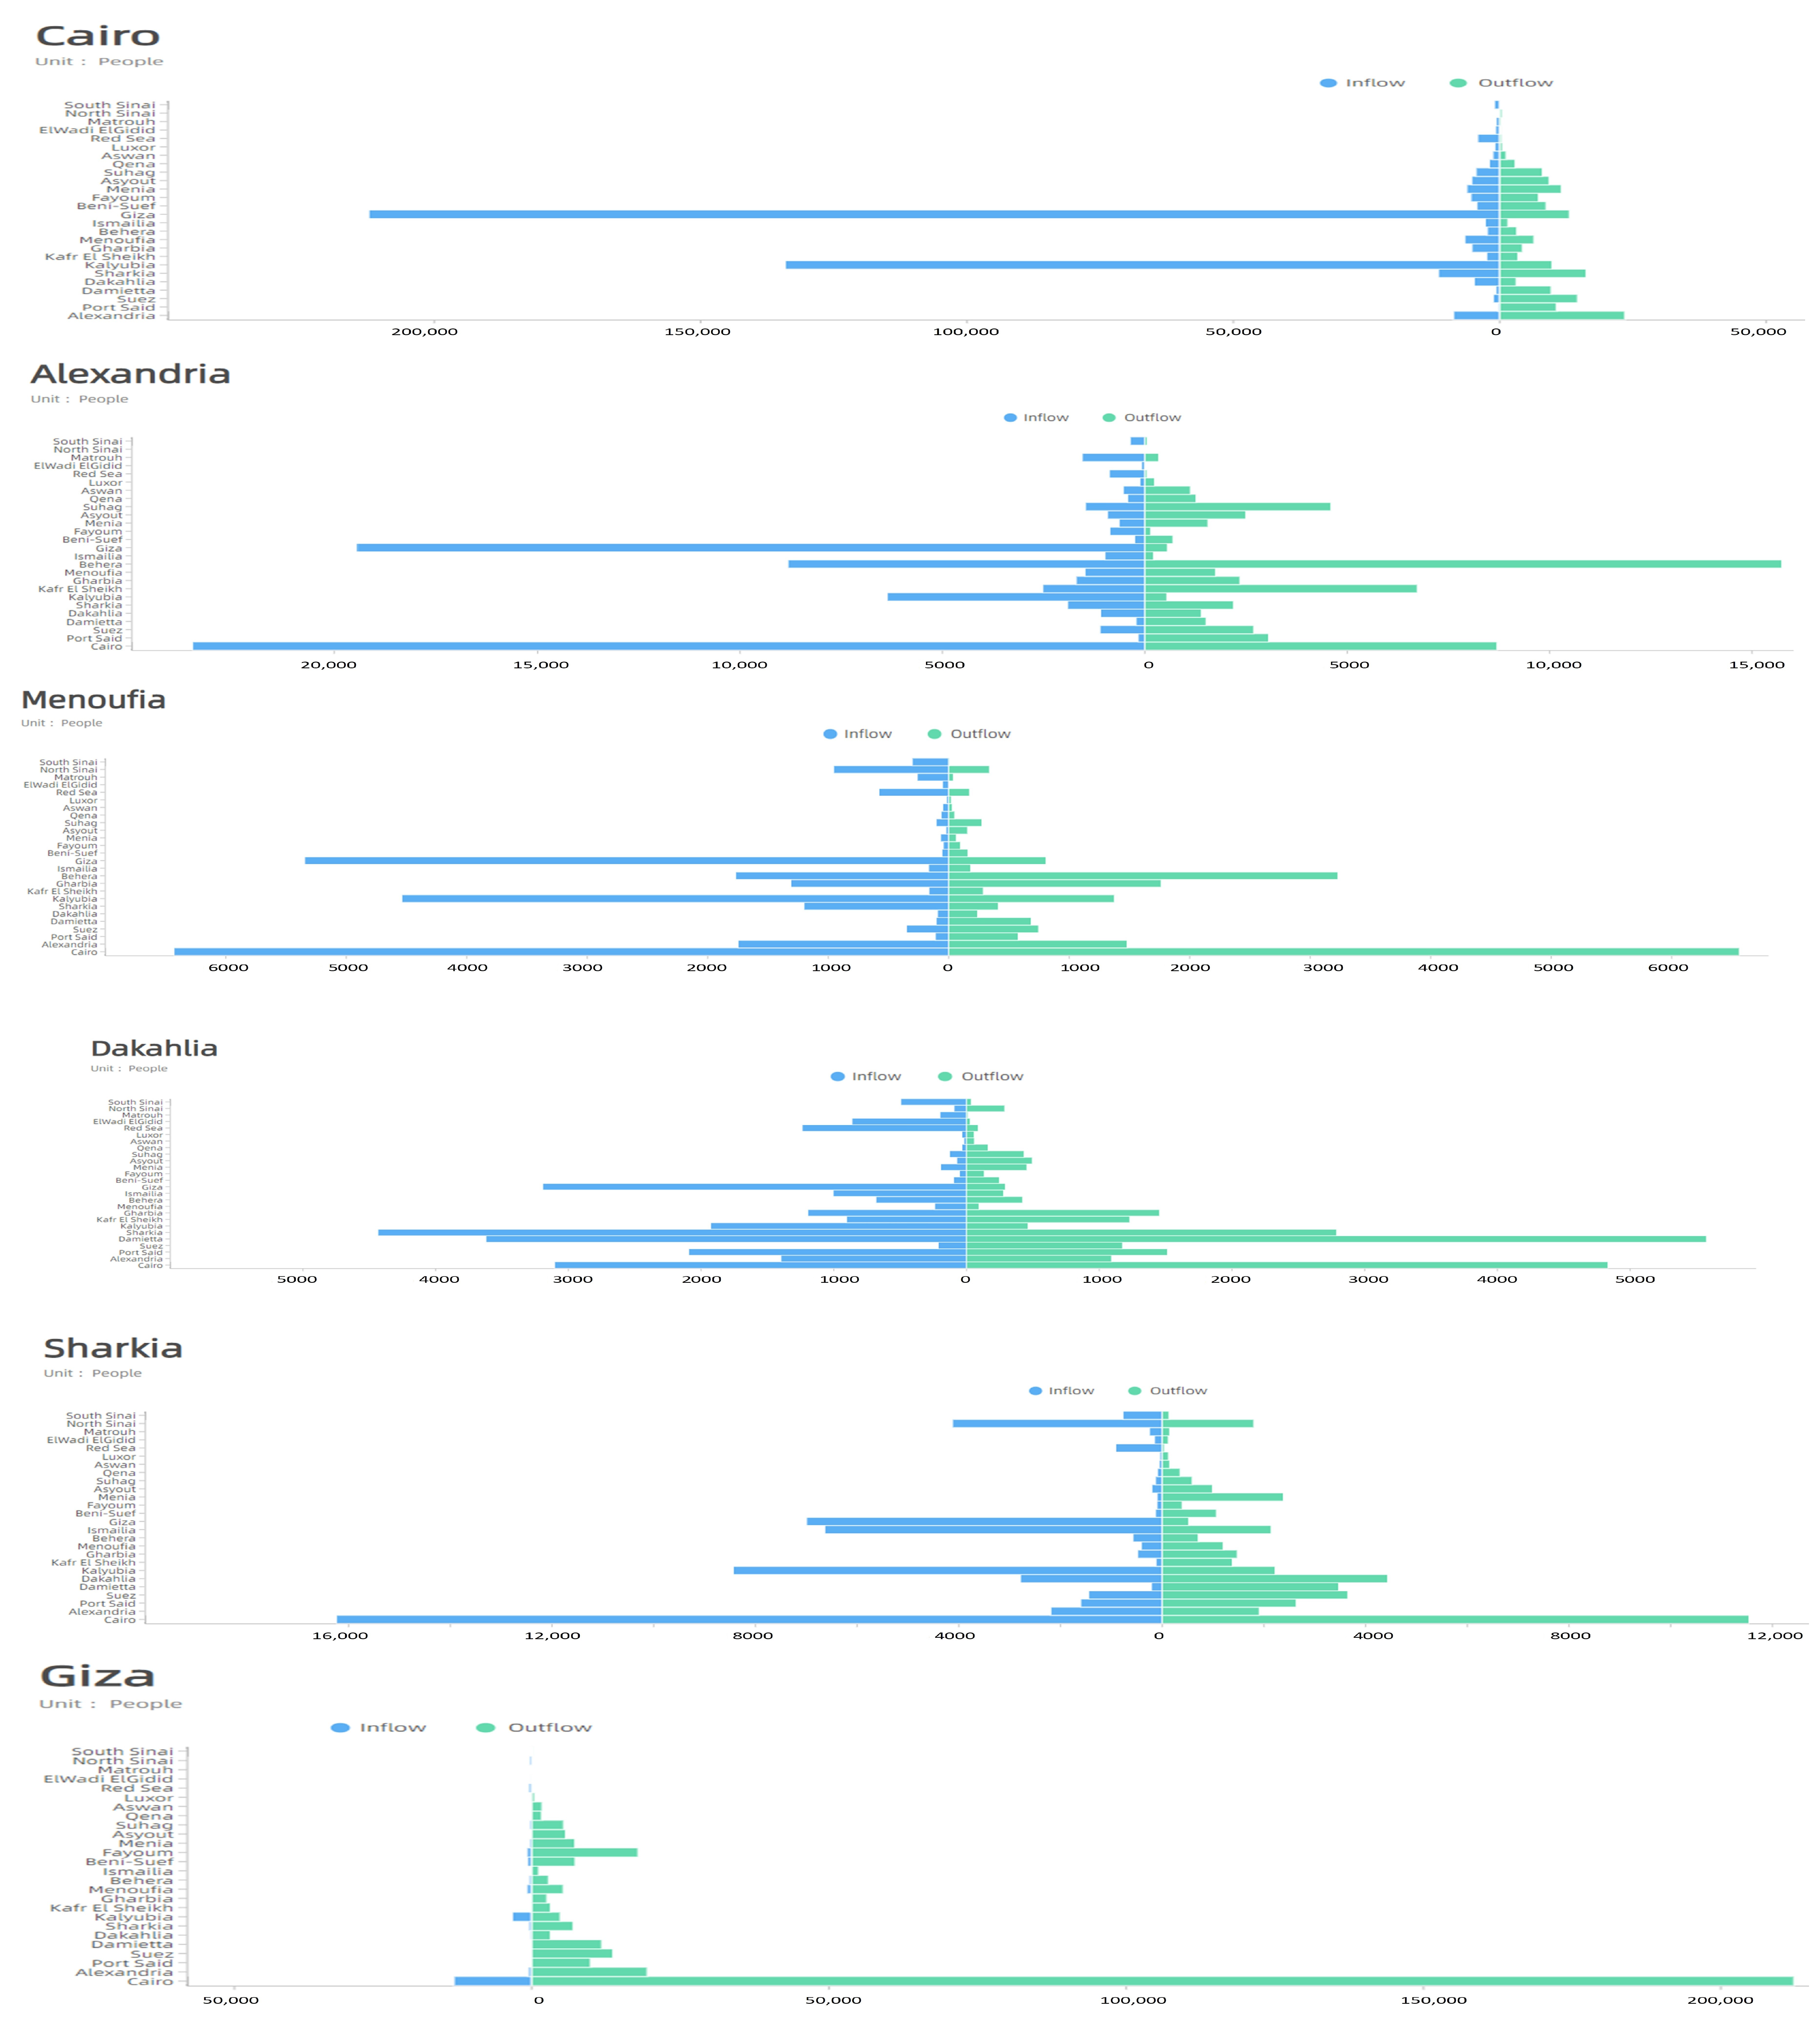
Cairo and Menia have a large number of Exchange Places, which are concentrated in the delta area, mature in development. Sharkia and Kalyubia take the second place in the development level, and their space distribution is concentrated in Western Egypt. Exchange Places of Dakahlia, Beni-Suef, Asyout, Suhag, Qena, Aswan, and Luxor are in a geographical distribution pattern dominated by neighborhood penetration, and there is local leaping expansion in a few provinces such as Suhag and Qena. Exchange Places of Suez, Kafr El Sheikh, Gharbia, Menoufia, Behera, Fayoum, South Sinai, and El Wadi El Gidid are scattered about; Alexandria, Damietta, Ismailia, and Giza have a small number of Exchange Places, in particular, Port Said, Matrouh and North Sinai have only one respectively, while Red Sea has none. It is worth noting that there are “fake” Exchange Places in some provinces, that is, either the immigrant or emigrant population size is less than 50, such as Qena in Gharbia, Aswan and Luxor in Menoufia, and Red Sea in El Wadi El Gidid.

3.5. Flow Field

There are huge differences in the migration population flow among the provinces of Egypt. Figure 4 shows that the CVs of Inflow, Outflow, and Total flow in a province are all greater than 1, except for Outflow in Cairo and Total flow in South Sinai. The overall level is close to 3.5 with the highest found in Kalyubia. The overall level of Giza, Fayoum, Cairo, Beni-Suef, and North Sinai is around 2.5, and few parameters of some provinces are also close to 2.5, such as Inflow in Behera and Outflow in Damietta. According to the average, they can be divided into four echelons. Cairo, Giza, Kalyubia are in the first echelon. Cairo has the largest Inflow and Total flow, and Giza has the largest Outflow. The second echelon includes Alexandria, Port Said, Suez, Damietta, Dakahlia and Sharkia. Alexandria is more prominent. The fourth echelon includes Aswan, Luxor, El Wadi El Gidid, Matrouh, North Sinai, and South Sinai, all of which have a small average in general. The rest provinces are all in the third echelon. Population migration can be regarded as integration of spatial cognition and decision-making in essence. According to the anchor point theory, people always recognize a node before they gradually recognize others around it, and then start to recognize others further from a new one [73], which provides a new perspective for the spatial decision-making of population migration. The maximum value of the flow parameters has a huge impact on the flow field of interprovincial migration in Egypt. According to the analysis of Table 3 and Figure 5, three underlying modes of pole-core interaction have been formed in Egypt, including Inflow-Total flow Leading Mode (ITLM), Outflow-Total flow Leading Mode (OTLM), and Inflow-Outflow-Total flow Integration Mode (IOTIM). According to the further analysis of the polar-core nodes involved in the interaction, the spatial selection for the interprovincial migration in Egypt complies with the “anchor point theory”, and most of the spatial nodes with strong correlations are the star provinces or neighboring provinces, such as the national capital Cairo, regional centers Alexandria and Sharkia, as well as Aswan-Luxor, Damietta-Dakahlia, and other adjacent provinces where they grow up, and neighboring nodes or high-level nodes with high perception and regional identity.
The interprovincial migration network in Egypt develops in a complex and diverse manner. According to the threshold value of 3000 people as the center of the gathering field and diffusion field, there are 7 modes in the migration flow network center system, that is, Centerless Mode, Only Diffusion Center Field Mode, Only Gathering Center Field Mode, One Diffusion and One Gathering Center Field Mode, One Diffusion and Two Gathering Center Field Mode, One Diffusion and Multiple Gathering Center Field Mode, Multiple Diffusion, and Multiple Gathering Center Field Mode. The first three models are immature in development, because there is no trunk stream or only one-way trunk stream connecting the center in the migration flow network, and the tributaries have not yet been developed. Centerless Mode includes Matrouh, South Sinair, El Wadi El Gidid, Luxo and Aswan. They have not yet developed a flow field center, but some streamlines have been developed very prominently, such as Alexandria and Behera in Matrouh. Node provinces associated with streamlines are likely to evolve into centers in the future (Figure 6). Only Diffusion Center Field Mode includes the Red Sea, North Sinai, and Ismailia. Diffusion Center of Red Sea is Qena. The Diffusion Center of both North Sinai and Ismailia is Sharkia. The streamlines are all unidirectional outflows (Figure 7). Only Gathering Center Field Mode includes Qena, Suez, Port Said and Kafr El Sheikh, and the number of centers increases successively. The streamlines are all unidirectional inflows (Figure 8). One Diffusion and One Gathering Center Field Mode includes Gharbia and Kalyubia, and their Center is Cairo. Gharbia-Cairo and Kalyubia-Cairo are the trunk streams in the migration flow network. Gharbia has no tributaries. Kalyubia has developed a tributary Kalyubia-Sharkia (Figure 9). One Diffusion and Two Gathering Center Field Mode includes Fayoum, Beni-Suef and Menia. Their Diffusion Center is Cairo. The two Gathering Centers are Cairo and Giza. In the migration flow network, the streamlines between them and Cairo are bidirectional trunk streams, while those with Giza are unidirectional trunk streams, and there are no tributaries (Figure 10).
According to the analysis in Figure 11, One Diffusion and Multiple Gathering Center Field Mode includes Suhag, Asyout, Behera, and Damietta. Diffusion Center of Damietta is Dakahlia, and the rest are Cairo. Gathering Center has developed a hierarchical system of “one primary with multi-secondaries”. Suhag and Asyout have the same central structure, both with Cairo as the primary center, and Giza, Kalyubia, and Alexandria as the secondary centers. Behera takes Alexandria as the primary center, and Cairo, Menoufia and Giza as the secondary centers. Damietta takes Giza and Cairo as the primary centers, and Dakahlia, Sharkia, and Kalyubia as the secondary centers. Suhag-Cairo, Asyout-Cairo, Behera-Alexandria and Damietta-Cairo constitute the trunk streams in the migration flow network; Suhag-Alexandria, Suhag-Kalyubia, Suhag-Giza, Asyout-Giza, Asyout-Kalyubia, Behera-Cairo, Behera-Menoufia, Damietta-Dakahlia, and Damietta-Kalyubia constitute the first-order tributaries; Suhag-Red Sea, Asyout-Alexandria, Behera-Giza, Damietta-Sharkia, Damietta-Asyout, and Damietta-Alexandria constitute the second-order tributaries.
According to the analysis in Figure 12, Multiple Diffusion and Multiple Gathering Center Field Mode includes Cairo, Alexandria, Menoufia, Dakahlia, Sharkia, and Giza. The central system and the streamline network are very complex. From the prospective of the Diffusion Center, they generally develop into a center system of “one primary with multi-secondaries”, and only Dakahlia develops into a double-primary center with no secondary centers. From the prospective of the Gathering Center, Cairo and Alexandria develop into a center system of “double primaries with multi-secondaries”, Menoufia and Giza develop into a center system of “three primaries with multi-secondaries”, while Dakahlia and Sharkia develop into a center system of “four primaries with multi-secondaries”. Cairo-Giza, Cairo-Kalyubia, Alexandria-Giza, Alexandria-Behera, Alexandria-Cairo, Menoufia-Alexandria, Dakahlia-Cairo, Dakahlia-Damietta, Dakahlia-Sharkia, Dakahlia-Giza, and Sharkia-Cairo constitute the trunk streams in the migration flow network with a large number of tributaries, including Sharkia-Kalyubia, Sharkia-Giza, Sharkia-Ismailia, and Dakahlia-Port Said that have the potential to develop into trunk streams.

4. Conclusions and Discussion

The current development of population migration flow network in Egypt is complex. The flow network and the spatial system composed of multi-center flow fields and multi-channel streamlines begin to take shape, which are characterized by stepped runoff from east to west and local convection between the south and north on the whole. The “Source-Exchange-Sink” system has attained mature development, and in terms of spatial coverage, Source Places > Exchange Places > Sink Places. Source Places lie in the middle, Sink Places are symmetrical from east to west, and Exchange Places are concentrated along the Mediterranean coast in the north of Cairo, with the initial formation of a “core-periphery” spatial pattern. In summary, the spatial pattern and its flow field characteristics of the migrant population in Egypt are concluded as follows:
(1)
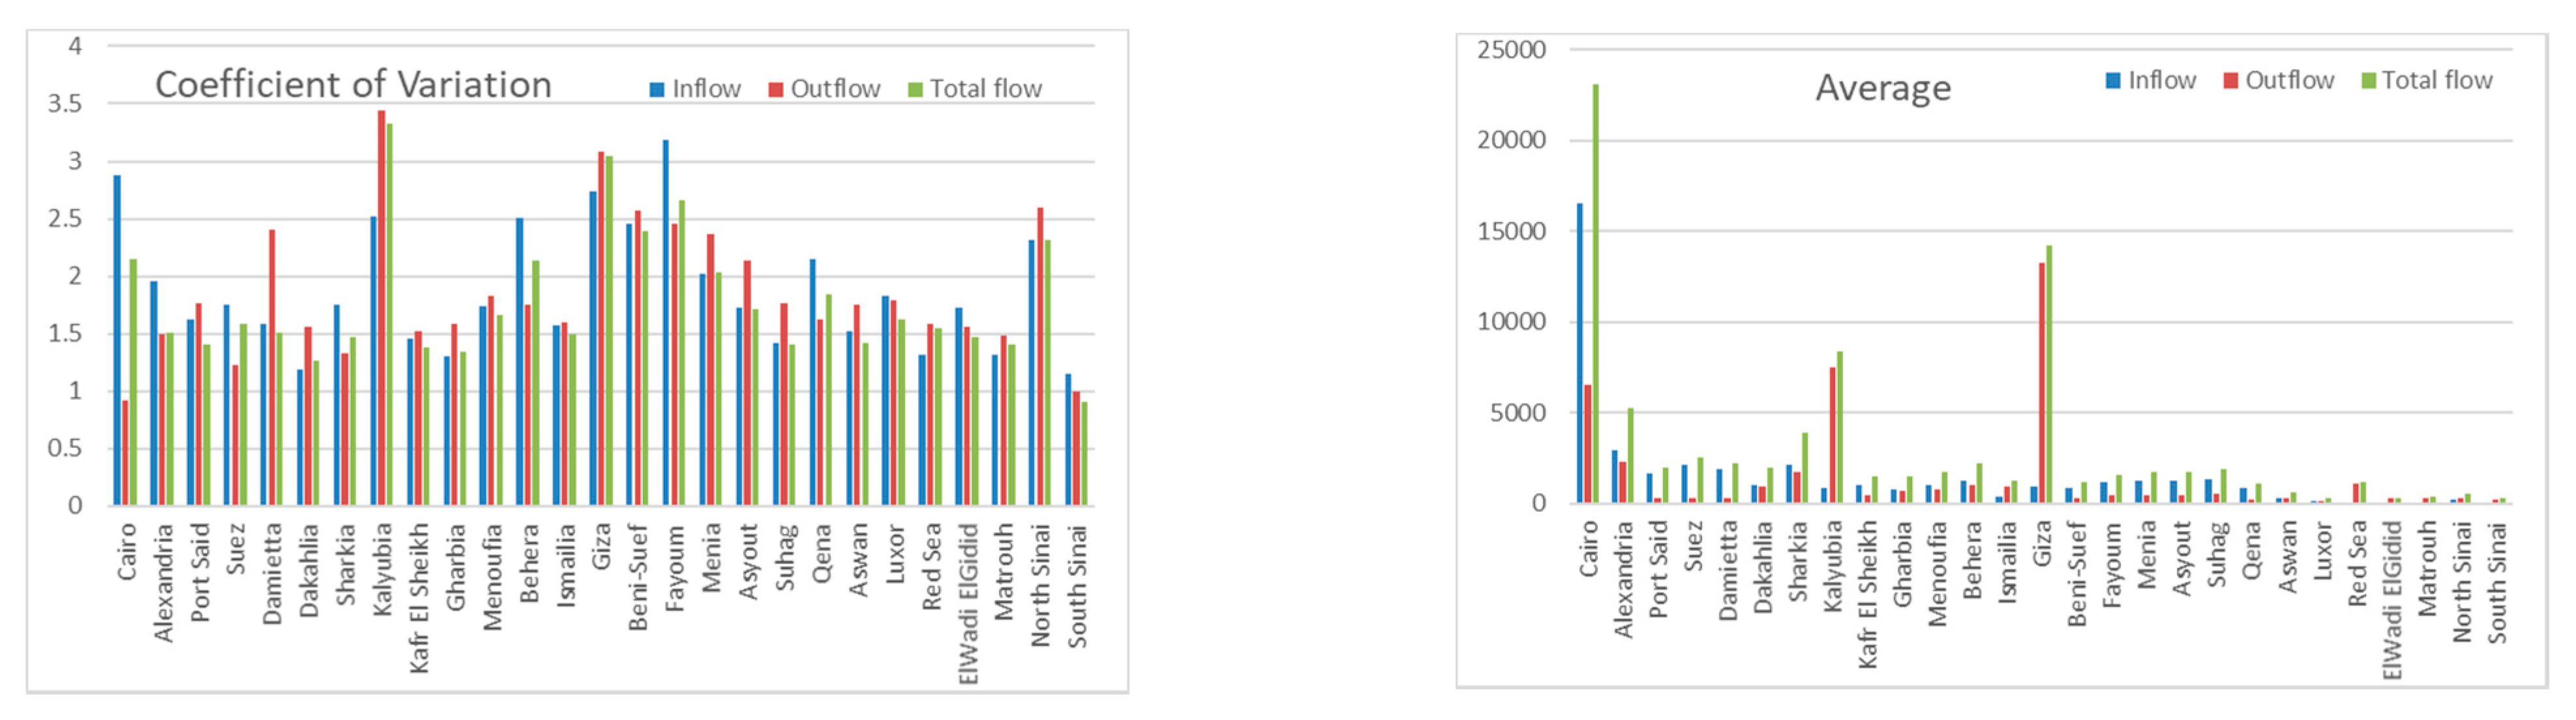
There are significant differences in the migration population size and rate of migration in Egypt, which may be associated with the level of the economic development and environmental carrying capacity of the provinces [40,46,47]. How to guide the combination of provincial population migration and urbanization is a long-term challenge for Egypt in the future. The total interprovincial migration population size in Egypt is more than 2.2 million, and the overall migration rate is 2.33%, with extreme multiples of 80, 82, 463, 12, 40 and 28 for the total migration population, immigrant population size, emigrant population size, migration rate, immigration rate and emigration rate, respectively. According to the provincial analysis, the CVs of Inflow, Outflow, and Total flow in a province are all greater than 1, except for Outflow in Cairo and Total flow in South Sinai. It is up to 3.5 in Kalyubia, compared with the overall level of around 2.5 in Giza, Fayoum, Cairo, Beni-Suef, and North Sinai.
(2)
There is a big difference in development level between Source System and Sink System. According to the spatial pattern of geographical distribution, the Source System is divided into five types: axis type, layer type, fan type, oblique symmetry type and scattered jump type. There are only three types in Sink System, namely wide area coverage type, local development type, and scattered jump type. About 52% of the provinces in Egypt have Pure-Source Places nodes, which are generally characterized by lagging economic development, small population size, and certain security risks. There are Pure-Sink Places nodes in about 48% of the provinces in Egypt, which are mainly located outside the Nile Valley. The population migration flow network and space distribution patterns in Egypt are still in immature development compared with China, which may be due to the great difference between China and Egypt in economic development levels, population mobility policies, and management systems [74].
(3)
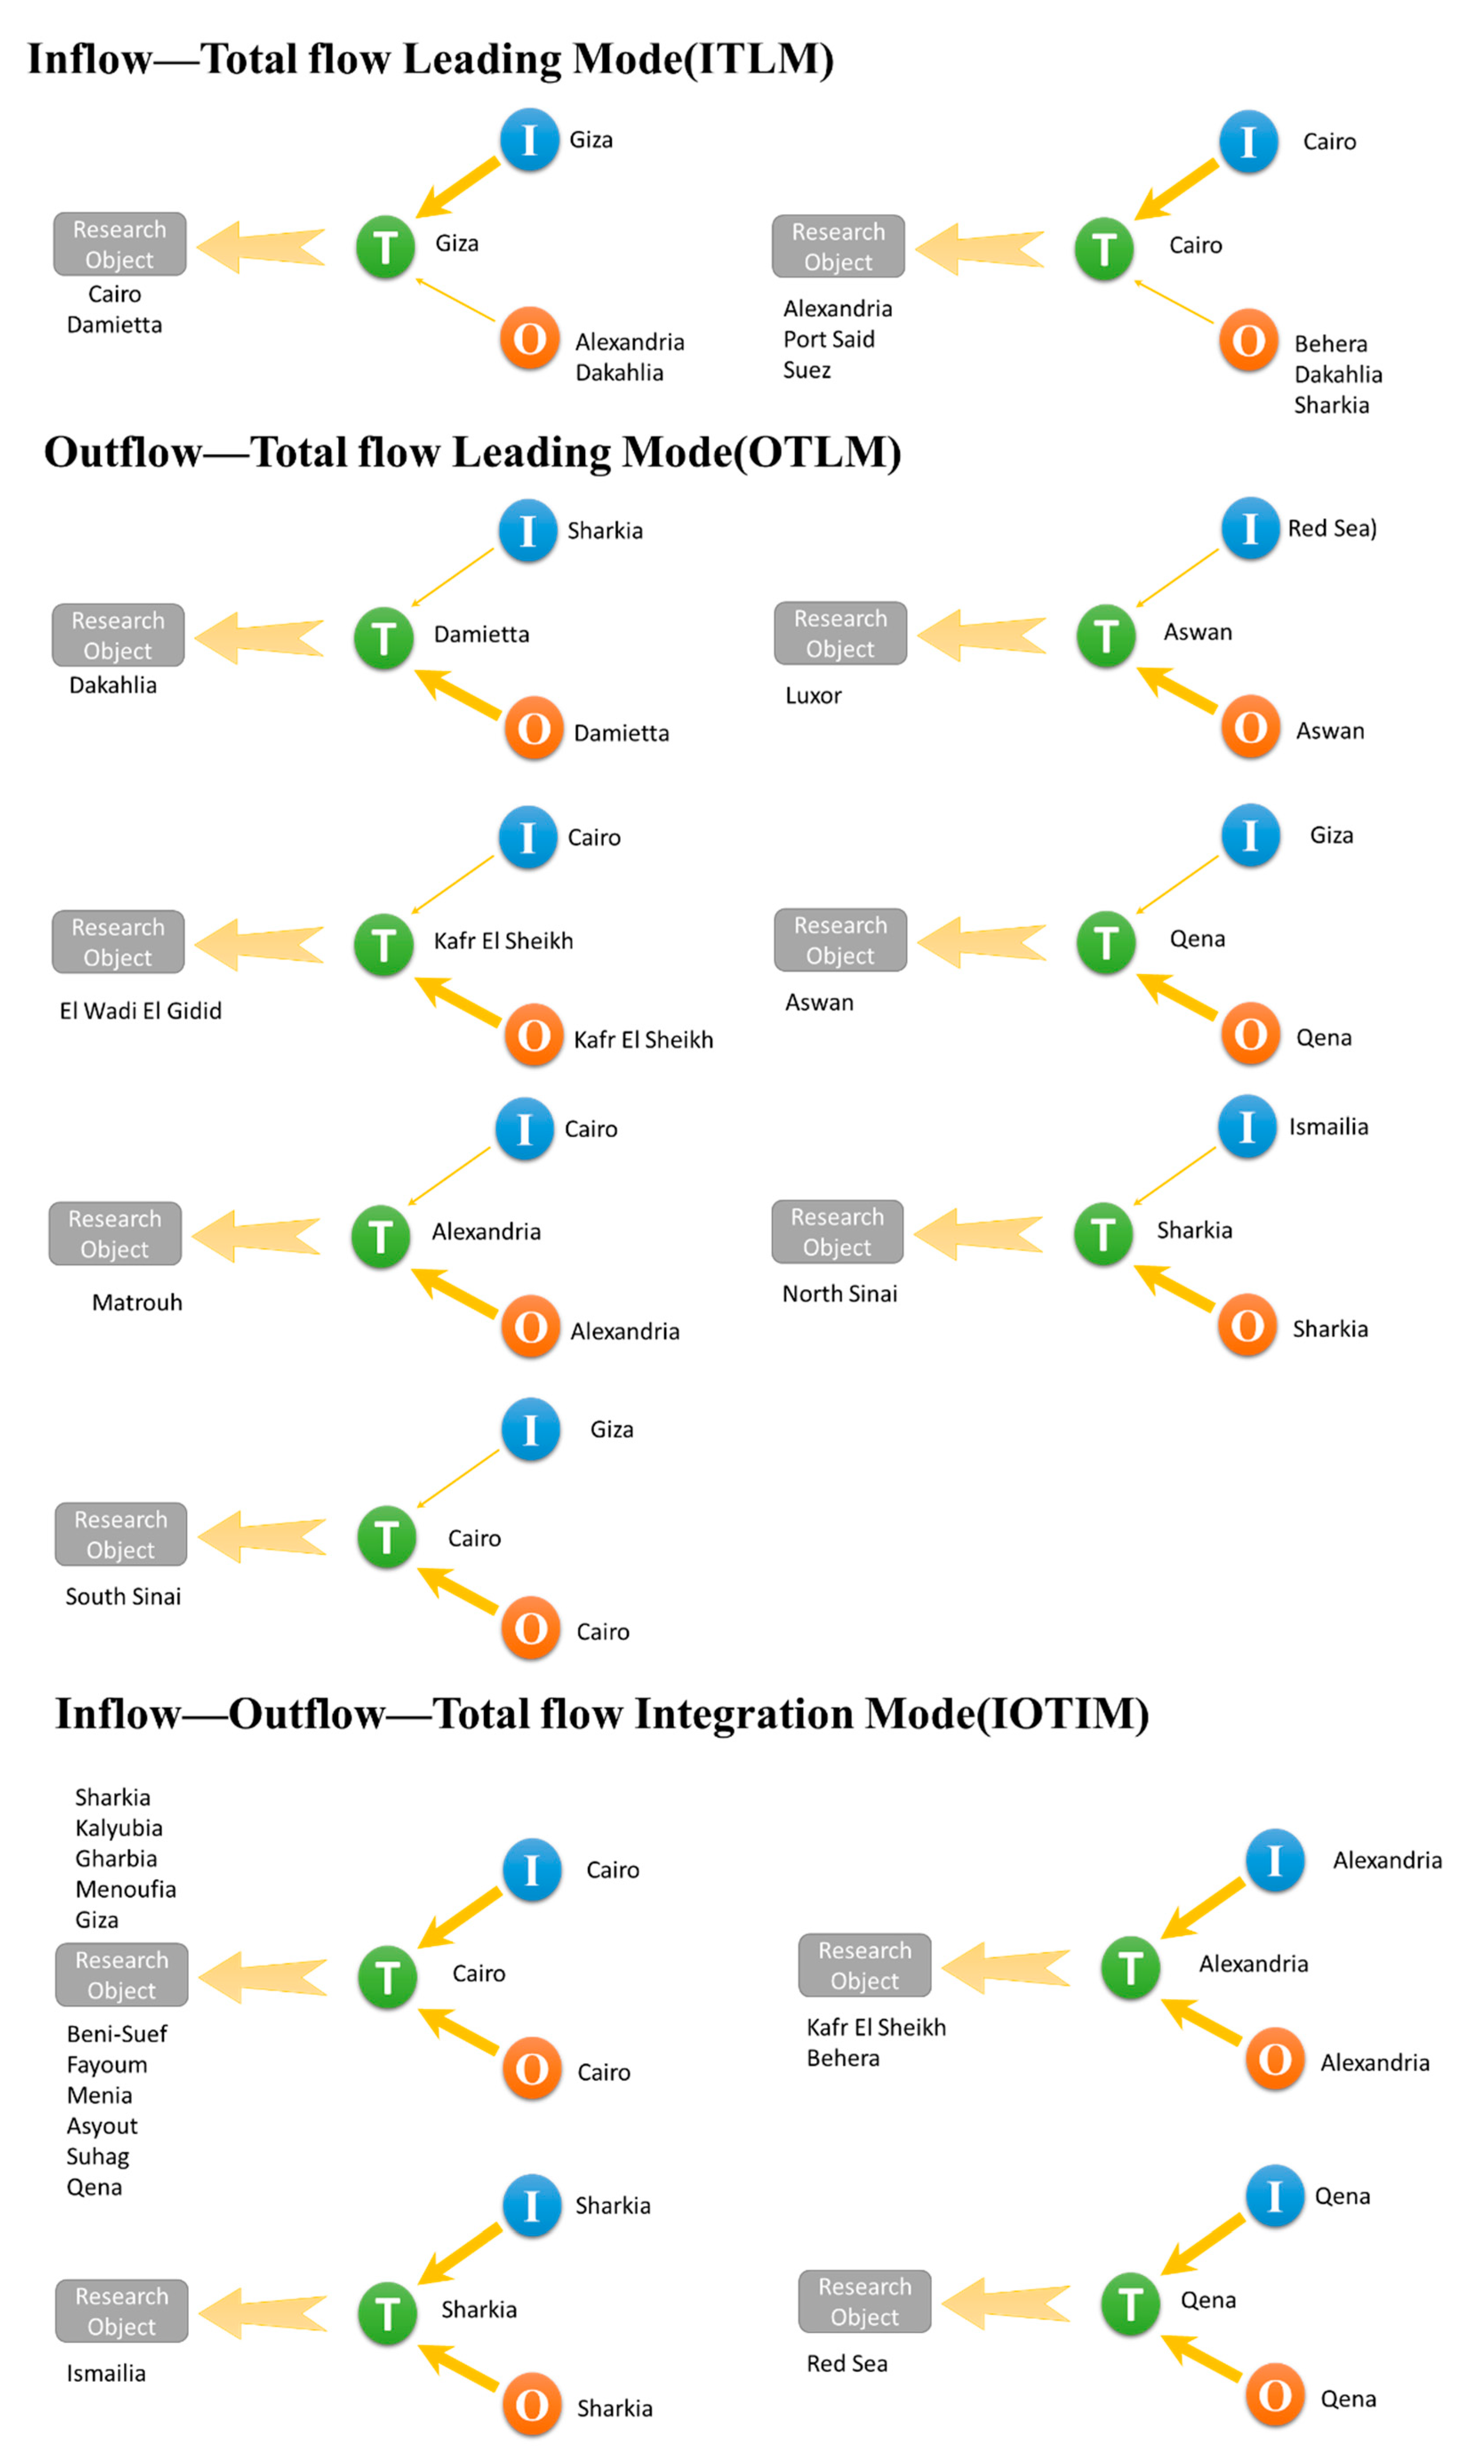
The interprovincial migration flow network in Egypt has developed into a variety of models, and the center system of flow field with clear primary and secondary points and the streamline network framework with layered trunks and branches have been developed in most provinces. There are 7 modes in the migration flow network center system, including Centerless Mode, Only Diffusion Center Field Mode, Only Gathering Center Field Mode, One Diffusion and One Gathering Center Field Mode, One Diffusion and Two Gathering Center Field Mode, One Diffusion and Multiple Gathering Center Field Mode, Multiple Diffusion and Multiple Gathering Center Field Mode. There are 3 modes of pole-core interaction, that is, ITLM, OTLM, and IOTIM, in the interprovincial migration flow. The migration flow is based on neighborhood penetration and polarization of high-level nodes (national capital or regional economic centers). Water source is an important factor affecting population migration, which agrees with the research results concluded by Ai Tinghua [46], Ayman Zohry [75] and Lea Müller-Funk [76].
In the data of Central Agency for Public Mobilization and Statistics, classified statistics were conducted for the relocation reasons of 1% of the migrants, including work, study, marriage, divorce and widowhood, companion, and others. Marriage is the top reason for migration, accounting for 32.66%; work and companion are about equal, accounting for about 26%; the proportion of study is close to that of others, accounting for more than 6.6%; divorce and widowhood account for the lowest percentage, only 1.13%. From the perspective of different provinces, the six reasons for population migration are generally balanced in proportion in Giza, Kalyobiya, Cairo, Alexandria, Sharqeia, Dakahliya, El-Beheira, Ismailia, Fayoum, and Assiut. But migration is dominated by work in Port-Said, The Red Sea and Matrouh, dominated by companion in New Valley, North Sinai and South Sinai, dominated by study in Suez, Menia and Sohag, while dominated by divorce and widowhood in Damietta, Kafr El Shiekh, Al Gharbya, Monofiya, Bani Souwaif, Qena, Aswan and Luxor. The reasons for population migration in Egypt are complex on the whole, and they vary greatly from province to province. Population migration is affected by social factors such as marriage, companion, study, divorce and widowhood, besides economic factors such as work, income, and wealth inequality. It is also in connection with natural factors such as water resources and environmental carrying capacity. Driven by these factors, the migration population in Egypt has formed a unique spatial pattern and flow field mentioned above. Limited by the space and topic of this paper, we will analyze the influencing factors and driving mechanism in the next paper, which will be the priority of future study.
According to the experience of developed countries, Egypt in the future will usher in an increasing scale of regional population flow and migration, and which will proceed at a faster rate with the rapid development of economy and society, and the improvement of transportation, especially the acceleration of industrialization and urbanization. By studying the laws of the population migration flow, direction, and flow field in Egypt, this paper analyzes the space distribution structure characteristics of the source, sink, and exchange places of population migration, which is of great practical significance to gain insight into the spatial pattern of Egyptian population flow and its development trend, and to adjust the population development policies and spatial governance plans of Egypt in time at the national and regional scales. Because it is restricted by many factors, there are some shortcomings in this paper. For example, population flow and migration are the dynamic balancing process of the relationship between regional population supply and demand; the thrust of the source, the pull of the sink, the diversion and blocking facilities between source and sink directly affect the flow pattern and spatial effects of the population migration. There is no in-depth discussion on the formation mechanism and optimization strategy of source and sink, and no further analysis of the characteristics of migration flow field under different driving factor. In addition, there are certain limitations for the analysis of spatial pattern and flow field characteristics of the migrant population flow in Egypt, which is only based on the data of a time point in 2017. Therefore, when applied to the formulation of regional population development policies or spatial governance plans, the conclusions reached should be adjusted and optimized on the basis of more updated census data.

Author Contributions

Conceptualization, Z.M.; methodology, S.Z. (Sidong Zhao); investigation, Z.M., S.Z. (Susu Zhang) and S.Z. (Sidong Zhao); data curation, S.Z. (Sidong Zhao) and Z.M.; writing—original draft preparation, Z.M. and S.Z. (Sidong Zhao); writing—review and editing, Z.M.; project administration, Z.M.; funding acquisition, Z.M. and S.Z. (Sidong Zhao). All authors have read and agreed to the published version of the manuscript.

Funding

This paper and the related research are financially supported by the Guangxi Social Science Fund Project (No. 17FJY017).

Institutional Review Board Statement

Not applicable.

Informed Consent Statement

Informed consent was obtained from all subjects involved in the study.

Data Availability Statement

Conflicts of Interest

The authors declare no conflict of interest.

References

  1. Cao, Y. Evolution and characteristics of spatial economic structure in Ningxia Province. J. Arid Land Resour. Environ. 2010, 24, 10–14. [Google Scholar]
  2. Cindy, C. FanInterprovincial Migration, Population Redistribution, and Regional Development in China: 1990 and 2000 Census Comparisons. Prof. Geogr. 2005, 57, 295–311. [Google Scholar]
  3. Otsubo, K.; Ichinose, T.; Ishimura, S. Spatial and Temporal Changes of Floating Population in China Between 1990 and 2000. Chin. Geogr. Sci. 2007, 17, 99–109. [Google Scholar]
  4. Liang, Z.; Ma, Z. China’s Floating Population: New Evidence from the 2000 Census. Popul. Dev. Rev. 2004, 30, 467–478. [Google Scholar] [CrossRef]
  5. Liang, Z.; Li, Z.; Ma, Z. Changing Patterns of the Floating Population in China, 2000–2010. Popul. Dev. Rev. 2014, 4, 695–716. [Google Scholar] [CrossRef]
  6. Qiao, L.; Li, Y.; Liu, Y.; Yang, R. The spatio-temporal change of China’s net floating population at county scale from 2000 to 2010. Asia Pac. Viewp. 2016, 57, 365–378. [Google Scholar] [CrossRef]
  7. Wu, J.; Yu, Z.; Wei, Y.D. Changing distribution of migrant population and its influencing factors in urban China: Economic transition, public policy, and amenities. Habitat Int. 2019, 94, 102063. [Google Scholar] [CrossRef]
  8. Wang, L.; Xue, C. Spatio-temporal characteristics and influencing factors of urban floating population in China from 2011 to 2015. Chin. J. Popul. Resour. Environ. 2019, 4, 359–373. [Google Scholar] [CrossRef]
  9. Liu, S.; Hu, Z.; Deng, Y.; Wang, Y.J. The regional types of China’s floating population: Identification methods and spatial patterns. J. Geogr. Sci. 2011, 21, 35–48. [Google Scholar] [CrossRef]
  10. Kuninaka, H.; Matsushita, M. Modelling of Population Migration to Reproduce Rank-Size Distribution of Cities in Japan. In Proceedings of the International Conference on Complex Sciences, Shanghai, China, 23–25 February 2009; Springer: Berlin/Heidelberg, Germany, 2009; Volume 4, pp. 441–445. [Google Scholar]
  11. Liu, R.; Jia, R.; Dong, Q. Improvement of Population Migration Model and System Dynamics Simulation. Math. Pract. Theory 2008, 4, 161–164. [Google Scholar]
  12. Zhao, M.; Liu, S.; Qi, W. Exploring the differential impacts of urban transit system on the spatial distribution of local and floating population in Beijing. J. Geogr. Sci. 2017, 27, 731–751. [Google Scholar] [CrossRef]
  13. Jordi, B.; Marc, A. Habitual mobility and territorial concentration of the immigrant population: The case of the Metropolitan Region of Barcelona. Eure-Revista Latinoamericana De Estudios Urbano Regionales 2018, 133, 161–186. [Google Scholar]
  14. Wang, X.; Hao, R.; Zhao, N.; Hao, R. Statistical characteristics of dynamics for population migration driven by the economic interests. Phys. A Stat. Mech. Appl. 2016, 451, 123–134. [Google Scholar]
  15. Shi, G.; Lu, X.; Deng, Y.; Urpelainen, J.; Liu, L.; Zhang, Z.; Wei, W.; Wang, H.K. Air Pollutant Emissions Induced by Population Migration in China. Environ. Sci. Technol. 2020, 10, 6308–6318. [Google Scholar] [CrossRef]
  16. Olha, L.; Olha, M.; Ulana, I.; Marta, K.; Taras, V.; Ruslan, L. Modelling the Conditions Affecting Population Migration Activity in the Eastern European Region: The Case of Ukraine. Tem J.-Technol. Educ. Manag. Inform. 2020, 2, 507–514. [Google Scholar]
  17. Shi, Q.; Liu, T. Glimpsing China’s future urbanization from the geography of a floating population. Environ. Plan. 2019, 51, 817–819. [Google Scholar] [CrossRef]
  18. Gao, D.; Peng, J.; Zi, L. Study on the Relationship between the Population Migration and Region Economy Based on the Framework of VAR Model: A Case Study of Chongqing. Northwest Popul. J. 2020, 110, 50–53. [Google Scholar]
  19. Luo, J.; Zhang, X.; Wu, Y.; Shen, J.; Shen, L.; Xing, X.S. Urban land expansion and the floating population in China: For production or for living? Cities 2018, 74, 219–228. [Google Scholar] [CrossRef]
  20. Zhu, R.; Lin, D.; Wang, Y.; Michael, J.; Xin, R.; Yang, J.; Guo, J.; Meng, L.Q. Social Sensing of the Imbalance of Urban and Regional Development in China Through the Population Migration Network around Spring Festival. Sustainability 2020, 12, 3457. [Google Scholar] [CrossRef]
  21. Wilner, J.P.; Mark, P.; Elena, I. Estimation of a spatial simultaneous equation model of population migration and housing price dynamics. Reg. Sci. Urban Econ. 2010, 40, 343–352. [Google Scholar]
  22. Gou, W.; Huang, S.; Chen, Q.; Chen, J.; Li, X.M. Structure and Dynamic of Global Population Migration Network. Complexity 2020. [Google Scholar] [CrossRef]
  23. Wang, J.; Kim, S. Multilevel Analysis of Social and Policy Acceptance of Immigrants across: European Countries and Its Implications for Comparative Policy. J. Comp. Policy Anal. Res. Pract. 2020. [Google Scholar] [CrossRef]
  24. Angeles, H.G.M.; Rocio, M.M. Neighborhood models and logical location of the immigrant population:The case of the city of Seville. Scripta Nova-Revista Electronica De Geografia Y Ciencias Sociales 2011, 372, 1–14. [Google Scholar]
  25. John, S.; Konstantinos, D.; Martin, B.; Nik, L. The IMAGE studio: A tool for internal migration analysis and modelling. Appl. Spat. Anal. Policy 2014, 7, 5–23. [Google Scholar]
  26. Mariella, A.; Cristina, T.; Maria, A. Earth Observation for the Implementation of Sustainable Development Goal 11 Indicators at Local Scale: Monitoring of the Migrant Population Distribution. Remote Sens. 2020, 6, 950. [Google Scholar] [CrossRef]
  27. Nayef, A.; David, P.; Elin, C. Accounting for peoples’ preferences in establishing new cities: A spatial model of population migration in Kuwait. PLoS ONE 2018, 13, e0209065. [Google Scholar]
  28. Raymer, J.; Bai, X.; Liu, N.; Wilson, T. Reconciliation of Australian Demographic Data to Study Immigrant Population Change Across Space and Time. Spat. Demogr. 2020, 8, 123–153. [Google Scholar] [CrossRef]
  29. Raymer, J.; Shi, Y.; Guan, Q.; Baffour, B.; Wilson, T. The Sources and Diversity of Immigrant Population Change in Australia, 1981–2011. Demography 2018, 55, 1777–1802. [Google Scholar] [CrossRef]
  30. Perez, L.; Dragicevic, S.; Gaudreau, J. A geospatial agent-based model of the spatial urban dynamics of immigrant population: A study of the island of Montreal, Canada. PLoS ONE 2019, 14, e0219188. [Google Scholar] [CrossRef]
  31. Liang, Z. The Age of Migration in China. Popul. Dev. Rev. 2010, 27, 499–524. [Google Scholar] [CrossRef]
  32. Tan, S.; Li, Y.; Song, Y.; Luo, X.; Zhou, M.; Zhang, L.; Kuang, B. Influence factors on settlement intention for floating population in urban area: A China study. Qual. Quant. 2017, 1, 147–176. [Google Scholar] [CrossRef]
  33. Tang, S.; Feng, J. Understanding the Settlement Intentions of the Floating Population in the Cities of Jiangsu Province, China. Asian Pac. Migr. J. 2012, 4, 509–532. [Google Scholar] [CrossRef]
  34. Wang, N. Changing Trend of Population Migration in China and Its Spatial Pattern. Chin. J. Urban Environ. Stud. 2017, 4, 1650032. [Google Scholar] [CrossRef]
  35. Martori, J.C.; Apparicio, P.; Ngui, A.N. Understanding Immigrant Population Growth within Urban Areas: A Spatial Econometric Approach. J. Int. Migr. Integr. 2016, 1, 215–234. [Google Scholar] [CrossRef]
  36. Joan, C.M.; Philippe, A. Changes in Spatial Patterns of the Immigrant Population of a Southern European Metropolis: The Case of the Barcelona Metropolitan Area (2001–2008). Tijdschrift Voor Economische En Sociale Geografie 2011, 102, 562–581. [Google Scholar]
  37. Stewart, D.J.; Yin, Z.; Bullard, S.M.; Maclachlan, J.T. Assessing the spatial structure of urban and population growth in the Greater Cairo area, Egypt: A GIS and imagery analysis approach. Urban Stud. 2004, 41, 95–116. [Google Scholar] [CrossRef]
  38. McCormick, B.; Wahba, J. Return International Migration and Geographical Inequality: The Case of Egypt. J. Afr. Econ. 2003, 12, 500–532. [Google Scholar] [CrossRef]
  39. Tamer, A. The Environmental Root Causes Triggering Economic Migration: The Case of Egypt. Environment, Forced Migration and Social Vulnerability; Springer: Berlin/Heidelberg, Germany, 2010. [Google Scholar]
  40. Arouri, M.; Cuong, N.V. Wealth inequality and inter-governorate migration: Evidence from Egypt. Prog. Dev. Stud. 2020, 20, 119–139. [Google Scholar] [CrossRef]
  41. Dalia, M. Ibrahiem. Road energy consumption, economic growth, population and urbanization in Egypt: Cointegration and causality analysis. Environ. Dev. Sustain. 2018, 20, 1053–1066. [Google Scholar]
  42. Gomaa, G.; Mohamed, A.; Schachler, M.H. Population Growth and Transitional Dynamics of Egypt Theoretical Analysis & Time Series Analysis from 1981 to 2007. Int. J. Asian Soc. Sci. 2016, 7, 110–118. [Google Scholar]
  43. Mohamed, R.I. How do people select their residential locations in Egypt? The case of Alexandria. Cities 2017, 62, 96–106. [Google Scholar]
  44. Gourida, S. The Internal Migration in Arab World “Reasons, Policies and Aspects” Evidence from Egypt. Int. J. Adv. Soc. Sci. Humanit. 2014, 2, 8–15. [Google Scholar]
  45. Zohry, A. Immigration to Egypt. J. Immigr. Refug. Stud. 2006, 4, 33. [Google Scholar] [CrossRef]
  46. Ai, T.; Zhou, M.; Tian, J.; Ye, N. Origin-destination (OD) of the interprovincial floating population of China. J. Maps 2016, 12 (Suppl. 1), 577–583. [Google Scholar] [CrossRef]
  47. Kazuhiro, K. Inter-regional Population Migration in Russia: Using an Origin-to-Destination Matrix. Post-Communist Econ. 2007, 19, 131–152. [Google Scholar]
  48. Paquet, M.; Arlt, D.; Knape, J.; Low, M.; Forslund, P.; Part, T. Why we should care about movements: Using spatially explicit integrated population models to assess habitat source–sink dynamics. J. Anim. Ecol. 2020. [Google Scholar] [CrossRef]
  49. Sutherland, K.H.; Johnstone, R.A.; Sih, A. The Logic of Territory Choice: Implications for Conservation and Source-Sink Dynamics. Am. Nat. 2001, 4, 459–463. [Google Scholar]
  50. Christine, S.; Joanna, B.; Benjamin, A.A.; Dementiev, Y.; Carson, A.; Higgins, C.; Piatt, S.; Qiu, S.; Stafford, S.; Mattsson, B.J.; et al. Quantifying source and sink habitats and pathways in spatially structured populations: A generalized modelling approach. Ecol. Model. 2019, 407, 108715. [Google Scholar]
  51. Zaccarelli, N.; Petrosillo, I.; Zurlini, G.; Riitters, K.H. Source/Sink Patterns of Disturbance and Cross-Scale Mismatches in a Panarchy of Social-Ecological Landscapes. Ecol. Soc. 2008, 13, 26. [Google Scholar] [CrossRef]
  52. Ma, R.; Xie, M.; Yun, W. Evaluating Responses of Temperature Regulating Service to Landscape Pattern Based on ‘Source-Sink’ Theory. Isprs Int. J. Geo-Inf. 2020, 5, 295. [Google Scholar] [CrossRef]
  53. Pramanik, S.; Punia, M. Land use/land cover change and surface urban heat island intensity: Source-sink landscape-based study in Delhi, India. Environ. Dev. Sustain. 2020, 8, 7331–7356. [Google Scholar] [CrossRef]
  54. Zhang, X.; Wu, Q.Y.; Cui, J.T.; Liu, Y.Q.; Wang, W.S. “Source–sink” landscape pattern analysis of nonpoint source pollution using remote sensing techniques. Int. J. Environ. Technol. 2018, 15, 2253–2268. [Google Scholar] [CrossRef]
  55. Zhang, X.; Cui, J.; Liu, Y.; Wang, L. Geo-cognitive computing method for identifying “source-sink” landscape patterns of river basin non-point source pollution. Int. J. Agric. Biol. Eng. 2017, 10, 55–68. [Google Scholar]
  56. Jiang, M.; Chen, H.; Chen, Q. A method to analyze “source-sink” structure of non-point source pollution based on remote sensing technology. Environ. Pollut. 2013, 182, 135–140. [Google Scholar] [CrossRef] [PubMed]
  57. Huang, W.; Gao, B.; Lin, J.; Cui, S.; Zhong, Q.; Huang, C.L. Driving forces of nitrogen input into city-level food systems: Comparing a food-source with a food-sink prefecture-level city in China. Resour. Conserv. Recycl. 2020, 160, 104850. [Google Scholar] [CrossRef]
  58. Wu, X.D.; Guo, J.L.; Han, M.Y.; Chen, G.Q. An overview of arable land use for the world economy: From source to sink via the global supply chain. Land Use Policy 2018, 76, 201–214. [Google Scholar] [CrossRef]
  59. Wu, X.F.; Chen, G.Q. Global overview of crude oil use: From source to sink through inter-regional trade. Energy Policy 2019, 128, 476–486. [Google Scholar] [CrossRef]
  60. Wu, X.F.; Chen, G.Q. Coal use embodied in globalized world economy: From source to sink through supply chain. Renew. Sustain. Energy Rev. 2018, 81, 978–993. [Google Scholar] [CrossRef]
  61. Wu, T.; Tang, L.; Chen, H.; Wang, Z. Application of Source-Sink Landscape Influence Values to Commuter Traffic: A Case Study of Xiamen Island. Sustainability 2017, 9, 2366. [Google Scholar] [CrossRef]
  62. Liu, Y.; Wang, F.; Xiao, Y.; Gao, S. Urban land uses and traffic ‘source-sink areas’: Evidence from GPS-enabled taxi data in Shanghai. Landsc. Urban Plan. 2012, 106, 73–87. [Google Scholar] [CrossRef]
  63. Gu, Q.; Zhang, H.; Chen, M.; Chen, C. Regionalization Analysis and Mapping for the Source and Sink of Tourist Flows. ISPRS Int. J. Geo-Inf. 2019, 8, 314. [Google Scholar] [CrossRef]
  64. Felzer, B.S.; Jiang, M. Effect of Land Use and Land Cover Change in Context of Growth Enhancements in the United States since 1700: Net Source or Sink? J. Geophys. Res. Biogeosci. 2018, 123. [Google Scholar] [CrossRef]
  65. Qin, M.; Li, H.; Ya, J.; Zhao, J.; Chen, W.C. Study on space structure change of land used for carbon source and carbon sink in urban fringe areas. In Proceedings of the 3rd International Conference on Civil Engineering and Urban Planning (CEUP), Wuhan, China, 20–22 June 2014; pp. 407–411. [Google Scholar]
  66. Sakalli, A. The responses of net ecosystem production to climate change: A modelling study to identify the sink and source of carbon regions at the paneuropean scale. Appl. Ecol. Environ. Res. 2020, 18, 4569–4581. [Google Scholar] [CrossRef]
  67. Craig, J.; Joseph, B.; Nepal, P.; Prestemon, J.P. From Source to Sink: Past Changes and Model Projections of Carbon Sequestration in the Global Forest Sector. J. For. Econ. 2019, 34, 47–72. [Google Scholar]
  68. Kawecki, T.J. Demography of source-sink populations and the evolution of ecological niches. Evol. Ecol. 1995, 9, 38–44. [Google Scholar] [CrossRef]
  69. Brawn, J.D.; Robinson, S.K. Source-Sink Population Dynamics may Complicate the Interpretation of Long-Term Census Data. Ecology 1996, 1, 3–12. [Google Scholar] [CrossRef]
  70. Gundersen, G.; Johannesen, E.; Andreassen, H.P.; Ims, R.A. Source–sink dynamics: How sinks affect demography of sources. Ecol. Lett. 2001, 4, 14–21. [Google Scholar] [CrossRef]
  71. Wang, Y.; Wang, F.; Zhang, Y.; Liu, Y. Delineating urbanization “source-sink” regions in China: Evidence from mobile app data. Cities 2019, 86, 167–177. [Google Scholar] [CrossRef]
  72. Haggett, P.; Cliff, A.D.; Frey, A. Locational Analysis in Human Geography; Edwad Arnold: London, UK, 1977. [Google Scholar]
  73. Xiao, D. Cognitive Geography: People-Oriented Geographic Information Science; Science Press: Beijing, China, 2013; pp. 56–64. [Google Scholar]
  74. Zhang, W.; Derudder, B.; Witlox, F.; Vanheule, D. Method for visualizing mainland China’s floating migration: A critical assessment. Asian Pac. Migr. J. 2017, 26, 128. [Google Scholar] [CrossRef]
  75. Ayman, Z.; Zohry, A. The Place of Egypt in the regional migration system as a receiving country. Rev. Eur. Migrat. Int. 2003, 19, 129–149. [Google Scholar]
  76. Lea, M.-F. Managing Distance: Examining Egyptian Emigration and Diaspora Policies. Egypte/Monde Arabe 2019, 15, 47–69. [Google Scholar]
Figure 1. Analysis of population flow field in Egypt.
Sustainability 13 00350 g001
Figure 2. Spatial analysis of the source-sink system of Egypt’s migrant population.
Sustainability 13 00350 g002
Figure 3. Spatial analysis of the source-sink system of Egypt provinces’ migrant population.
Sustainability 13 00350 g003
Figure 4. Average and CV flow parameters of each province in Egypt.
Sustainability 13 00350 g004
Figure 5. Analysis of the basic types of maximal core interaction.
Sustainability 13 00350 g005
Figure 6. Analysis of the Centerless Mode in Egypt.
Sustainability 13 00350 g006
Figure 7. Analysis of the Only Diffusion Center Field Mode in Egypt.
Sustainability 13 00350 g007
Figure 8. Analysis of the Only Gathering Center Field Mode in Egypt.
Sustainability 13 00350 g008
Figure 9. Analysis of the One Diffusion and One Gathering Center Field Mode in Egypt.
Sustainability 13 00350 g009
Figure 10. Analysis of the One Diffusion and Two Gathering Center Field Mode in Egypt.
Sustainability 13 00350 g010
Figure 11. Analysis of the One Diffusion and Multiple Gathering Center Field Mode in Egypt.
Sustainability 13 00350 g011
Figure 12. Analysis of the Multiple Diffusion and Multiple Gathering Center Field Mode in Egypt.
Sustainability 13 00350 g012
Table 1. Standards for determining the attributes of spatial nodes.
R i Spatial AttributesExplanation
1=0Pure-Sink PlacesPopulation in space i only moves in unidirectionally with no population moving out
2<0.5Sink PlacesImmigrant population size is larger than emigrant population size in space i
30.5–1.5Exchange PlacesImmigrant population size is in a relative balance with the emigrant population size in space i
4≥1.5Source PlacesEmigrant population size is larger than immigrant population size in space i
5Pure-Source PlacesPopulation in space i only moves out unidirectionally with no population moving in
Table 2. General analysis of population migration in Egypt.
OutflowInflowTotal FlowTotal PopulationInflow RateOutflow RateMigration RateNet Flow
Cairo170,854429,762600,6169,539,6731.794.506.30258,908
Alexandria60,05477,410137,4645,163,7501.161.502.6617,356
Port Said787843,83651,714749,3711.055.856.9035,958
Suez884156,81765,658728,1801.217.809.0247,976
Damietta765849,80557,4631,496,7650.513.333.8442,147
Dakahlia23,71827,54451,2626,492,3810.370.420.793826
Sharkia45,59155,238100,8297,163,8240.640.771.419647
Kalyubia195,68521,660217,3455,627,4203.480.383.86−174,025
Kafr El Sheikh12,29627,26339,5593,362,1850.370.811.1814,967
Gharbia17,76221,50539,2674,999,6330.360.430.793743
Menoufia19,75925,91045,6694,301,6010.460.601.066151
Behera25,98332,23858,2216,171,6130.420.520.946255
Ismailia24,771925034,0211,303,9931.900.712.61−15,521
Giza345,87424,243370,1178,632,0214.010.284.29−321,631
Beni-Suef857122,69631,2673,154,1000.270.720.9914,125
Fayoum11,37430,24841,6223,596,9540.320.841.1618,874
Menia13,18733,20846,3955,497,0950.240.600.8420,021
Asyout12,99232,42545,4174,383,2890.300.741.0419,433
Suhag14,13335,44449,5774,967,4090.280.711.0021,311
Qena656021,59128,1513,164,2810.210.680.8915,031
Aswan7714850516,2191,473,9750.520.581.10791
Luxor4207478589921,250,2090.340.380.72578
Red Sea29,422222931,651359,8888.180.628.79−27,193
El Wadi El Gidid77839298712241,2473.230.393.61−6854
Matrouh726820709338425,6241.710.492.19−5198
North Sinai8491658115,072450,3281.891.463.35−1910
South Sinai614013747514102,0186.021.357.37−4766
Table 3. Maximum flow parameters of each province in Egypt.
InflowOutflowTotal Flow
Cairo21,231 (Giza)23,498 (Alexandria)225,395 (Giza)
Alexandria23,498 (Cairo)15,737 (Behera)32,198 (Cairo)
Port Said10,669 (Cairo)2093 (Dakahlia)10,966 (Cairo)
Suez14,609 (Cairo)1446 (Sharkia)15,862 (Cairo)
Damietta11,799 (Giza)3621 (Dakahlia)11,809 (Giza)
Dakahlia4435 (Sharkia)5575 (Damietta)9196 (Damietta)
Sharkia16,238 (Cairo)11,541 (Cairo)27,779 (Cairo)
Kalyubia9844 (Cairo)134,142 (Cairo)143,986 (Cairo)
Kafr El Sheikh6731 (Alexandria)2521 (Alexandria)9252 (Alexandria)
Gharbia4294 (Cairo)5235 (Cairo)9529 (Cairo)
Menoufia6429 (Cairo)6561 (Cairo)12,990 (Cairo)
Behera15,737 (Alexandria)8815 (Alexandria)24,552 (Alexandria)
Ismailia2145 (Sharkia)6638 (Sharkia)8783 (Sharkia)
Giza13,083 (Cairo)212,312 (Cairo)225,395 (Cairo)
Beni-Suef8715 (Cairo)4344 (Cairo)13,059 (Cairo)
Fayoum17,912 (Cairo)5432 (Cairo)18,712 (Cairo)
Menia11,584 (Cairo)6194 (Cairo)17,778 (Cairo)
Asyout9287 (Cairo)5263 (Cairo)14,550 (Cairo)
Suhag8039 (Cairo)4459 (Cairo)12,498 (Cairo)
Qena8839 (Cairo)1962 (Cairo)9287 (Cairo)
Aswan1774 (Giza)2110 (Qena)2873 (Qena)
Luxor1255 (Red Sea)1090 (Aswan)2254 (Aswan)
Red Sea448 (Qena)8839 (Qena)9287 (Qena)
El Wadi El Gidid256 (Cairo)1555 (Kafr El Sheikh)1555 (Kafr El Sheikh)
Matrouh355 (Cairo)1547 (Alexandria)1889 (Alexandria)
North Sinai2532 (Ismailia)4124 (Sharkia)5926 (Sharkia)
South Sinai231 (Giza)1031 (Cairo)1144 (Cairo)
Publisher’s Note: MDPI stays neutral with regard to jurisdictional claims in published maps and institutional affiliations.

