Market Integration and Regional Green Total Factor Productivity: Evidence from China’s Province-Level Data


Business School, University of Shanghai for Science and Technology, Shanghai 200093, China
*
Author to whom correspondence should be addressed.
Sustainability 2021, 13(2), 472; https://0-doi-org.brum.beds.ac.uk/10.3390/su13020472
Submission received: 3 December 2020
/
Revised: 4 January 2021
/
Accepted: 5 January 2021
/
Published: 6 January 2021
Abstract
:The development of market integration has an important effect on regional green total factor productivity (GTFP). Based on the panel data of 30 provinces in China from 2008 to 2017, this paper studies the spatial effect and transmission mechanism of market integration on regional green total factor productivity by calculating the Malmquist–Luenburger index and using spatial econometric models. It was found that market integration can promote the improvement of regional green total factor productivity. This positive effect is not only directly reflected in the region, it also indirectly promotes the growth of GTFP in nearby regions. In addition, market integration has shown significant positive effects on efficiency improvement and technological progress, and market integration has affected regional green total factor productivity through them. The above conclusions are of great significance for China to develop a green economy and promote high-quality economic transformation.
1. Introduction
In the 40 years of reform and opening up, the average annual growth rate of China’s economy has reached 9.4%, which is called the miracle of China’s economic growth by the world. Although the high-speed growth mode has provided a powerful boost to the increase of China’s economic aggregate, it has also produced a series of negative effects. These are mainly the unbalanced regional economic development, irrational economic structure, serious environmental pollution, and serious regional market segmentation. At the same time, the Chinese government promptly carried out supply-side structural reforms to promote the transformation and development of the Chinese economy from high-speed growth to high-quality. On the one hand, encouraging technological innovation, increasing the driving force of technological change on economic growth, and improving the efficiency of factor production. On the other hand, it has issued environmental laws and regulations, strengthened ecological environment protection, eliminated outdated production capacity, such as high energy consumption and high pollution, and developed a green economy. Therefore, the key to China’s economic transformation is to take a green economic development path that integrates efficiency and environmental protection. This is also the main research theme of this article, which is the green total factor productivity (GTFP)that represents the green economy. Although, what are the influence factors of green total factor productivity? How can we effectively improve regional green total factor productivity?
Through the analysis of existing research, it can be found that scholars’ research on GTFP mainly focuses on environmental regulation, industrial development, financial development, and foreign direct investment. Wu [1] believes that there is a U-shaped curve relationship between environmental regulations and GTFP. In the short term, environmental regulations have an inhibitory effect on the GTFP of enterprises, while in the long run, environmental regulations are conducive to improving GTFP [2,3]. In addition, regional political attributes will also cause environmental regulations to have different effects on GTFP [4]. From the perspective of industrial development, the agglomeration of regional manufacturing and producer services has a significant positive effect on the improvement of GTFP, and the effect is more obvious in regions with high economic openness. However, high industrial agglomeration does not always promote the increase of total factor productivity. The excessive gathering of industries turns the agglomeration effect into a crowding effect and causes environmental pollution [5]. At the same time, the upgrading of regional industrial structure, land use efficiency, and their interaction have a positive effect on GTFP. Among them, the upgrading of industrial structures has a more significant promotion effect on GTFP [6]. From the perspective of financial development, the development of financial intermediaries and financial markets has a significant positive effect on the improvement of total factor productivity and long-term economic growth. However, the relationship between financial development and total factor productivity may not be explained by a purely linear relationship. There is an approximate inverted U-shaped relationship between them [7,8]. At the same time, the effect of financial development on total factor productivity has a positive relationship with regional per capita carbon emissions. This effect is more obvious in developing countries. Therefore, to achieve the goal of green development, it is necessary to develop green finance to improve technology and promote the coordinated development of financial structure and total factor productivity [9]. Regarding the relationship between foreign direct investment and GTFP, experts have tested the positive relationship between foreign direct investment and total factor productivity [10,11]. It mainly affects total factor productivity through technology spillovers [12]. In addition, there are regional differences in the effect of foreign direct investment on GTFP. China’s foreign direct investment has promoted the improvement of GTFP in Anglo–French–American countries with higher institutional quality, but has little effect on the Middle East and North African countries [13].
On the whole, existing research has conducted a multi-dimensional discussion on GTFP, but we have found that environmental regulations, industrial development, financial development, foreign direct investment, and other factors can have a key prerequisite for affecting GTFP. That is, all participants in economic activities are in a relatively complete and effective market system, and if serious regional protection or market barriers occur, the impact of these factors on the total factor productivity of enterprises may be alienated [14]. Especially for China, although it has a huge domestic market. However, due to the long-term existence of the decentralization regulations of the central and local governments and excessive competition among local governments, the Chinese market is in a relatively dispersed state [15]. This form of market segmentation hinders domestic trade, increases homogeneous competition in regional industries, distorts resource allocation, and reduces enterprise production efficiency [16]. This is the core issue to be studied in this article. Do the market conditions affect the regional green productivity? Can market integration improve regional total factor productivity? If the answer is yes, what is the specific path? In addition, the current global economic development is at a low-speed growth stage. In order to protect the economic interests of domestic enterprises, countries around the world are trying to maintain the domestic market through tariffs and technical barriers. As a major trade export country, China has been greatly affected. Therefore, the Chinese government is trying to promote domestic factor market reforms to strengthen the linkages between domestic regional markets. It wants to use the internal circulation to make up for the economic losses caused by the unsmooth external circulation. This makes our research more realistic on the relationship between market integration and regional total factor productivity.
At present, research on regional GTFP directly based on the perspective of market integration is relatively scarce. Ke [17] constructed an indicator of trade barrier enhancement and studied the endogenous relationship between China’s market integration and regional economic growth. He believes that there is a virtuous circle between them. Sun [18] discussed the transmission mechanism of market segmentation on the environmental efficiency of the power industry from the perspective of technological innovation. He believed that market segmentation hindered technological innovation. This is a key factor affecting the environmental efficiency of the power industry. In addition, the restraining effect of market segmentation is more pronounced in regions with poor institutional quality. Bian [19] analyzed the impact of market segmentation on environmental pollution from the perspective of resource misallocation. The results show that market segmentation has a significant aggravating effect on environmental pollution, and the mismatch of labor and capital resources caused by market segmentation is an important factor in environmental pollution.
Therefore, market segmentation has a significant impact on the ecological environment and production efficiency. If we want to develop a green economy, we need to carefully consider the impact and transmission mechanism of market integration on GTFP. Based on this, we try to fill the research gap on the impact of market integration on regional GTFP. We use panel data from 30 provinces in China from 2008 to 2017 as a research sample to study the effect of market integration on China’s GTFP. At the same time, we believe that there may be regional spatial correlation, and we use a spatial econometric model to analyze the spatial effect of market integration on regional GTFP. Compared with the existing research results, our marginal contribution has the following three aspects: (1) This article has expanded the research on GTFP. The existing literature directly studies the impact of environmental regulations, industrial development, financial development, foreign direct investment, and other factors on GTFP. It ignores the conditional effects of the market and may lead to unscientific results [1,5,9,11]. Therefore, we focus on the effect of market integration on regional GTFP, which expands the research perspective of regional green total factor production and enriches the theory of green economic growth and sustainable development. It also helps to have a deeper understanding of the connotation of high-quality development of China’s economy, promote the reform of factor marketization, and build a complete and orderly internal circulation market system. (2) The existing literature focuses on the influencing factors of regional GTFP, but there is a research gap in the transmission mechanism [17,18]. We further studied the transmission mechanism of market integration to regional GTFP from the perspective of technological progress and efficiency improvement. This helps to clarify the specific path that market integration affects regional GTFP, and also provides inspiration for scientific decision-making. (3) Third, the existing literature focuses on the differences in the development of regional GTFP [4,5], and they ignore regional spatial correlations. We use a spatial econometric model to study the spatial effects of market integration on regional GTFP, which not only helps to identify the effect of market integration on regional GTFP, but also helps to understand the spatial spillover caused by market integration.
The rest of this article is organized as follows. Section 2 analyzes the theoretical mechanism of market integration affecting GTFP, and proposes research hypotheses. Section 3 introduces the establishment of empirical model, the selection of data, and indicators. Section 4 provides and discusses the empirical results. The last part is the conclusion and policy implications.
2. Theoretical Mechanism Analysis and Research Hypotheses
2.1. Empirical Facts
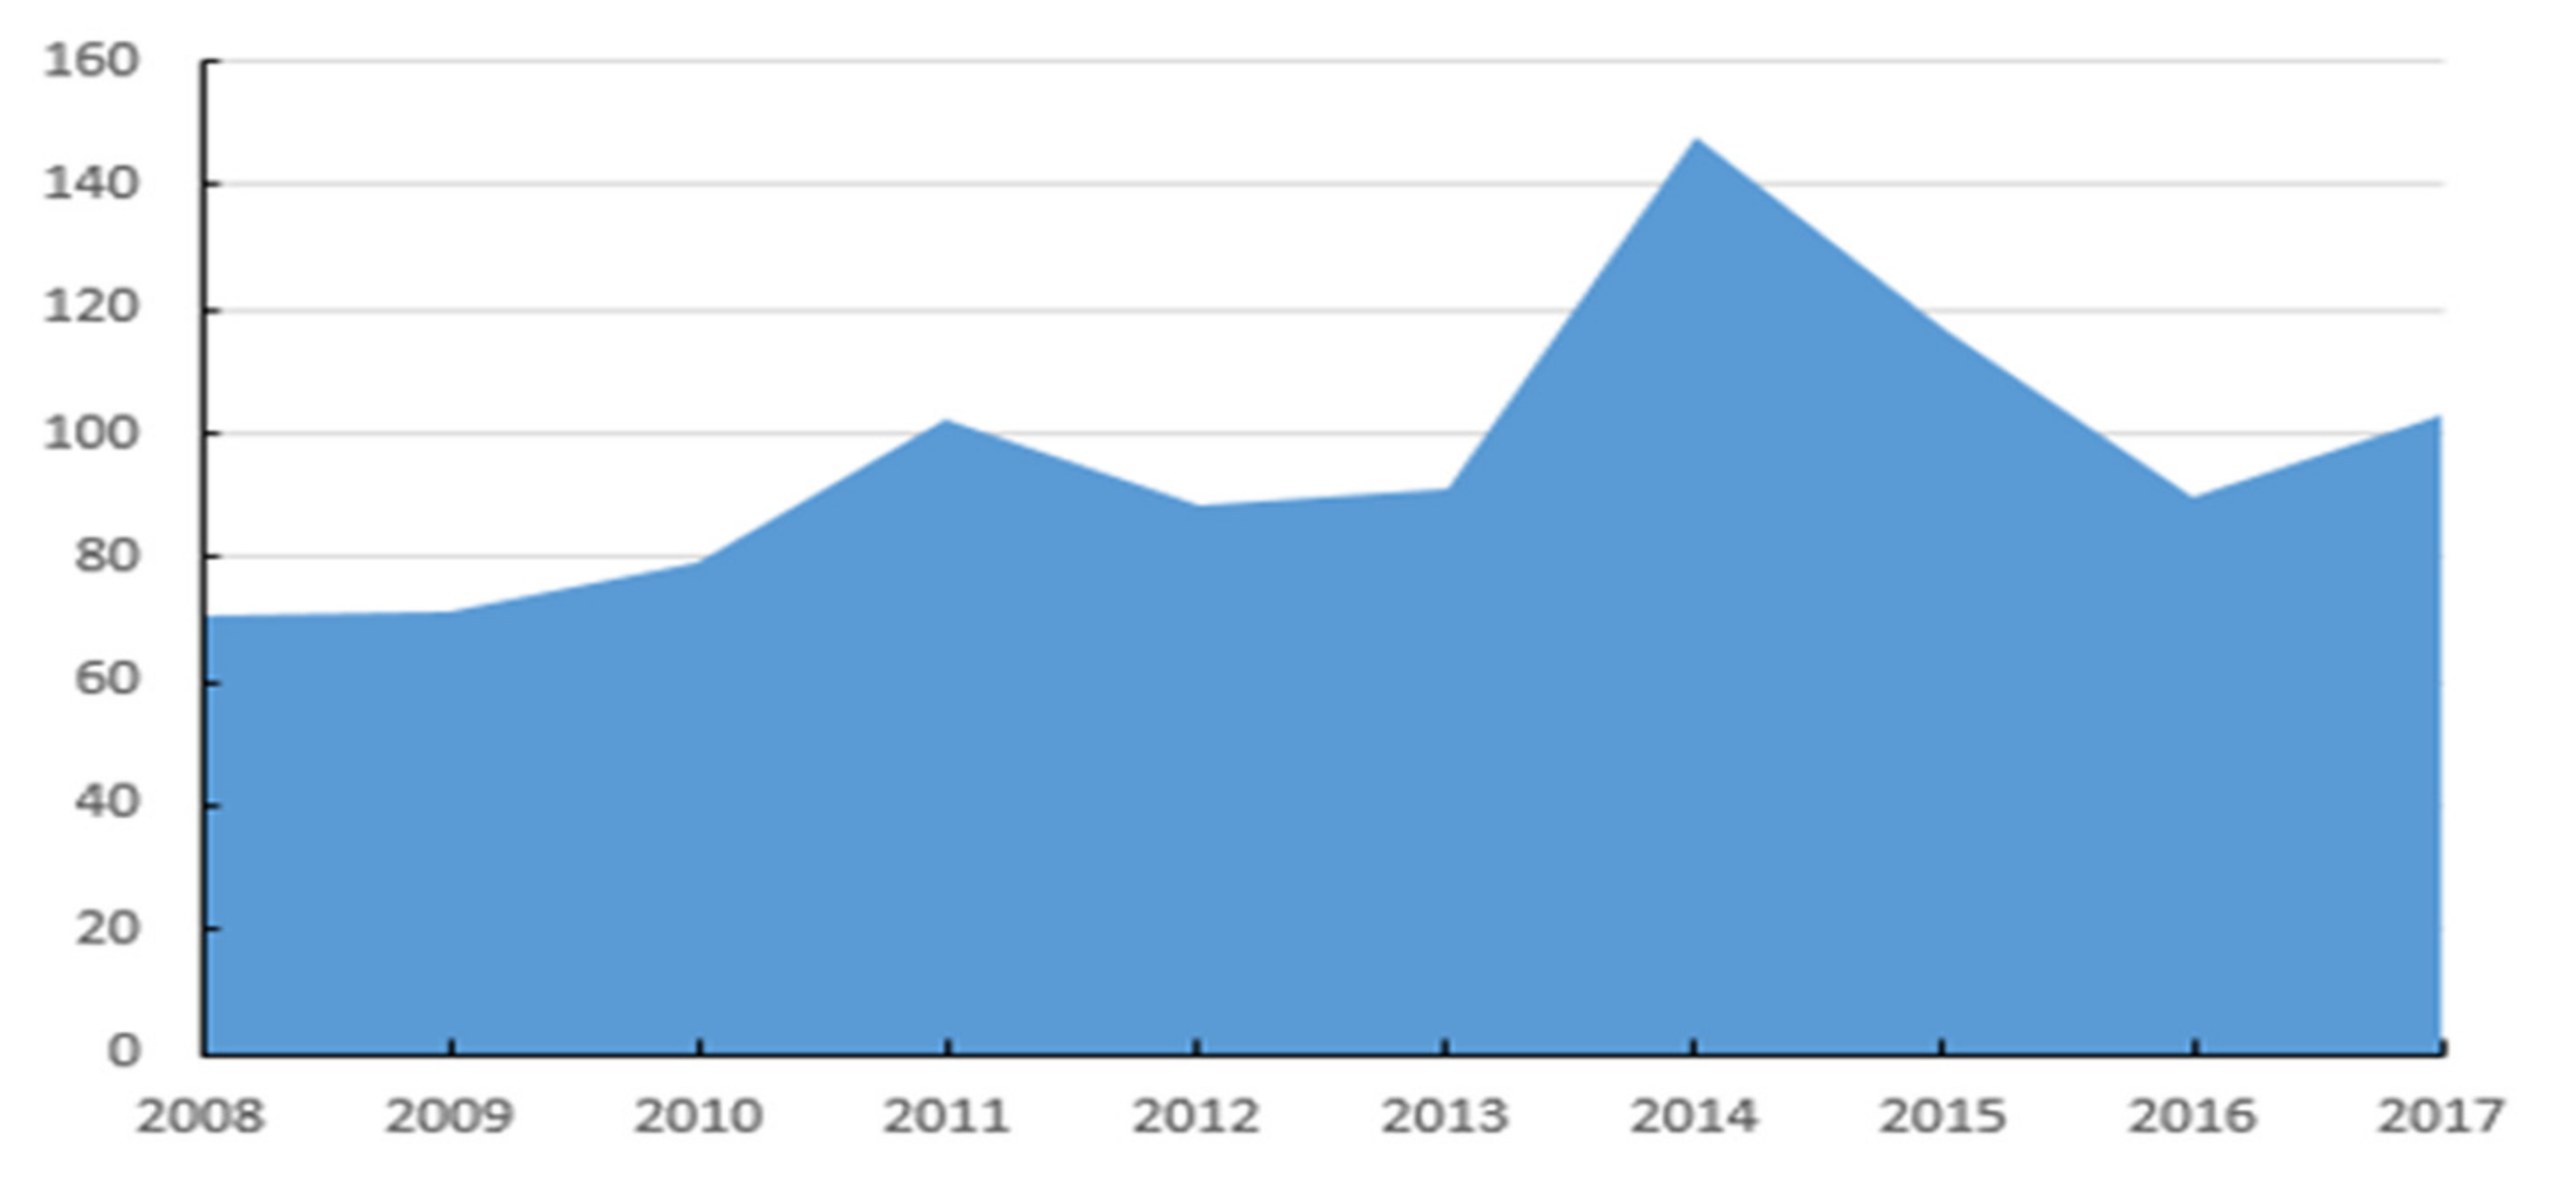
When the factors in the market can flow freely, it can be considered that the degree of market integration is better [20]. Market integration can strengthen the connection between different regional markets, give play to regional comparative advantages, realize economies of scale, and promote regional economic development. Since China implemented the reform and opening policy in 1978, the economic system has transformed from a planned economy model to a market economy model. Although China has achieved good results in economic development, there are still local protections and market segmentation. However, with the improvement of enterprise production efficiency and production capacity, enterprises need a larger market to support their development. Therefore, the Chinese government has also begun to pay attention to the issue of regional market integration, trying to break regional barriers through infrastructure investment and policy guidance, and promote the integrated development of regional markets. In 2008, the central government proposed the Yangtze River Delta Economic Zone composed of Shanghai, Jiangsu, Zhejiang, Anhui, and other provinces for the first time at the national strategic level. It also strongly supports the regional integration of the Beijing–Tianjin–Hebei Integration Economic Zone, the Pearl River Delta urban agglomeration, and the Guangdong–Hong Kong–Macao Greater Bay Area. The development of these integrated economic zones has increased the degree of integration of China’s domestic market. However, since these regions are concentrated in China’s economically developed regions, with the slowdown of China’s economic growth and the intensification of international trade frictions, the integration of some regions cannot drive the integration of markets in all regions of China. Therefore, since 2015, the Chinese government has begun to implement an internal loop market integration strategy, and gradually build integrated economic zones in the central and western regions to achieve market integration throughout the country. Figure 1 shows the degree of integration in the Chinese market from 2008 to 2017. It can be seen that market integration continued to grow before 2014, but the speed slowed down in 2015. This shows that improving the degree of regional market integration is an important issue that needs to be resolved in regional economic development.
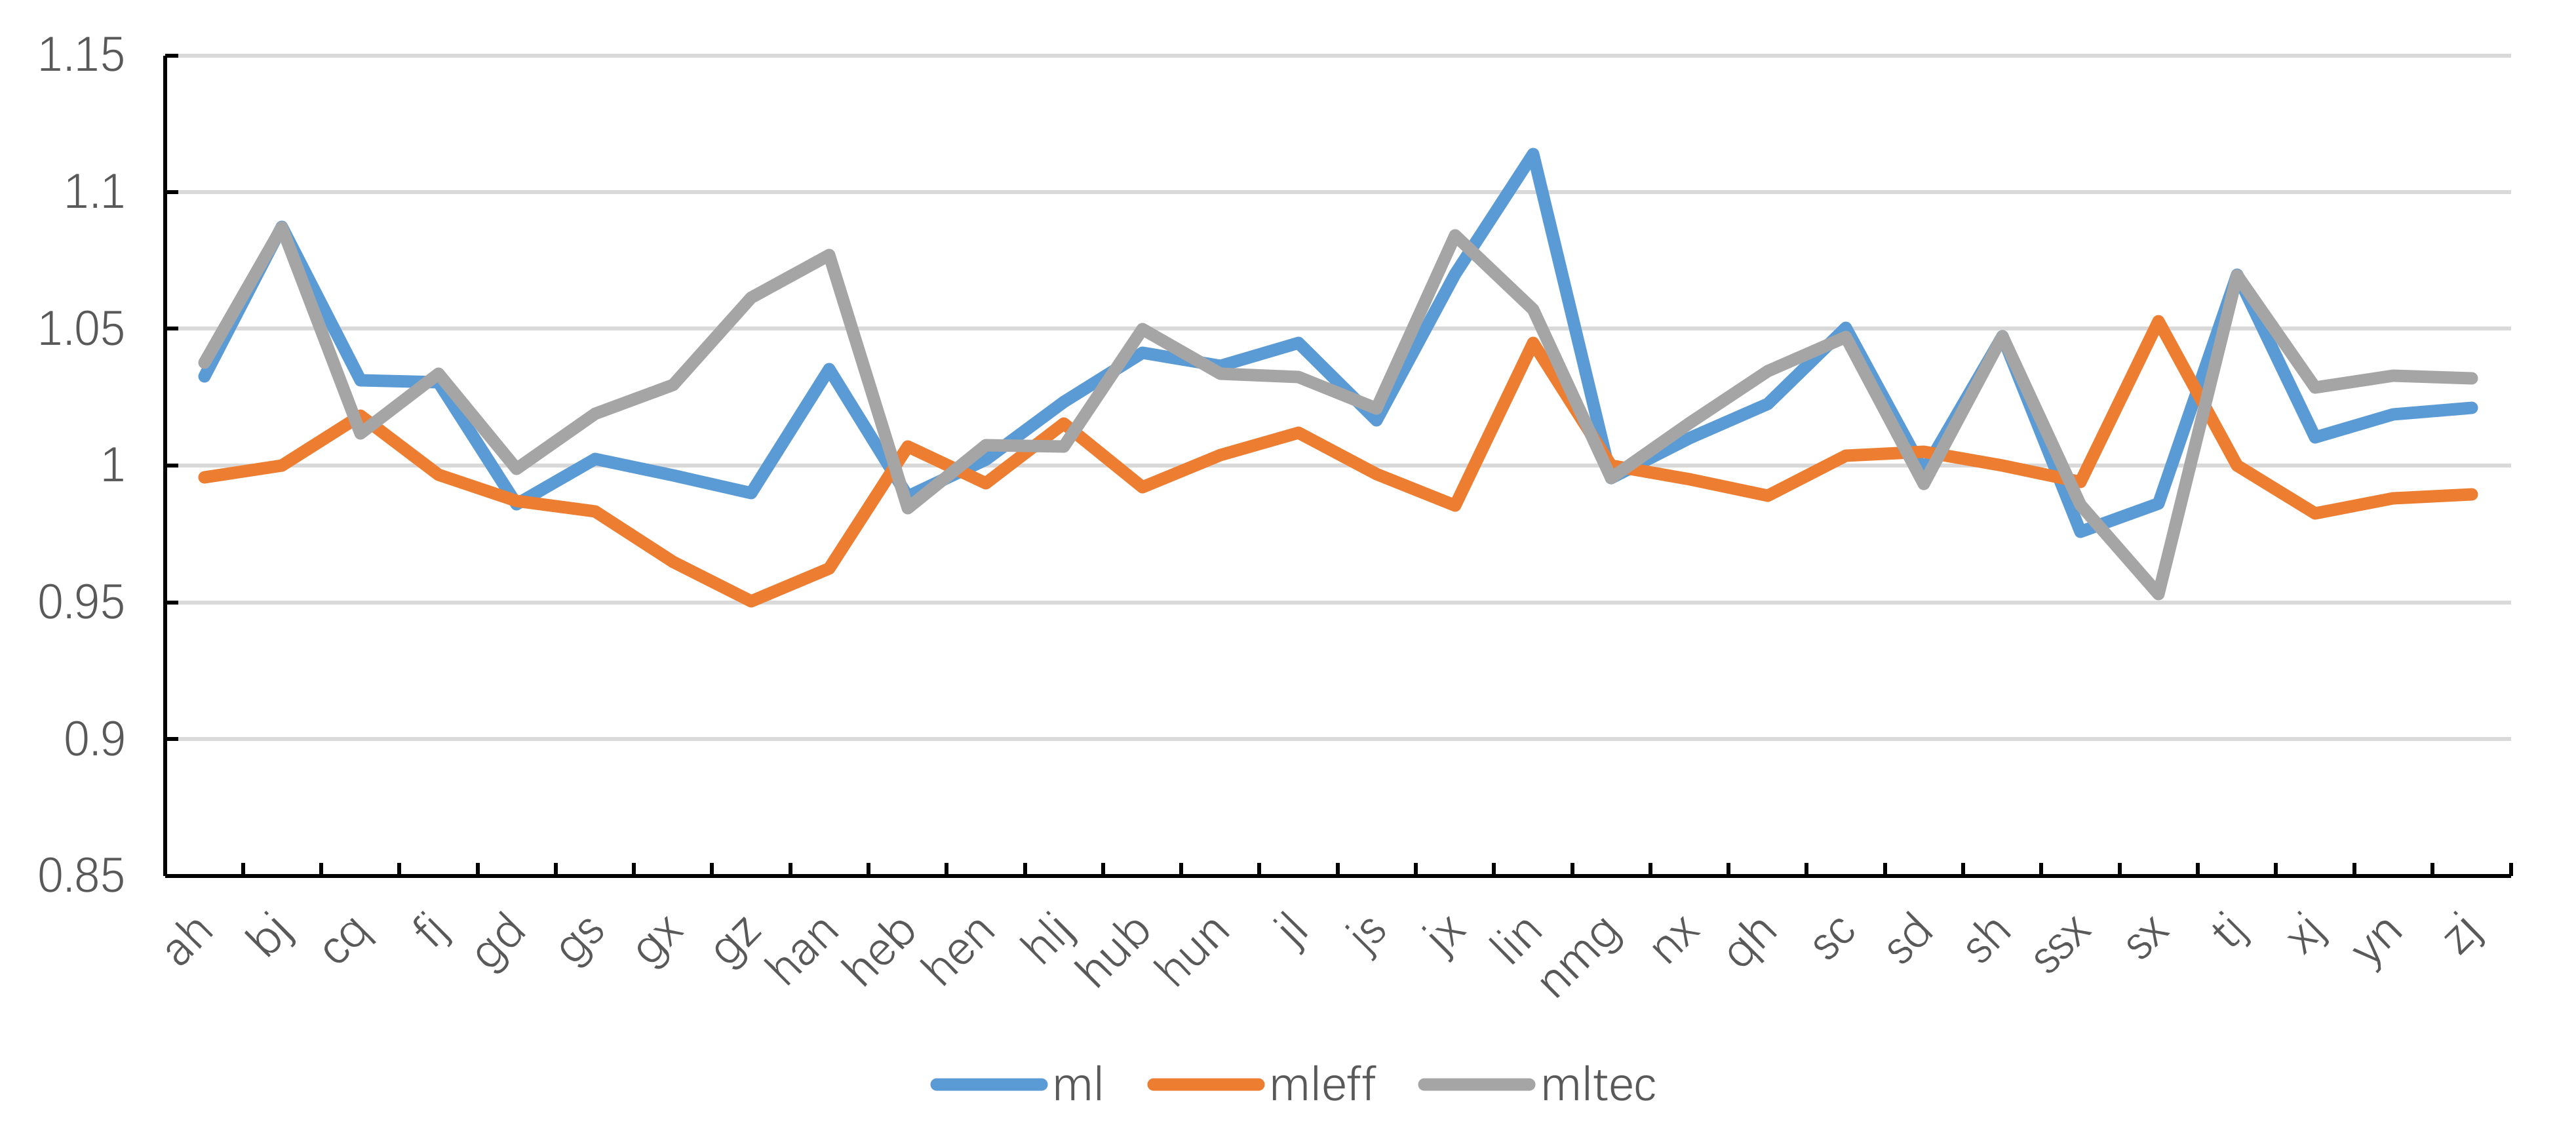
Regarding the development of GTFP in China. Figure 2 shows the actual situation of GTFP in 30 provinces in China from 2008 to 2017. The specific calculation method will be introduced in detail below. It can be seen that the regions with higher green total factor production are concentrated in the economically developed provinces in the east of China, such as Beijing, Guangdong, Shanghai, Zhejiang, Jiangsu, Tianjin, and other provinces. These areas are characterized by spatial agglomeration, which provides realistic evidence for analyzing the spatial correlation of GTFP. On the whole, the regional characteristics of market integration and GTFP provide a realistic basis for studying the relationship between market integration and regional green total factor production.
2.2. The Effect of Market Integration on Regional Green Total Factor Productivity
GTFP means to incorporate resource and environmental factors into the standard economic growth accounting framework. It is an important basis for judging the green economic growth of a country or region. To study the relationship between market integration and regional GTFP, it is necessary to consider the coordinated development of environmental and economic efficiency. First of all, the characteristics of the scale effect of the market show that a larger market size is an important condition for enterprises to achieve large-scale production, which can reduce the production and transaction costs of enterprises through market integration [21]. In addition, large markets are more conducive to the implementation of unified environmental regulations. When the interests of economic participants’ environmental rules are consistent, the implementation cost and effect of environmental protection policies will be better [22]. Second, market integration has a positive effect on enterprise technological innovation. On the one hand, it is conducive to increasing the enterprise’s enthusiasm for technological innovation and realizing the improvement of technical level and production efficiency. This is because in a segmented market, resources cannot flow freely between regions, and the use of production factors is inefficient. Companies can seek profits from low-cost factor inputs and rental income instead of investing in R&D [23]. On the other hand, market integration is conducive to eliminating high-energy-consuming and high-polluting enterprises and increasing the utilization rate of green technologies and green energy [24]. Finally, from the perspective of competition and cooperation, market integration reduces the market barriers formed by local government protection and affects free competition in the regional market. Lack of competition will hinder the improvement of production efficiency [25]. However, it needs to be pointed out that the competition of market integration may also expand the control of the market by oligarchs. This will compress the living space of small and medium-sized enterprises and exacerbate the imbalance of regional factor production efficiency. However, with the continuous improvement of market integration, this gap will gradually narrow. In addition, market integration provides space for the free flow of production factors. This is conducive to the cross-regional cooperation of enterprises and the complementarity of production factors [26]. At the same time, this may also promote cross-industry operations of enterprises and bring new vitality to the development of regional green economy. However, the transformation and development of the green economy will take some time. In the early stage of enterprise transformation, the development and application of new technologies and new equipment may increase the production cost of the enterprise. If companies cannot meet environmental protection standards, they can only produce low-value-added products, which will lead to a decline in regional production efficiency [27]. Therefore, we propose the following research hypothesis:
Hypothesis 1.
Market integration will actively promote the improvement of regional green total factor productivity.
2.3. The Influence Path of Market Integration on Regional Green Total Factor Productivity
Based on Malmquist theory, GTFP can be decomposed into efficiency improvement effect and technological progress effect. Therefore, we need to analyze the transmission path around the efficiency improvement effect and the technological progress effect. First of all, we analyze the connotation of efficiency improvement effects and technological progress effects. Efficiency improvement means the actual production point moves to the production frontier, and technological progress reflects the overall forward movement of the production frontier. From an economic point of view, the improvement of efficiency is mainly achieved through institutional optimization, management reform, improvement of scale efficiency, and improvement of resource allocation efficiency. Technological progress is manifested in the use of more advanced green technologies to optimize production processes with fixed factor inputs. It mainly uses new inventions to increase GTFP.
As far as the relationship between market integration and efficiency improvement is concerned, production factors are the foundation that affects GTFP. The market environment, technology, and management methods need to promote the growth of total factor productivity by increasing the productivity of input factors [19]. Market integration provides a broader space for the trading of production factors. On the one hand, the free flow of production factors in the market provides a basic guarantee for enterprise production. On the other hand, the regulation of the market can improve the degree of matching between supply and demand of production factors [28,29]. At the same time, market integration is conducive to the formation of management standards and production standards, which can reduce internal and external transaction costs of enterprises and improve the efficiency of utilization of production factors [30]. In addition, market integration can help companies more accurately identify consumer needs, which is conducive to achieving refined production, reducing business risks, and improving production efficiency [31]. Therefore, when factor distribution and production efficiency are more reasonable, the company’s total factor production efficiency is higher.
In terms of the relationship between market integration and the effects of technological progress, competition and cooperation in market integration will increase the level of technological innovation and accelerate knowledge spillover to promote the application of new technologies. First, market integration breaks local protection barriers and strengthens regional connections. In order to gain a competitive advantage in the market, companies will take the initiative to innovate and apply green technologies [32,33]. Secondly, market integration provides a broad space for the circulation of information between enterprises, which strengthens the connection of different regions and industries, reduces the cost of information transmission between enterprises, and promotes knowledge and technology spillovers within the region [34]. In addition, large markets have brought more sales space for enterprises. As the company’s sales profits continue to increase, the company will increase R&D investment to promote the innovative application of green technology [35]. This kind of green circular technological advancement allows companies to maintain a high level of green production efficiency. Therefore, we propose the following research hypothesis:
Hypothesis 2.
Market integration affects green total factor productivity through efficiency improvement and technological progress.
3. Model, Data, and Variables
3.1. Economic Model
In the existing literature, Miller and Upadhyay [36] established an endogenous total factor productivity model to test the effect of opening up, trade direction, and human capital on total factor productivity. The economic model of this article mainly draws on their ideas and expands it. The production function used in this article is as follows:
where is the GDP, is the opening to the outside world, is the average accumulation level of human capital, is the amount of physical capital input, and is the amount of labor input. represents the Hicks-neutral efficiency function of technological progress, which can make the entire production function move outward (increasing returns to scale) or inward (decreasing returns to scale) exogenously. Economic opening mainly acts on output growth through technology spillover effects, which is reflected in term of Equation (1).
Drawing lessons from Hulten [37], we assume that the Hicks efficiency and its components in Equation (1) are multiple combinations, which can get the following results.
Then the expression of total factor productivity is Equation (3).
represents total factor productivity. Among them, is the region, is the year, is the initial production efficiency level, is the exogenous productivity change, is the influence parameter of external economic opening, and is the influence parameter of human capital.
We mainly study the effect of market integration on GTFP. Therefore, we expand on the basis of (2) and introduce the influence of regional market integration on the technical level, and obtain Equation (4).
where is the GTFP that takes into account the undesired output, is the market integration index, represents the influence parameter of market integration. Take the natural logarithm of Equation (4) to get the basic theoretical model of this article.
Therefore, combined with the research theme of this article, we take Equation (6) as the basic measurement model for studying market integration and green total factor productivity.
In addition, we consider the spatial correlation of GTFP among regions. We introduced the spatial weight matrix into the basic model (6), and constructed a spatial econometric model. Among them, the spatial correlation matrix mainly measures the spatial relationship between regions. Geographical adjacency is the most basic spatial relationship. Geographically adjacent regions have more similarities in economic and social development and other aspects, and their ties are closer. We construct a binary space weight matrix based on geographic adjacency relations according to whether the regions are adjacent (adjacent = 1, non-adjacent = 0). Based on the consideration of robustness, we used geographic distance weights to re-measure this in the subsequent robustness test. In addition, taking into account the differences in different spatial effects, we established a spatial lag model (SLM) and a spatial error model (SEM). Among them, the spatial lag model (SLM) is mainly used to study the spillover effects between different variables in the region. The spatial error model (SEM) introduces the error term into the spatial measurement model to examine the influence of regional random errors on variables. Equations (7) and (8) are SLM and SEM.
where represents the control variable of this article, represents the spatial weight matrix, represents the spatial autoregressive coefficient, and represents the error term.
3.2. Data Description
The sample for our empirical study was panel data from 30 provinces in China from 2008 to 2017 (due to missing data, the Tibet Autonomous Region, Chinese Taipei, Hong Kong, and Macau are not included). This is mainly because after the 2008 world economic crisis, the Chinese government’s economic growth method centered on growth rate cannot fully adapt to current social needs. Therefore, focusing on the quality and efficiency of economic growth and environmental and ecological protection has become the focus of China’s current economic transformation. In addition, although China is a political system under the unified leadership of the central government, local governments also have certain autonomy in areas such as regional economic development, market construction, and environmental governance. Therefore, our analysis of inter-provincial market integration and development is more representative. Finally, all the original data in this article came from China Statistical Yearbook, China Regional Economic Statistical Yearbook, etc.
3.3. Variables Selection
3.3.1. Green Total Factor Productivity
The neoclassical economic growth accounting model regards total factor productivity as one of the sources of economic growth. Existing research uses the Malmquist productivity index method of data envelopment analysis to measure total factor productivity. This makes up for the defect that technical inefficiency is not considered in the neoclassical economic growth accounting model. However, as environmental problems become more and more prominent, accounting mechanisms that only consider the expected output in the process of economic growth can no longer fully explain economic facts. Therefore, considering the expected output and the undesired output at the same time, the total factor productivity of the economy can be more accurately measured [38]. On this basis, we incorporated the expected output and undesired output into the productivity framework, and constructed the Malmquist–Luenburger (ML) index to measure GTFP.
As we are mainly investigating the green total factor productivity of China’s provinces and regions. We regarded each province as a Decision Making Unit (DMU), which is represented by , and the frontier of environmental production is a production possibility boundary that includes energy element inputs and undesired outputs. Assuming that the factor input of each is , it contains categories. That is . Output includes expected output and undesired output. The expected output contains species, which can be expressed as, and the undesired output contains species, which can be expressed as. Then the production possibility set of the period area can be expressed as Equation (9):
As we are mainly investigating the GTFP of China’s provinces and regions. We regard each province as a Decision Making Unit (DMU), which is represented by k, and the frontier of environmental production is a production possibility boundary that includes energy element inputs and undesired outputs. We assume that the factor input of each is . It contains categories, which can be expressed as . The output aspect includes expected output and undesired output. The expected output contains types, which can be expressed as . Undesired output contains types, which can be expressed as . Then the production possibility set of period and region can be expressed as Equation (9):
In addition, if it is assumed that the production possibility set is a bounded set and a closed set. It must also meet three key conditions. The first is to freely dispose of expected output and input. The second is that undesired output meets “weak disposability”. The third is the “zero combination” axiom. We used the data envelopment analysis method (DEA) to model the production possibility set of Equation (9). It should be noted that DEA is a method that uses the DEA model to obtain the corresponding production frontier based on element data to evaluate the relative effectiveness of a DMU with multiple inputs and multiple outputs. It does not need to specify the input-output production function, and can be used to evaluate the efficiency of DMU with more complex production relations. In addition, it does not need to set the weight of input and output in advance, which reduces the influence of human subjective factors.
where the inequality constraints of expected output and input element indicate that they are freely disposable. The equality constraint of the undesired output shows that it satisfies the “weak disposability”. represents the weight of each cross-sectional observation of the model. When both and are satisfied, it means that the return to scale of production technology is variable. Only satisfying means that the return to scale remains unchanged.
On the basis of the production possibility boundary, we can use the directional distance function (DDF) to calculate the distance between each production decision-making unit and the production possibility boundary, which is the relative efficiency [39]. DDF is derived by improving Shepard’s [40] output distance function, and its specific form is as follows.
In Equation (11), is the direction vector. It reflects people’s different utility preferences for the choice between expected output and undesired output . Assuming the directional variable , when the return to scale is variable, linear programming can be performed as follows.
On the basis of DDF, the ML index from to can be defined, as shown in Equation (13).
In addition, the ML index can be decomposed into two parts: Efficiency Improvement Index (MLEFF) and Technology Progress Index (MLTEC).
If the ML index is greater than 1, it means that from to , the level of total factor productivity considering undesired output has been increased, otherwise it is reduced (less than 1) or unchanged (equal to 1). Furthermore, because the ML index using data envelopment analysis can be decomposed into efficiency improvement effect (MLEFF) and technological progress effect (MLTEC). The meaning is that if the value of MLEFF is greater than 1, it means that the efficiency of undesired output has been improved from period to period . The actual production point of the decision-making unit from period to period moves to the frontier of environmental production, otherwise it is reduced (less than 1) or unchanged (equal to 1). Similarly, if the value of MLTEC is greater than 1, it indicates that the technological progress of undesired output has been improved, and the frontier of environmental production has moved forward, otherwise it is reduced (less than 1) or unchanged (equal to 1).
In the actual measurement process, we need to set the corresponding input variables and output variables in advance. In terms of input variables, it mainly includes labor input, capital input, and energy factor input. This article uses the number of employees in cities and towns at the end of the year in each province in China from 2008 to 2017 to represent labor input, and capital input is represented by annual fixed asset investment, and is adjusted to the form of stock using the perpetual inventory method. Energy input is the total energy consumption of each province. As for output variables, it mainly includes expected output and undesired output. Among them, the expected output mainly uses the regional GDP of each province from 2008 to 2017. Based on the current situation of China’s environmental pollution problems, this paper selects industrial and domestic sulfur dioxide (SO2) emissions as undesired output.
3.3.2. Market Integration
Market integration is an important indicator for judging the integration or segmentation of regional markets. Its measurement methods mainly include production method, price method, trade method, business cycle method, and questionnaire survey method. Among them, because the price method can more directly and comprehensively display market transaction information, it has been widely used in research. We used the “price index method” to calculate the market integration index. The price method is mainly based on the relative difference in commodity prices between regions to measure market segmentation. If the coefficient of variation and boundary effect of commodity prices among regions are reduced, or there is a statistical convergence of commodity prices, it indicates that the degree of market integration between regions has increased. The relative price method uses 3-dimensional () panel data, where is the year, is the region, and is the commodity. Taking into account the completeness and availability of data, our sample data are the commodity data of 30 provinces in China from 2008 to 2017. The selected commodities include food, cigarettes and alcohol, clothing, household equipment and supplies, medical and health care supplies, transportation and communication tools, entertainment, education and cultural supplies, and housing-related products and services.
As the retail price index of commodities selected in the article is the chain data of the previous period as the base period. Therefore, the set relative price form is the first-order difference form of relative price. As shown in Equation (17).
Among them, represents the first-order difference of relative prices, and represent the retail price index of -type commodities in period and period in area, and represent the first-order difference of -type commodities in period and period in area. The retail price index of commodities in period . In order to eliminate the influence of the difference form sign on the relative price variance, we choose the absolute value form of the first-order difference of the relative price. Calculated by Equation (17), we can obtain the absolute value of the first-order difference of 34,800 relative prices of 8 types of commodities in 435 pairs of provinces from 2008 to 2017.
In order to eliminate price changes that have nothing to do with the differences in the market environment between regions, we refer to the approach of Parsley and Wei [41] and use the method of removing the mean to deal with relative prices. Assuming , represents the price changes caused by the nature of the -th commodity, and represents the price fluctuations caused by the different market environments between regions and . In order to eliminate the fixed effect , under the condition of a certain period of and commodity type , we take the average of to get , and then use Equation (18) to get the relative price change after removing the average. Based on , we can judge market price fluctuations in different provinces, where the larger the standard deviation (), the more severe the market segmentation. Then we merge the relative price variance () of 435 pairs of provinces in 30 provinces to get the market segmentation index . Finally, the market integration index of each region is obtained by Equation (19).
3.3.3. Control Variables
In this research theme, other control variables that may affect GTFP include economic level, industrial structure, degree of openness, urbanization, human capital, and environmental regulation. (1) Economic level (eco) we selected the per capita GDP of the sample provinces from 2008 to 2017 as the indicator. (2) Economic structure (str) we chose the ratio of the output value of the secondary industry to GDP to express this. (3) The level of openness (open) was expressed by the total investment of foreign-invested enterprises in each province. (4) The level of urbanization (urb) was expressed by the ratio of the urban population to the total population of a province. (5) The level of human capital (human) was based on the average years of education of the population in the region. (6) Environmental regulation level (env): the investment in environmental funds can more directly reflect the government’s environmental regulation strength and willingness. Therefore, we used the investment in industrial pollution control in various provinces as a measure. Table 1 lists the descriptive statistical results of all the above variables.
4. Results and Discussion
4.1. Identification and Verification of Spatial Measurement Models
4.1.1. Spatial Correlation Analysis
Before using the spatial measurement model, we need to verify whether there is a spatial correlation between variables. If there is a spatial correlation in the test results, it is appropriate to use a spatial measurement model. If it does not exist, a spatial measurement model cannot be used. We calculate the Moran’s I to test whether there is a spatial correlation between regional green total factor productivity. The calculation formula of Moran’s I is as Equation (20).
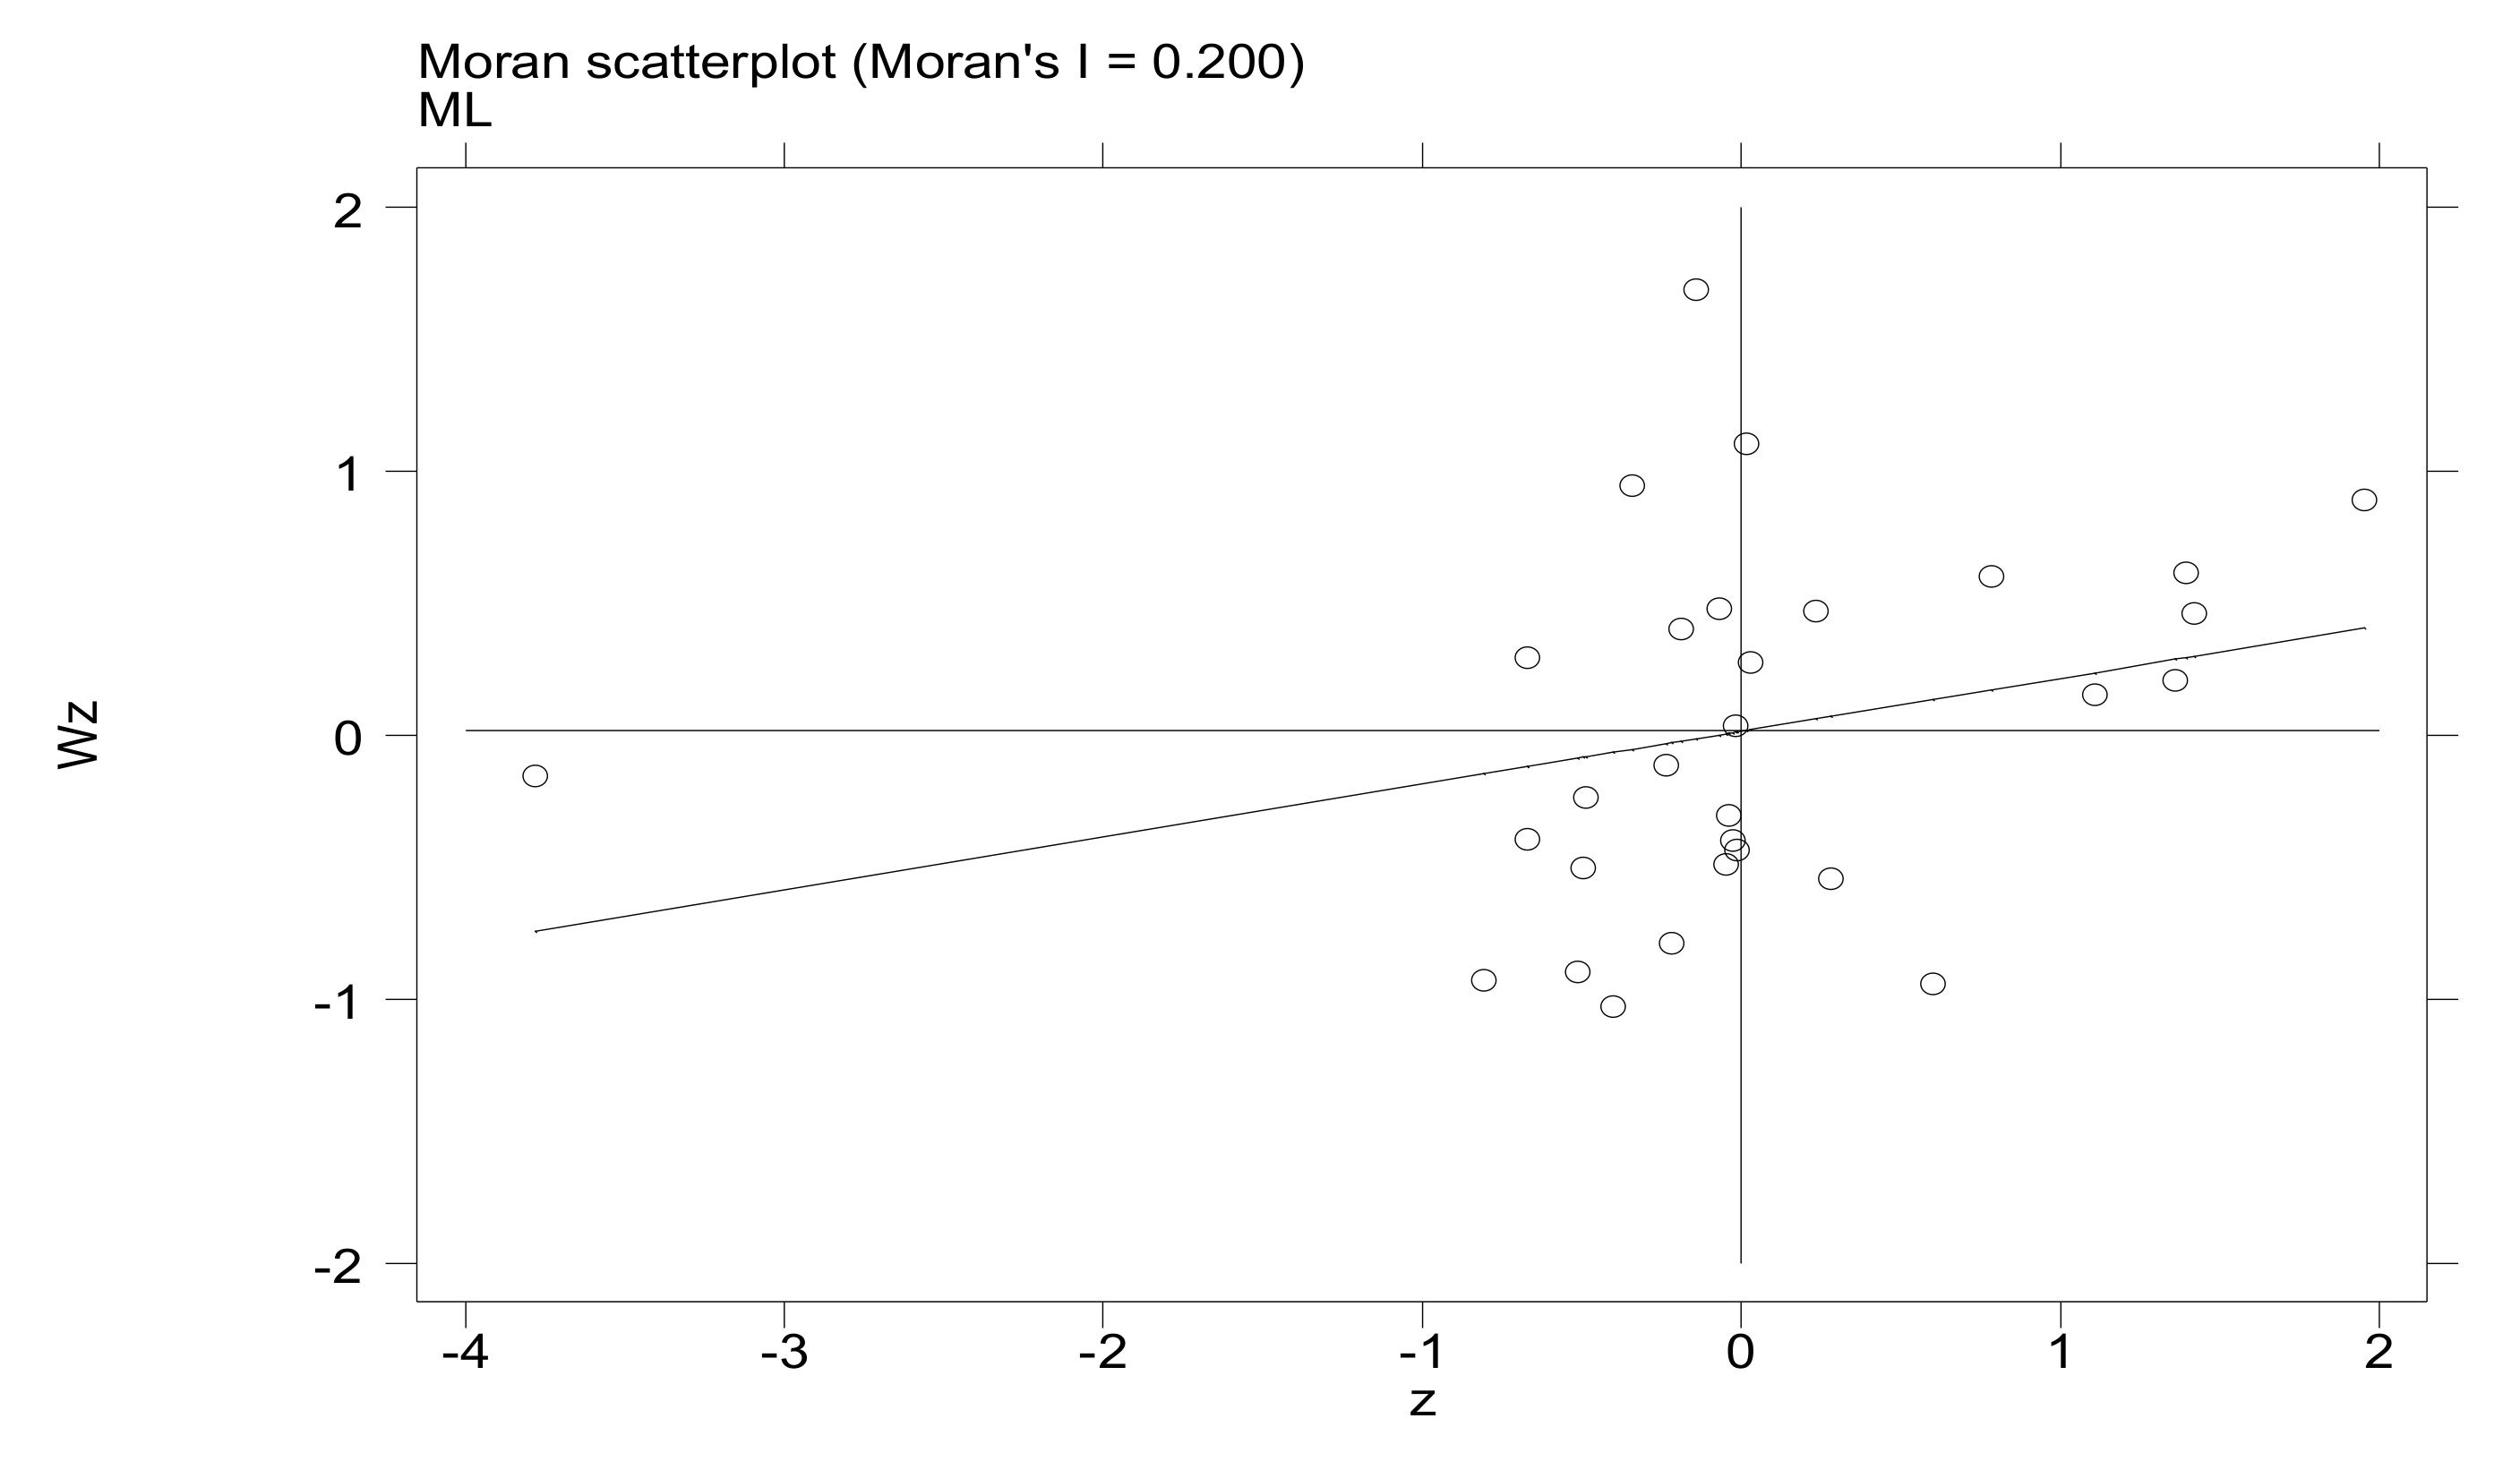
The results in Table 2 show that Moran’s I in all provinces of China passed the significance test from 2008 to 2017. They are significant at 1%, 5%, and 10% confidence levels. Moran’s I is between 0.149 and 0.233, which indicates that there is a positive spatial autocorrelation of GTFP during the sample period. The growth of GTFP in this region will stimulate the growth of GTFP in neighboring regions. In addition, we also reported a scatter plot of GTFP (Figure 3). We find that more provinces fall into the first and third quadrants, which also shows that there is a positive spatial autocorrelation of GTFP during the sample period. Therefore, it is reasonable to choose the spatial measurement model in this article.
4.1.2. Spatial Econometric Model Selection
After confirming the spatial correlation of variables, we need to further select a suitable spatial econometric model. Therefore, we test the rationality of the spatial econometric model. Firstly, we refer to the method of LeSage and Pace [42], based on the OLS regression of the non-spatial panel model, and test the rationality of the SLM model and the SEM model by constructing a Lagrangian multiplier test (LM) of residuals. If they have the same significance level, the form of the model needs to be determined according to the significance of the robust LM statistic. Among them, LM (error) and robustness LM (error) test the spatial correlation of residuals. LM (lag) and robustness LM (lag) test the spatial lag of residuals [43]. Table 3 shows the test results of LM and robust LM. The value of LM (lag) 28.541 is greater than the value of LM (error) 5.698, and the value of robustness LM (lag) 96.753 is greater than the value of robustness LM (error) 69.472. This shows that SLM’s LM (lag) and robustness LM (lag) are better than SEM, and it is more appropriate for us to adopt the SLM model. In addition, in order to clarify the time and space fixed effects of the spatial model, we also conducted a likelihood ratio LR test. The results show that the LR test based on the spatio-temporal fixed-effects model’s joint significance likelihood ratio rejects the null hypothesis that the combined temporal and spatial fixed effects are not significant at 1%. This indicates that the model should include time and space fixed effects.
4.2. The Effect of Market Integration on GTFP
This article uses Stata13 to estimate the model. In order to facilitate comparison, we report the regression results of the non-spatial panel model (OLS) and the spatial panel model (SLM, SEM). The results are shown in Table 4.
As shown in Table 4, the market integration (mi) coefficient in the OLS regression results is 0.337, which indicates that market integration has a positive effect on GTFP. However, it should be noted that compared with the regression results of the spatial econometric model, its significance is lower and the results of the control variables are not strong. This may be due to the deviation of the results caused by OLS ignoring the spatial effect. At the same time, the spatial correlation coefficients of SEM and SLM are 0.317 and 0.313, which pass the test at the 1% level. This shows that China’s GTFP has a significant spatial correlation. Therefore, the spatial econometric model is better than the non-spatial model. In addition, since the above verified that the SLM model is more suitable for our research, we will mainly discuss the regression results of the SLM model. First of all, in the SLM regression results, the market integration (mi) coefficients were 0.070, which passed the test at the 5% level. This shows that market integration has a positive effect on the improvement of green innovation efficiency. That is, the higher the degree of market integration, the higher the level of regional GTFP, and market integration improves the level of regional GTFP. This is consistent with Hypothesis 1.
For the results of the control variables, we found that the coefficients of the eco, open, env, and human variables are positive and have passed the significance test, which indicates that the economic development of China’s provinces, the increase in the degree of openness to the outside world, the investment in environmental governance, and the improvement of human capital will increase regional GTFP. At the same time, the coefficients of str and urb variables are negative, which also passed the significance test. This shows that the current regional economic structure and rapid urbanization have caused environmental pollution and affected the regional GTFP.
In order to deeply analyze the spatial effects of GTFP, we use partial differential methods to decompose the spatial effects into direct effects, indirect effects, and total effects. The results are shown in Table 5.
The results in Table 5 show that the direct, indirect and total effect coefficients of market integration on GTFP are 0.063, 0.041 and 0.104, which are all significant at the 5% level. This shows that market integration has significantly promoted the growth of GTFP in this region and surrounding areas. In terms of direct effects, with the improvement of market integration, the level of GTFP in the region will be improved. From the perspective of indirect effects, the positive effect of market integration on the region’s GTFP will spill over and drive the growth of GTFP in neighboring regions. We believe that the main reason for this is that market integration is conducive to the use of scale effects in the process of regional economic growth. With the reduction of market segmentation, the application of green technology and green production capacity will become wider, which will improve the green total factor production of the region and surrounding regions [19]. At the same time, a large-scale market is more conducive to the implementation of unified environmental regulations, which has positive significance for regional environmental governance [22]. In addition, market integration provides companies with a broader market. In order to gain market competitive advantages, competition in adjacent regions will become more intense, and a good market competition environment will promote regional production efficiency [24]. Therefore, market integration has a promoting effect on regional GTFP. It will not only actively promote the improvement of regional GTFP, but also have a positive spatial effect on neighboring regions.
4.3. Transmission Mechanism Test
GTFP based on the ML index can be decomposed into efficiency improvement effects and technological progress effects, which also constitute the main source of GTFP growth. We will examine the effect of market integration on technological progress and efficiency improvement effects, in order to examine the transmission path of market integration affecting regional GTFP. If market integration significantly affects efficiency improvement or technological progress, it can be considered that market integration has an effect on GTFP through efficiency improvement effects or technological progress effects. Table 6 reports the statistical results of the direct, indirect, and total effects of market integration on efficiency improvements and technological progress.
The results in Table 6 show that in the transmission path test results, the efficiency improvement (MLEFF) results show that the direct, indirect and total effects of market integration affecting efficiency improvement are significantly positive. This shows that market integration promotes the efficiency improvement effect. It also shows that market integration can generate market scale effects, improve the efficiency of resource optimization, realize efficiency improvement effects, and ultimately increase regional GTFP. For MLTEC, the coefficients of market integration in direct, indirect, and total effects are also significantly positive. This means that market integration has also promoted the effect of technological progress, which is conducive to increasing the enthusiasm of enterprises in the innovative application of green technology, eliminating outdated production capacity with high energy consumption and high pollution, and ultimately increasing regional GTFP. Therefore, the influence path of market integration on the improvement of GTFP is mainly through efficiency improvement and technological progress, which is consistent with Hypothesis 2.
4.4. Robustness Test
In the benchmark regression model, we use the spatial correlation matrix in the form of geographic adjacency to describe the relationship between regions. However, geographic adjacency may not fully cover the spatial relationship between regions. For example, regions that are close in geographic distance but are not adjacent to each other may also have certain relationships. Therefore, we refer to the research of Paas and Schlitte [44] to use a spatial distance weight matrix to replace the spatial adjacent weight matrix to redefine the spatial correlation between two regions. Among them, the form of the spatial distance weight matrix is , if , then , and otherwise it is 0. represents the spherical geographic distance between regions and calculated according to the latitude and longitude data of prefecture-level cities provided by the National Basic Geographic Information System. Table 7 lists the regression results based on the spatial distance weight matrix.
The results in Table 7 show that the direct, indirect and total effects of market integration on GTFP are all significantly positive after adopting the spatial weight matrix in the form of geographic distance. This means that market integration is conducive to the improvement of regional GTFP. This also shows that the above research results are reliable.
5. Conclusions and Policy Implications
Based on the panel data of 30 provinces in China from 2008 to 2017, this paper studied the effect of market integration on regional GTFP and the path mechanism. Taking into account the effect of spatial correlation, we used the spatial econometric model to conduct an empirical study on the effect of market integration on regional GTFP. The research conclusions of this paper have two main points.
First, market integration can promote the improvement of regional GTFP. The direct, indirect, and total effects of market integration affecting GTFP are all significantly positive. This means that the integrated development of the market not only improves the GTFP of the region, but also promotes the improvement of the GTFP of the neighboring regions.
Second, market integration affects GTFP through two paths: efficiency improvement and technological progress. In terms of the specific results of the transmission path, market integration has a significant positive effect on efficiency improvement and technological progress. This shows that market integration not only improves the efficiency of resource optimization allocation and promotes efficiency improvement, but also helps eliminate outdated production capacity with high energy consumption and high pollution, and enhances the enthusiasm of enterprises to innovate and apply green technologies to promote technological progress. They will eventually increase regional GTFP.
The policy implications of this article mainly has the following three aspects.
First of all, as the main direction of the high-quality transformation and development of China’s economy, the green economy needs to rely on the positive effects of market integration. On the one hand, it is necessary to improve the degree of market integration and build an internal circulation system in the domestic market. Combining regional production efficiency and national environmental protection strategies to achieve a “win-win” situation of factor productivity growth and environmental quality improvement, and ultimately achieve high-quality development of the national economy. On the other hand, it is necessary to break regional protection barriers, improve the degree of market integration, realize the market-oriented flow of factors, and give full play to the basic role of the market in resource allocation, so as to provide enterprises with a good market competition environment, eventually promoting the development of the regional industrial structure to green and advanced transformation.
Secondly, efficiency improvement and technological progress are important transmission mechanisms that affect market integration to GTFP. Therefore, it is necessary to optimize the production process, eliminate outdated production capacity with high pollution and high energy consumption, and improve the allocation efficiency and production efficiency of traditional production factors. In addition, it is necessary to accelerate the development and application of green technologies. The government must establish an external environment and policy system that supports enterprises’ green technological innovation. Enterprises should base themselves on independent innovation, focus on green technology innovation, strengthen green technology research and development, and form a competitive advantage.
Finally, local governments also need to establish an economic incentive and supervision mechanism for environmental protection. On the one hand, it is necessary to increase penalties for economic actions that damage the ecological environment and evade environmental protection responsibilities. On the other hand, it is necessary to strengthen policy support, stimulate the enthusiasm of enterprises for green innovation through preferential fiscal and taxation policies, and guide enterprises to take a path of circular economy, eco-friendly economy and green economy.
Author Contributions
S.H.: model analyses, data curation, writing—original draft. L.S.: writing—review and editing, supervision, framework. Please turn to the CRediT taxonomy for the term explanation. All authors have read and agreed to the published version of the manuscript.
Funding
This research was funded by the National Natural Science Foundation of China (71871144) and Shanghai Key Discipline (S1201GYXK).
Data Availability Statement
The data presented in this study are available on request from thecorresponding author. The data are not publicly available due to data which also forms part of an ongoing study.
Conflicts of Interest
The authors declare no conflict of interest.
References
- Wu, H.; Hao, Y.; Ren, S. How do environmental regulation and environmental decentralization affect green total factor energy efficiency: Evidence from china. Energy Econ. 2020, 91, 104880. [Google Scholar] [CrossRef]
- Peuckert, J. What shapes the impact of environmental regulation on competitiveness? Evidence from Executive Opinion Surveys. Environ. Innov. Soc. Transit. 2014, 10, 77–94. [Google Scholar] [CrossRef]
- Yang, C.; Tseng, Y.; Chen, C. Environmental regulations, induced r & d, and productivity: Evidence from taiwan’s manufacturing industries. Resour. Energy Econ. 2014, 34, 514–532. [Google Scholar] [CrossRef]
- Li, B.; Wu, S. Effects of local and civil environmental regulation on green total factor productivity in China: A spatial Durbin econometric analysis. J. Clean. Prod. 2016, 153, 342–353. [Google Scholar] [CrossRef]
- Wei, W.; Zhang, W.; Wen, J.; Wang, J. TFP growth in Chinese cities: The role of factor-intensity and industrial agglomeration. Econ. Model. 2020, 91, 534–549. [Google Scholar] [CrossRef]
- Lu, X.-H.; Jiang, X.; Gong, M.-Q. How land transfer marketization influence on green total factor productivity from the approach of industrial structure? Evidence from China. Land Use Policy 2020, 95, 104610. [Google Scholar] [CrossRef]
- Beck, T.; Levine, R. Stock markets, banks, and growth: Panel evidence. J. Bank. Financ. 2004, 28, 423–442. [Google Scholar] [CrossRef] [Green Version]
- Rioja, F.; Valev, N. Does one size fit all? A reexamination of the finance and growth relationship. J. Dev. Econ. 2004, 74, 429–447. [Google Scholar] [CrossRef]
- Yao, X.; Tang, X. Does financial structure affect CO2 emissions? Evidence from G20 countries. Financ. Res. Lett. 2020, 10, 101791. [Google Scholar] [CrossRef]
- Pan, X.; Li, M.; Wang, M.; Chu, J.; Bo, H. The effects of outward foreign direct investment and reverse technology spillover on China’s carbon productivity. Energy Policy 2020, 145, 111730. [Google Scholar] [CrossRef]
- Anwar, S.; Nguyen, L.P. Is foreign direct investment productive? A case study of the regions of Vietnam. J. Bus. Res. 2014, 67, 1376–1387. [Google Scholar] [CrossRef]
- Khachoo, Q.; Sharma, R.; Dhanora, M. Does proximity to the frontier facilitate fdi-spawned spillovers on innovation and productivity? J. Econ. Bus. 2018, 97, 39–49. [Google Scholar] [CrossRef]
- Wu, H.; Ren, S.; Yan, G.; Hao, Y. Does China’s outward direct investment improve green total factor productivity in the “Belt and Road” countries? Evidence from dynamic threshold panel model analysis. J. Environ. Manag. 2020, 275, 111295. [Google Scholar] [CrossRef] [PubMed]
- Ding, C.; Niu, Y. Market size, competition, and firm productivity for manufacturing in china. Reg. Sci. Urban Econ. 2019, 74, 81–98. [Google Scholar] [CrossRef]
- Poncet, S. A Fragmented China: Measure and Determinants of Chinese Domestic Market Disintegration. Rev. Int. Econ. 2005, 13, 409–430. [Google Scholar] [CrossRef]
- Young, A. The razor’s edge: Distortions and incremental reform in the people’s republic of china. Q. J. Econ. 2000, 115, 1091–1135. [Google Scholar] [CrossRef] [Green Version]
- Ke, S. Domestic market integration and regional economic growth—China’s recent experience from 1995–2011. World Dev. 2015, 66, 588–597. [Google Scholar] [CrossRef]
- Sun, X.; Zhou, X.; Chen, Z.; Yang, Y. Environmental efficiency of electric power industry, market segmentation and technological innovation: Empirical evidence from china. Sci. Total. Environ. 2020, 706, 135749. [Google Scholar] [CrossRef]
- Bian, Y.; Song, K.; Bai, J. Market segmentation, resource misallocation and environmental pollution. J. Clean. Prod. 2019, 228, 376–387. [Google Scholar] [CrossRef]
- Machlup, F. A History of Thought on Economic Integration; Columbia University Press: New York, NY, USA, 1977. [Google Scholar] [CrossRef]
- Hermosilla, M.; Wu, Y. Market size and innovation: The intermediary role of technology licensing. Res. Policy 2018, 47, 980–991. [Google Scholar] [CrossRef]
- Zhang, K.; Shao, S.; Fan, S. Market integration and environmental quality: Evidence from the Yangtze River delta region of China. J. Environ. Manag. 2020, 261, 110208. [Google Scholar] [CrossRef] [PubMed]
- Claessens, S.; Feijen, E.; Laeven, L. Political connections and preferential access to finance: The role of campaign contributions. CEPR Discuss. Pap. 2007, 88, 554–580. [Google Scholar] [CrossRef] [Green Version]
- Duanmu, L.J.; Bu, M.; Pittman, R. Does Market Competition Dampen Environmental Performance? Evidence from China. Strateg. Manag. J. 2018, 39, 3006–3030. [Google Scholar] [CrossRef]
- Lin, Y.; Liu, P. Local Protection and Market Segmentation: From the Perspective of Development Strategy. China Center for Economic Research Working Paper Series. 2004. Available online: http://ww2.usc.cuhk.edu.hk/PaperCollection/webmanager/wkfiles/4175_1_1.pdf. (accessed on 1 November 2020).
- Qin, Q.; Jiao, Y.; Gan, X.; Liu, Y. Environmental efficiency and market segmentation: An empirical analysis of China’s thermal power industry. J. Clean. Prod. 2020, 242, 118560. [Google Scholar] [CrossRef]
- Ortega, J. The losses from integration in matching markets can be large. Econ. Lett. 2019, 174, 48–51. [Google Scholar] [CrossRef] [Green Version]
- Bin, P.; Chen, X.; Fracasso, A.; Tomasi, C. Resource allocation and productivity across provinces in china. Int. Rev. Econ. Financ. 2018, 57, 103–113. [Google Scholar] [CrossRef] [Green Version]
- Restuccia, D.; Rogerson, R. Misallocation and productivity. Rev. Econ. Dyn. 2013, 16, 1–10. [Google Scholar] [CrossRef] [Green Version]
- Schillinger, M. Balancing Market Design and Opportunity Cost—The Swiss Case. Working Papers. 2019. Available online: https://ideas.repec.org/p/bsl/wpaper/2019-14.html (accessed on 1 November 2020).
- Wang, I.K.; Seidle, R. The degree of technological innovation: A demand heterogeneity perspective. Technol. Forecast. Soc. Chang. 2017, 125, 166–177. [Google Scholar] [CrossRef]
- Bessonova, E.; Linton, J. How the innovation-competition link is shaped by technology distance in a high-barrier catch-up economy. Technovation 2019, 86–87, 15–32. [Google Scholar] [CrossRef]
- Michael, P. The competitive advantage of nations. Harv. Bus. Rev. 1990, 68, 73–91. [Google Scholar] [CrossRef]
- Hu, Y.; Fisher-Vanden, K.; Su, B. Technological spillover through industrial and regional linkages: Firm-level evidence from China. Econ. Model. 2020, 89, 523–545. [Google Scholar] [CrossRef]
- Li, D.; Zheng, M.; Cao, C.; Chen, X.; Ren, S.; Huang, M. The impact of legitimacy pressure and corporate profitability on green innovation: Evidence from china top 100. J. Clean. Prod. 2017, 141, 41–49. [Google Scholar] [CrossRef] [Green Version]
- Miller, S.M.; Upadhyay, M.P. The effects of openness, trade orientation, and human capital on total factor productivity. J. Dev. Econ. 2000, 63, 399–423. [Google Scholar] [CrossRef]
- Hulten, C.R.; Bennathan, E.; Srinivasan, S. Infrastructure, externalities, and economic development: A study of the Indian manufacturing industry. World Bank Econ. Rev. 2006, 20, 291–308. [Google Scholar] [CrossRef]
- Pittman, R. Multilateral Productivity Comparisons with Undesirable Outputs. Econ. J. 1983, 93, 883. [Google Scholar] [CrossRef]
- Jebali, E.; Essid, H. Total Factor Environmental Productivity in the Mediterranean Countries: A Malmquist–Luenberger Index Approach. Int. J. Appl. Manag. Technol. 2002, 19, 62–76. [Google Scholar] [CrossRef]
- Shepherd, R.W. Theory of Cost and Production Functions; Princeton University Press: Princeton, NJ, USA, 2015. [Google Scholar] [CrossRef]
- Parsley, D.; Wei, S. Limiting Currency Volatility to Stimulate Goods Market Integration: A Price-Based Approach. CEPR Discussion Papers. 2001. Available online: https://ssrn.com/abstract=283845 (accessed on 1 November 2020).
- LeSage, J.P.; Pace, R.K. Introduction to Spatial Econometrics; CRC, Taylor & Francis Group: New York, NY, USA, 2009. [Google Scholar] [CrossRef] [Green Version]
- Anselin, L.; Bera, A.K.; Florax, R.; Yoon, M.J. Simple diagnostic tests for spatial dependence. Reg. Sci. Urban Econ. 1996, 26, 77–104. [Google Scholar] [CrossRef]
- Paas, T.; Schlitte, F. Regional Income Inequality and Convergence Processes in the EU-25; HWWA Discussion Papers (ersa06p229); HWWA: Hamburg, Germany, 2008. [Google Scholar]
Figure 1.
Market integration in China during the period 2008–2017.

Figure 2.
Green total factor productivity in china’s 30 provinces.

Figure 3.
Moran’s I scatter plot of China’s green total factor productivity.


Table 1.
Descriptive statistics of variables.
| Variable | Unit | Obs | Mean | Std. Dev. | Min | Max |
|---|---|---|---|---|---|---|
| mL | 1 | 300 | 0.997 | 0.049 | 0.843 | 1.197 |
| mleff | 1 | 300 | 0.989 | 0.035 | 0.845 | 1.097 |
| mltec | 1 | 300 | 1.008 | 0.037 | 0.905 | 1.195 |
| mi | 100 | 300 | 96.516 | 33.596 | 37.488 | 191.556 |
| regdp | yuan | 300 | 44,566.761 | 23,541.643 | 12,348.500 | 118,718.000 |
| str | 100 | 300 | 46.362 | 8.252 | 20.519 | 58.700 |
| urb | 100 | 300 | 54.701 | 13.193 | 32.400 | 89.300 |
| open | billion CNY | 300 | 119.795 | 173.521 | 2.650 | 839.054 |
| env | Billion CNY | 300 | 24.509 | 19.195 | 1.755 | 91.490 |
| human | year | 300 | 8.898 | 0.931 | 6.956 | 12.087 |
Table 2.
Moran’s I of China’s regional green total factor productivity in 2008–2017.
| Year | Moran’s I | Z-Statistic | p-Value |
|---|---|---|---|
| 2008 | 0.182 | 2.235 | 0.016 |
| 2009 | 0.165 | 2.061 | 0.028 |
| 2010 | 0.155 | 1.742 | 0.075 |
| 2011 | 0.272 | 2.657 | 0.008 |
| 2012 | 0.185 | 1.901 | 0.054 |
| 2013 | 0.219 | 2.055 | 0.030 |
| 2014 | 0.149 | 1.888 | 0.067 |
| 2015 | 0.208 | 2.221 | 0.021 |
| 2016 | 0.186 | 2.238 | 0.016 |
| 2017 | 0.233 | 2.064 | 0.028 |
Table 3.
Lagrangian multiplier (LM) test results.
| Test | Statistic | p-Value |
|---|---|---|
| Lagrange multiplier (error) | 5.698 | 0.061 |
| Robust Lagrange multiplier (error) | 69.472 | 0.001 |
| Lagrange multiplier (lag) | 28.541 | 0.002 |
| Robust Lagrange multiplier (lag) | 96.753 | 0.000 |
Table 4.
Regression results.
| (1) | (1) | (2) | |
|---|---|---|---|
| OLS | SEM | SLM | |
| mi | 0.337 * | 0.068 ** | 0.070 ** |
| (1.67) | (2.48) | (2.50) | |
| eco | 0.024 * | 0.010 *** | 0.002 *** |
| (1.66) | (3.24) | (3.05) | |
| str | −0.022 ** | −0.032 * | −0.038 * |
| (−2.42) | (−1.68) | (−1.72) | |
| urb | −0.020 ** | −0.009 ** | −0.013 ** |
| (−2.51) | (−2.12) | (−2.15) | |
| open | 0.002 | 0.006 | 0.009 * |
| (0.52) | (1.51) | (1.77) | |
| env | 0.008 * | 0.007 *** | 0.004 ** |
| (1.92) | (2.81) | (2.50) | |
| human | −0.096 | 0.123 * | 0.129 * |
| (−1.57) | (1.88) | (1.92) | |
| _cons | 0.906 *** | ||
| (2.69) | |||
| ρ | 0.317 *** | 0.313 *** | |
| (3.48) | (3.50) | ||
| sigma2 | 0.014 *** | 0.014 *** | |
| (12.13) | (12.12) | ||
| R2 | 0.431 | 0.579 | 0.585 |
| Log-L | 548.41 | 549.18 |
Note: ***, **, and * represent significance of p-values at 1, 5, and 10%, respectively.
Table 5.
Spatial effect decomposition.
| Type | Variables | Coef. | T Value | p Value |
|---|---|---|---|---|
| Direct effects | mi | 0.063 | 2.42 | 0.023 |
| Spatial spillover effects (indirect effects) | 0.041 | 2.08 | 0.036 | |
| Total effects | 0.104 | 2.51 | 0.011 |
Table 6.
Results of transmission mechanism test.
| MLEFF | MLTEC | |||||||
|---|---|---|---|---|---|---|---|---|
| SLM | Direct Effects | Indirect Effects | Total Effects | SLM | Direct Effects | Indirect Effects | Total Effects | |
| mi | 0.038 ** | 0.044 *** | 0.010 * | 0.054 ** | 0.072 ** | 0.083 ** | 0.012 * | 0.095 ** |
| (2.23) | (2.69) | (1.70) | (2.19) | (2.11) | (2.25) | (1.87) | (2.30) | |
| Control variables | YES | YES | ||||||
| ρ | 0.129 *** | 0.291 *** | ||||||
| (2.68) | (3.54) | |||||||
| R2 | 0.397 | 0.432 | ||||||
| Log-L | 619.26 | 631.05 | ||||||
Note: ***, **, and * represent significance of p-values at 1, 5 and 10%, respectively.
Table 7.
Regression results based on the spatial distance weight matrix.
| SLM | Direct Effects | Indirect Effects | Total Effects | |
|---|---|---|---|---|
| mi | 0.033 ** | 0.049 *** | 0.027 * | 0.076 ** |
| (2.06) | (2.73) | (2.11) | (2.26) | |
| Control variables | YES | |||
| ρ | 0.108 *** | |||
| (3.01) | ||||
| R2 | 0.317 | |||
| Log-L | 328.96 |
Note: ***, **, and * represent significance of p-values at 1, 5, and 10%, respectively.
Publisher’s Note: MDPI stays neutral with regard to jurisdictional claims in published maps and institutional affiliations. |
© 2021 by the authors. Licensee MDPI, Basel, Switzerland. This article is an open access article distributed under the terms and conditions of the Creative Commons Attribution (CC BY) license (http://creativecommons.org/licenses/by/4.0/).
Share and Cite
MDPI and ACS Style
Hou, S.; Song, L. Market Integration and Regional Green Total Factor Productivity: Evidence from China’s Province-Level Data. Sustainability 2021, 13, 472. https://0-doi-org.brum.beds.ac.uk/10.3390/su13020472
AMA Style
Hou S, Song L. Market Integration and Regional Green Total Factor Productivity: Evidence from China’s Province-Level Data. Sustainability. 2021; 13(2):472. https://0-doi-org.brum.beds.ac.uk/10.3390/su13020472
Chicago/Turabian StyleHou, Shiying, and Liangrong Song. 2021. "Market Integration and Regional Green Total Factor Productivity: Evidence from China’s Province-Level Data" Sustainability 13, no. 2: 472. https://0-doi-org.brum.beds.ac.uk/10.3390/su13020472
Note that from the first issue of 2016, this journal uses article numbers instead of page numbers. See further details here.