A Business Intelligence & Analytics Framework for Clean and Affordable Energy Data Analysis


1
Department of Business Information Systems, West University of Timisoara, 300223 Timisoara, Romania
2
Flat White Economy Investment, 020335 Bucuresti, Romania
*
Author to whom correspondence should be addressed.
Sustainability 2021, 13(2), 638; https://0-doi-org.brum.beds.ac.uk/10.3390/su13020638
Submission received: 3 December 2020
/
Revised: 1 January 2021
/
Accepted: 5 January 2021
/
Published: 11 January 2021
(This article belongs to the Special Issue Big Data, Blockchain and IoT in Energy Management for Sustainable Development)
Abstract
:Energy is the sector most strongly connected with climate change moderation, and this correlation and interdependency is largely investigated, in particular as regards renewable energy and sustainability issues. The United Nations, European Union, and all countries around the world declare their support for sustainable development, materialized in agreements, strategies, and action plans. This diversity, combined with significant interdependencies between indicators, brings up challenges for data analysis, which we have tackled in order to decide on relevant indicators. We have built a research framework based on Business Intelligence & Analytics for monitoring the SDG7 indicators that aim at “Ensuring access to affordable, reliable, sustainable, and modern energy for all”, in relation with SDG13 indicators targeting the sustainable aspect of energy. In developing the Business Intelligence & Analytics framework, we have considered Design Science Research in information systems guidelines. We have designed a process for carrying out Design Science Research by describing the demarche to develop information artifacts, which are the essence of a Business Intelligence & Analytics system. The information artifacts, such as data source, preprocessed data, initial and final data model, as well as data visualizations, are designed and implemented in order to support clean and affordable energy data analysis. The proposed research model, applied for Romania in this paper, serves as a point of departure for investigating data in a more integrated way, and can be easily applied to another country case study.
1. Introduction
Sustainable development promotes the balance between the three pillars of development—economic, social, and environmental. In 2015, UN summit adopted the 2030 Development Agenda and advised a new indicator framework for international cooperation to achieve sustainable development, pursuing 17 new Sustainable Development Goals (SDGs) as a furtherance of the Millennium Development Goals adopted in 2000. The SDGs continue and consolidate the 2000 goals, while enabling them to be more sustainable through the intensification of the environmental goals.
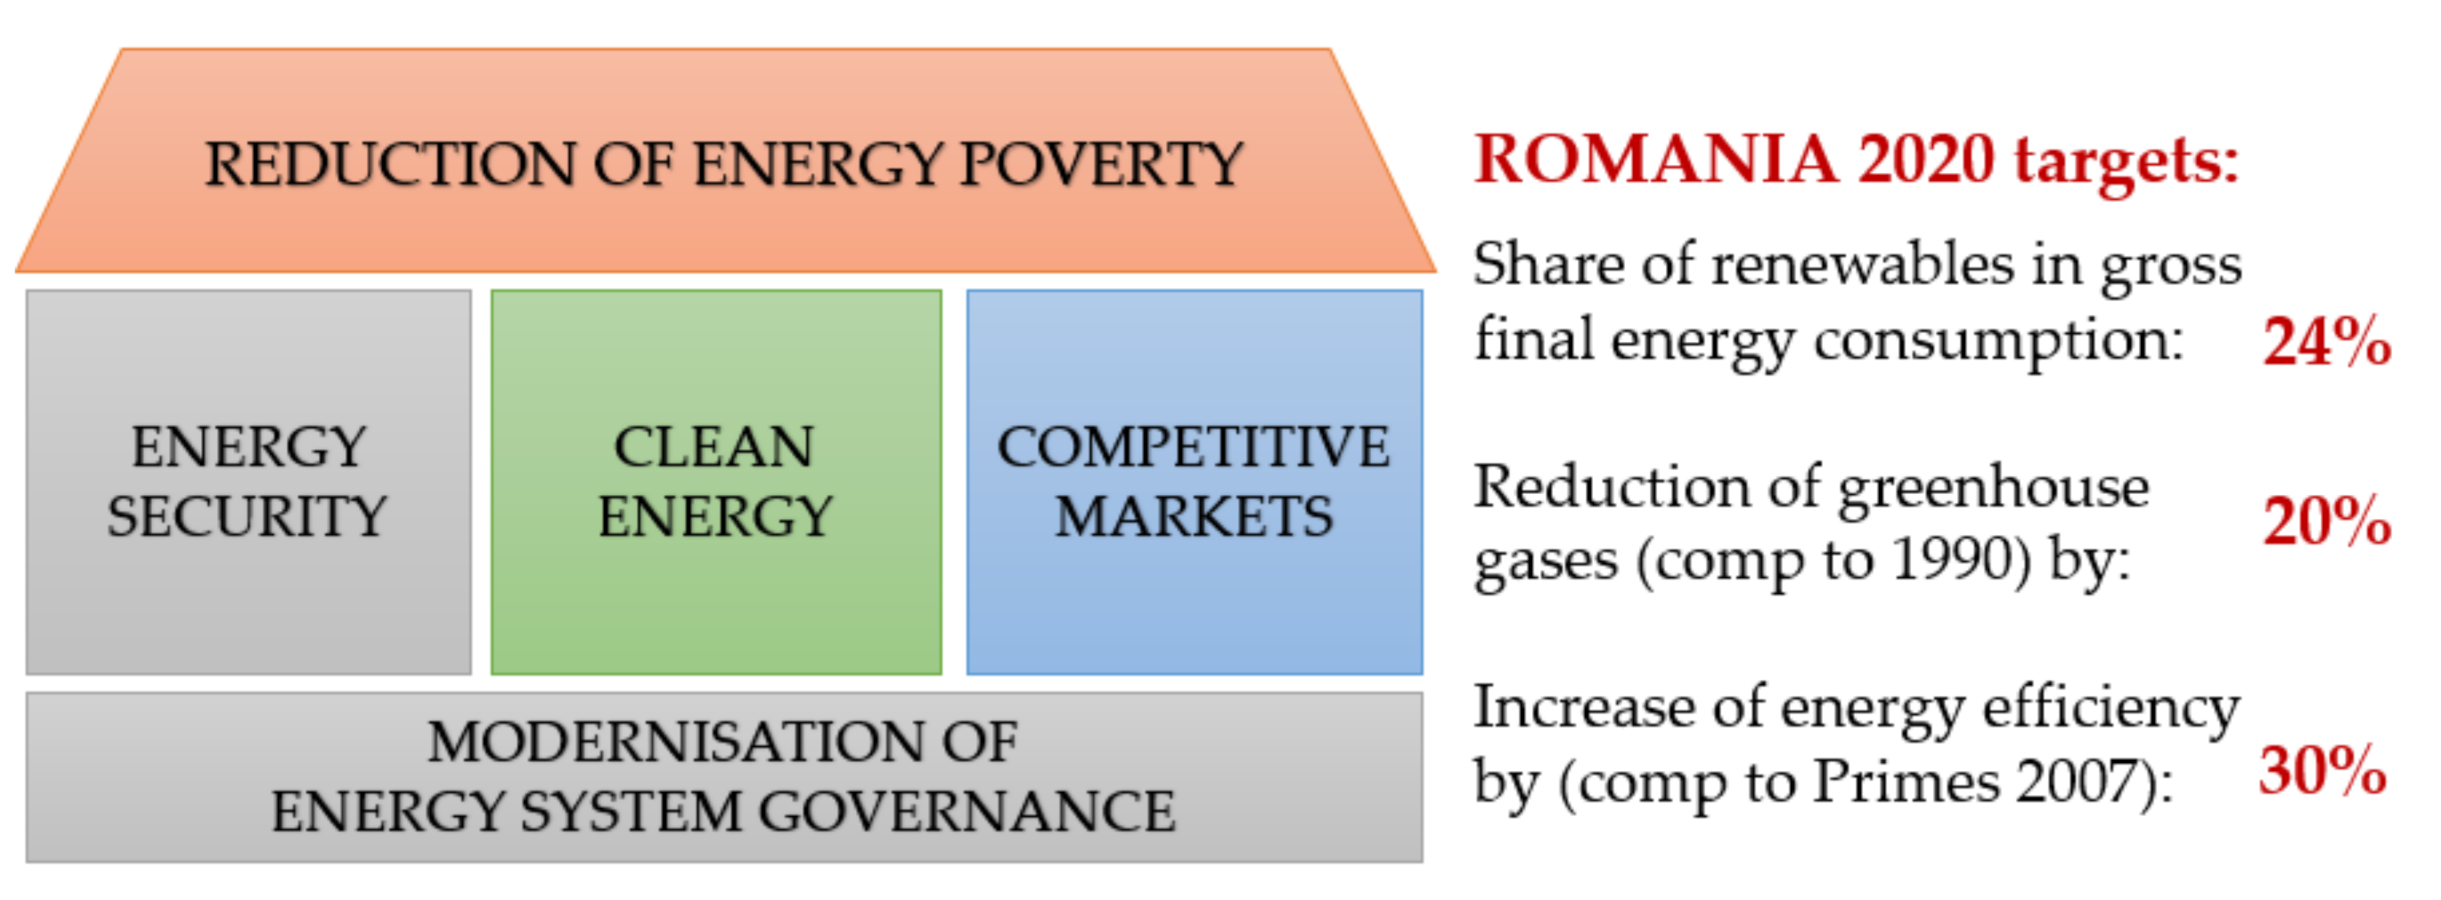
The five key strategic goals are the pillars of the energy strategy (Figure 1):
- Energy security;
- Competitive energy markets;
- Clean energy;
- Good governance in the energy sector and affordable energy supplies;
- Reduction of energy poverty and better protection of vulnerable consumers.
Romania is a partner in the EU energy strategy, and makes a significant contribution in the achievement of the EU “20-20-20” targets. All data and prospects indicate that Romania will achieve the 2020 targets (see values in Figure 1).
Like all European countries, Romania supports and pursues the UN SDGs. SDG number seven is one of the most important targets: to ensure universal access to affordable, sustainable, reliable and modern energy. Nowadays, innovation and clean energy are the main means by which we can maintain constant technological progress while also protecting the environment and limiting the effects of global warming. Energy consumption is indispensable to human welfare and increasing living standards, but this also makes energy a very significant contributor to CO2 emissions. In this respect, SDG number 13 requires our consideration.
SDG7 is tightly connected with Industry 4.0 and implies the development of infrastructures and sustainable energy services for all countries. The Industry 4.0 framework uses augmented reality, blockchain technology, Internet of Things, rapid prototyping methodologies for system development, and Business Intelligence & Analytics (BI&A). As presented in the UNIDO report [1], “the sustainable energy transition and Industry 4.0 share important characteristics: both are highly influenced by technological innovations, dependent on the development of new suitable infrastructures and regulations as well as are potential enablers for new business models”. Therefore, the transition process to more sustainable energy (SE) systems and the technology evolution should take place at the same time and in an integrated way.
Three main hypotheses underlie our research:
Hypothesis 1.
Business Intelligence & Analytics frameworks are suitable for sustainable development analysis;
Hypothesis 2.
Business Intelligence & Analytics approaches for clear and affordable energy data analysis imply a Design Science Research process;
Hypothesis 3.
The Design Science Research process is strengthened by Visual Analytics methods.
By bringing together indicators from SDGs and from Romania’s energy strategy, we intend to analyze the SE process evolution over time in a Business Intelligence & Analytics approach. In developing the BI&A framework, we have considered the design science research in information systems guidelines [2], as follows: selection of the data sources, getting the selected data, attainment of the preprocessed data to be integrated into the data model, realization of the data model for analysis, and ending with the visualized data. All data are artifacts that are designed in the BI&A framework.
Design science is “the design and investigation of artifacts in context” [3]. Two kinds of research problems are specific to design science: “to design an artifact to improve a problem context”, or “to answer knowledge questions about the artifact in context” [2]. The problems in design science are design problems. The goal is to design something useful, and the research method consists in a proper design cycle. In order to validate Hypothesis 1, Hypothesis 2 and Hypothesis 3, we have designed a process for carrying out Design Science Research in Business Intelligence & Analytics systems, describing the process of developing information artifacts that are the essence of any BI&A system. The research was conducted in order to support a clean and affordable energy data analysis.
2. Literature Review
We consider relevant references for Sustainable Development Goals, going deeper with SDG7, “Ensure access to affordable, reliable, sustainable, and modern energy for all”. The demarche output consists of a synthesis of clean and affordable energy indicators (see Table 1), based on which the initial information artifacts are designed.
The Sustainable Development Goals (SDGs) stated in the “2030 Agenda for Sustainable Development” [4] bring a “major improvement” over their predecessors, the Millennium Development Goals (MDGs), part of the Millennium Declaration from 2000. As argued in ref. [4], new goals were set for a better world in order “to address some of the systemic barriers to sustainable development”, and to provide “better coverage of, and balance between, the three dimensions of sustainable development–social, economic, and environmental–and the institutional/governance aspects”. The targets are structured around global environmental issues (climate, water, ecosystems, and oceans) [5] (p. 7).
Lu et al. [6] consider that “the SDGs place greater demands on the scientific community than did the Millennium Development Goals (MDGs), which they replace” [6] (p. 432). Same authors think that “coordinated global monitoring and modeling of many factors—social, economic, and environmental” is necessary in order to “address climate change, renewable energy, food, health and water provision.” In this respect, they lay out five priorities for how the scientific community should participate in this process, as follows: 1. Devise metrics; 2. Establish monitoring mechanisms; 3. Evaluate progress; 4. Enhance infrastructure; 5. Standardize and verify data. Scientists play an important role in supporting the SDGs, as they should bring solutions “to integrate monitoring and evaluation mechanisms into policy-making at all levels and ensure that information about our planet is easily available to all”, [6] (pp. 432–433).
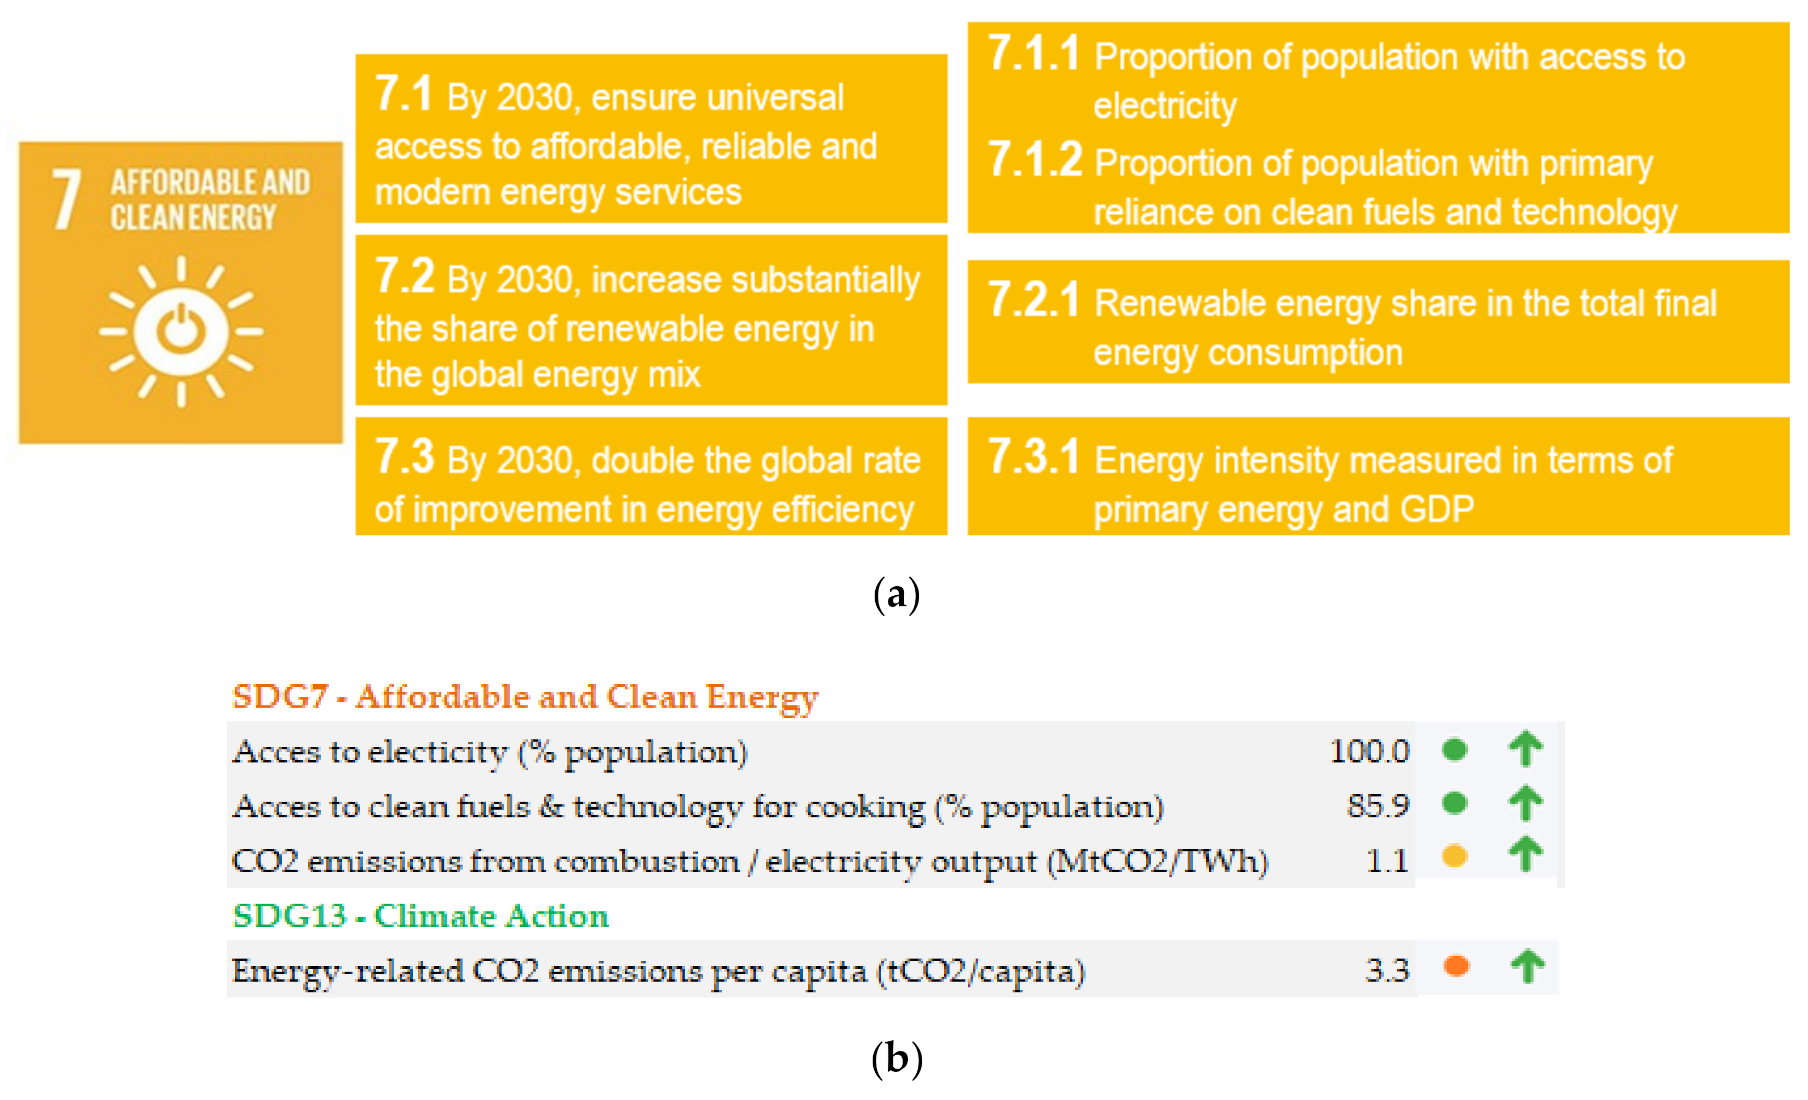
From the 17 goals and 169 associated targets in the 2030 Agenda, this paper focuses on the 17th goal (SDG7), which aims to “Ensure access to affordable, reliable, sustainable, and modern energy for all”. Several important and reputable research efforts, e.g., “IIASA Global Energy Assessment” and “World Energy Outlook of the IEA”, have determined that it is possible to reach “universal access to modern energy services for all by 2030”, while there are several pathways to follow. SDG7 adequately addresses the economic (“affordable”), social (“reliable”, and “modern”) and environmental (“sustainable”) aspects of energy [5] (p. 37).
Figure 2a summarizes specific targets and indicators of SDG7. Regarding the need for “refining targets”, the analytical report [5] considers all three targets from Figure 2a “relevant and required”, while suggesting the introduction of an additional target.
Rapporteurs think a supplementary target, namely Target 7.4, is necessary to support SDG7’s fulfillment and its close bond with environmental goals. Target 7.4 asserts that, “By 2030, ensure access to all to energy carriers and/or energy consuming devices that keep indoor air and other local pollution levels within safe limits.” In their informed opinion, this fourth target is needed “to ensure the clean and safe nature of energy usage” [5] (p. 39).
The report also recommends elaborating “concrete national targets with regard to the renewables and energy intensity improvements”, which relate to the global target as closely as possible, instead of being “based on burden sharing schemes or national goal-setting processes” [5] (p. 40).
There are interdependencies between all 17 sustainable development goals. Regarding SDG7, the ICSU report shows that “while energy is not needed per se, it is a vital ‘resource’ that is required to meet other SD goals”. SDG7 has a strong influence on health (SDG3), poverty eradication (SDG1), climate change (SDG13), ending hunger (SDG2), education (SDG4), gender equality (SDG5), clean water and sanitation (SDG6), productive opportunities (SDG8), infrastructure/industrialization (SDG11), and sustainable consumption (SDG 12). The point is that “without meeting SDG 7, it is impossible to meet these other goals”. On the other hand, SDG7 may be subject to the checks and balances provided by other goals. For instance, “the renewable energy projects required to deliver Target 7.2 must be carefully sited to avoid negative impacts on local terrestrial and/or ocean biodiversity” (SDG14 and SDG15) [5] (p. 41).
There are some papers [7] developed around one of the four core dimensions of the UN Report: social development, economic development, environmental sustainability, and security. Other papers focus on one specific sustainable development goal within a global approach [6], a country-based approach [8,9], or via a comparative examination between countries [10]. While all the above-mentioned papers promote and support the UN’s Sustainable Development Goals, let us also mention the criticisms raised in the literature on the topic. They have been criticized as creating “a dichotomy between the environment and human beings that fails to address the multiple interconnections between the two”, [11].
From a geographical perspective, our literature review indicated a prominent focus on the EU’s pursuing of SDGs. Official EU reports are constantly being published, and lots of research papers investigate the evolution of SDGs and their prospects, define scenarios and propose sustainable solutions and growth models. Guijarro and Poyatos define their own model to calculate a composite SDG index [12]. When applying it to the EU-28 countries, “the best SDG performers in the EU-28 are Luxembourg and Austria, whilst the worst performers are Greece and Romania”. In the 2019 Global Index Ranking, the best performers in the EU were Denmark and Sweden, but the last two positions were the same: Romania and Greece [13].
Romania’s state of affairs results from many EU reports and comparative studies. Such a paper as ref. [10] compares Poland, Spain, and Romania, and concludes that, overall, “Poland is the best-placed country to fulfill the 2030 commitments”. As for Romania, their conclusion is that it has “a long road ahead and must undertake reforms and implement policies to reduce the gap with the EU”. A similar conclusion comes from researching the SDGs’ implementation status in Romania [8]. The authors determine that the overall implementation of the SDGs is sub-optimal; only for 40 out of the 107 analyzed indicators do the projections suggest “the possibility of reaching the EU average values by 2030.”
Previous studies’ analyses show a great diversity, indicating different approaches to the SDG7 investigation. Many studies consider SDG7, along with the other 16 goals, from different perspectives. These include country-related reviews [8,9,10], comparative analysis [10,12], SDGs interdependencies research [14], or the examination of SDG-related activities [15,16]. For the latter category, various techno-economic-oriented articles discuss a variety of topics: from intelligent energy systems [15] to innovative elements of Industry 4.0 [16].
Energy is the sector most strongly connected with climate change moderation, and numerous papers investigate their correlation and interdependency, especially as concerns renewable energy and sustainability issues. For example, Owusu and Asumadu-Sarkodie stress the importance of “returning to renewables to help mitigate climate”, and doing this in a sustainable approach “in order to meet the energy demands of future generations” [7]. This type of argument proves our approach to discussing the SDG7 target in relation with climate action (SDG13) to be correct.
As per the 2019 statistics, Romania ranks 42nd of 162 countries in the overall SDGs performance (72.2 out of 100), having a score for SDG7 of 88 (out of 100), which is the third best score among all 17 SDGs scores [13].
However, a closer look at the indicators reveals that the weak point for our country is related to CO2 emissions. For both SDG7 and SDG13, the cited reports state that “challenges remain”, (Figure 2b).
In this respect, we have built a research model adding to the indicators directly related to SDG7 a number of energy-related indicators targeting the sustainable aspect of energy. Using the Romania National Strategy for Sustainable Development-Horizons 2013–2020–2030 document [17], we have chosen 12 out of the 14 related indicators for Objective 2 (Clean and affordable energy), as described in Table 1. Additional information about these indicators, such as unit of measure, symbol, calculation explanation, calculation formula and aggregation level, is synthesized in Appendix A.
According to Pratt et al. [18], “design science in information systems research pertains to the creation of artifacts to solve real-life problems”. Our demarche aims at designing the information artifacts essential for a BI&A analysis. The design process was implemented for a clean and affordable energy data analysis. This implies the design of all necessary information artifacts (see Figure 6) based on the considerations in Table 1.
The confirmation or not of Hypothesis 1, Hypothesis 2 and Hypothesis 3 will be made at the end of the theoretical–applicative approach regarding the information artifacts. The final data visualization artifacts will decide whether or not to validate the hypotheses.
3. Theoretical Consideration of Business Intelligence and Analytics. Applying Design Science Research Methodology
According to Durcevic, Business Intelligence & Analytics are “data management solutions implemented in companies and enterprises to collect historical and present data, while using statistics and software to analyze raw information, and deliver insights for making better future decisions” [19].
Business Intelligence (BI) is defined as a set of processes, architectures, and technologies that transform data into meaningful information that drives profitable business actions [20]. Various approaches connect BI to performance management [21,22] and decision support [23], and link the concept to related Business Analytics (BA).
BI implies “what happened in the past”, and “how it happened leading up to the present moment” analyses. If big trends and patterns can be identified, their motivation cannot, and no predictions are made. BA analysis identifies the causality of what happened (the why), and uses it to make business predictions in the short- and long-term. BI and BA may be used together in the process of creating a Business Intelligence strategy that is based on a BI&A holistic approach [24]. We determine what happened, how it happened and why.
Business Intelligence & Analytics facilitate the embedding of delivered information and knowledge in the processes and systems of the enterprise. The analytical techniques implemented in data mining, involved in by visualizations and scorecards/dashboards, allow data modeling, investigation and monitoring of the subject areas, and advanced reporting. In addition, cloud computing and Big Data analytics added to BI&A deliver effective results and significant benefits for businesses [25,26].
BI&A is also a solution to analyze information sustainability [27], using integrated BI&A tools, which can provide information on all areas of sustainability. The BI&A software enable deep analysis and generate richly visualized reports, including scorecards, dashboards and alerts, helping us understand the present in order to improve the future. The adoption of BI&A for analyzing energy data is fostered by data-driven business models and modern tools for analyzing data [28,29]. In-memory processing and machine learning techniques on the one hand, and self-service on the other hand, transform BI&A tools into powerful means for advanced analysis [30].
3.1. Design Science Research
According to Hevner et al. [31], “two paradigms characterize much of the research in the Information Systems discipline: behavioral science and design science.” Defined as “the act of creating an explicitly applicable solution to a problem”, design is an accepted research paradigm in disciplines such as engineering. The acceptance of design as a research paradigm has been extended to information system science and implies the design cycle of “artifacts of practical value to either the research or professional audience” [3].
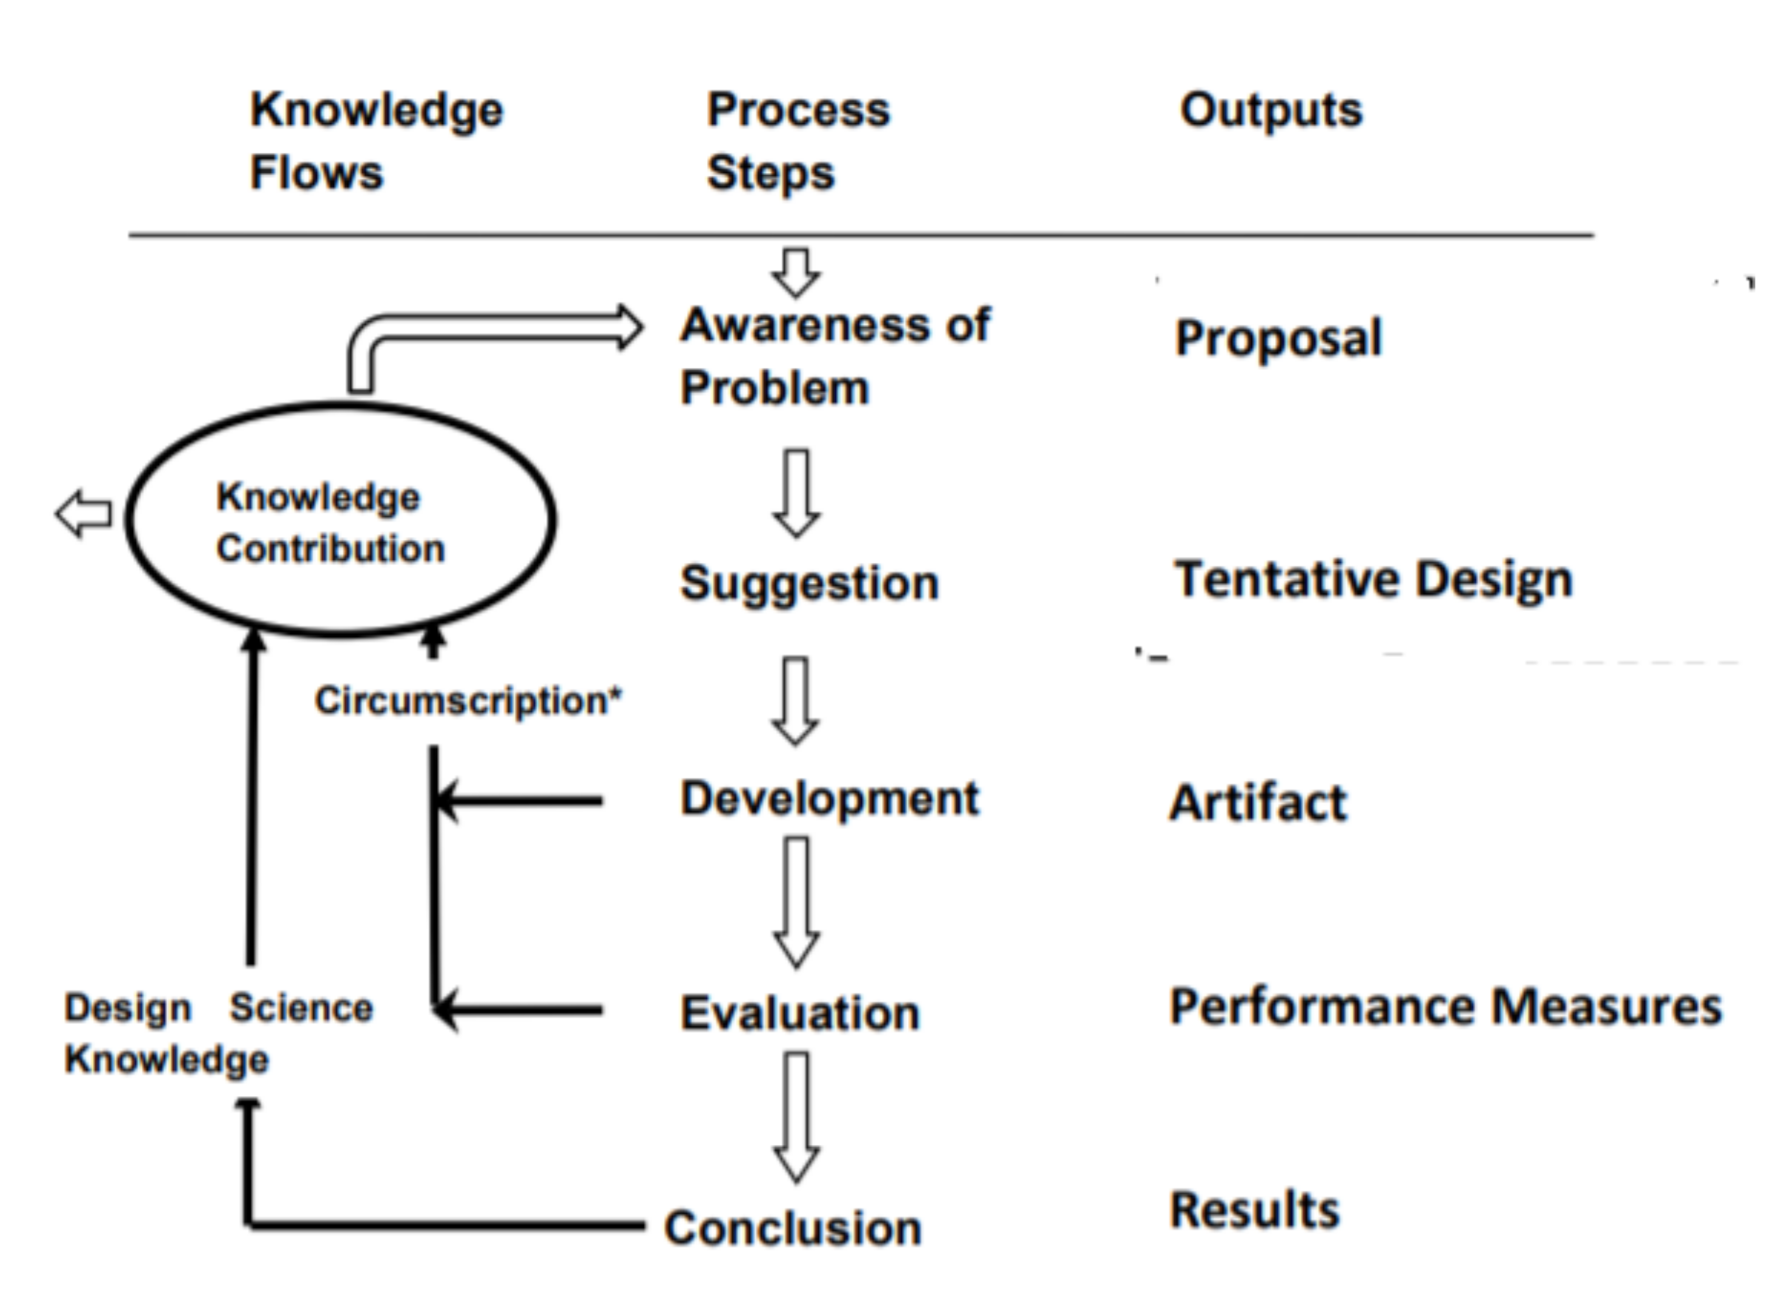
As asserted by Hevner et al. [31], the guidelines for Design Science Research (DSR) include methodological choices for the DSR process. In their “Design Research in Information Systems”, Vaishnavi and Kuechler [32] explain the process steps of design research (see Figure 3).
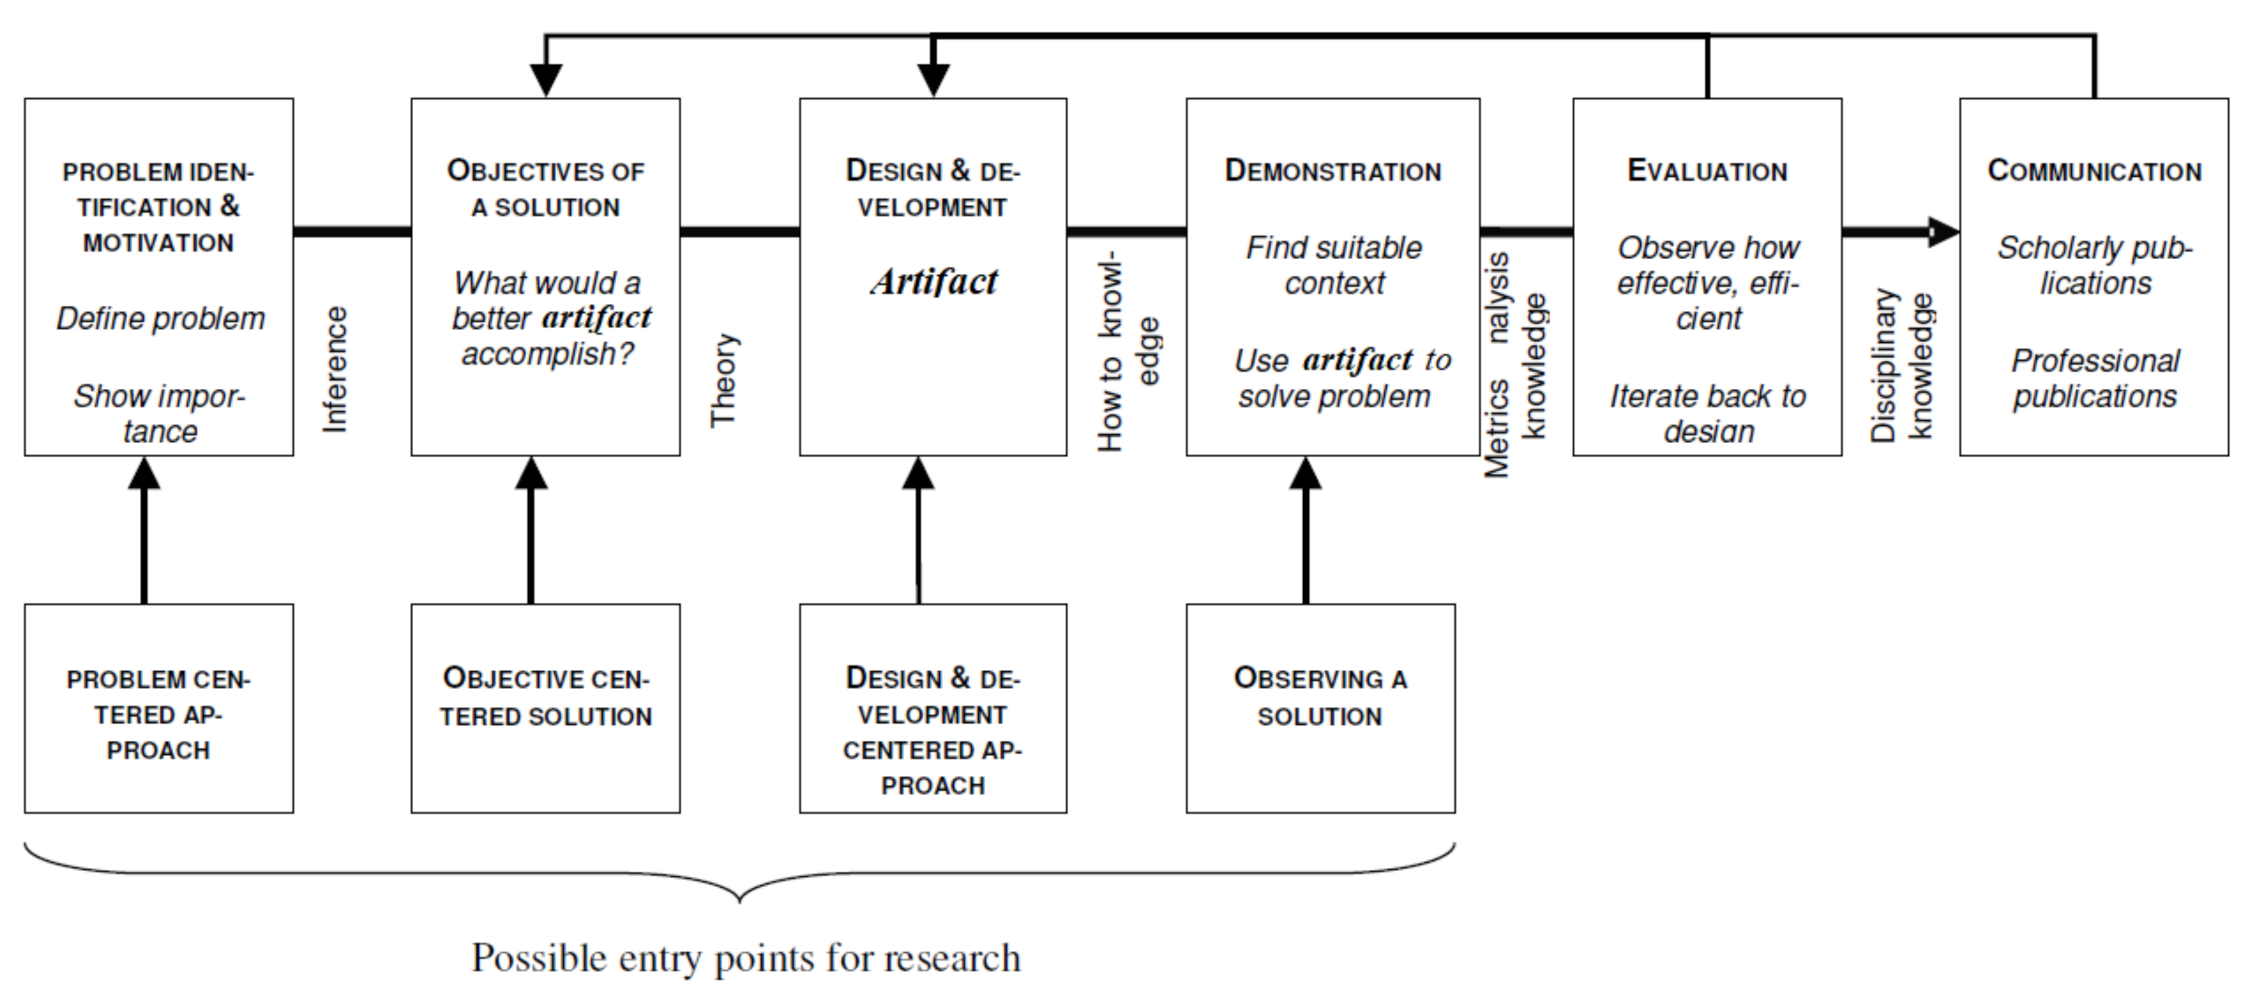
Pointing out the importance of the artifacts, the Design Science Research process includes the following process steps: problem identification and motivation; objectives of a solution; design and development; demonstration; evaluation; and communication (see Figure 4).
As indicated in Figure 4, there are many possible entry points for research. The demarche can be a problem-centered approach, an objective-centered solution, a design and development-centered approach and/or observing a solution.
The general design science research process is adapted to the Business Intelligence & Analytics framework, being used to conduct the research for data analysis regarding clean and affordable energy. Artifact development is a multi-phase process, involving one phase for each artifact type. Therefore, the design and development-centered approach implies a design process for each category of artifacts and is based on the output of the previous phase (as shown in Figure 6).
3.2. Business Intelligence and Analytics Framework
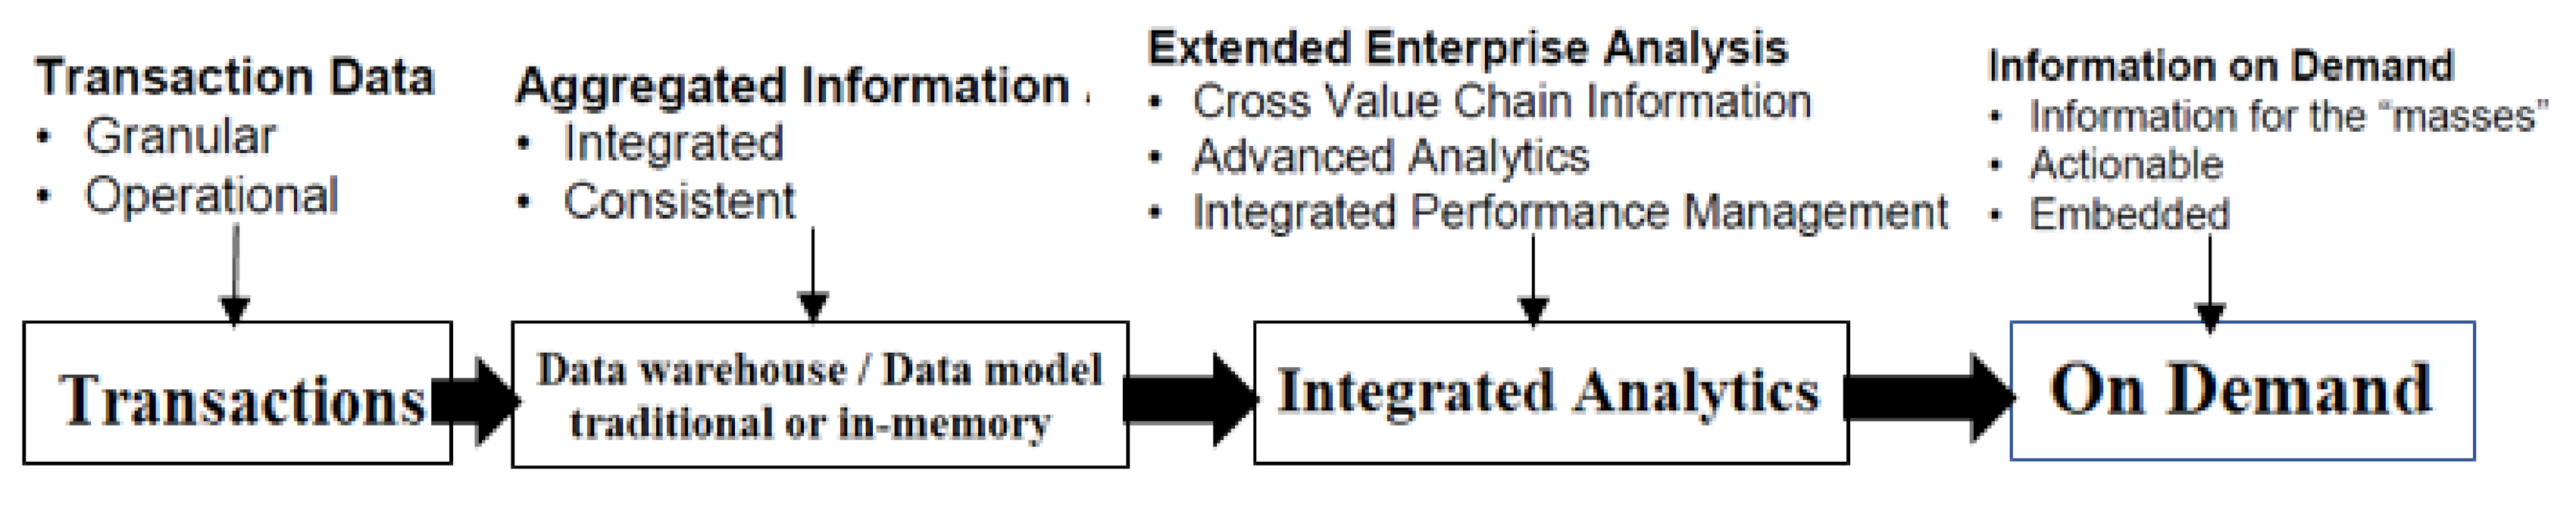
BI&A frameworks allow the connection of various business elements: organizational roles, Key Performance Indicators (KPIs), authorization, and visualization. After identifying the business issues, business questions are formulated. To give the appropriate business response, we need to perform the necessary steps from the Data to Information on Demand value chain (Figure 5).
According to Dekkers et al. [34], the Business Intelligence &Analytics framework combines the BI&A processes with the “Plan-Do-Check-Act (PDCA) cycle” of Deming [35]. The BI&A processes establish the development of information (go to business data sources to gather necessary data; transform data to information and suitably submit) and the use of information (querying and analyzing data; act on the ordered data) based on a PDCA scenario.
If we consider the “From Data to Information on Demand” value chain (see Figure 5), the validity of Hypothesis 1 is ensured by providing the necessary information for a sustainable development analysis.
According to Villegas-Ch et al. [36], based on the design science approach, the BI&A framework addresses the following stages of the process: 1, selection of data sources; 2, attainment of necessary data; 3, pre-processing data for integration into the initial data model; 4, attainment of the final model based on the addition of calculations, measures, indicators; 5, analysis execution through intelligent data visualization and analytic tools.
Design Science Research (DSR) builds and evaluates artifacts, such as constructs, models, methods, or instantiations [37]. According to Mwilu et al. [38], new artifacts can significantly boost the field of Business Intelligence &Analytics.
According to Hevner et al. [2], an artifact is a physical or non-physical object created to solve a specific problem. Unlike physical artifacts, information can be replicated and shared over long distances quickly and easily.
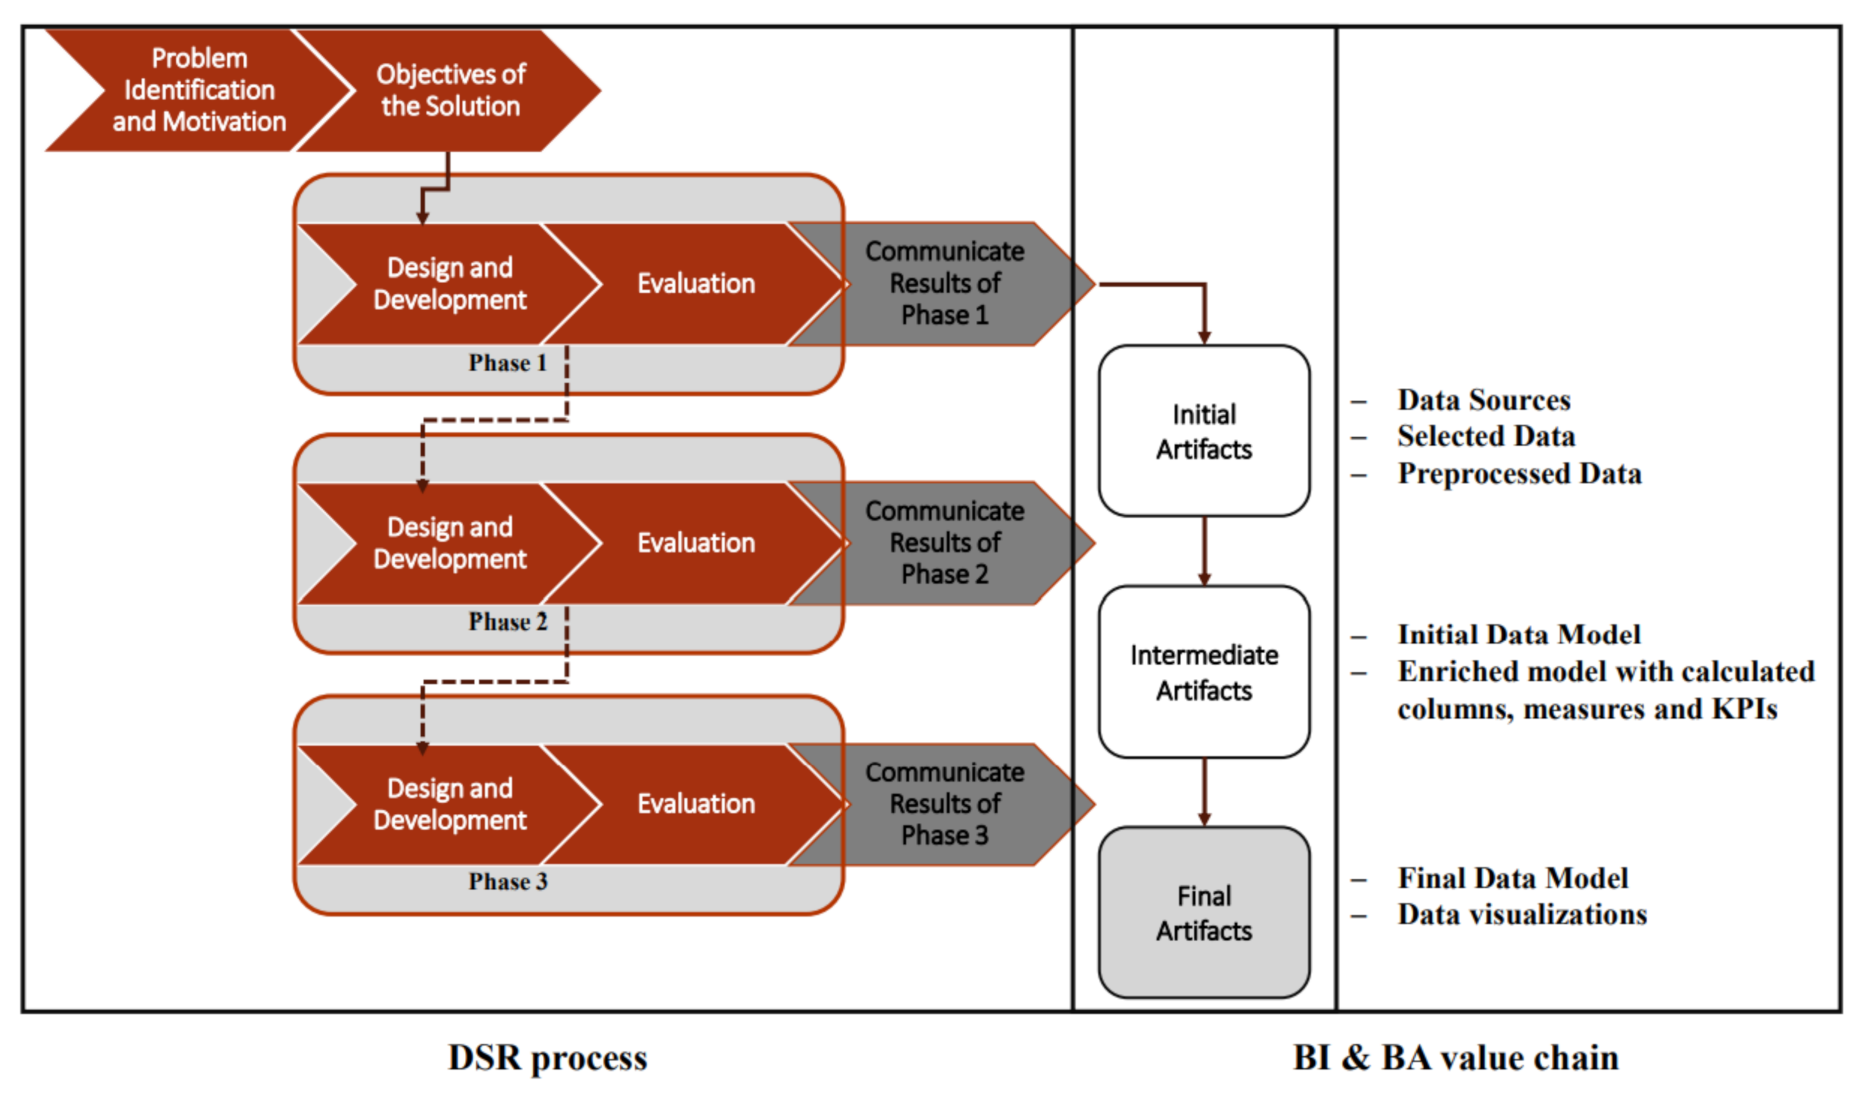
The information artifacts are generated from the available data, through modeling and transformation, to the desired form for visualization in order to satisfy the need for the information of the business users, as shown in Figure 6.
If the requested data visualizations are obtained by applying DSR, we can stipulate that both Hypothesis 1 and Hypothesis 2 are true. Data visualizations are final information artifacts, and are deployed from the data model. They are a superior representation of “Information on Demand”.
3.3. Data Visualization
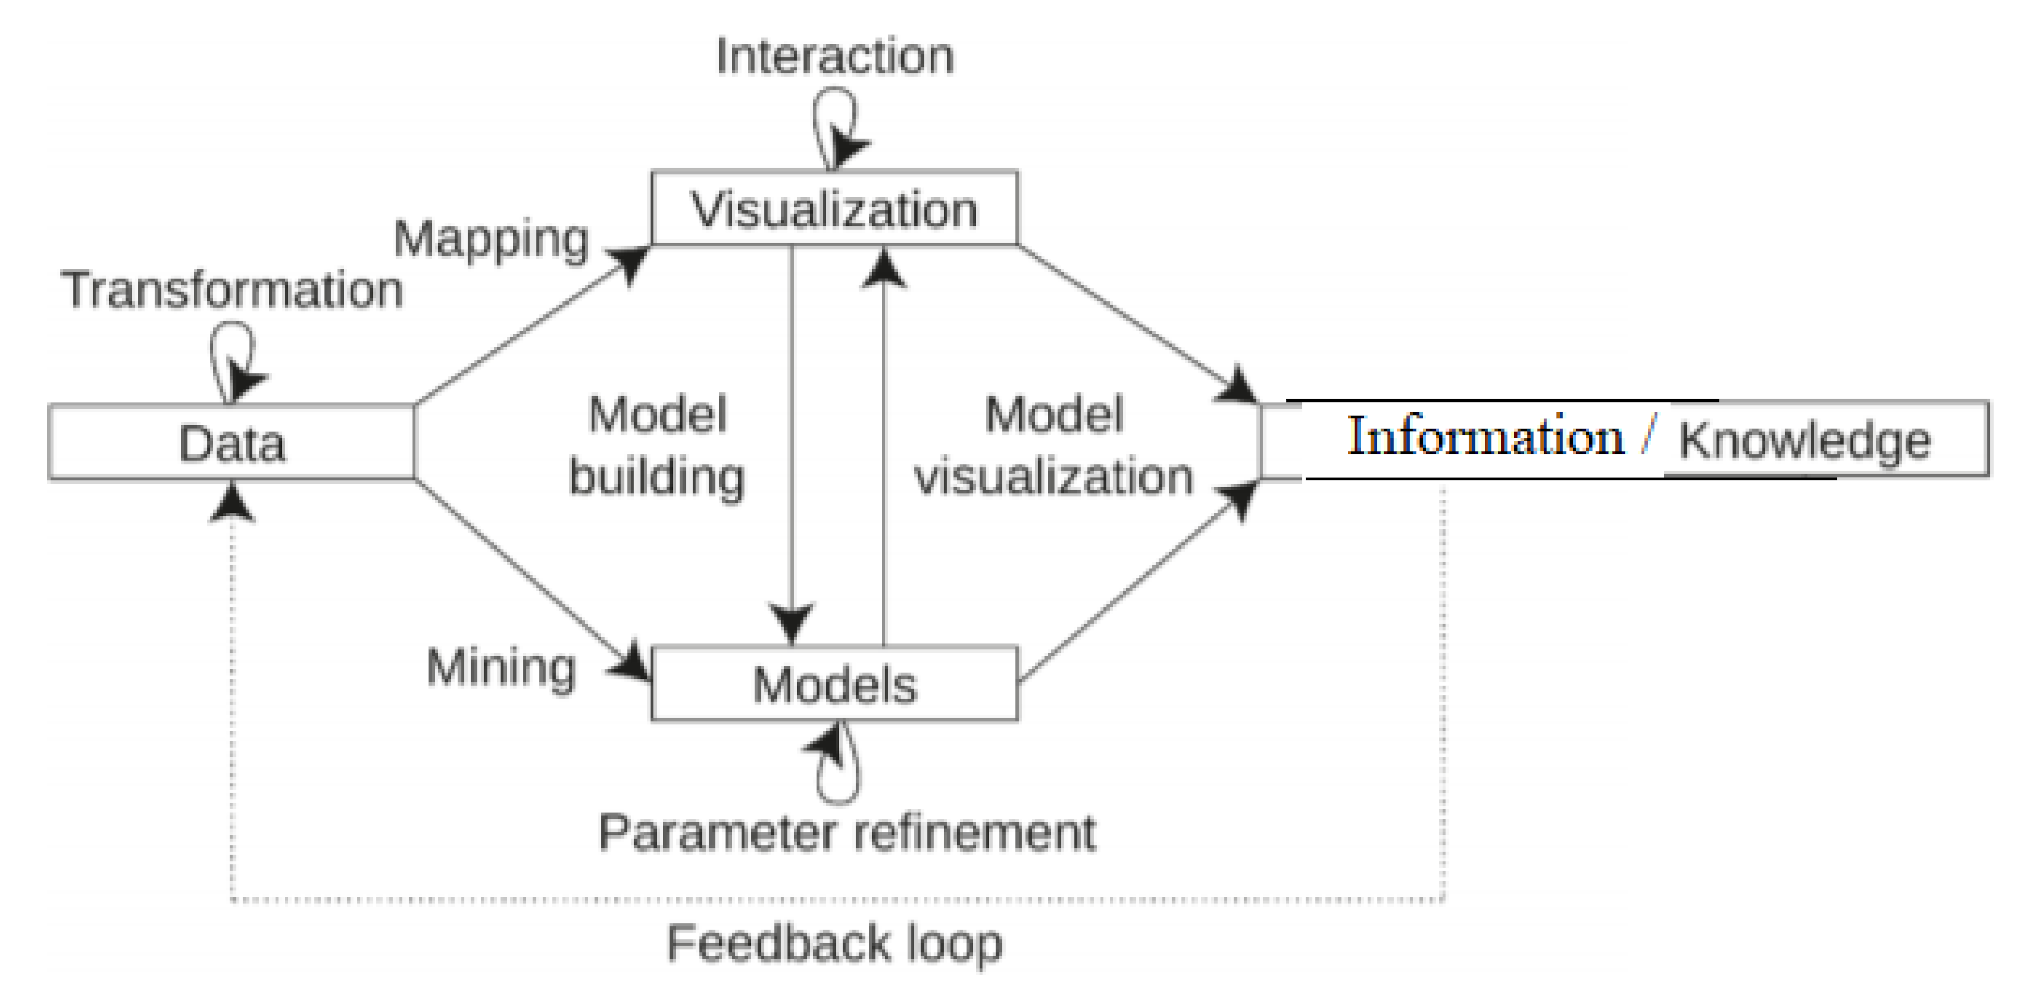
Various views extracted from the data model are visualized on demand (as shown in Figure 5). More than an information artifact, the concept of data visualization associated with analytical processing has led to Visual Analytics (VA) (Figure 7). The VA process includes the following stages: data, models, visualization, and information/knowledge.
As presented by Kohlhammer et al. [41], the VA process contains the following sub-processes: data transformation, data mining, data mapping, model building, model visualization, parameter refinement, interaction and feedback loop. Data extracted from data sources can be viewed in different visualizations. Due to the interaction with the user, the visualized information can generate new entities in the data model (Model building). Mining techniques and automated methods of exploring and analyzing data lead to models that are further visualized (Model visualization).
Nowadays, Visual Analytics processes are part of the BI&A framework. As a result, “Model building” and “Model visualization” stage transitions became two capabilities of the BI&A tools, having a major impact on both the “development of information” and the “use of information” in a Plan–Do–Check–Act business scenario.
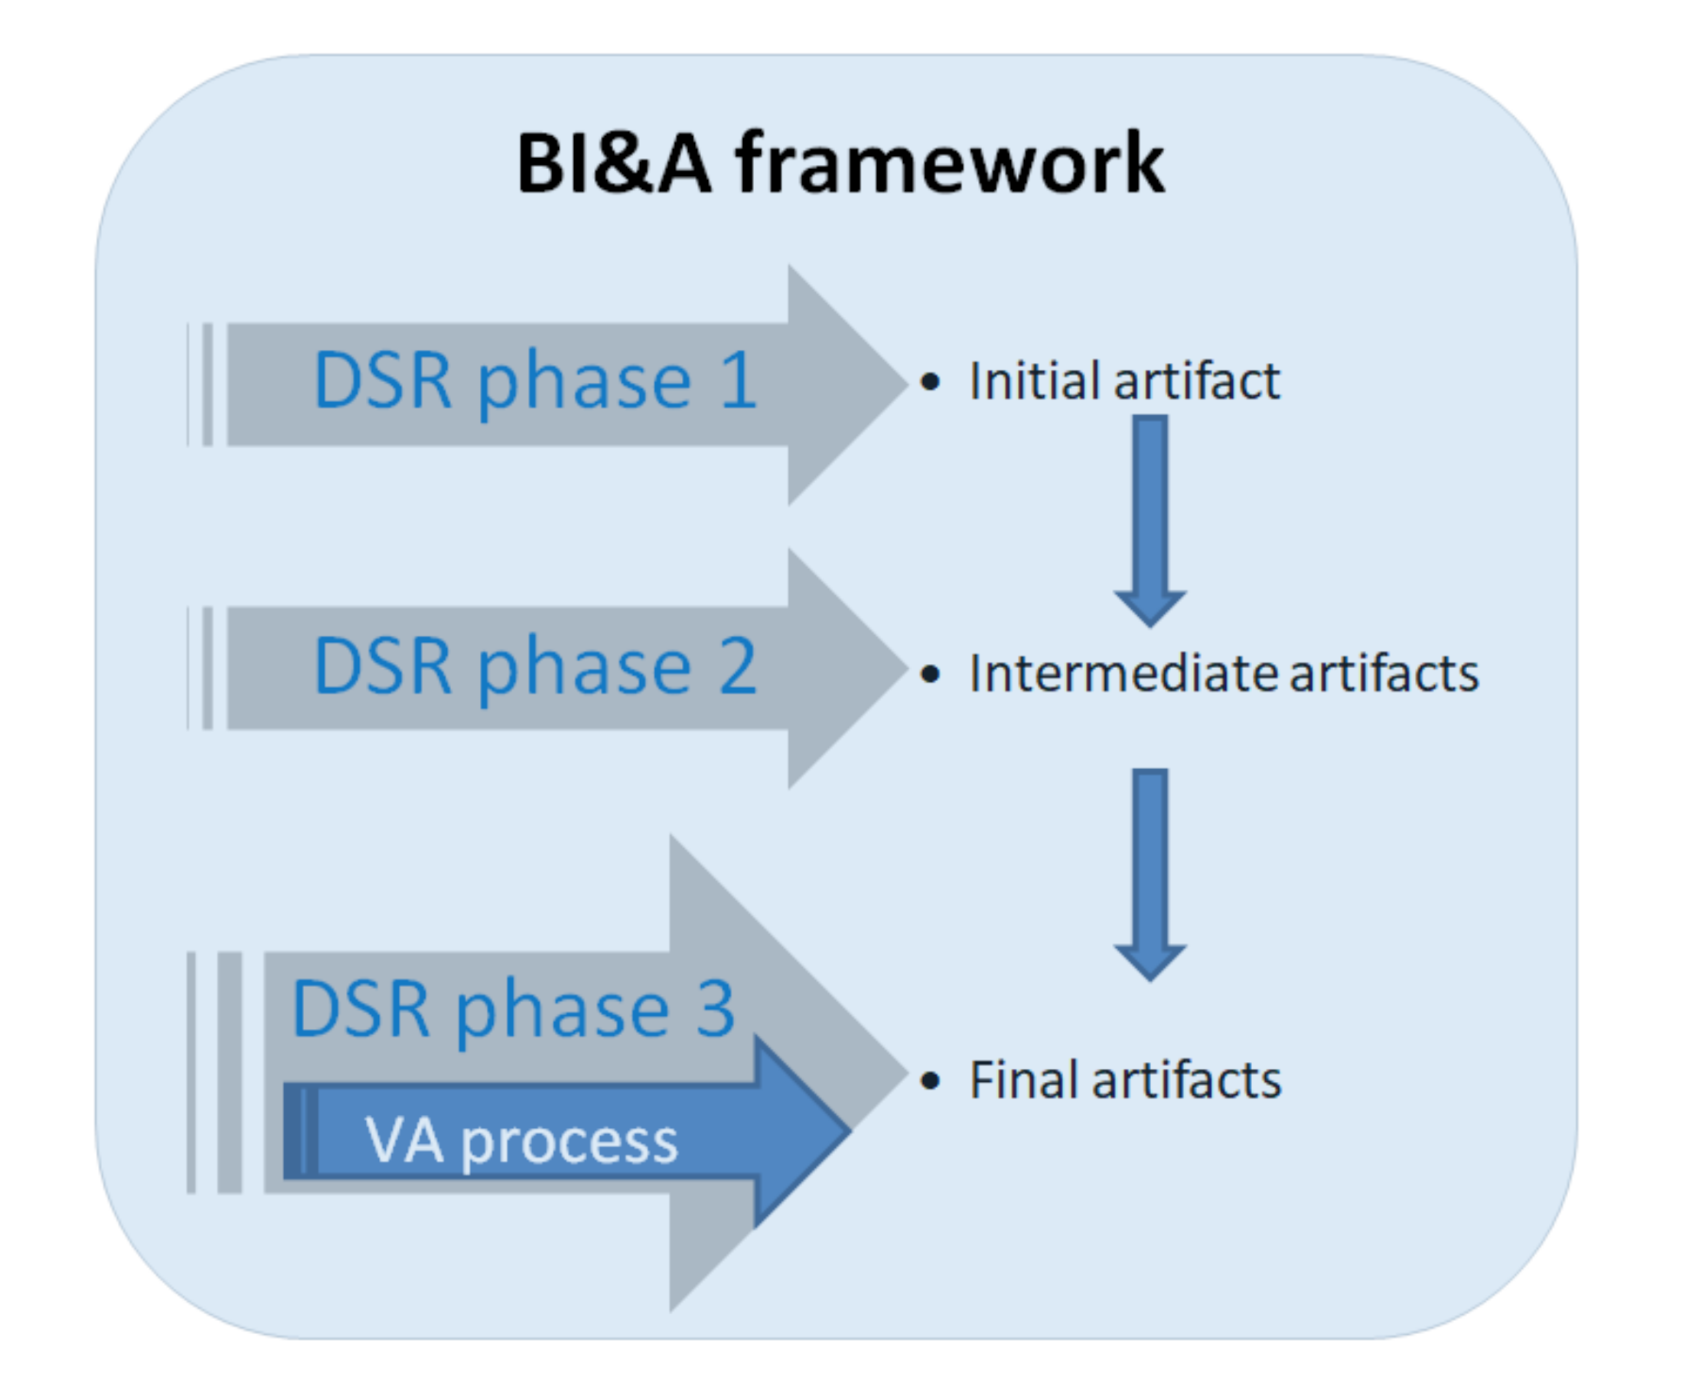
Returning to the data visualizations, they are realized in phase 3 of the DSR process during the VA process that is underlying design, development and evaluation in the last phase (see Figure 8).
This framework is applied to perform a clean and affordable energy data analysis. The indicators O2_1–O2_14 (see Table 1) are key elements of the data visualizations in a study case on Romania. The demarche comes in to sustain Hypothesis 3.
4. Clean and Affordable Energy Analysis in a BI&A Framework
Based on the previously presented theoretical aspects of the BI&A framework, we propose to develop the considered analysis according to the DSR process presented in Figure 6, therefore reinforcing our first and second hypothesis (Hypothesis 1 and Hypothesis 2) and proving the importance of the DSR process in conducting a clear and affordable energy analysis within the Business Intelligence & Analytics approach The information artifacts are modified through data processing from the initial ones to the final ones, ready for visualizations. Additionally, visualization controls are used to extend the modeling and the analysis.
SDG7 and SDG13’s selected indicators were traced in the Indicators for Sustainable Development in Romania (ISDR). Clean and affordable energy represents the objective O2 within the National Strategy for Sustainable Development-Horizons 2013–2020–2030. Twelve O2 indicators were used (described in Table 1). Additional data sources are needed to extend the approach. For example, the extension of O2_3 for the analysis of the electrical energy obtained from renewable resources implies the involvement of additional public data published by the National Energy System.
The roadmap of selected data from data sources to the final data model, and visualizations, are described in Table 2.
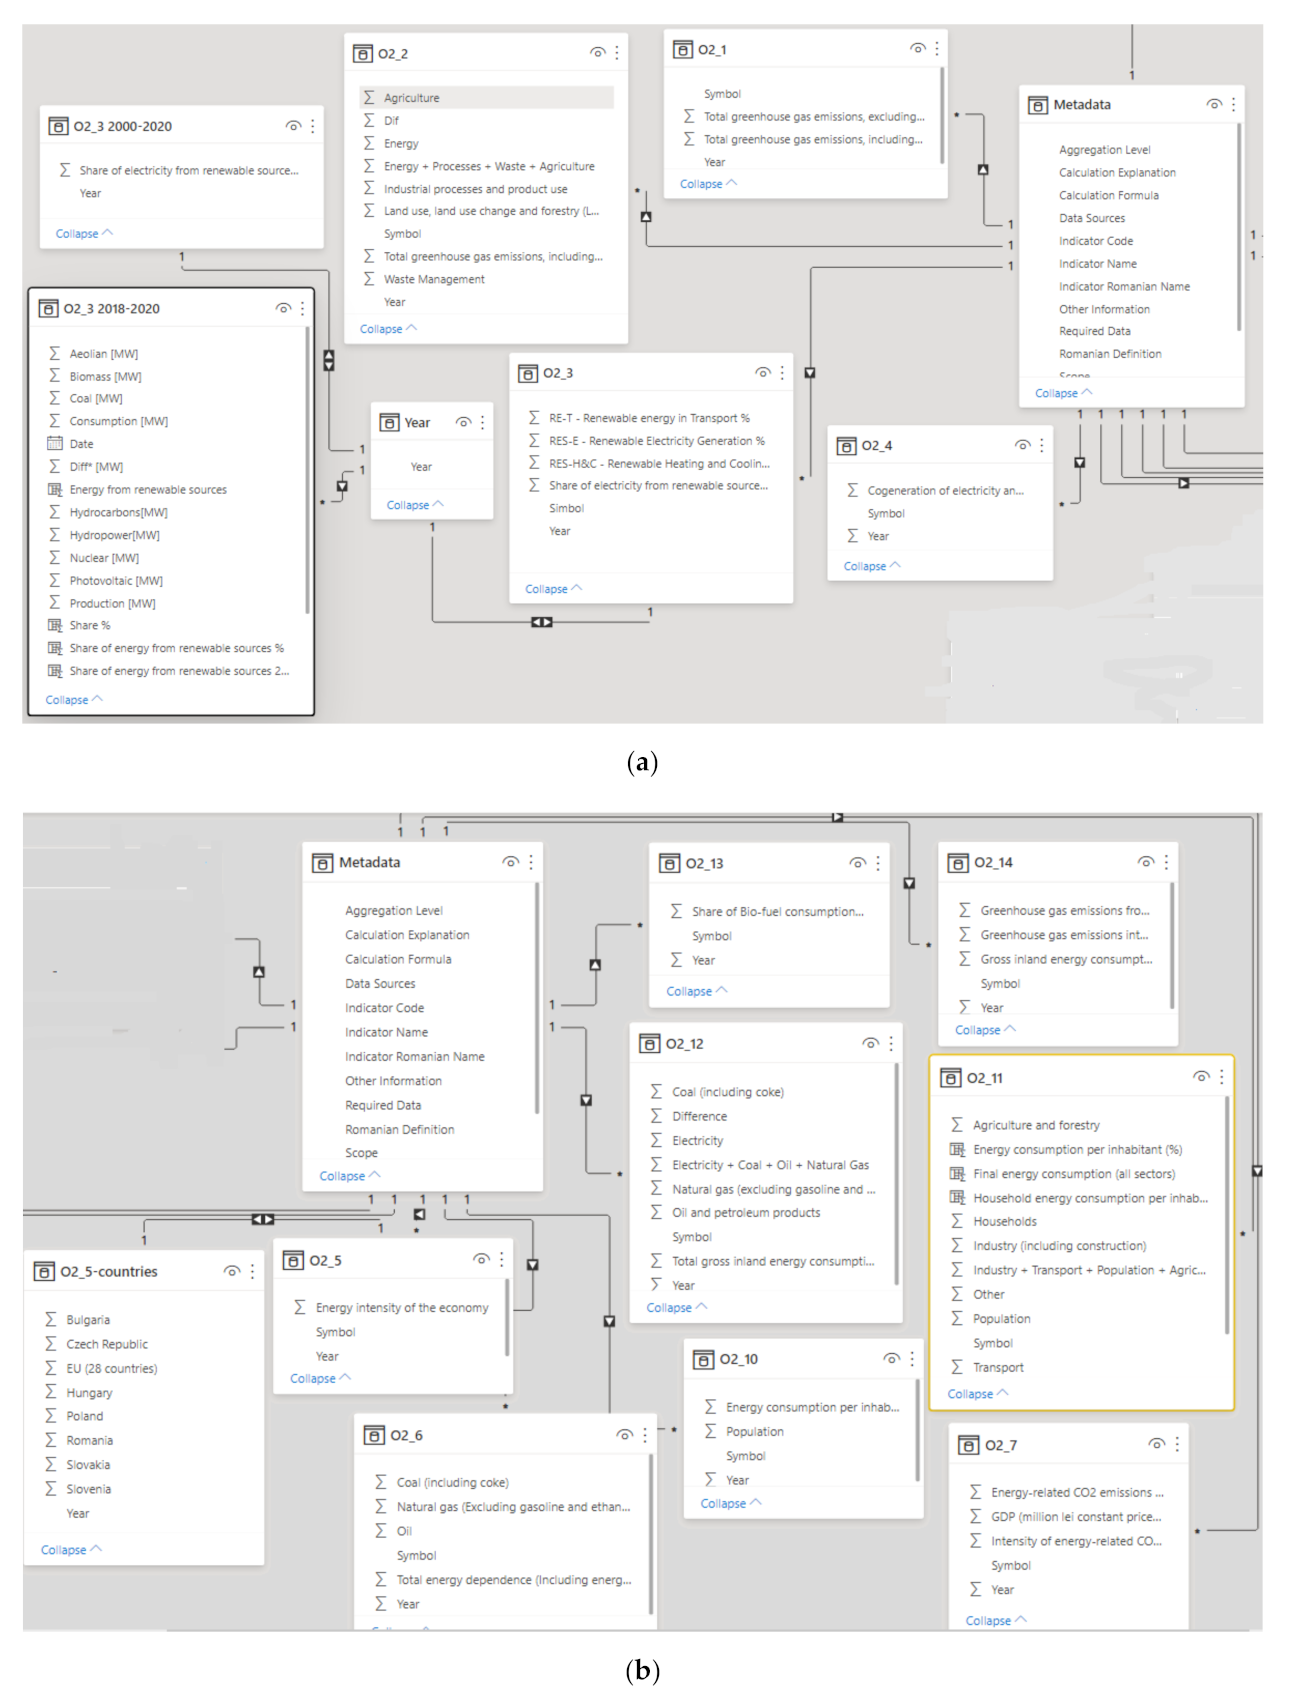
The different data entities, O2_1–O2_14, are connected by the ‘Metadata’ entity (see Figure 9a,b). The HTML table, containing detailed data about the produced and consumed electrical energy, extends the O2_3 dimension, allowing for a deep analysis. The last three years have been filtered from 2018 to 2020 (O2_3 2018–2020), which helps us to extend the analysis period beyond the time limit offered by the National Institute of Statistics.
The model is developed by adding calculated columns, measures and domain-specific performance indicators. Using Data Analysis Expression (DAX) language they are defined as shown in Formula (1).
The calculated columns ‘Renewable Electricity [MW]’ and ‘RES–E–Renewable Electricity Generation [%]’ and measure ‘M Obs’ are added to entity O2_3 2018–2020.
Both the “Model building” and “Model visualization” transformations, part of the VA process presented in Figure 7, have been implemented. Representative approaches and data visualizations were constructed using MS Power BI.
The required data visualizations for a clean and affordable energy data analysis allow the following:
- -
- Energy intensity analysis for East European countries;
- -
- Total energy consumption analysis for Romania;
- -
- Electrical energy from renewable resources analysis for Romania. Indicator forecast;
- -
- Detailed analysis of the electrical energy production;
- -
- Greenhouse gases emissions by sector analysis;
- -
- Intensity in CO2 of energy consumption anlysis;
- -
- Final energy consumption by sector analysis.
4.1. Findings and Results Based on Model Visualization Transformations
Our last hypothesis (Hypothesis 3), regarding data visualizations being strengthened by the rigorousness and systematization of the DSR process, is proven below within the discussion of the findings and results of our analysis.
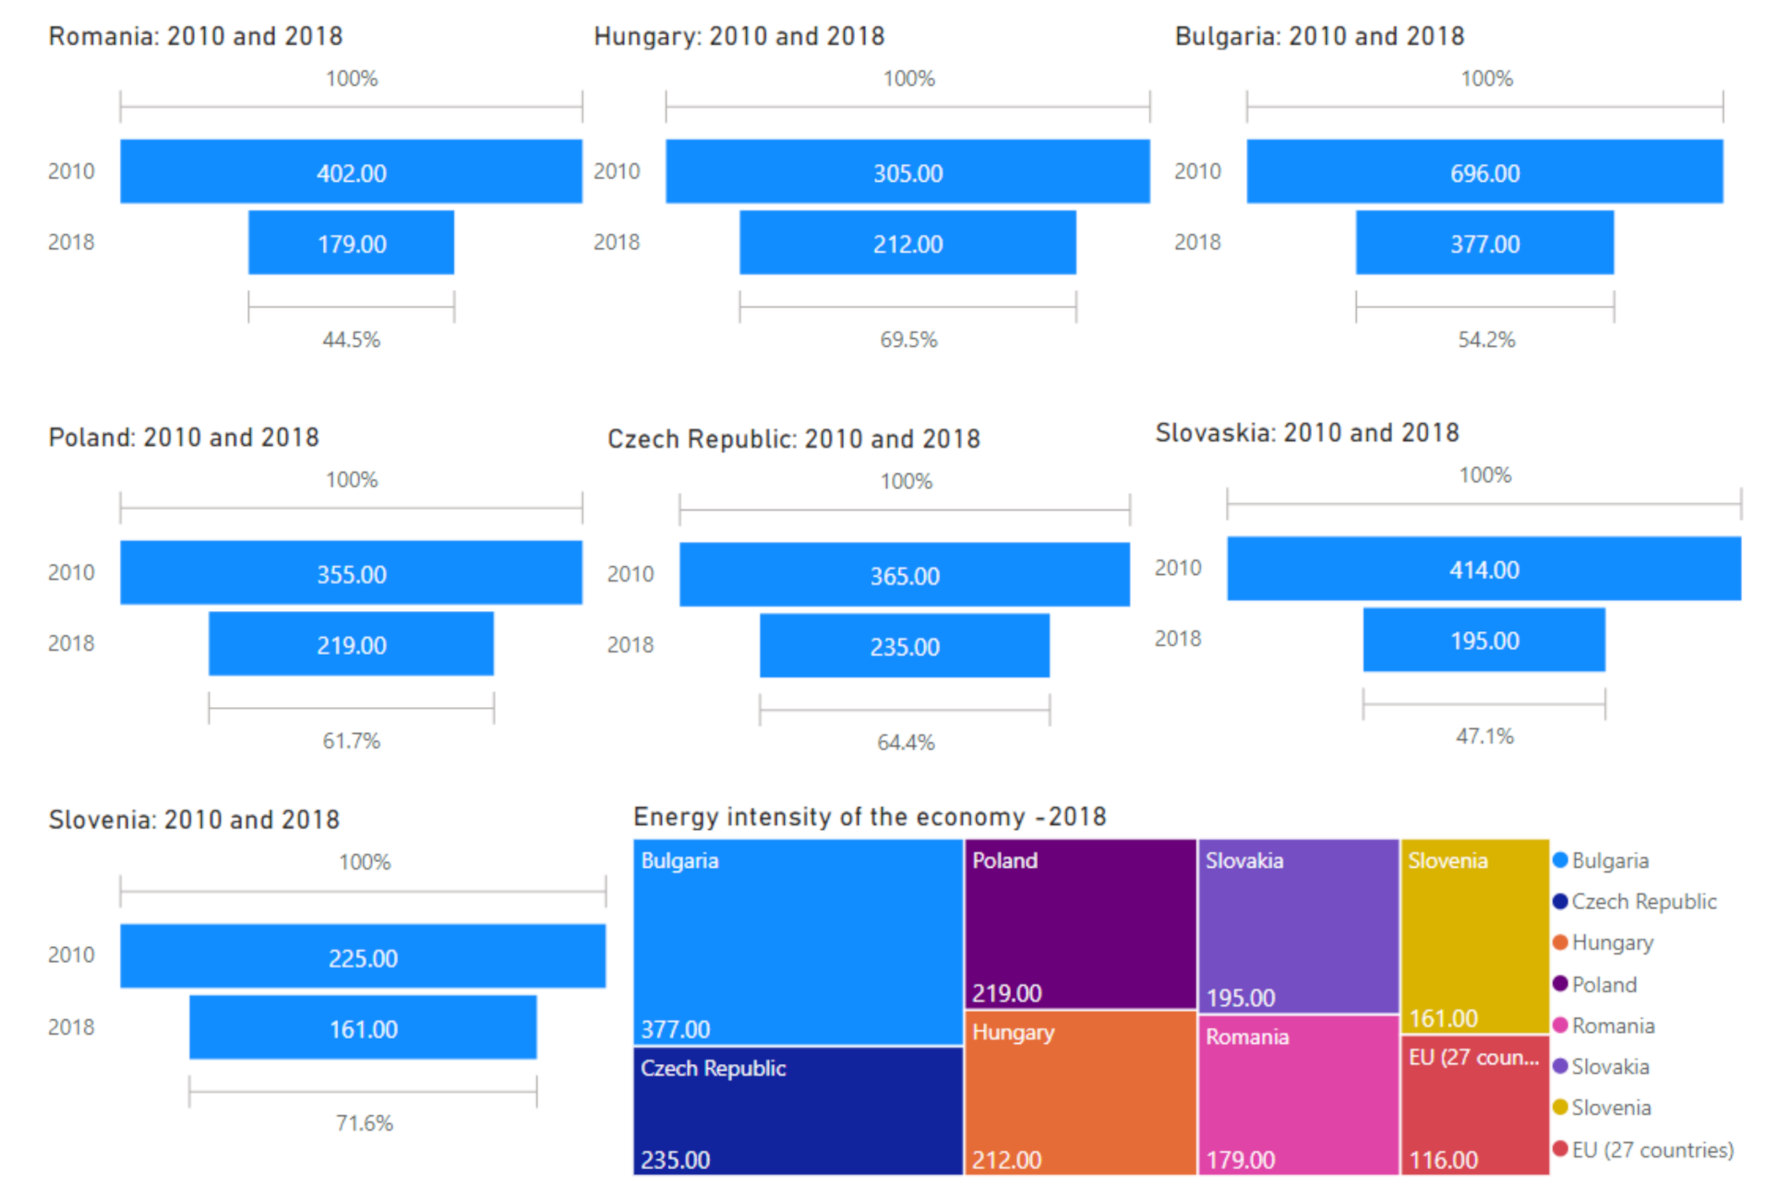
“Model visualization” for O2_5 indicator compares the energy intensity of the Romanian economy with Central and East European countries, i.e., Hungary, Poland, Czech Republic, Slovenia, Slovakia and Bulgaria (see Figure 10). The indicator represents the amount of energy needed to produce a unit of GDP (kgep/EUR 1000).
For all seven Central and East European counties, the indicator has registered a decreasing value along the timeline, but this is still remaining over the EU-27 average. Romania has reduced its annual energy consumption to 44.5% of the initial one recorded at the beginning of the analyzed period. A gauge visualization control is allocated to each country to reflect the made progress. All together are displayed as a set of nested colored rectangles in a treemap visualization. Countries such as Slovenia (161.00 kgep/EUR 1000), Romania (179 kgep/EUR 1000) and Slovakia (195.00 kgep/EUR 1000) are close to the European average of 116 kgep/EUR 1000. Bulgaria (377.00 kgep/EUR 1000), on the other hand, is far from the European average, although it has seen a significant reduction in energy consumption (up to 54.2% from initial energy consumption).
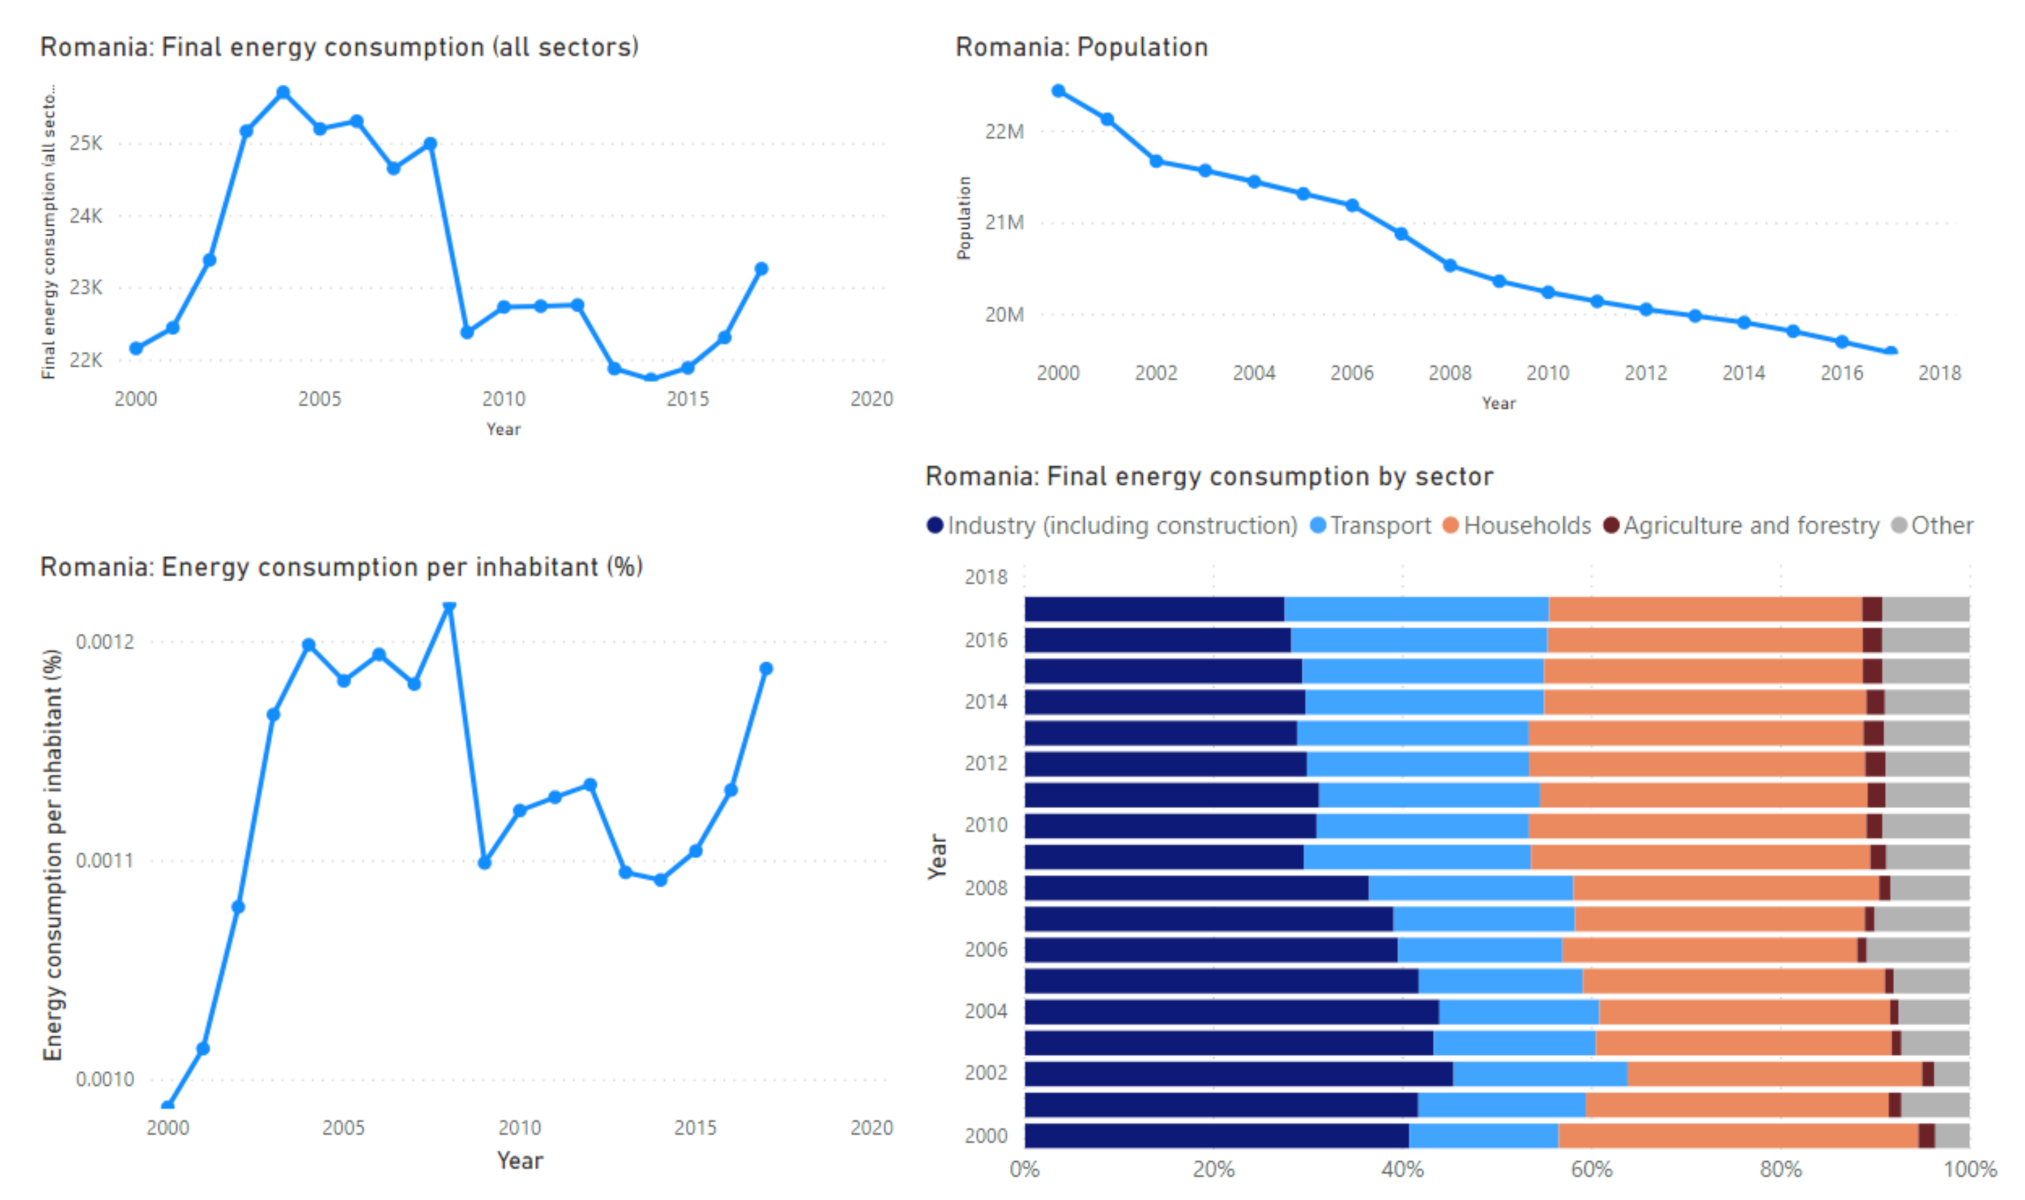
O2_11 indicator refers to the annual total energy consumption and relates it to the country’s population, resulting in the energy consumption per capita (see Figure 11). Line chart visualizations display the evolution over time. Romania’s population declined constantly in the last few decades, generating different influences in energy consumption, which are very fluctuant over time until 2014.
Encouragingly, in the last four years of the considered timeline, although the population decreased from 19,916,451 to 19,588,146 inhabitants, the general annual energy consumption (all activity sectors) increased from 21.736 to 23.269 thousands TOE. We recommend a stacked bar chart to visualize the contribution of each sector (agriculture and forestry, industry including construction, transport, population consumption, other branches of the economy) in the total annual energy consumption. The industry sector leads, followed by the consumption of the population.
With a degree of household consumers’ connection to the electricity distribution network of over 96%, electricity is the most widespread form of energy in Romania [42]. However, Romania has the lowest electricity consumption per capita in the European Union, which is 2.6 times lower than the EU average (approximately 0.6 MWh/person/year compared to 1.6 MWh/person/year EU-27). On average, Romanian households spend 94 lei (≈EUR 20) per month on electricity. Given the low purchasing power of households in Romania, the affordability of the price is a major problem, which leads to a high level of energy poverty [42].
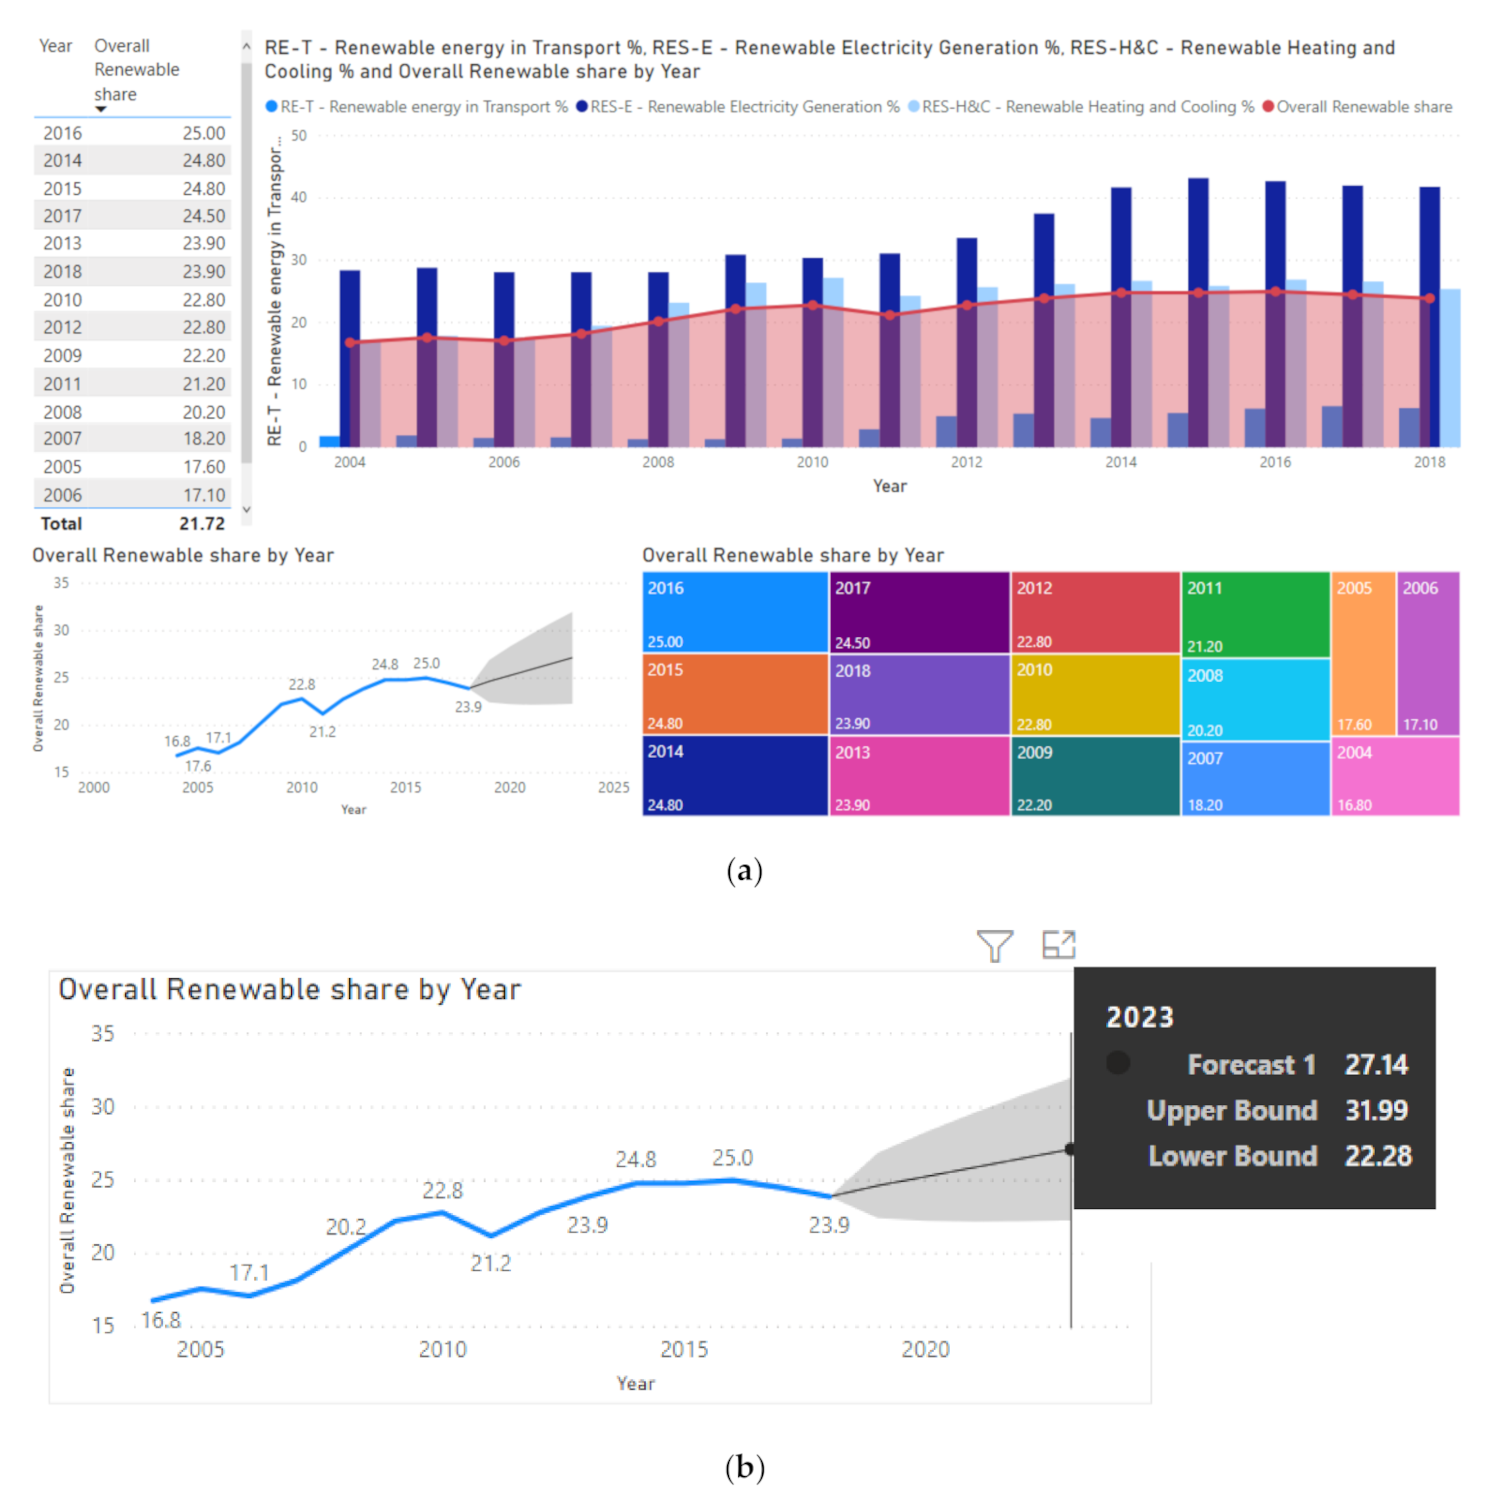
O2_3 indicator measures the electrical energy from renewable resources. The data schema presented in Figure 8a,b represent the data artifact and support the analysis of the electrical energy produced from various renewable resources over a period from 2004 to 2020 (see Figure 12a). O2_3, or the Overall Renewable Share (%), has an increasing trend, from 16.80% in 2014 to 23.90% in 2018. A forecast for the next five years indicates the renewable electrical energy’s upward trend, by 31.99% in 2023 (see Figure 12b).
The O2_3 indicator analysis also covers three sectors with the following specific indicators: RE-T—Renewable energy in transport (%); RES-E—Renewable electricity generation (%); and RES-H&C—Renewable heating and cooling (%). In the line and cluster column chart, line values correspond to the overall renewables share (%).
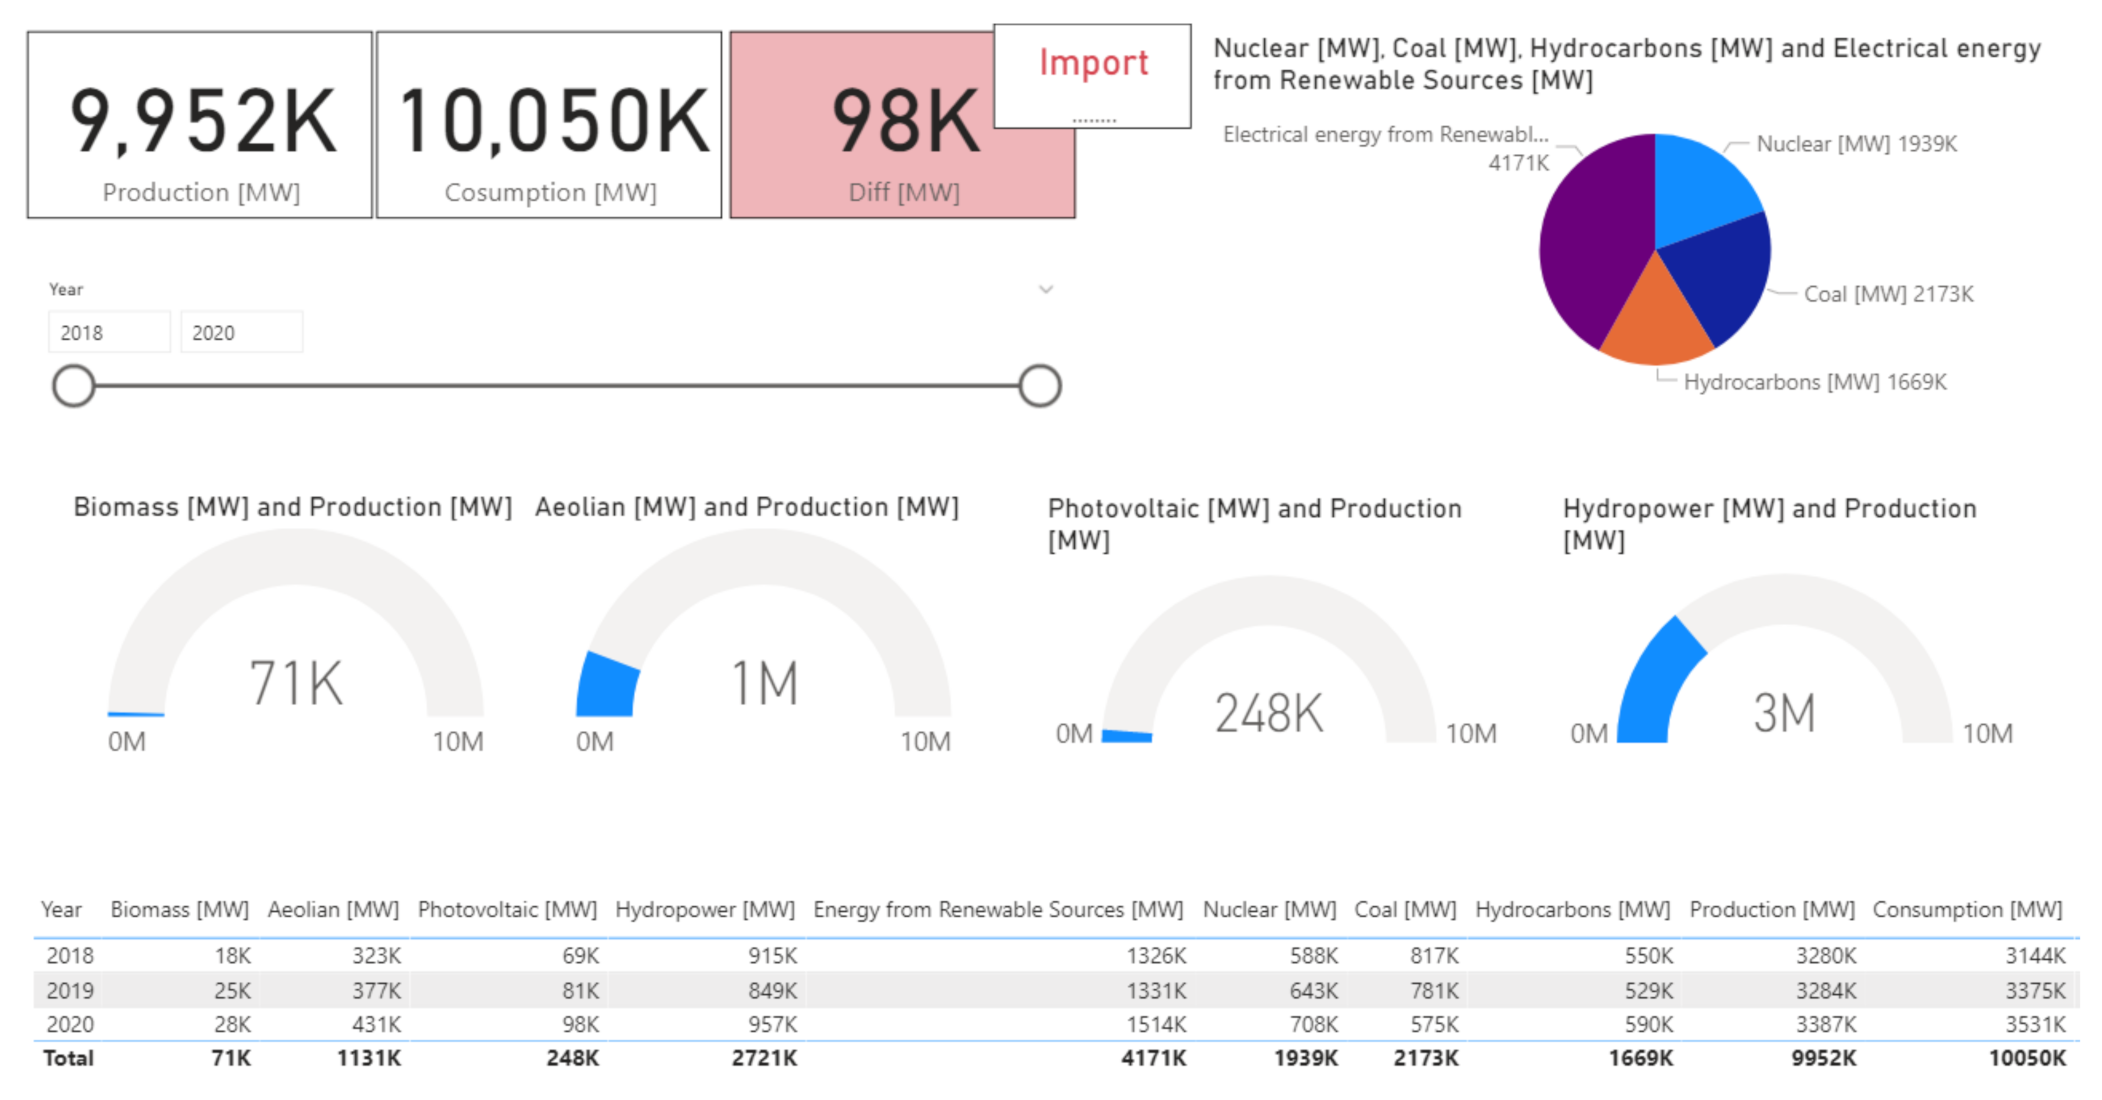
Detailed analysis of the electrical energy production reveals the important share of hydro energy (65.23%) in the total energy from renewable resources (see Figure 13). At the same time, it represents 27.24% of the total energy production. For the last three years (2018–2020), the visualization dashboard contains the following Key Performance Indicators: Total electrical energy production (MW), total electrical energy consumption (MW) and imported/exported energy, depending on the consumption. The timeline can be adjusted to a period of one or two years between 2018 and 2020. In the last three years, an import of 98,424 MW was necessary to cover the energy consumption.
Regarding the share of renewable energy in the gross final energy consumption, The European Parliament and Council provisionally agreed on a share of energy from renewables of at least 32% of the Union’s gross final consumption in 2030, with an upwards revision clause by 2023.
Romania is among the UE countries that have reached their target on “the rate of renewable energy” in 2020 [43]. Looking at the renewable energy sources data and evolution in Figure 13, there are constant growths for wind, photovoltaic, and biomass, while hydro keeps the same elevated values and dominates constantly. There is still an important potential for these sources, and Romania plans to strengthen the sustainability of bio-energy and promote innovative technologies.
4.2. Model Building Transformations
Two visualization controls with strong analytical capabilities are used to perform advanced analysis and to enrich by adding value to the information artefact, namely, key influencers and SCATTER for clustering.
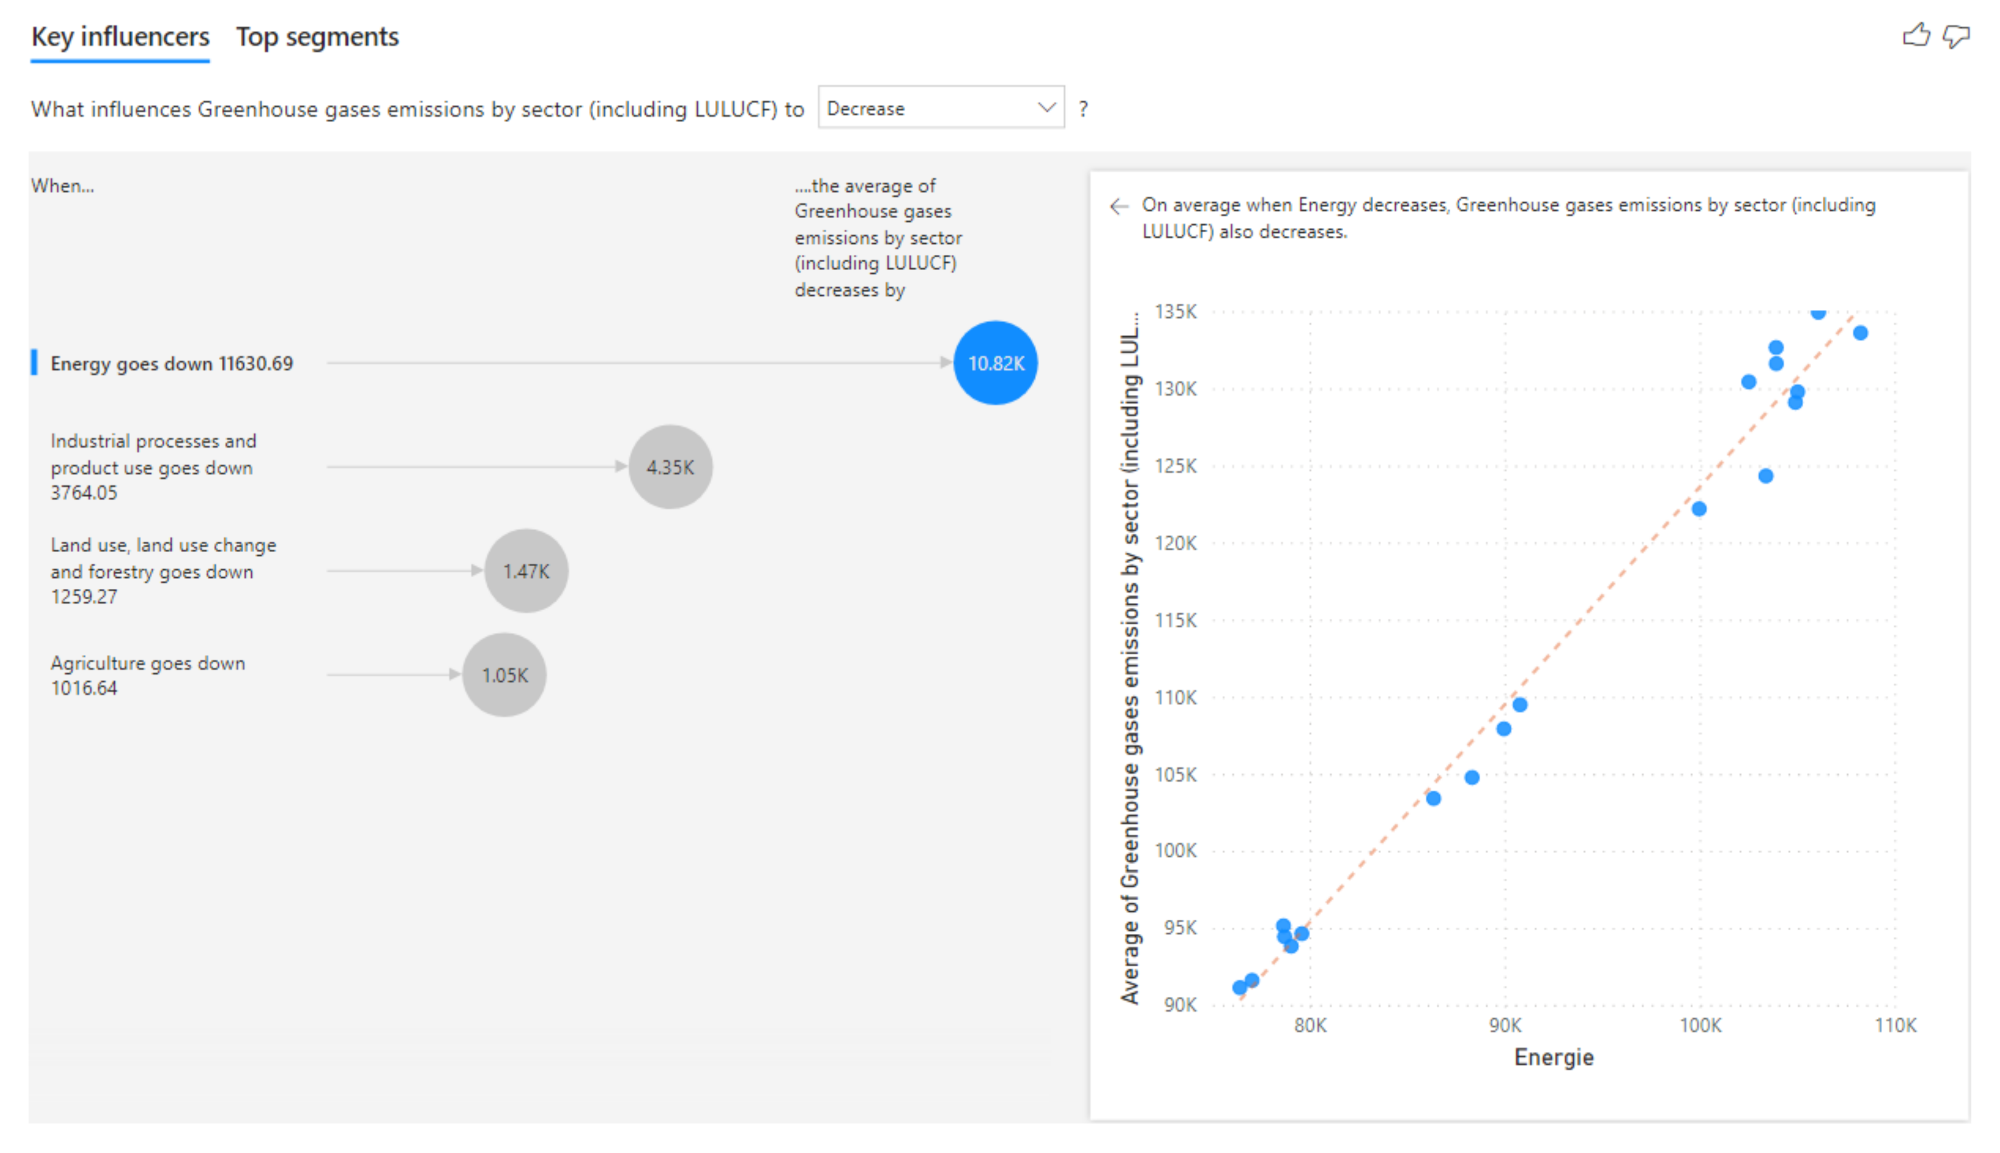
O2_2 Indicator (Greenhouse gases emissions by sector) is analyzed considering the key influencers. The decreasing of the indicator values is determined as follows (see Figure 14):
- -
- --when “Energy” goes down, for example, a fall in energy by 11630.69 leads, on average, to a 10815.95 unit fall in “Greenhouse gases emissions by sector”, including LULUCF. This influencer contains approximately 100.00% of the data;
- -
- --when “Industrial processes and product use” goes down. For example, a fall in “Industrial processes and product use” by 3764.05 leads, on average, to a 4345.85 unit fall in “Greenhouse gases emissions by sector”. This influencer contains approximately 100.00% of the data;
- -
- --when “Land use, land use change and forestry” goes down. For example, a fall in “Land use, land use change and forestry” by 1259.27 leads, on average, to a 1472.40 unit fall in “Greenhouse gases emissions by sector”. This influencer contains approximately 100.00% of the data;
- -
- --when “Agriculture” goes down. For example, a fall in “Agriculture” by 1016.4 leads, on average, to a 1048.60 unit fall in “Greenhouse gases emissions by sector”, including LULUCF. This influencer contains approximately 100.00% of the data.
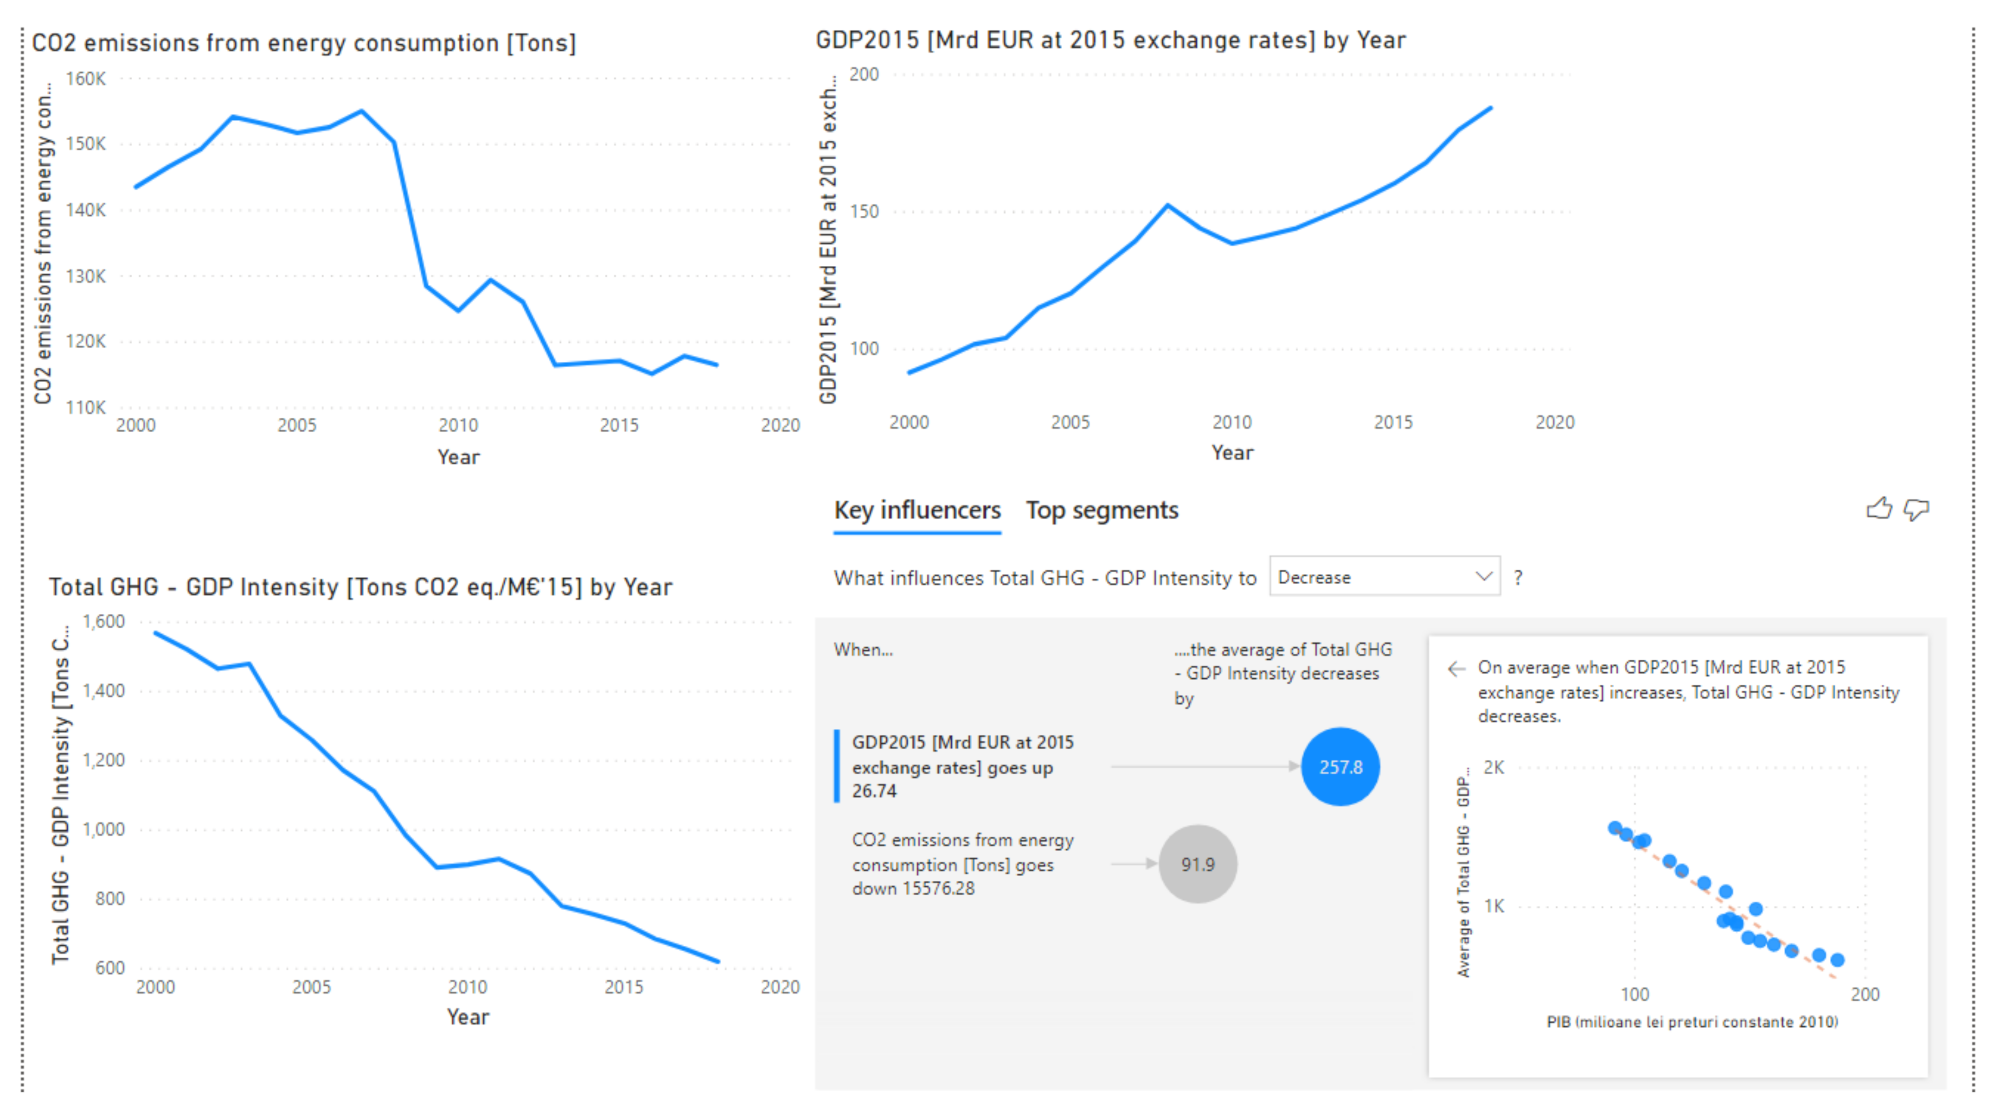
O2_7 Indicator, Intensity in CO2 of energy consumption, shows a decrease in the analyzed period (see Figure 15). This evolution is determined by the increase in the GDP and by the decrease in CO2 emissions.
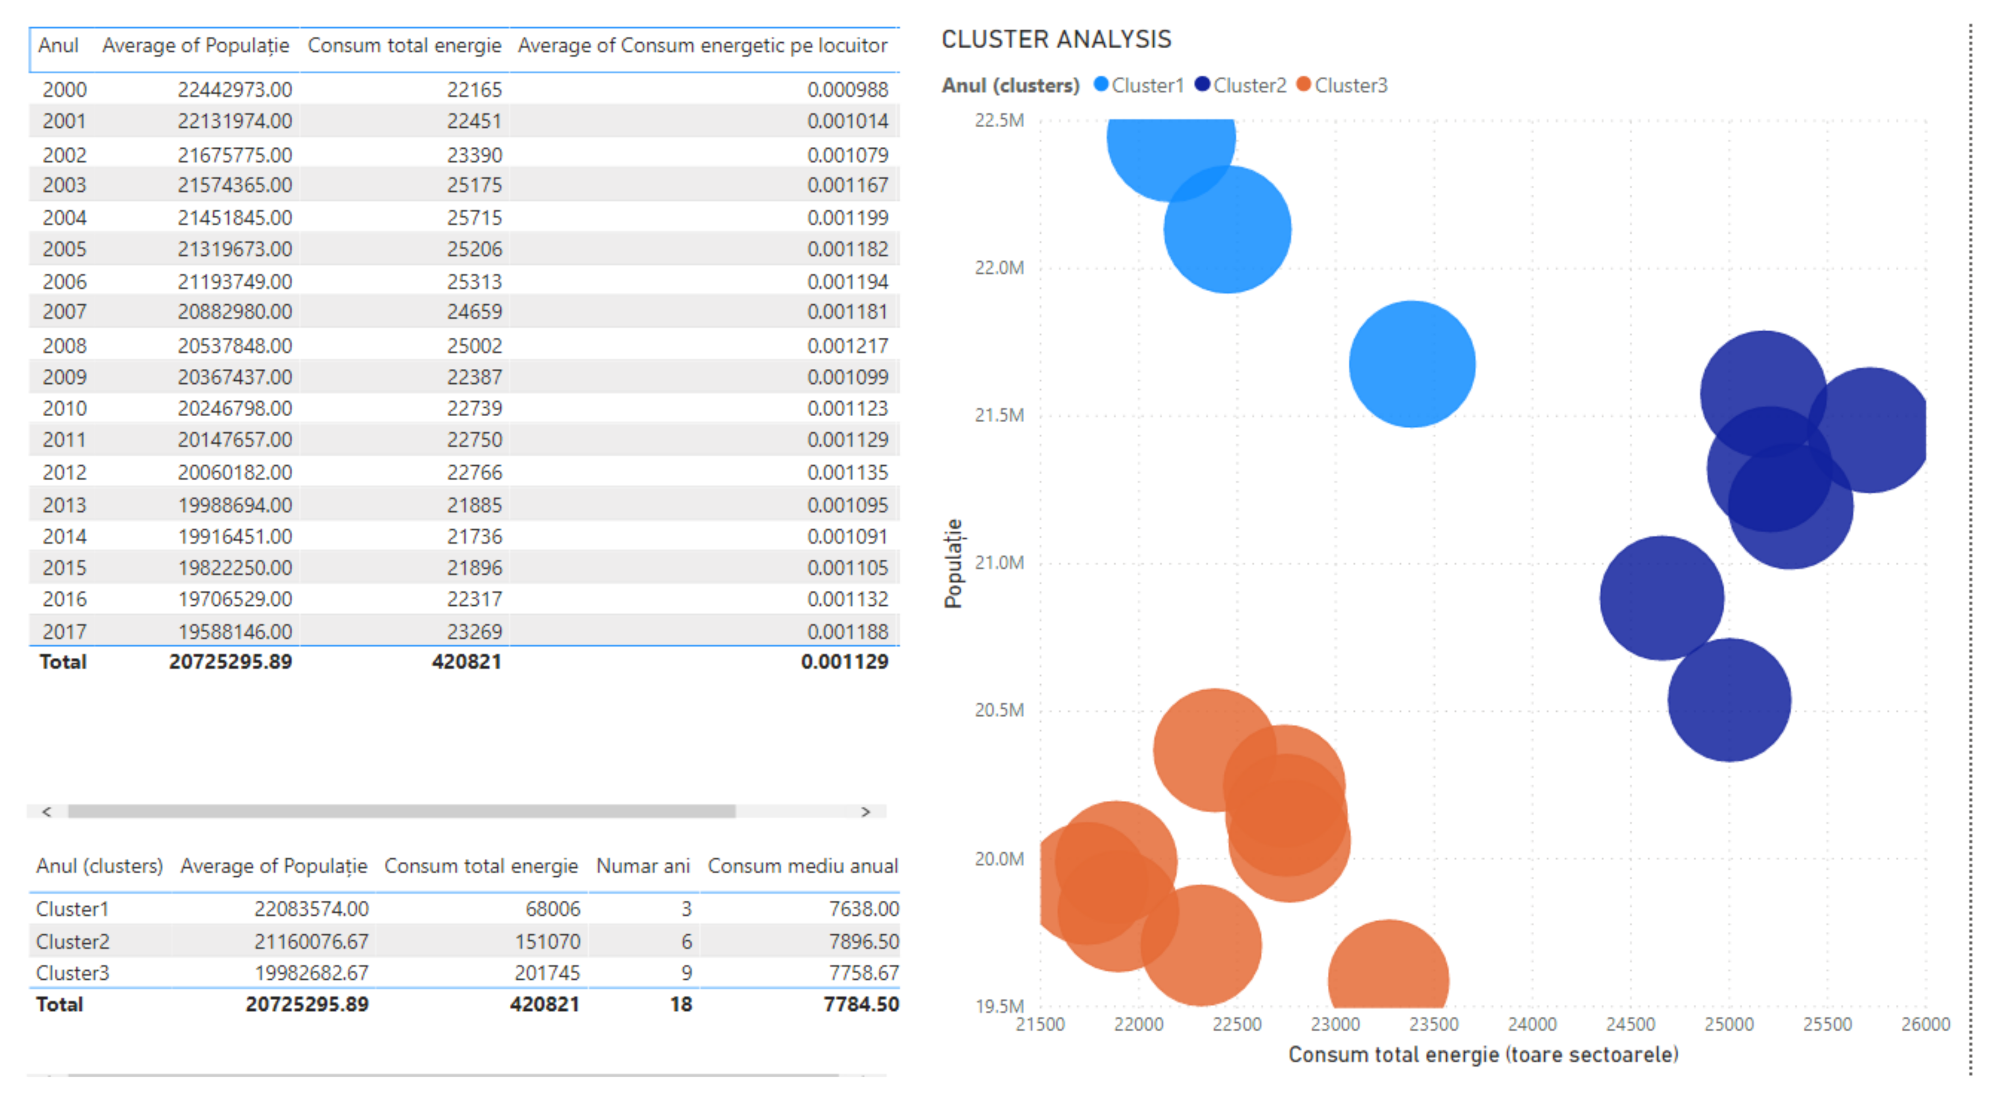
O2_11 Indicator, Final energy consumption by sector, is analyzed within a clustering approach (see Figure 16). Clustering is the process of organizing data from an unstructured collection into groups called clusters whose members are similar in some way. The quality of clustering refers primarily to the homogeneity within the groups and the separability between the groups resulting from the clustering process. Similarity is the metric that reflects the fit or strength of the relationship between two data, two strings of text, or features.
Clustering needs a similarity function to measure how similar two data are, or alternatively, a distance (dissimilarity) function to measure the distance between two data. The most widely used partition algorithm is the k-means algorithm [44], which has become the exponent of an entire category of algorithms.
The dataset contains the annual values of energy consumption and population. Applying the k-means algorithm, similarities have been identified in the first three years, from 2000 to 2002, in the next six years, from 2003 to 2008, and in the last nine years, from 2009 to 2017 (see Figure 16). Three clusters have been created.
For each cluster the following measures are defined: average population, total energy consumption and average annual energy consumption.
In the last phase of the DSR process, with the help of VA methods, the data visualizations formulated as requirements were designed. The demarche was completed in the framework presented in Figure 8. Hypothesis 3 is therefore true.
5. Discussion and Results
Design Science Research provides the necessary approaches to design contemporary information systems solutions. The benefit brought by DSR to information system design is the introduction of rigor in designing innovative artefacts with respect to the nature of the IS research outputs [45].
The Business Intelligence & Analytics framework is able to transform data into a valuable insight that is delivered on demand to business users. It is a framework of value creation using analytical tools. The framework implies people, processes and technologies, and allows variate business analysis from descriptive and diagnostic ones, to predictive and prescriptive ones. Our first contribution is to bring the DSR process together with the BI&A value chain (see Figure 6). Only a few references have been identified treating the contribution of DSR to Business Intelligence &Analytics approaches [38,46]. The process of developing the final information artifact starts with problem identification and motivation, and setting the objectives of the solution. The information artifact goes through several phases of development, from an initial form to the final one. In each phase of development, the information artifact goes through design, development and evaluation (Table 2), as follows:
- -
- phase 1—Design and development, evaluation and communication of the initial artifacts (data source, selected data, preprocessed data);
- -
- phase 2—Design and development, evaluation and communication of the intermediate artifacts (initial data model, enriched model with calculated columns, measures and performance indicators);
- -
- phase 3—Design and development, evaluation and communication of the final artifacts (final data model, data visualizations).
A second contribution concerns the Visual Analytics process [41]. Both the Model building and Model visualization transformations are implemented using the MS Power BI tool. Visual Analytics is a multidisciplinary field in which interactive visual interfaces are used to support analytical processing and reasoning [47]. Interactive visualizations combined with automated analysis techniques sustain decision making [20]. Data visualizations, as final information artifacts, are realized in phase 3 of the DSR process during a VA process that underlies the Design, Development and Evaluation in the last phase (see Figure 8).
The theoretical considerations are applied to design a clean and affordable energy analysis with completion in a case study on Romania. Based on the public data posted by the National Institute on Statistics, the EU Commission, DG Energy, Unit A4 and the National System of Electrical Energy, we propose the synthesis in Table 1. Information, such as indicator code, indicator name, definition, unit of measure, scope, symbol, calculation explanation, calculation formula, required data, data sources, aggregation level and other information, are included in Appendix A. Table 1 together with Appendix A have been designed so that they can be fully transferred to the O2_model.
Our third contribution consists of the data model proposal (see Figure 9a,b). Table 1 integrated with Appendix A becomes the metadata entity of the information artifact being linked to all the other entities of the model. The relationships between entities are defined mainly on the basis of the symbol field. The information artifact can be easily applied to another country’s case study.
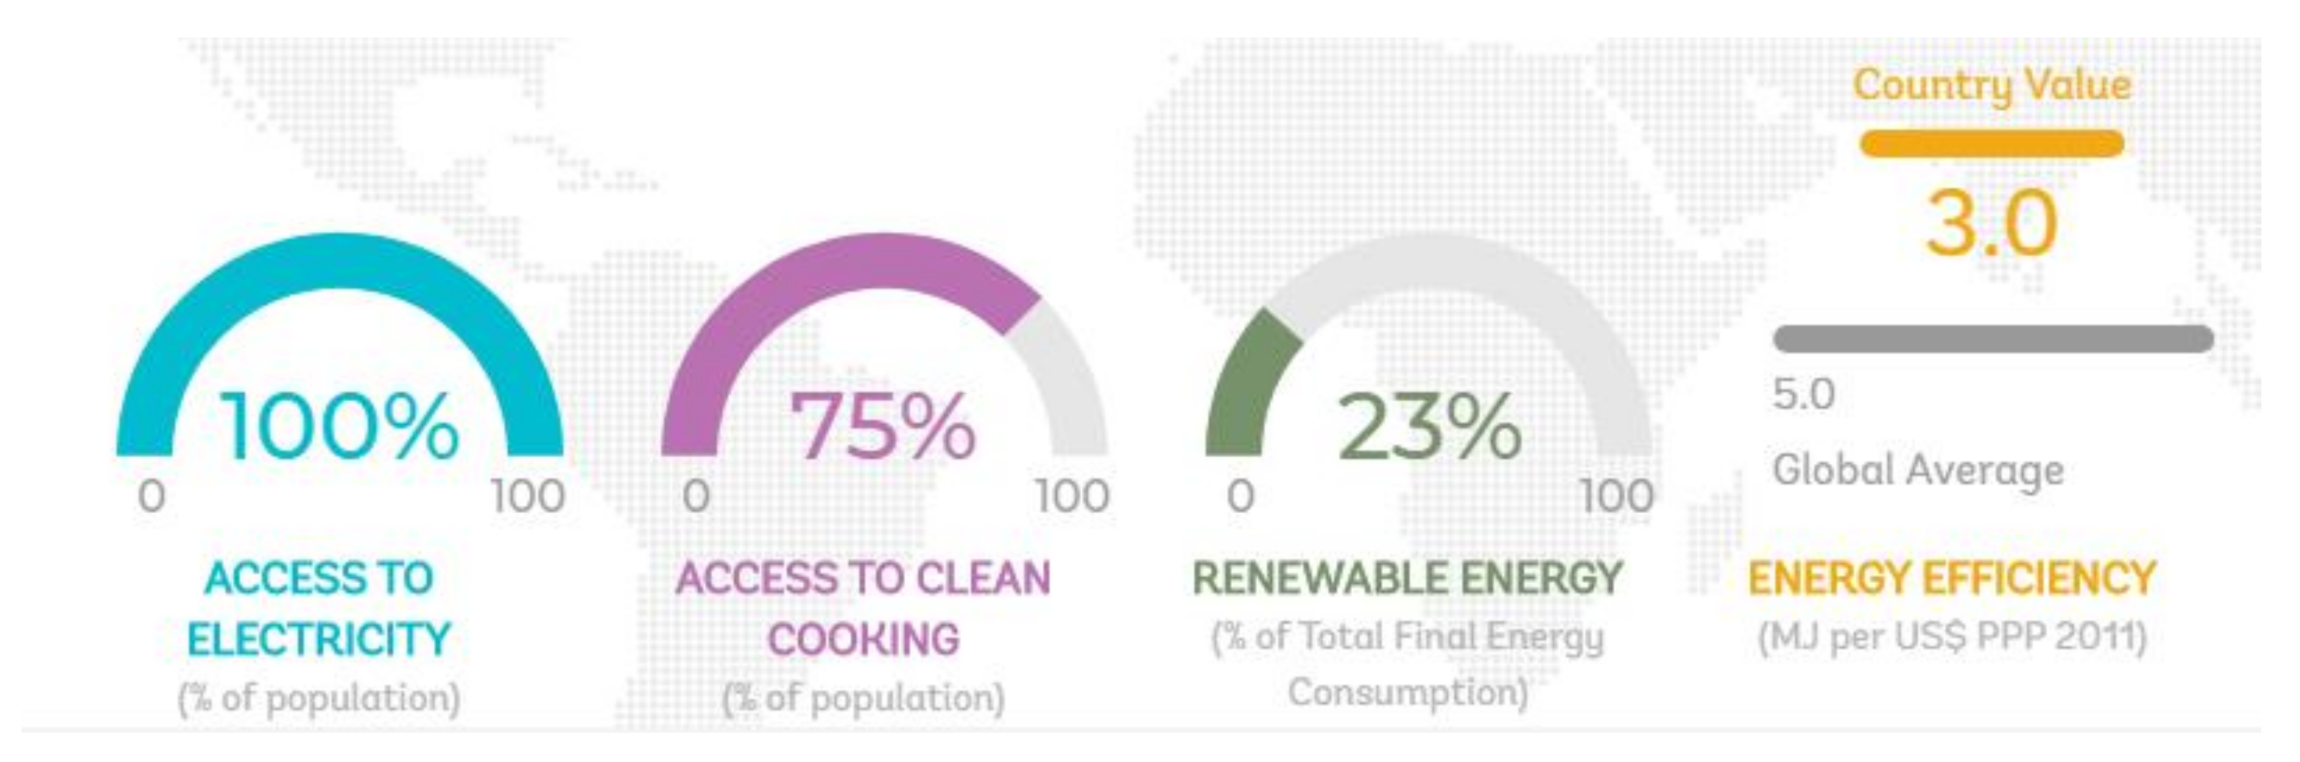
Clean and affordable energy analysis for Romania is anchored in the European context. Our fourth contribution is related to the benefits of our analysis in composing an image of the Romanian position within the European effort towards achieving the strategic goal of becoming “the world number one in renewables”. The composed analysis in this paper was based on the meticulous selection of relevant indicators. SDG7’s target and indicators represent the origin, but we have chosen to enlarge the scope by taking into account its tight connection to climate change. In this respect and in correlation with the Romanian National Strategy for energy, we have examined the SDG13 energy-related indicators. We also take into account the actual values of the SDG7 (see Figure 17) and SDG13 indicators for Romania, and emphasize the aspects wherein efforts are still necessary to achieve the proposed targets. Therefore, the investigation is built around indicators describing renewable energy, energy efficiency, energy consumption and greenhouse gases emissions per sector.
The selection of indicators targets the sustainable aspect of energy and comes from a wide literature review, adding the specifics of Romania’s National Strategy for Sustainable Development, and taking into consideration the influences and trade-offs between energy targets and climate actions.
In this respect, Romania’s National Strategy for Sustainable Development asserts “The country’s approach to reach the average level of EU-27 is achieved by pursuing national objectives on sustainable development”. By 2030, Romania aims at “the alignment with the EU’s average performance on energy and climate change indicators; fulfilling the commitment in the field of greenhouse gas emissions, in accordance with the community agreements and implementing measures to adapt to the effects of climate change”, [49] (p. 106).
Coagulated into a unitary system, the selected indicators give a well-defined picture of the energy system, including interlinkages and trade-offs among various dimensions of sustainable development. Relevant model visualizations and building transformations have been presented. The following positions in Table 1 are examples of the development of the practical discourse: Greenhouse gases emissions by sector (indicator code: O2_2); share of electricity from renewable sources in the total electric power (indicator code: O2_3); energy intensity of the economy (indicator code: O2_5); intensity of energy-related CO2 emissions (indicator code: O2_7); and final energy consumption by sector (indicator code: O2_11). Using “Model building” and “Model visualization” transformations, the performed exploration demonstrates the power of BI and analytics for in-depth analysis, comparative analysis, and forecasting.
Our results demonstrate that Romania developed a proper strategy for clean and affordable energy with satisfactory results and promising groundwork for future advancement, e.g., Romania has already achieved the targets set by the EU “20-20-20 strategy”. Additionally, Romania may contribute to the European Union’s energy security strategy, having a balanced energy mix and a very good position in the energy independence objective. Romania has a moderate dependence on unique sources of energy supply from imports; it has a reasonable and flexible energy mix, as well as the potential of an energy transit country.
One rather low-standing indicator is energy efficiency, which was addressed with a National Action Plan for energy efficiency started in 2015. Our results show good progress in the analyzed period, and indicate that it was determined by the increase in the GDP and by the decrease in CO2 emissions. We consider it a strong premise for the objective of sustaining this trend because it directly influences economic competitiveness and limits the negative environmental effects associated with energy use.
In the same respect of sustainability, we have analyzed in-depth the data related to renewable energy. The EU energy strategy envisions global leadership on renewables, for which the strategy has set an ambitious “target of 32% for renewable energy sources in the EU’s energy mix by 2030” ([50]. Romania has been reaching the 2020 EU target since 2008, and has had an upward trend since then. Although the trend line shows a slow-down in the rate of renewable energy use, this area will unquestionably grow owing to the direct relation with climate change and energy security on one side, but also due to the economic contribution (more jobs and new investments attracted).
6. Conclusions
The future of humankind is strongly dependent on energy sources, and governments from all over the planet are committed to taking action for sustainable global development.
Energy is the sector most strongly connected with climate change moderation, and numerous papers investigate their correlation and interdependency, especially as regards renewable energy and sustainability issues.
In this respect, we have built a research framework based on Business Intelligence & Analytics for monitoring the SDG7 indicators that aim to “Ensure access to affordable, reliable, sustainable, and modern energy for all” in relation with the SDG13 indicators targeting the sustainable aspect of energy.
The Business Intelligence & Analytics framework proposal involves a Design Science Research process. The main artifacts are information artifacts, namely the data sources, the data model, and the different data visualizations. These artifacts are obtained along the BI&A value chain, during three phases. Each phase implies the design, development, evaluation, and communication of the artifacts. In the last phase, the development of the data visualization artifacts implies the support of Visual Analytics transformations. The research hypotheses Hypothesis 1, Hypothesis 2 and Hypothesis 3 have been validated.
The results acquired from SDG7 monitoring in the proposed framework fortify the fact that by using BI&A approaches, formulating new and effective strategies, the countries can transform their energy mix into greener ones.
The challenges of Business Intelligence & Analytics applications in the field of sustainability are as follows:
- -
- the industry will have to adapt to the new technologies and proposed practices, continuously training specialists in the field, as well as intelligible IT solutions for less experienced users;
- -
- the need to define optimal models for extracting, transforming and uploading data related to the field of sustainable development, available in multiple sources, in a centralized form that allows the easy extraction of the desired knowledge and information;
- -
- defining standard graphical representation models for each type of indicator, which can be understood without having a solid set of specialized knowledge in the field of sustainability, and which can be understood based on the definition of indicators by the vast majority.
The proposed research model in the BI&A framework can be used for other countries’ case studies, but also serves as a point of departure for investigating data in a more integrated way. Such an approach is subject to further developments based on DSR in various contextual analyses.
Author Contributions
Literature review: M.M., D.D. and L.H.; conceptualization: M.M., D.D. and L.H.; methodology: M.M., D.D. and L.H.; data processing: M.M. and C.J.; validation: M.M., D.D. and L.H.; writing: M.M., D.D. and L.H. All authors have read and agreed to the published version of the manuscript.
Funding
This research received no external funding.
Institutional Review Board Statement
Not applicable.
Informed Consent Statement
Not applicable.
Data Availability Statement
Not applicable.
Conflicts of Interest
The authors declare no conflict of interest.
Appendix A

Table A1.
Indicators for objective O2 (Clean and Affordable Energy).
| Code for Indicator | Indicator Name | Unit of Measure | Symbol | Calculation Explained | Required Data | Data Sources |
|---|---|---|---|---|---|---|
| O2_1 | Total GHG emissions | Thousand tonnes CO2 equivalent | EGES | Calculated by summing the greenhouse gas emissions (CO2, CH4, N2O, HFC, PFC and SF6) converted into CO2 equivalent. | Greenhouse gas emissions—EGES (including LULUCF) | National Environmental Protection Agency (ANPM) |
| O2_2 | Greenhouse gases emissions by sector | Thousand tonnes CO2 equivalent | EGESSec | Sum of Greenhouse Gas Emissions (EGES) converted into CO2 equivalent for each sector: Energy, Manufacturing and Use of Products, Waste, Agriculture, Other Sectors, where: CO2 equivalent—heating potential for each gas according to the methodology recommended by the UNFCCC | EGESi—Aggregated greenhouse gas emissions in CO2 equivalent, corresponding to a sector of activity in national emission inventories | ANPM—National Inventory of Greenhouse Gas Emissions |
| O2_3 | Share of electricity from renewable sources in the total electric power | % | PERS | Divide the amount of electricity generated from renewable sources (Qenelreg) by the total amount of electricity (TQenel). It can be calculated in total and/or for each renewable source | The amount of electricity generated from renewable sources (total and by sources); total electricity production | National Institute of Statistics |
| O2_4 | Cogeneration of electricity and heat as % of the total electrical energy | % | CTE | Electricity production from CHP (Qeîel) relative to total electricity production (TQEe) | Electricity production resulting from CHP and total electricity production | National Institute of Statistics |
| O2_5 | Energy intensity of the economy | ktoe/1000 Euro | IEE | Total gross domestic energy consumption is divided by GDP | Total gross domestic energy consumption for each primary energy carrier; GDP in constant prices | EUROSTAT |
| O2_6 | Energy dependency | % | DE | Calculated as the ratio of net imports to gross domestic energy consumption (CBIE) plus bunkering (B) | import, export, gross domestic energy consumption, bunkering | National Institute of Statistics |
| O2_7 | Intensity of energy-related CO2 emissions | Tonnes/million LEI | ICO2 | The ratio between the volume of CO2 emissions in the energy sector (ECO2) and the Gross Domestic Product (GDP) in constant prices | CO2 emissions from energy consumption, calculated by the National Inventory of Greenhouse Gas Emissions (INEGES) Gross domestic product (GDP) in constant prices compared to 2005 | Carbon dioxide (CO2) emissions from the energy sector—Ministry of Water Environment and Forests Gross domestic product GDP at constant prices—National Institute of Statistics |
| O2_10 | Energy consumption per inhabitant | toe/capita | CIBE/loc | Sum of primary energy production (PEP), recovered products (PR), imports (IMP) and stock at the beginning of the reference period (SI) minus exports (EXP), bunkering (B) and stock at the end of the reference period (SF) reported to the number of inhabitants on 1 July | Primary energy production for each primary energy carrier (coal, crude oil, natural gas, firewood, hydroelectric, nuclear power and energy from unconventional sources), quantities of recovered products, stock on 1 January and 31 December of the carriers of primary energy to the producing, consuming and distribution units, import, export for each primary energy carrier. Number of inhabitants on July 1 | National Institute of Statistics |
| O2_11 | Final energy consumption by sector | Thousand toes | CFES | Sum of the amounts of energy used in different sectors of activity (Qenutiliz) according to the energy balance | Energy balance | National Institute of Statistics |
| O2_12 | Gross inland energy consumption by fuel type | Thousand toes | CIBE | Sum of primary energy production (PEP), recovered products (PR), import (IMP) and stock at the beginning of the reference period (SI) minus export (EXP), bunkering (B) and stock at the end of the reference period (SF) | Primary energy production for each primary energy carrier (coal, crude oil, natural gas, firewood, hydroelectric, nuclear power and energy from unconventional sources), quantities of recovered products, stock on January 1 and December 31 of the carriers of energy to the producing, consuming and distribution units, import, export for each energy carrier | National Institute of Statistics |
| O2_13 | Biofuel consumption in transport sector | % | BIO% | Ratio between biofuel consumption (QCbio) and total fuel used (TQC) for transport | Total quantities of fuel consumed; quantities of biofuels consumed | National Institute of Statistics, data available after 2007 |
| O2_14 | Greenhouse gas emissions intensity of energy consumption | Thousands of tonnes of CO2 equivalent/thousand toe | IGES | Total aggregate GHG emissions (Total_GES_emissions) are divided by Gross Domestic Energy Consumption (CIBE) | Aggregate GHG emissions from energy consumption, Gross Domestic Energy Consumption (CIBE) | ANPM—Emissions Inventory INS—Gross Domestic Energy Consumption (CIBE), statistical yearbook |
References
- Nagasawa, T.; Pillay, C.; Beier, G.; Fritzsche, K.; Pougel, F.; Takama, T.; The, K.; Bobashev, I. Accelerating Clean Energy through Industry 4.0: Manufacturing the Next Revolution; A Report of the United Nations Industrial Development Organization. UNIDO: Vienna, Austria, 2017. Available online: https://www.unido.org/sites/default/files/2017-08/REPORT_Accelerating_clean_energy_through_Industry_4.0.Final_0.pdf (accessed on 24 October 2020).
- Hevner, A.; Chatterjee, S.; Series, I.; Antonelli, P.; Mathew, R. Design Science Research in Information Systems. Des. Res. Inf. Syst. Integr. Ser. Inf. Syst. 2010, 22, 9–22. [Google Scholar]
- Peffers, K.; Tuunanen, T.; Gengler, C.; Rossi, M. The design science research process: A model for producing and presenting information systems research, DESRIST 2006. In Proceedings of the First International Conference on Design Science Research in Information Systems and Technology, Claremont, CA, USA, 24–25 February 2006; pp. 84–106. [Google Scholar]
- United Nations (UN). Transforming Our World: The 2030 Agenda for Sustainable Development. Resolution Adopted by the General Assembly on 25 September 2015. Available online: https://sustainabledevelopment.un.org/post2015/transformingourworld (accessed on 25 October 2020).
- International Council for Science, International Social Science Council (ICSU). Review of Targets for the Sustainable Development Goals: The Science Perspective; ICSU: Paris, France, 2015. [Google Scholar]
- Lu, Y.; Nakicenovic, N.; Visbeck, M.; Stevance, A.S. Policy: Five priorities for the UN Sustainable Development Goals. Nature 2015, 520, 432–433. [Google Scholar] [CrossRef] [PubMed] [Green Version]
- Owusu, P.A.; Asumadu-Sarkodie, S. A review of renewable energy sources, sustainability issues and climate change mitigation. Cogent Eng. 2016, 3, 1167990. [Google Scholar] [CrossRef]
- Firoiu, D.; Ionescu, G.H.; Băndoi, A.; Florea, N.M.; Jianu, E. Achieving Sustainable Development Goals (SDG): Implementation of the 2030 Agenda in Romania. Sustainability 2019, 11, 2156. [Google Scholar] [CrossRef] [Green Version]
- Raszkowski, A.; Bartniczak, B. On the Road to Sustainability: Implementation of the 2030 Agenda Sustainable Development Goals (SDG) in Poland. Sustainability 2019, 11, 366. [Google Scholar] [CrossRef] [Green Version]
- Boto-Álvarez, A.; García-Fernández, R. Implementation of the 2030 Agenda Sustainable Development Goals in Spain. Sustainability 2020, 12, 2546. [Google Scholar] [CrossRef] [Green Version]
- Hillerbrand, R. Why Affordable Clean Energy Is Not Enough. A Capability Perspective on the Sustainable Development Goals. Sustainability 2018, 10, 2485. [Google Scholar] [CrossRef] [Green Version]
- Guijarro, F.; Poyatos, J. Designing a Sustainable Development Goal Index through a Goal Programming Model: The Case of EU-28 Countries. Sustainability 2018, 10, 3167. [Google Scholar] [CrossRef] [Green Version]
- Sachs, J.; Schmidt-Traub, G.; Kroll, C.; Lafortune, G.; Fuller, G. Sustainable Development Report 2019; Bertelsmann Stiftung and Sustainable Development Solutions Network (SDSN): New York, NY, USA, 2019; Available online: https://sdsna.github.io/2019GlobalIndex/2019GlobalIndexRankings.pdf (accessed on 29 October 2020).
- Yong, Z.J.; Bashir, M.J.; Aun, N.C.; Sethupathi, S.; Lim, J.W.; Show, P.M. Sustainable Waste-to-Energy Development in Malaysia: Appraisal of Environmental, Financial, and Public Issues Related with Energy Recovery from Municipal Solid Waste. Processes 2019, 7, 676. [Google Scholar]
- Yan, J.; Shamim, T.; Chou, S.K.; Desideri, U.; Li, H. Clean, efficient and affordable energy for a sustainable future. Appl. Energy 2017, 185, 953–962. [Google Scholar]
- Bonilla, S.H.; Silva, H.R.O.; da Silva, M.T.; Gonçalves, R.F.; Sacomano, J.B. Industry 4.0 and sustainability implications: A scenario-based analysis of the impacts and challenges. Sustainability 2018, 10, 3740. [Google Scholar] [CrossRef] [Green Version]
- The Romania’s National Strategy for Sustainable Development—Horizons 2013–2020–2030. Available online: https://insse.ro/cms/files/IDDT2012/sndd-final-en.pdf (accessed on 29 October 2020).
- Prat, N.; Comyn-Wattiau, I.; Akoka, J. Artifact Evaluation in Information Systems Design-Science Research—A Holistic View, PACIS 2014 Proceedings. Available online: https://aisel.aisnet.org/pacis2014/23 (accessed on 30 October 2020).
- Durcevic, S. What Is the Difference Between Business Intelligence and Analytics? 2018. Available online: https://www.datapine.com/blog/difference-between-business-intelligence-and-analytics/ (accessed on 30 October 2020).
- Boyer, J.; Frank, B.; Green, B.; Harris, T.; Van de Vanter, K. Business Intelligence Strategy: A Practical Guide for Achieving BI Excellence, 1st ed.; MC Press Online, LLC: Ketchum, ID, USA, 2010; pp. 35–72. ISBN 978-158347-362-7. [Google Scholar]
- Muntean, M. Business Intelligence Issues for Sustainability Projects. Sustainability 2018, 10, 335. Available online: https://0-www-mdpi-com.brum.beds.ac.uk/2071-1050/10/2/335/htm (accessed on 28 October 2020).
- Richards, G.; Yeoh, W.; Yee Loong Chong, A.; Popovič, A. Business Intelligence Effectiveness and Corporate Performance Management: An Empirical Analysis. J. Comput. Inf. Syst. 2019, 59, 188–196. Available online: https://0-www-tandfonline-com.brum.beds.ac.uk/doi/full/10.1080/08874417.2017.1334244 (accessed on 29 November 2020). [CrossRef]
- Sauter, V. Decision Support Systems for Business Intelligence; John Wiley & Sons Inc. Publication: Hoboken, NJ, USA, 2014. [Google Scholar]
- Mircea, M. Business Intelligence—Solution for Business Development; Intech: London, UK, 2011; ISBN 978-953-51-0019-5. [Google Scholar]
- Balachandran, B.M.; Prasad, S. Challenges and Benefits of Deploying Big Data Analytics in the Cloud for Business Intelligence. Procedia Comput. Sci. 2017, 112, 1112–1122. [Google Scholar] [CrossRef]
- Raut, R.D.; Mangla, S.K.; Narwane, S.V.; Bhaskar, B.G.; Priyadarshineed, P.; Narkhede, B.E. Linking big data analytics and operational sustainability practices for sustainable business management. J. Clean. Prod. 2019, 224, 10–24. [Google Scholar] [CrossRef]
- Haupt, R.; Scholz, B.; Caliz, A. Using Business Intelligence to Support Strategic Sustainability Information Management. In Proceedings of the 2015 Annual Research Conference on South African Institute of Computer Scientists and Information Technologists, New York, NY, USA, 28–30 September 2015; Available online: https://0-dl-acm-org.brum.beds.ac.uk/doi/10.1145/2815782.2815795 (accessed on 27 November 2020).
- Oprea, S.V.; Bâra, A. Setting the Time-of-Use Tariff Rates With NoSQL and Machine Learning to a Sustainable Environment. IEEE Access 2020, 8, 25521–25530. Available online: https://0-ieeexplore-ieee-org.brum.beds.ac.uk/abstract/document/8970543 (accessed on 2 November 2020). [CrossRef]
- Oprea, S.V.; Bâra, A.; Tudorică, B.G. Sustainable Development with Smart Meter Data Analytics Using NoSQL and Self-Organizing Maps. Sustainability 2020, 12, 3442. [Google Scholar] [CrossRef] [Green Version]
- Bara, A.; Tudorica, B.; Marales, R.C. Solutions for Big Data Processing and Analytics in Context of Smart Homes. Database Syst. J. 2018, 9, 80–89. [Google Scholar]
- Hevner, A.; March, S.; Park, J.; Ram, S. Design Science in Information Systems Research. MIS Quaterly 2004, 28, 1. Available online: https://wise.vub.ac.be/sites/default/files/thesis_info/design_science.pdf (accessed on 10 November 2020). [CrossRef] [Green Version]
- Vaishnavi, V.; Kuechler, W.; Petter, S. (Eds.) Design Science Research in Information Systems. 2004. 20 January 2004 (created in 2004 and updated until 2015 by Vaishnavi, V. and Kuechler, W.); Last Updated (by Vaishnavi, V. and Petter, S.), 30 June 2019. Available online: http://www.desrist.org/design-research-in-information-systems/ (accessed on 10 November 2020).
- Graham, D. Introduction to the BI Architecture Framework and Methods; IBM Corporation: Armonk, NY, USA, 2004. [Google Scholar]
- Dekkers, J.; Versendaal, J.; Batenburg, R. Organising for Business Intelligence: A Framework for Aligning the Use and Development of Information. In Proceedings of the 20th Bled eConference eMergence: Merging and Emerging Technologies, Processes, and Institutions, Bled, Slovenia, 4–6 June 2007. [Google Scholar]
- Deming, W.E. Out of the Crisis, Center for Advanced Engineering Study; Massachusetts Institute of Technology: Massachusetts, CA, USA, 1982. [Google Scholar]
- Villegas-Ch, W.; Palacios-Pacheco, X.; Luján-Mora, S. A Business Intelligence Framework for Analyzing Educational Data. Sustainability 2020, 12, 5745. [Google Scholar] [CrossRef]
- March, S.T.; Smith, G.F. Design and Natural Science Research on Information Technology. Decis. Support Syst. 1995, 15, 251–266. [Google Scholar] [CrossRef]
- Mwilu, S.O.; Comyn-Wattiau, I.; Prat, N. Design Science Research Contribution to Business Intelligence in the Cloud–A Systematic Literature Review. 2020. Available online: https://hal.archives-ouvertes.fr/hal-01639025/ (accessed on 10 November 2020).
- Haselman, M.; Botha, A. Evaluating an Artifact in Design Science Research Methodology as Was Implemented in a Resource Constrained Environment; South African Institute of Computer Scientists and Information Technologists (SAICSIT): Stellenbosch, South Africa, 2015; ISBN 978-1-4503-3683-3. [Google Scholar] [CrossRef]
- Schütz, L.; Raabe, S.; Bade, K.; Pietsch, M. Using Visual Analytics for Decision Making. J. Digit. Landsc. Archit. 2017, 2, 94–101. [Google Scholar] [CrossRef]
- Kohlhammer, J.; Keim, D.A.; Pohl, M.; Santucci, G.; Andrienko, G. Solving Problems with Visual Analytics. Procedia Comput. Sci. 2011, 7, 117–120. [Google Scholar] [CrossRef]
- InvesTenergy. Essential Information on Energy Consumption in Romania, Provided in the European Commission’s Energy Efficiency Awareness Campaign (Informații Esențiale Despre Consumul de Energie în Romania, Oferite în Cadrul Campaniei de Conștientizare Privind Eficiența Energetică a Comisiei Europene). 2018. Available online: https://www.investenergy.ro/romania-cel-mai-scazut-consum-de-energie-pe-locuitor-din-ue-dar-si-un-nivel-ridicat-de-saracie-energetica/ (accessed on 10 October 2020).
- World Economic Forum. These 11 EU States Already Meet Their 2020 Renewable Energy Targets. 2019. Available online: https://www.weforum.org/agenda/2019/02/these-11-eu-states-already-meet-their-2020-renewable-energy-targets/ (accessed on 10 October 2020).
- MacQueen, J. Some methods for Classification and Analysis of Multivariate Observations. Proc. Fifth Berkeley Symp. Math. Statist. Prob. 1967, 1, 281–297. Available online: https://projecteuclid.org/euclid.bsmsp/1200512992 (accessed on 5 December 2020).
- Miah, S.J.; Gammack, J.; Hasan, N. Methodologies for designing healthcare analytics solutions: A literature analysis. Health Inform. J. 2020, 26, 2300–2314. [Google Scholar] [CrossRef] [PubMed] [Green Version]
- Elragal, A.; Haddara, M. Design Science Research: Evaluation in the Lens of Big Data Analytics. Systems 2019, 7, 27. [Google Scholar] [CrossRef] [Green Version]
- Cui, W. Visual Analytics: A Comprehensive Overview. IEEE Access 2019, 7. [Google Scholar] [CrossRef]
- TRACKING SDG 7. Available online: https://trackingsdg7.esmap.org/ (accessed on 10 October 2020).
- Vlad, I.V. Strategia Naţională de Dezvoltare a României în Următorii 20 de Ani; Editura Acadmiei Române: Bucureşti, Romania, 2015; Volume 1, pp. 95–128.
- European Commission. Clean Energy for All Europeans Package. 2017. Available online: https://ec.europa.eu/energy/topics/energy-strategy/clean-energy-all-europeans_en (accessed on 10 January 2021).
Figure 1.
Strategic goals of the energy strategy. (Source: https://sustainabledevelopment.un.org/content/documents/19952Voluntary_National_Review_ROMANIA_with_Cover.pdf).
Figure 1.
Strategic goals of the energy strategy. (Source: https://sustainabledevelopment.un.org/content/documents/19952Voluntary_National_Review_ROMANIA_with_Cover.pdf).

Figure 2.
(a). SDG7: specific targets and indicators. (b). SDG7: specific targets and indicators. (Source: https://www.un.org/sustainabledevelopment/energy/).
Figure 2.
(a). SDG7: specific targets and indicators. (b). SDG7: specific targets and indicators. (Source: https://www.un.org/sustainabledevelopment/energy/).

Figure 3.
Design Science Research process (source: [32]).
Figure 3.
Design Science Research process (source: [32]).

Figure 4.
Design Science Research process. Artifacts (source: [3]).
Figure 4.
Design Science Research process. Artifacts (source: [3]).

Figure 5.
BI&A framework. From Data to Information on Demand. (Adapted from: [33]).
Figure 5.
BI&A framework. From Data to Information on Demand. (Adapted from: [33]).

Figure 6.
BI&BA framework. Information artifacts built in DSR process. (Adapted from: [39]).
Figure 6.
BI&BA framework. Information artifacts built in DSR process. (Adapted from: [39]).

Figure 7.
Visual Analytics process (source: [40]).
Figure 7.
Visual Analytics process (source: [40]).

Figure 8.
BI&A framework. DSR and VA processes.

Figure 9.
(a). Data model, O2_model. O2.1–O2.4 indicators. (b) O2_model. O2.5–O2.14 indicators.

Figure 10.
Model visualization. Energy intensity analysis for East European countries.

Figure 11.
Model visualization. Total energy consumption analysis for Romania.

Figure 12.
(a). Model visualization. O2_3 indicator analysis for Romania. (b). Model visualization. O2_3 indicator forecast.
Figure 12.
(a). Model visualization. O2_3 indicator analysis for Romania. (b). Model visualization. O2_3 indicator forecast.

Figure 13.
Model visualization. O2_3 indicator analysis.

Figure 14.
Model building. O2_2 indicator analysis.

Figure 15.
Model building. O2_7 indicator analysis.

Figure 16.
Model building. O2_11 Indicator cluster analysis.

Figure 17.
SDG7 indicators for Romania in 2018 (Source: [48]).
Figure 17.
SDG7 indicators for Romania in 2018 (Source: [48]).

Table 1.
Clean and affordable energy indicators.
| Indicator | Definition | Relevance |
|---|---|---|
| O2_1. Total greenhouse gas (GHG) emissions | Measures greenhouse gas emissions: carbon dioxide (CO2), nitrogen oxides (N2O), methane (CH4), hydrofluorocarbons (HFCs), perflorocarbons (PFCs), and sulfur hexafluoride (SF6), measured by global warming potential (GWP). GWP refers to the ability of different gases to contribute to global warming relative to that of carbon dioxide over a time horizon for 100 years. The Intergovernmental Panel on Climate Change sets the global warming potential for greenhouse gases (CO2, CH4, N2O, HFC, PFC, and SF6) contained in the Kyoto Protocol. | Highlights those greenhouse gas (GHG) emissions that cause the temperature of the air to rise above the earth’s surface, leading to climate change. |
| O2_2. Greenhouse gases emissions by sector | Highlights greenhouse gas emissions (CO2, CH4, N2O, HFC, PFC, and SF6) by sectors of activity (emission sources) defined by the European Environment Agency: energy, industrial processes and other products, waste, agriculture, others. | Shows the contribution of basic sources (of activity sectors as a source of emissions) of GHG in the total greenhouse gas emissions. |
| O2_3. Share of electricity from renewable sources in the total electric power | Measures the share of electricity generated from renewable sources in total electricity. Energy produced from renewable energy sources includes: energy generated by hydropower plants (excluding pumping), wind, sun, geothermal and electricity obtained from biomass/waste. Biomass/waste includes energy generated from burning wood and other solid waste (e.g., straw), incineration of municipal waste, biogas (including buried waste, sewage and farm gases) and liquid biofuels. | Highlights the ratio between electricity generated from renewable sources and total electricity production |
| O2_4. Cogeneration of electricity and heat as % of total electrical energy | Cogeneration of electricity and heat (CHP or cogeneration) means the simultaneous production of electricity and heat in the same plant (usually using gas turbines with heat recovery). CHP is a technology used to improve energy efficiency. | Highlights energy efficiency and reducing the additional consumption of combustion fuels used for heat generation and the concerns for the environmental impact. |
| O2_5. Energy intensity of the economy | Energy intensity of the economy expresses the gross domestic energy consumption in relation to the national economy (the amount of energy needed to produce a unit of GDP). It represents gross domestic energy consumption (calculated in tons of oil equivalent—toe) relative to GDP. | Sustainable development means ensuring the necessary energy, but not by increasing its use (except for renewable energy), but by increasing efficiency, modernizing technologies and restructuring the economy. |
| O2_6. Energy dependency | Energy dependence indicates the degree to which a country’s economy relies on imports to meet energy consumption. | Sustainable development means ensuring the necessary energy, by developing domestic energy resources and reducing imports. |
| O2_7. Intensity of energy-related CO2 emissions | Represents carbon dioxide (CO2) emissions from energy consumption relative to gross domestic product (GDP) at constant prices. | Expression of the intensity of CO2 emissions in the energy sector. |
| O2_10. Energy consumption per inhabitant | The indicator represents the amount of energy reported per inhabitant; where the amount of energy is the sum of the primary energy production, recovered products, imports, and stocks at the beginning of the reference period minus exports, bunkering, and stocks at the end of the period. | Influences energy policies in the context of environmental protection requirements. |
| O2_11. Final energy consumption by sector | Sums the energy quantities used in different sectors in order to achieve material goods and services. The quantities used for non-energy purposes and those used for the production of other fuels are not included. Consumption in the energy sector and losses in conduction and distribution are also not included. | Assesses the degree of energy dependence at sector level. |
| O2_12. Gross inland energy consumption by fuel type | Represents the amount of energy resulting by summing the primary energy production, recovered products, imports, and stocks at the beginning of the reference period minus exports, bunkering and stocks at the end of the reference period. | Influences energy policies in the context of environmental protection requirements. |
| O2_13. Biofuel consumption in transport sector | The share of bio-fuels in the total fuels used for transport. | Measures utilization of fuels with a positive impact on the environment in transport sector. |
| O2_14. Greenhouse gas emissions intensity of energy consumption | Represents the aggregate GHG emissions index in CO2 equivalent from the National Greenhouse Gas Emission Inventories: CO2, CH4, N2O, HFC, PFC and SF6 (reported according to the UN Framework Convention on Climate Change and the Kyoto Protocol) resulting from energy consumption relative to gross domestic energy consumption. | Expression of the intensity of GHG production from energy activities. |
Table 2.
DSR process. Data processing.
| DSR Process. Artifacts | Clean and Affordable Energy Analysis. Artifacts | Details | |
|---|---|---|---|
| Data sources | https://insse.ro/cms/files/Web_IDD_BD_ro/index.htm https://ec.europa.eu/energy/data-analysis/energy-statistical-pocketbook_en http://pro.sistemulenergetic.ro/ | Public database of the National Institute of Statistics, O2 objective. Data published by EU Commission, DG Energy, Unit A4. Public data for electrical energy produced and consumed in Romania. | |
| Selected data | Data in Excel files and metadata in Word files. Data in Excel file. HTML Table. | O2_1, O2_2, O2_3, O2_4, O2_5, O2_6, O2_7, O2_10, O2_11, O2_12, O2_13, O2_14. Energy datasheets: EU countries. O2_3 Electrical energy | All data are put together into one Excel workbook. |
| Preprocessed data | One Excel file containing both data and meta data for all the indicators | O2_Clean_and_affordable_energy | Meta-data sheet contains the data presented in Table 1. Data sheets took over the data by transposing rows into columns. |
| Initial data model | In-memory data model integrated in MS Power BI | O2_Model | Each data sheet led to the appearance of an entity in the model. The HTML table was integrated into the model and linked to O2_3, creating an extension of this dimension. |
| Final data model | In-memory data model | O2_Model | Calculated columns, measures and performance indicators are added to the initial model |
| Data visualizations | Visualization controls | Data analysis based on data visualization and analytics | |
Publisher’s Note: MDPI stays neutral with regard to jurisdictional claims in published maps and institutional affiliations. |
© 2021 by the authors. Licensee MDPI, Basel, Switzerland. This article is an open access article distributed under the terms and conditions of the Creative Commons Attribution (CC BY) license (http://creativecommons.org/licenses/by/4.0/).
Share and Cite
MDPI and ACS Style
Muntean, M.; Dănăiaţă, D.; Hurbean, L.; Jude, C. A Business Intelligence & Analytics Framework for Clean and Affordable Energy Data Analysis. Sustainability 2021, 13, 638. https://0-doi-org.brum.beds.ac.uk/10.3390/su13020638
AMA Style
Muntean M, Dănăiaţă D, Hurbean L, Jude C. A Business Intelligence & Analytics Framework for Clean and Affordable Energy Data Analysis. Sustainability. 2021; 13(2):638. https://0-doi-org.brum.beds.ac.uk/10.3390/su13020638
Chicago/Turabian StyleMuntean, Mihaela, Doina Dănăiaţă, Luminiţa Hurbean, and Cornelia Jude. 2021. "A Business Intelligence & Analytics Framework for Clean and Affordable Energy Data Analysis" Sustainability 13, no. 2: 638. https://0-doi-org.brum.beds.ac.uk/10.3390/su13020638
Note that from the first issue of 2016, this journal uses article numbers instead of page numbers. See further details here.