1. Introduction
The demand for renewable energy as an alternative source of conventional power generation is increasing because of a decrease in its production expenses, zero carbon emissions, and economical tariffs [
1]. Renewable energy production is predicted to increase by 6.7% by 2030 [
2]. The report of the Joint Research Center revealed that the global installation of PV plants was 315 GW in 2016, with a cumulative increase of 40% annual production over the last 15 years. Therefore, 133.7 billion USD was invested in 2016 alone to produce PV energy, comprising 55% of gross renewable energy cost [
3]. Nevertheless, solar energy is harnessed from a PV module that is viable, sustainable, eco-friendly, efficient, cost-effective, renewable, and non-polluting [
4]. Solar cells that made of Gallium Arsenide (GaAs) are widely used in space technologies and objects, which can be operated efficiently at any weather conditions and dynamic operating conditions
[5]. The GaAs solar cells are integrated with modern iridium satellite constellation. These types of solar cells consist of high resistive materials against radiation effect and other external disturbances [
6].
The grid-connected PV system combined with solar converters is designed to harness energy from the PV modules and delivers surplus energy to a power grid, which reduces household electricity bills, and meets electricity demands [
7]. Recently, a substantial number of PV systems are integrated with the utility grid because of its increasing demands and reliable operations compared with other renewable sources [
8].
The Power versus Voltage (P-V) and Current versus Voltage (I-V) characteristics curves of the modules are nonlinear, especially when a PV system is operated under dynamic weather conditions, variable loads, and inconsistent temperature [
9]. Cloud cover, trees, buildings, and bypass diodes cause a partial shading condition (PSC) with numerous power peaks on the PV string [
10]. The location of an operating point and maximum power points (MPPs) is dynamically changeable when the PSC condition occurs on the PV module. Hence, an online Maximum Power Point Tracking (MPPT) algorithm is required to harness the maximum energy from a PV panel by driving the operating point toward the nearest global MPP (GMPP) region [
11]. The increased perturbation size of a converter duty cycle increases the tracking speed and power oscillations around the GMPP and vice versa. Because of this unforeseen relationship, a variable step perturbation of the duty cycle should be applied to achieve higher efficiency in PV MPPT design [
12].
Conventional MPPT algorithms (see simulation codes in
Appendix A) are mostly designed to track the GMPP under uniform environmental conditions where the P-V curve generates only one MPP [
9]. An operating point at the steady-state condition of the conventional perturb and observe (P&O), and incremental conductance (INC) MPPT techniques under PSCs revolves around a GMPP or LMPP, and generates low tracking speed, resulting in continuous power oscillations equal to changes in a predetermined perturbation size [
11]. Power oscillations can be extreme since the conventional algorithms continue to search for the operating point on the P-V curve at steady-state condition (SSC), although the MPP is tracked earlier [
13]. A PI-based P&O algorithm was developed to maintain the output reference voltage of the converter and tracking the MPP of the PV array with reduced power oscillations [
14]. A P&O-based voltage regulation loop is designed with a PID controller to increase the tracking speed of the MPP and regulate the output reference voltage faster than the conventional P&O algorithm [
15]. A PI-based INC-MPPT algorithm was designed to remove the dilemma of choosing the step size of the converter duty cycle under abruptly changing solar irradiance and temperature [
16]. An improved hill-climbing double closed-loop algorithm was deployed nearer to the MPP to reduce steady-state oscillations and a rise time when solar insolation is in dynamic condition [
17]. An adaptive PID controller with the P&O MPPT algorithm for a PV system is proposed in [
18] to improve tracking time and reduce oscillation around MPP. In [
19], PID-integrated P&O MPPT is proposed for a grid-connected PV system. The main constraints of these developed MPPT schemes are in making delays in the tracking of MPP and generating greater power oscillations because their operating points are lost to the local MPPs (LMPPs) under PSCs [
20].
By taking into account the drawbacks of the previously developed MPPT techniques, in this present study, a PI-based coordinated MPPT technique is proposed for a grid-tied PV system to improve tracking speed and reduce oscillations in PV output power under PSCs [
21]. To make zero steady-state errors of the output voltage and current of the PV system, PI controllers are used whose outputs are sent through an incremental conductance (INC) algorithm to regulate the dc–dc converter duty cycle. The advantage of the proposed PI coordinated MPPT method is it can track the GMPP directly instead of looking for multiple LMPPs on the P-V curve, which results in faster tracking speed and low steady-state power oscillations of the PV system. An H-bridge voltage source inverter (VSI) is deployed between a DC/DC converter and utility grid to inject a sinusoidal grid current of 50 Hz with zero steady-state error (SSE), and least total harmonic distortion (THD). A proportional resonant (PR) controller is used instead of a PI compensator in the inverter control system to eliminate the SSE of the referenced grid current, and voltage [
22] and sinusoidal pulse width modulation (SPWM) is used to generate control signals. The performance of the proposed MPPT technique is validated in the MATLAB/Simulink platform for different PSCs and a laboratory setup is developed to experimentally validate the performance of the proposed MPPT algorithm. Finally, to prove the effectiveness of the proposed MPPT technique, its performance is compared with conventional INC and perturb and observe (P&O) methods.
2. Structure of the Grid-Connected PV System
Figure 1 shows a designed topology for a PV array. The topology comprises five interconnected branches: PV panel, MPPT controllers with PI controllers, a DC/DC boost converter, a 1-φ DC/AC bridge inverter and a low-pass filter (LCL), and a utility grid.
A continuous mode boost converter and the inverter are designed to increase the DC output voltage and PV system integration with the grid network respectively. The LCL filter is connected between the output of the inverter and grid system by introducing a bulk filter capacitor to reduce ripple components of the grid parameters.
The proposed MPPT controller is used to track GMPP and generate constant DC-bias voltage at the output of the boost converter. A phase-locked loop (PLL) is used in the VSI control system to synchronize the phase of the grid voltage and current with the measured inverter waveforms. The PLL controls the measured grid voltage by converting its fixed reference frame (αβ-components) into a synchronous reference frame (dq-components).
A PR controller is selected over the PI controller to completely remove the SSE from the grid current and generate the smooth sine pulse with modulation (SPWM) pulses. The use of infinite gain in the PR controller assures high efficiency because it overcomes disturbances and realizes sinusoidal reference waveforms.
2.1. PV System Modeling
A model of the PV panel has been developed under several patterns of solar insolation conditions to compute the actual power of the PV system and robust MPPT schemes [
23]. Choosing accurate variables in modeling procedures is challenging for matching simulation outcomes and PV nonlinear waveforms under PSCs [
24].
Figure 2 shows an internal circuit diagram of a PV cell that includes series and shunt resistance, cell currents, and other parameters of the PV module. Equation (1) depicts the current of a PV cell with other related parameters.
Figure 3 demonstrates different shapes of P-V and I-V curves at the standard test condition (STC), and changing temperature and solar insolation.
where,
| Ipv: | Photovoltaic cell current |
| Npar: | Parallel-connected modules per string |
| Nser: | Series-connected modules per string |
| Voc: | Open-circuit voltage |
| Vmp: | MPP Voltage |
| Imp: | MPP Current |
| Pmp: | MPP Power |
| Isc: | Short-circuit current |
| Rs: | Series resistance of a single diode model |
| Rsh: | Shunt resistance of a single diode model |
| Io: | Reverse saturation current of a diode |
| Vt: | Thermal Voltage of a PV array |
Figure 3 demonstrates different shapes of P-V and I-V curves at the standard test condition (STC), and changing temperature and solar insolation.
2.2. PV System under Partial Shading Conditions
A PV array is modeled using a combination of series and parallel solar panels to generate expected power for the system design [
26]. Each designed PV module does not receive an equal amount of solar insolation because of exposure to cloudy weather, bird droppings, dust, tall objects, and bypass diodes [
27].
This unequal distribution of solar irradiance between the PV modules is called PSC. Thus, a shaded module overheats, creating power losses, and could damage the entire PV array. The hotspot condition from a specific module can be eliminated by connecting a bypass diode in parallel with each PV module.
Figure 4 shows two uniform weather and six shaded conditions to help readers understand the real scenario of the PSC.
Figure 4a–d and
Figure 4e,f show shading patterns for the simulation and experiment, respectively. In each PV string, a blocking-diode denoted in red color is used to control the flow of reverse current and protect the battery from damage. These eight different irradiance profiles are used to test the tracking performance of the MPPT algorithms. The maximum power (213.6 W) of a PV model for experimental analysis is approximately seven times less than the power (1497 W) of the simulation system, because of the limited power supply from the Agilent solar simulator.
Table 1 shows the power, voltage, and current of the MPP and GMPP points of the eight patterns, which were calculated from the PV characteristic waveforms of the PV strings. GMPP
r, GMPP
m, and GMPP
l are represented as the right, middle, and left GMPP locations, respectively, from the different shading patterns. The maximum power is uneven and reduced because of the PSCs at each shaded P-V curve.
2.3. Boost Converter Design and Control
MPPT schemes drive an operating point at maximum power peak to maximize the tracking and power efficiency of a PV system. The operating point is maintained close proximity to the GMPP by adjusting the duty cycle and switching behavior of the boost converter [
28]. A continuous conduction mode (CCM) boost converter was designed because it has no power degradation in its circuit elements. The CCM converter boosts up the output voltage from the PV module voltage based on the duty cycle perturbation value. The duty cycle is fed by the pulse width modulation (PWM) comparator to generate pulses for switching a MOSFET or IGBT OFF and ON [
29]. Equation (2) shows that the output voltage is larger than the input voltage whenever the duty cycle step size is regulated from 0.2 to 0.9 [
30].
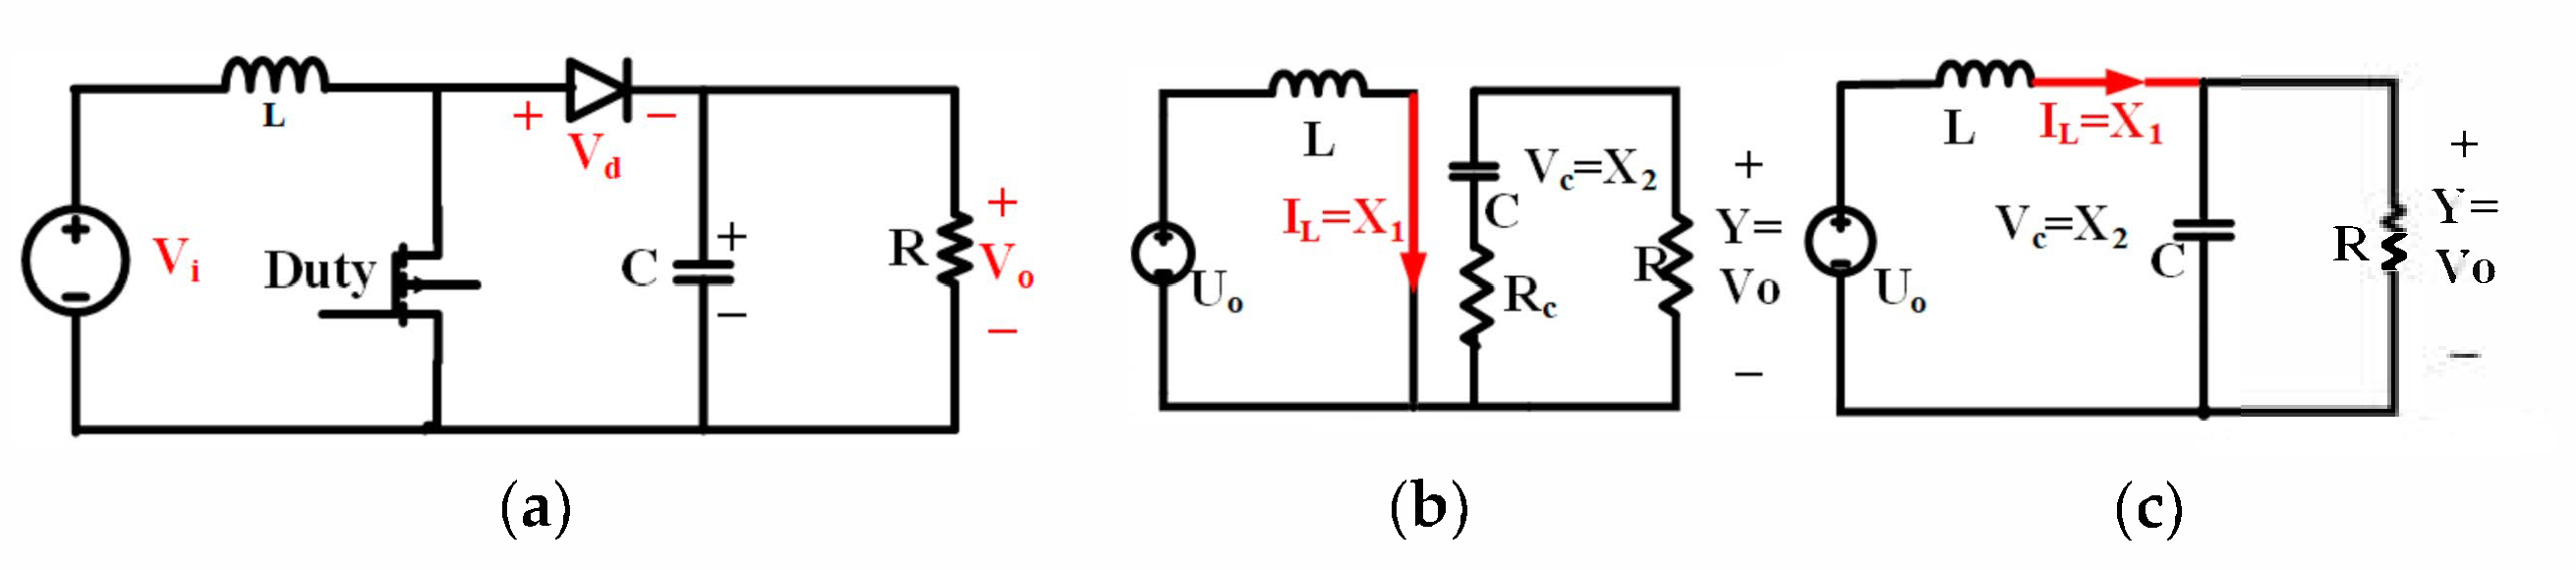
Figure 5a shows a simplified network of the boost converter.
Figure 5b,c show the ON and OFF states of the boost converter configurations respectively. A state-space model is derived from the equivalent circuits of the converter to find a transfer function.
The nonlinear averaged state-space equations are obtained by ignoring the terms formed by the product of two small signal quantities. The derived equations are Equations (2)–(5).
These sets of equations represent the averaged steady-state model for the boost converter linearized around an operating point (D, X
10 and X
20). A lower equivalent series resistance R
c compared with R is considered. Equations (5)–(9) present the standard state-space model as follows:
Equation (11) gives the state-space system transfer function for the small signal from control
to output
. The input voltage, output voltage, desired switching frequency, and inductor ripple current are denoted as Vin, Vout, fsw and ΔI
L respectively [
28]. A closed-loop boost converter with a 10 kHz PWM switching signal is designed to step up the voltage of a PV array from 184 to 325 V DC and the constant output voltage using PI controllers. The duty cycle is tuned dynamically to operate the converter at the maximum power available in the nonlinear PV curve. Equation (12) gives the critical inductance value of the boost converter [
29]. The current supplied to the output circuit is discontinuous. Therefore, to limit the output ripple voltage, a large filter capacitor is required, as given by Equation (12). Here, the output minimum capacitance (Cout (min)), the output ripple voltage (ΔVout), switching frequency (fsw) in kHz, maximum output current (Iout (max)) and the duty cycle (D) are represented in the Equation (12).
2.4. H-Bridge VSI Design and Control
To implement the traditional automatic synchronization technique, the VSI inverter should have a similar line voltage and current with a matched phase and frequency similar to those of the grid system [
32]. Robust control methods are applied in synchronization to quickly identify the frequent changes in voltage, phase, and frequency magnitudes, and maintain the status quo of the grid [
33]. The grid synchronization method is advantageous in two major ways. Firstly, a grid synchronizer not only reproduces a filtered signal that is in phase with grid voltage but also emulates an orthogonal component of the grid voltage, which can be used to generate reactive power reference to the inverter. Therefore, the inverter gains the ability to control the reactive power flow compared to the conventional inverters that only transfer active power due to their inability to produce an orthogonal component of the current reference. Secondly, to lock on the phase of the grid voltage, SRE-PLL would need a zero-voltage crossing detection to reset the integrator and the d-q transformations used, which would need sine and cosine calculations. A 1-ϕ feedback current loop is used to regulate the grid current. A proportional resonant (PR) compensator is used to track a sinusoidal current reference signal. To remove harmonic components, obtain balanced conditions, and maintain the same phase of the input and output signals of the grid, a synchronous reference frame (SRF)-PLL is deployed in the VSI control technique. A PR controller in the SRF-PLL method is applied for a faster and more robust process than that of others because it does not need decoupling and intermittent operations shown in
Figure 6.
Table 2 gives the VSI and LCL filter specifications A simple bipolar SPWM modulation technique is chosen to generate the complementary pulses at the same switching frequency of the VSI [
34]. In the bipolar SPWM control, the switch pairs, S1-S4 and S2-S3 of the VSI, are turned ON and OFF, respectively. The amplitudes at the positive and negative sides of the generated square pulses of the SPWM method are equal in magnitude with opposite polarity. The output voltage shifts between +VDC and −VDC voltage levels. The frequency of the carrier wave is chosen as 10 kHz and the frequency of the sine wave is 50 Hz (fundamental frequency). In the bipolar control technique, the two switching signals are shown in
Figure 7.
3. Proposed Coordinated MPPT Algorithm
The conventional P&O and INC MPPT methods make a control variable increase or decrease for dragging an operating point toward the expected GMPP region. However, they cannot predict the accurate step size of a control value closest to the reference value under adverse weather conditions and shading patterns that occurred on the PV plant.
If a smaller step size of a control parameter is chosen near the GMPP, power losses on the P-V curve decrease with an exceptionally low tracking speed. The proposed coordinated MPPT algorithm can address the speed-oscillation tradeoff while the operating point almost tracks the GMPP in terms of dynamics. The PI controllers are dedicated to controlling both the current and voltage of the boost converter in cooperation with the proposed MPPT algorithm. Furthermore, the proposed coordinated MPPT method is an improved algorithm deployed in a closed-loop PV array to harness maximum energy at any dynamic weather conditions (exhibiting numerous multiple power peaks on the P-V curves), unlike a conventional open-loop PV system. Nevertheless, the proposed MPPT technique is much superior to the traditional MPP trackers in terms of convergence speed, tracking speed, and power oscillations around the GMPP location.
This study uses a trial and error approach to predict PI gain parameters. By tuning the PI controllers and realizing a closed-loop response, the optimum tuned parameters Kp and Ki are obtained. Then, an INC algorithm is applied to control the duty cycle of the boost converter [
35]. The parameters of PI controllers are presented in
Table 3. Thus, the optimum PI-tuning parameters necessary for minimizing the oscillations around the MPP can be found. The input current and output voltage of the boost converter are controlled by controlling the duty cycle on a switching device to obtain the output characteristics of the solar cell. The proposed algorithm takes the feedback voltage and current from the PV array as input and generates the optimal duty cycle to track the MPP. The duty cycle addition increases the output voltage of the PV module and decreases the output current of the module. The output power is not directly related to the duty cycle on the switching device; instead, it is directly related to the output current and output voltage of the PV module.
This proposed method finds a true GMPP of the PV modules by iteratively perturbing the converter input current and output voltage, and comparing the power (P
pv) generated by the PV module with the output power of the boost converter (P
o) (
Figure 8). The voltage and current perturbations are achieved through the changes in the duty cycle D. The error sign (ΔP = P
pv − P
o) is used to determine the direction of the perturbation. The voltage error (ΔV) is the difference between the output reference voltage (V
o,ref) and the measured voltage (V
o) of the boost converter. If the power and voltage differences together are greater or equal to zero (ΔP ≥ 0 and ΔV ≥ 0), PI-1 is activated to reduce an error e
1. Then, PI-2 is operated to minimize e
2 error (ΔI = P
ref − I
pv) and the duty cycle should be increased to produce a constant output power of the converter. The input reference current (I
ref) and output reference voltage (V
o,ref) of the boost converter are chosen to be 8.14 A and 325 V for simulation work, respectively. This algorithm can reverse the perturbation when power decreases, and this process repeats until the MPP of the PV module is reached. If the system reaches GMPP, the algorithm produces a steady value of the duty cycle. To increase stability, the oscillation around the MPP of the PV module must be zero, thus the duty cycle perturbation is stopped when ΔP is zero or equal to a present smallest value.
The main improvement in this newly proposed method over conventional ones is its convergence and tracking speeds, and power oscillations. The initial input of the PI controllers is the reference voltage (Vo,ref) at which the system is set to work. Hence, to achieve maximum power at the output, the MPP voltage must be equal to the initial input voltage at which the system must operate. When the system reaches GMPP, the control algorithm maintains the operation of the PV array at this point until there is a change in the operation of the system. The change can cause a change in the output current due to unstable atmospheric conditions and the MPP. This control algorithm is operated to either increase or decrease the reference voltage, to track the new GMPP.
4. Simulation Results
The simulation results from different contingency analyses are presented investigating different parts of the designed system and verifying the proposed topology in a MATLAB simulation environment. In the first stage, the PV module is simulated at STC and three PSCs with multiple peaks (LMMPs and GMPP). In the second stage, the proposed system, which consists of the converter, controllers, and MPPTs, is verified using the simulation results. The INC-MPPT, P&O-MPPT, and proposed MPPT are compared to investigate their performance and robustness to interference. Results show that the proposed MPPT system is a more robust and highly efficient technique for the PV system than the two other MPPT techniques. The solar irradiation patterns are kept similar for the three algorithms. First, simulation results are obtained using the algorithms in the STC at 1000 W/m2 and 25 °C. The sampling time and simulation time for the MPPT controller are selected as 0.02 s and 1 s, respectively. The switching frequency of the converters is chosen as 10 kHz. The step size of the duty cycle in both the conventional algorithms and the proposed algorithm is 0.0001.
4.1. P-V and I-V Characteristics Curves for Uniform and Shading Pattern 1, 2, and 3
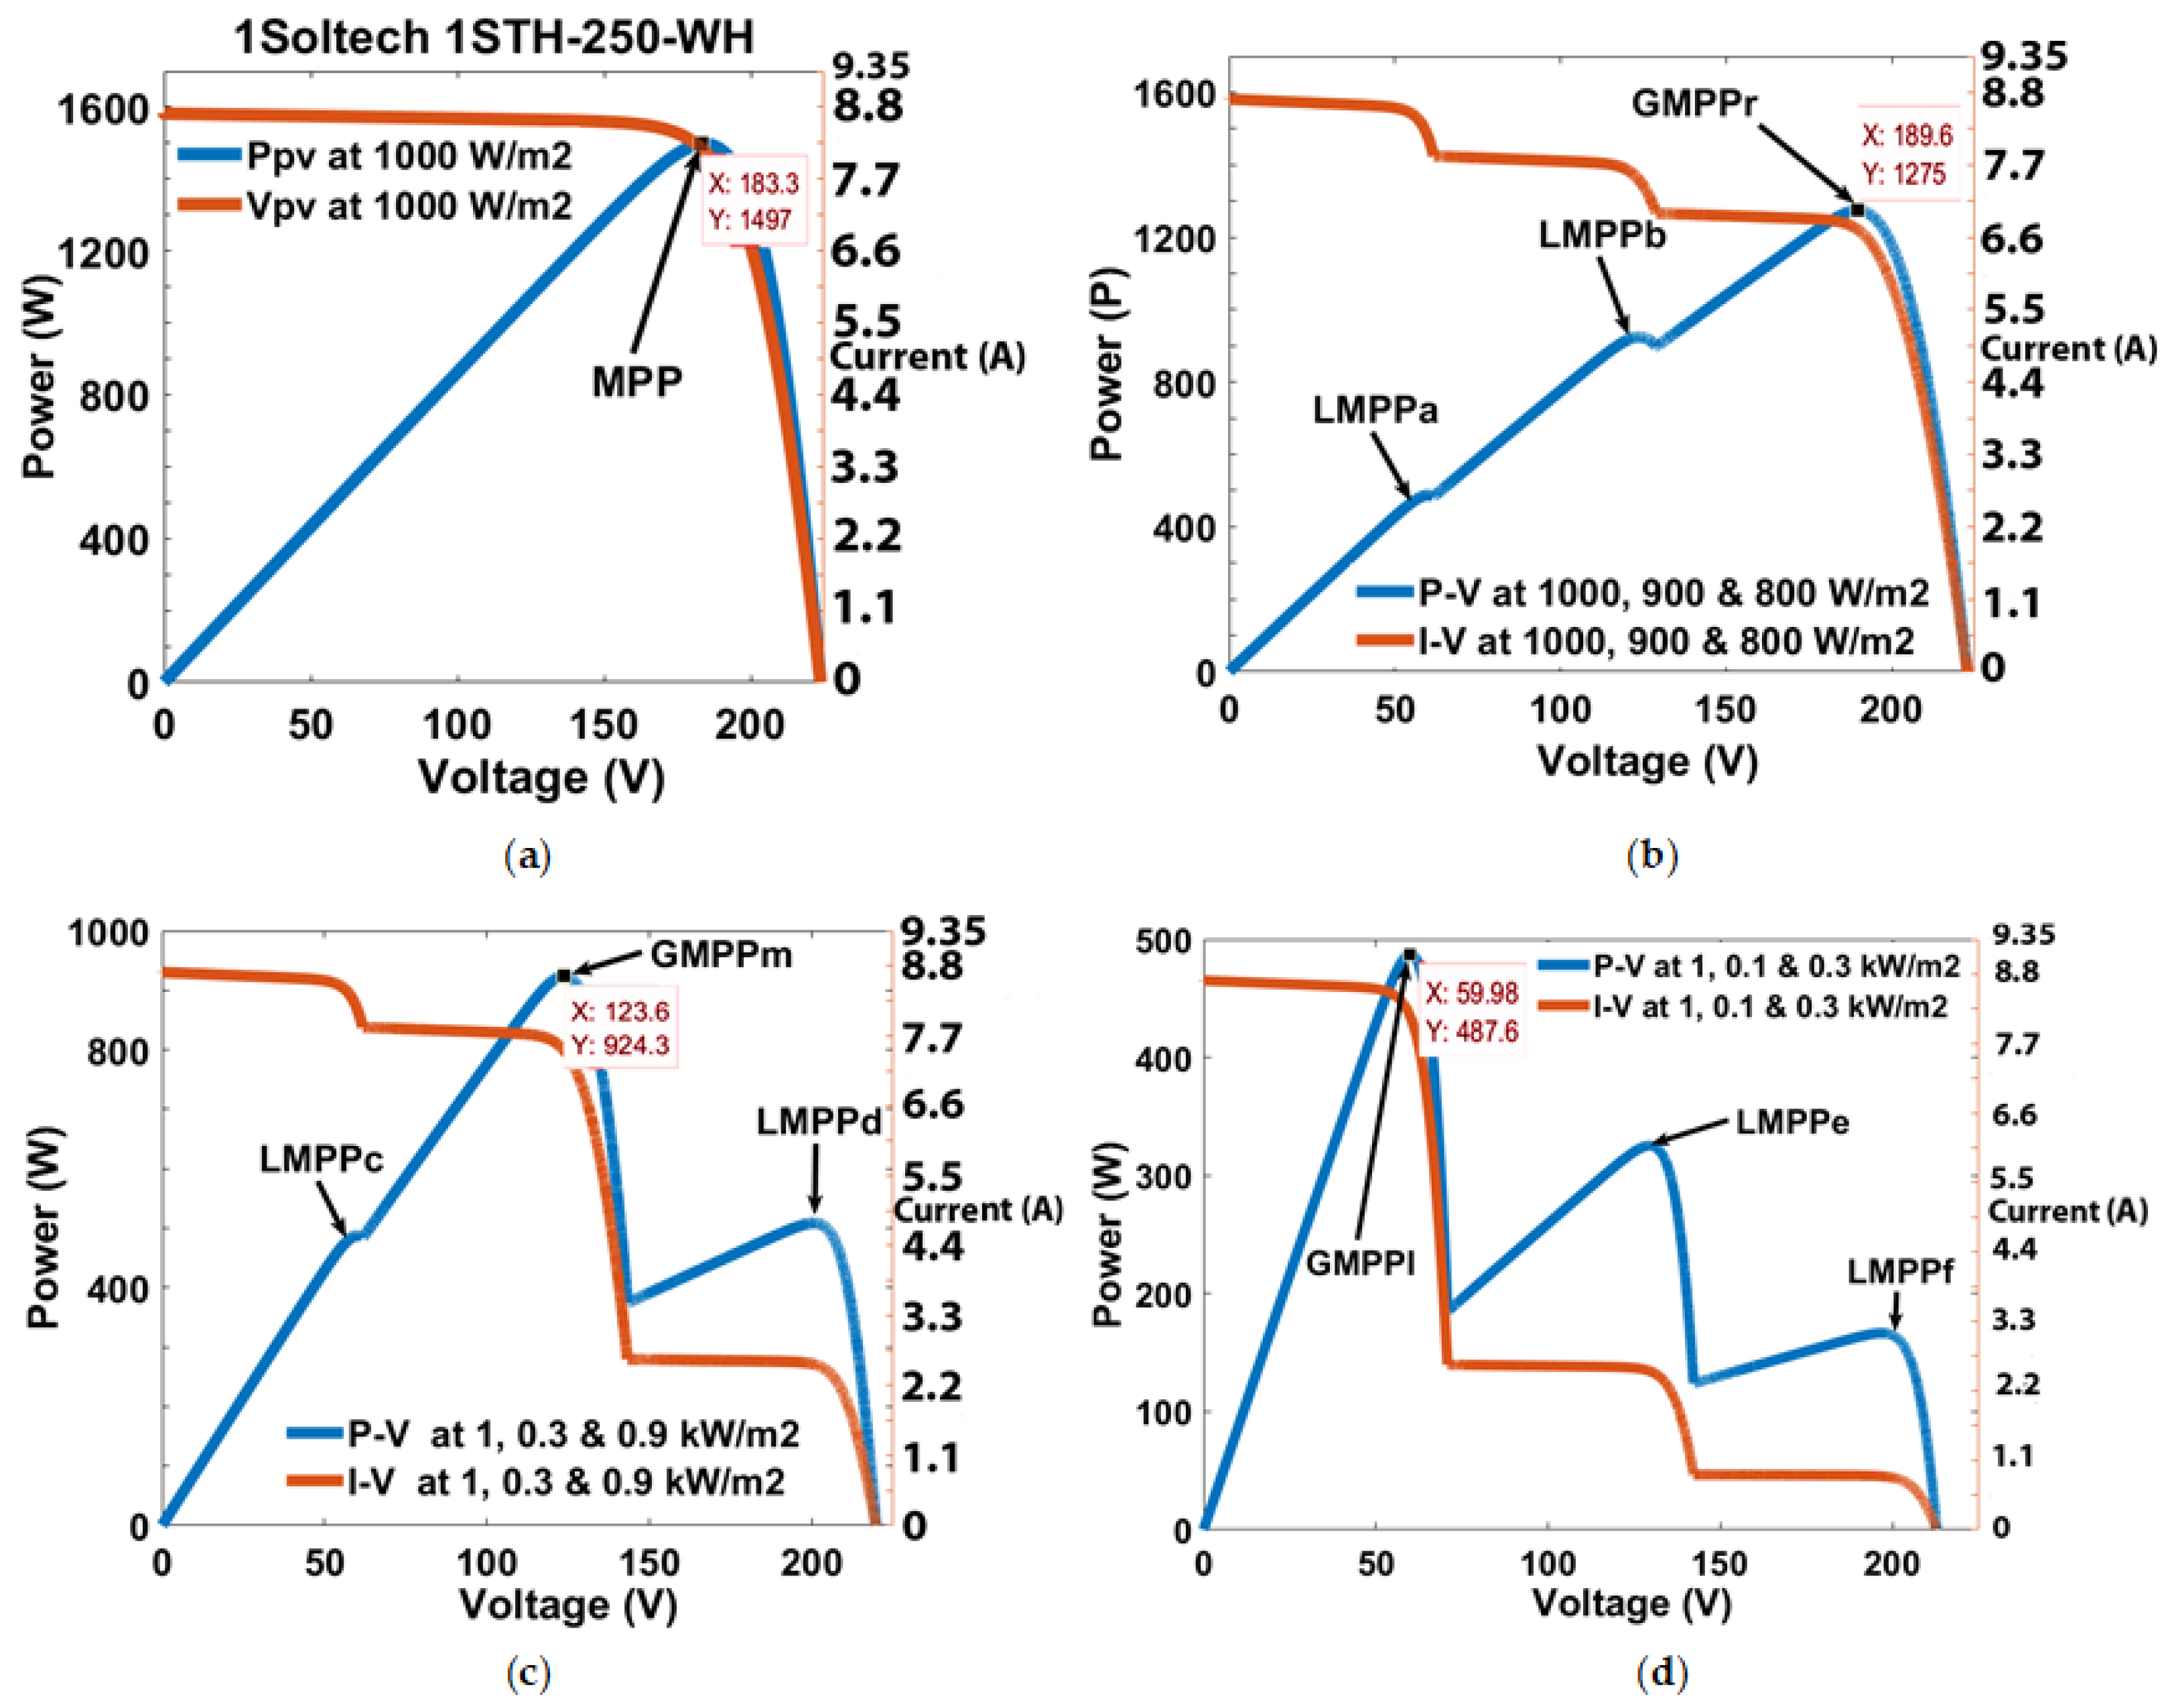
Figure 9 shows the characteristic curves of a PV panel under an acute and three PSCs containing three peaks on each PV curve. A detailed explanation of the chosen shading patterns and corresponding waveforms given below:
Figure 9a: P-V and I-V characteristics curves generated from the pattern 4a at STC weather condition (1000 W/m
2 and 25 °C). This uniform weather condition generates a single MPP coordinate (183.9 V, 1497 W) on the linear curves.
Figure 9b: Three PV modules; M1, M2, and M3 are exposed to 1000, 900, and 800 W/m
2 irradiances to generate a GMPP
r (1.28 V and 0.144 kW) and other two LMPPs (LMPP
a and LMPP
b).
Figure 9c: The M1, M2, and M3 PV modules are responsible for 1, 0.3, and 0.9 kW/m
2 with the GMPP
m value being 0.924 kW. The connected bypass diodes along with each PV module enable bypassing the maximum current flow generated by non-shaded modules. Therefore, two more local MPPs (GMPP
c and GMPP
d) occurred on the P-V graph.
Figure 9d: PV modules; M1, M2, and M3 are designed to receive 1, 0.2, and 0.4 kW/m2 with an approximate value of GMPP
l being 0.488 kW. Other than the GMPPs, two LMPPs (LMPP
e and LMPP
f) occurred on the P-V curve because of an unequal current flow across each PV module.
Conventional MPPT schemes are inefficient for locating the GMPP smoothly because of multiple power peaks on the same P-V wave shape (
Figure 9b–d). The PV system is highly degraded because of the wrong tracking direction of an operating point under the three discussed PSCs, especially when conventional and evolutionary algorithms are used to realize the GMPP.
4.2. Acute Weather Condition
Figure 10b shows the simulation of power waveforms for conventional INC, P&O, and proposed algorithms under uniform solar insolation on the PV array. In this dynamic weather condition, the maximum power of the PV array is measured at 1497 W. Power oscillations considered in both the INC and P&O algorithms are much higher than the proposed MPPT scheme (zero oscillation). The power fluctuation in the former two algorithms during the steady-state condition is approximately 30 W and 25 W, respectively, whereas no considerable power loss was found in the proposed algorithm. The percentage of MPPT capability is 98.2%, 98.3%, and 99.99% in the INC, P&O, and proposed algorithms, respectively, indicating that the proposed algorithm is superior in terms of tracking performance.
Similarly, no oscillation occurred in the current and voltage graphs and running of the proposed algorithm under this condition, as demonstrated in
Figure 10c,d. Coordinated PI-MPPT achieved 0.13 and 0.11 s faster tracking speed than the conventional INC and P&O techniques.
Figure 10e shows how the step change of the duty cycle occurs during the simulation time (from 0 to 1 s). A decreasing and increasing trend of the duty cycle appeared until 0.14 s of the simulation time in the INC, P&O, and the proposed algorithms. It is estimated that the proposed algorithm stops the iterations of the duty cycle after passing transient time (0.15 s) and tracks GMPP whereas the other algorithms continue the perturbation to the next level. The changes in the duty cycle perturbation during the SSC observed in the INC and P&O algorithms are 0.01 and 0.02, respectively, whereas that for the proposed system has a constant value.
4.3. Shading Pattern 1
Figure 11b–e show the results of comparative analyses of power, voltages, currents, and duty cycles between the MPPT methods. These waveforms are drawn from the shading pattern 1 in which the GMPP location is on the right side of the PV curve. The proposed technique tracks the right GMPP because the searching process enables the rapid convergence of the operating point toward GMPP.
The duty cycle (0.458) also converges to the best location of the GMPP in the proposed algorithm, whereas the HC MPPT schemes cannot stop the fluctuation of the duty cycle values even after tracing the path of the GMPP locus. Power fluctuations under SSC in both the INC and P&O algorithms in this shading condition are 117 and 125 W, respectively, compared with the zero power loss in the proposed coordinated techniques (
Figure 11a).
To track the GMPP, the proposed technique requires a 0.13 s tracking speed.
Figure 12b shows no occurrence of voltage oscillation in the proposed algorithm, whereas the INC and P&O consist of 24.5 V and 27.9 V oscillations around GMPP.
Figure 11c depicts a comparative analysis of the PV currents of different algorithms. The steady-state oscillations in PV currents are measured at 0.462 and 0.518 A in both the former and latter conventional MPPT techniques. However, the proposed MPPT scheme removed the current fluctuation when its operating point converged toward the GMPP.
Nevertheless, the accuracy of the proposed system improved because no noticeable perturbation was observed in the duty cycle at the GMPP location. The proposed method acquired 0.45% and 0.27% tracking efficiencies higher than those of the INC and P&O MPPT techniques, respectively.
4.4. Shading Pattern 2
Figure 12b demonstrates the power waveforms of the PV configurations designed for two conventional techniques and the proposed one for shading pattern 2 (middle GMPP case). Power oscillations more than approximately 100 and 84 W were measured in the conventional INC and P&O MPPTs, respectively, than in the proposed technique.
This shows that conventional MPPT algorithms are stuck at one of the local MPPs instead of tracking true GMPP on the PV curve, resulting in greater power losses in the algorithms. Therefore, the tracking accuracy of the proposed algorithm is higher than that of the traditional algorithms by 36.7% and 36.5%, respectively. Similarly, a substantial number of oscillations are drawn in the voltage and current waveforms in conventional techniques; (20.5 V and 1.5 A) associated with the INC, and (15.6 V and 1.54 A) with P&O (
Figure 12c,d). Moreover, the tracking speed (0.22 s) of the proposed technique is much faster than those of the conventional ones (0.29 and 0.3 s), as the operating point converges the duty cycle rapidly toward the GMPP. The proposed algorithm requires only a few duty cycle perturbations to reach the GMPP, resulting in substantial improvements in tracking speed and convergence time.
Figure 12e shows the waveforms of the duty cycle perturbation in different algorithms. The duty cycle of the GMPP location is calculated as 0.647, which is satisfied by the proposed technique under SSC for shading pattern 2. However, a fluctuation of 0.02 in the duty cycle step size is found in the conventional HC MPPT algorithms, whereas the constant duty cycle is operated in the proposed scheme under SSC.
4.5. Shading Pattern 3
Figure 13b–e show the comparative PV curves of the INC, P&O, and coordinated PI-MPPT algorithms. Oscillations in power, voltage, and current are calculated after converging the operating point to the SSC. In the proposed MPPT technique, no power oscillation appeared at SSC, whereas the others show extensive power losses even after pretending to track GMPP location. Power oscillations in the former and latter conventional algorithms are exposed at 31 and 22 W, respectively. The proposed method remains on the GMPP at 0.825 duty cycle of the boost converter after perturbing 0.4, 0.55, 0.47, and 0.51 consecutively. Consequently, the tracking performance of the proposed algorithm is much higher than that of the conventional techniques by 24.56% and 23.06%, respectively. Therefore, it achieved 99.86% power efficiency at SSC.
4.6. Performance of H-Bridge VSI
The H-bridge VSI is controlled by PLL, PR, SPWM pulses, and PI controller to produce a constant grid voltage and frequency (250 V and 50 Hz, respectively).
Figure 14a shows the steady-state response of the grid voltage (249.5 V) and current (10.48 A) waveforms of the proposed algorithm under uniform weather condition at a power of 1497 W. Note that the waveforms are in phase and no ripple components appeared in them.
Figure 14b illustrates the current and voltage waveforms from the unity power factor operation of the utility grid at shading pattern 1. The peak value of the current injected into the grid decreases, maintaining the same phase and unity power factor. Thus, ripple-less grid voltage and current are measured as 251 V and 7.2 A.
Figure 14c depicts the grid voltage and current applying shading pattern 2, which are synchronized with the grid phase and frequency because of the correct use of synchronization techniques and controllers. The designed control system on the grid-side tracks the grid sinusoidal parameters with a frequency of 50 Hz and eliminated the SSE by the PR controller.
Figure 14d illustrates the voltage and current waveforms of the grid load with an accurate demonstration of their phase and frequency synchronization with the grid. The voltage and current are 250.2 V and 3.1 A, respectively, when the VSI is operating under shading pattern 3.
5. Experimental Validation
To validate the analysis of the model design, experimental work was conducted for four types of solar insolation profiles and shading patterns. The proposed topology was run to a series of experimental works by investigating the performance of the conventional and proposed MPPT algorithms.
To analyze the tracking speed, convergence time, and power oscillations against the shaded illumination levels, a series-connected PV module (Model Atlantis Energy Systems SS125LM) was used to build the PV array in both the solar array simulator (SAS) and table modes of Agilent solar simulator. A low-power (213.33 W at STC) PV module was chosen because of a limitation in the power configuration of the simulator. A dSPACE board, MATLAB software, and the solar simulator were interfaced with the proposed topology to generate a PWM signal in controlling converter switch at 10 kHz frequency. The dSPACE controller was also used to sense current and voltage from the boost converter through the analog-to-digital (ADC) converter ports, triggering the waveforms.
Figure 15 shows a scaled-down prototype of an experimental setup comprising a digital oscilloscope (LeCroy), DC power supply units, DC/DC boost converter, DSP dSPACE board, gate drives, sensors, filter circuits, solar simulator interface, and load. Furthermore, the hardware schematic and design parameters were analyzed through the experimental setup under uniform and shaded conditions. These results were then compared with PI-P&O and PI-INC algorithms. The conventional and proposed MPPT schemes were evaluated for shading pattern 1 (five modules per string in each series-connected panel at 1, 0.8, and 0.6 kW/m
2), pattern 2 (five modules per string in each series-connected panel at 1, 0.5, and 0.2 kW/m
2), and pattern 3 (five modules per string in each series-connected panel at 1, 0.1 and 0.3 kW/m
2).
A modular SAS (E4360A, Agilent Technologies) was used to obtain different levels of solar irradiance curves (uniform and partial shading patterns). Initially, uniform and partially shaded PV curves were transformed into comma-delimited value (CSV) files in a MATLAB Simulink environment. These CSV files comprised P-V and I-V curve values, which generated MPPs and GMPPs at the uniform, right, middle, and left sides of the waveforms. The files were uploaded and implemented in the solar simulator interfaced with a laptop to display the graphical user interface (GUI) on the screen. To operate the simulator, Keysight Connection Expert 2018 software and Web User Interface (WUI) were used to select and run the partial shading patterns and designed modules. The solar simulator supplies different power schemes produced from the partially shaded PV array to the input side of the boost converter. To sense the current and voltage from the PV output curves, two sensors (LV-25P and LA-25NP) were used as the transducers in this experimental analysis. The dSPACE hardware board reads the sensed values of the voltage and current to implement the algorithms with the proper selection of gain parameters. To measure the current and voltage of the sensors in experimental analysis, the same value of the sampling time is used as in the simulation environment. Therefore, the input of the converter was connected to the output of the sensors.
5.1. P-V and I-V Characteristics Curves for Unifrom and Shading Pattern 1, 2, and 3
Figure 16 shows the characteristic curves of a PV panel under an acute and PSCs containing multiple peaks on each PV curves. The power of these selected irradiance profiles is approximately 7 times less than the simulation patterns since Agilent solar simulator cannot support more than 350 W.
Figure 16a shows the P-V and I-V characteristics curves in which each PV module is operated to STC weather (1000 W/m
2 and 25 °C) condition. Hence, the PV array generates a single MPP coordinate (43.5 V, 213.6 W) on the P-V curve.
Figure 16b demonstrates a GMPP
r (0.144 kW) and two corresponding LMPPs (LMPP
a and LMPP
b) occurred on the P-V curve at shading pattern 1.
Figure 16c depicts P-V and I-V graphs for shading pattern 2, consisting of a GMPP
m (0.078 kW) and two other local MPPs (LMPP
c and LMPP
d).
Figure 16d shows an approximate value of GMPP
l being 0.064 kW, and two LMPPs (LMPP
e and LMPP
f) that occurred on the P-V curve because of an unequal current flow across each PV array. These uniform and shading patterns are regenerated in the solar simulator to verify the performance of the MPPT algorithms in the experimental environment.
5.2. Experimental Result for Uniform Weather Condition
Figure 17a–c shows the tracking outcomes of the conventional P&O, incremental conductance, and proposed MPPT schemes under no partially shaded condition.
Figure 17a represents the power, voltage, and current waveforms of the conventional incremental conductance algorithm. This algorithm tracks MPP within 0.3 s. However, it contains numerous power oscillations (210.5–212.66 W) under STC. Instead, of a duty-cycle perturbation at SSC, this algorithm moves the operating point based on the range of the duty cycle (0.273–0.278).
Hence, the average tracking efficiency is 99.59% by considering the highest peak of the power curve. Similarly, MPPT efficiency is found at 99.88% using the P&O algorithm (
Figure 17b). The P&O MPT took 0.28 s to reach MPP under this condition while experiencing power fluctuations (211–213.29 W).
Figure 17c shows the line graphs of the tracking GMPP and P-V characteristic curves of the proposed algorithm. The operating point of this algorithm starts propagating from a higher voltage location to a lower one to find GMPP on the power curve. After completing some iterations of the duty cycle, the proposed algorithm achieves a faster GMPP location, which is 0.17 s. This algorithm terminates the searching process while confirming GMPP at the right place during the SSC. Therefore, oscillations in power, voltage, and current graphs are negligible because no perturbation is required, and a constant duty cycle (0.273) of the boost converter was maintained at GMPP. The proposed algorithm is found more efficient (99.99%) than the conventional MPPT techniques. Because more changes occurred in the conventional algorithms at the GMPP location, the duty cycle of the converter was inconsistent under the SSC. However, these constraints were overcome by the proposed technique with rapid tracking and convergence speeds.
5.3. Experimental Result for Shading Pattern 1
Figure 18 shows the experimental results for shading pattern 1 (1, 0.8, and 0.6 kW/m
2) in which the GMPP is located at the right side of the PV curve. The powers of GMPP and two local MPPs are 143.6, 118.7, and 64.52 W, respectively.
Figure 18a depicts the power, voltage, and duty cycle graphs obtained using the incremental conductance MPPT algorithm. Here, the conventional INC can track GMPP under SSC after some perturbations of the duty cycle. The power fluctuation (137.676–140.98 W) around GMPP under SSC is also not high. Consequently, 99.59% of power efficiency is obtained from shading pattern 1. The INC scheme requires at least 0.18 s to converge the operating point toward the GMPP location with duty cycle changes from 0.181 to 0.22. Conversely, the conventional P&O algorithm can track the GMPP location within 0.2 s with duty cycle changes between 0.2 and 0.218 (
Figure 18b). The P&O MPPT experiences a lesser amount of power oscillation around GMPP (139.8–143.06 W) than the INC. Hence, the P&O algorithm achieves a similar amount of tracking efficiency (99.62%) as the INC algorithm.
Figure 18c shows the PV characteristic waveforms and tracking results of the proposed MPPT technique. The operating point of the PV array is rapidly driven and adjusted toward the GMPP location, requiring only 0.12 s tracking speed, where the proposed algorithm is satisfied and verified with the simulation test. Having a certain number of iterations in the duty cycle perturbation, the proposed method stops the operating point at the GMPP and maintains a 0.223 duty cycle under SSC. As comparison under this shading pattern 1, both conventional INC and P&O failed to remove power oscillations under the steady-state condition, whereas the proposed method experienced no power fluctuations. Nevertheless, the proposed scheme showed 99.92% power efficiency during the GMPP tracking period under SSC.
5.4. Experimental Result for Shading Pattern 2
Figure 19a–c shows the results of the MPPT schemes applied in PSC 2. The conventional INC and P&O techniques failed to track the true GMPP location for this partially shaded pattern, as they canceled the searching process after reaching an LMPP on the PV curve (
Figure 19a,b).
The power of the LMPP tracked by both conventional MPPT schemes continuously oscillates between 48 and 50 W, indicating that the operating point moves around the local MPP (49.12 W). Thus, the methods provide lower tracking efficiency (62.1%) and require more time (0.23 s) to track the LMPP instead of the GMPP locus. Moreover, they never stop duty cycle perturbation (0.152–0.187), although one of the LMPPs is tracked under SSC. Therefore, both conventional MPPTs degrade severely and prevent the operating point to move closer to the GMPP area in this shading pattern.
Figure 19c shows that the experimental results of the proposed coordinated algorithm in shading pattern 2 are satisfied with the simulation outputs on a similar PV curve. The operating point of the converter is first located nearer to an LMPP point (50.25 V, 49.12 W) and then slides back to track the GMPP point (30.71 V, 77.72 W). After tracking the GMPP within 0.18 s, the proposed algorithm stops searching for the MPP and is stuck at a duty cycle of 0.489 under SSC. Hence, the proposed algorithm ensures a tracking efficiency of 37.22% more than both conventional techniques and can track the GMPP rapidly with no power loss under the SSC on the PV curve with 99.87% power efficiency. Therefore, only the proposed algorithm can manage this worsening weather condition and enables the operating point to always be in the GMPP region.
5.5. Experimental Result for Shading Pattern 3
Figure 20a–c illustrates the experimental results of the conventional and proposed MPPT schemes for shading pattern 3. In this shading pattern, GMPP, LMPP1, and LMPP2 comprise 64.34, 47.63, and 25.08 W in descending order, while voltages are held at 13.18, 31.31, and 48.98 V, respectively.
As depicted in
Figure 20a, the conventional INC algorithm failed to reach nearer to the GMPP location while experiencing this environmental condition. The INC algorithm starts searching for a local MPP location throughout the PV curve and ends up tracking a local MPP point, which exerts power oscillation (46.52–48.53 W) and duty cycle perturbations (0.451–0.471) at that MPP point. Therefore, only 73.67% power efficiency is confirmed and 0.42 s is required to reach closer to the LMPP coordinate (31.31 V, 47.63 W). Similarly, the ordinary P&O algorithm failed to track GMPP and located the same LMPP location with different power oscillations (48.415–48.3 W) (
Figure 20b). A continuous duty cycle perturbation occurred from 0.474 to 0.477 in the P&O technique under SSC. Thus, this algorithm is unreliable for tracking GMPP in the shading pattern 3, because of low tracking efficiency (73.51%) and slow tracking speed (0.51 s). However, GMPP is tracked accurately within 0.25 s when using the proposed algorithm under this shading condition (
Figure 20c). Dragging the operating point to the stage of SSC and reaching the GMPP, requires only 0.25 s in the proposed method. In this method, the perturbation of the duty cycle starts from the right side of the PV curve to search for the MPP and stops at the left side GMPP (13.18 V, 64.2 W) and the maximum power efficiency (99.83%) is confirmed. However, one disadvantage of tracking the GMPP using the proposed technique is that MPPT should be operated at a constant duty cycle of 0.778 under SSC. Comparatively, the proposed technique is two times more efficient than conventional techniques.
5.6. Experimental Results for the VSI
Figure 21a–c show the voltage and current waveforms of the unity-powered utility grid when DC power is fed by the VSI in the uniform, right, middle, and left shaded P-V curves. These waveforms are directly interfaced with the scaled-down power grid because they do not show unexpected ripple components and THD.
The sinusoidal grid current and voltage waveforms are taken from the SSC by neglecting the transient period of the system.
Figure 21a shows the grid current (Ig) is in phase with grid voltage (Vg), maintaining unity power factor and supplying power to the grid with 3.56 A at uniform weather condition.
Figure 21b shows the output power of the VSI reduces at shading pattern 1, because of the current decreases by 1.17 A, and maintaining the grid voltage of 59.7 V. Similarly,
Figure 21c–d show the grid currents and voltages are 59.3 V and 58.7 V, and 1.29 A and 1.07 A, respectively, under the shading patterns 2 and 3. The experimental and simulation outcomes of the VSI are verified because the same phase and frequency of the grid parameters are obtained from both comparative studies.
6. Comparison with Previous MPPT Techniques
The tracking speeds in INC, P&O, and coordinated PI-MPPT algorithms were calculated as 0.39, 0.5, and 0.17, respectively. Hence, the proposed algorithm can track GMPP almost two times faster than the traditional schemes under this partially shaded condition (shading pattern 3). As illustrated in
Table 4, the coordinated MPPT algorithm is evaluated under non-shading and three shading patterns (right, middle, and left GMPP shading conditions). The proposed algorithm responds faster and can track GMPP within 0.15, 0.35, 0.22, and 0.17 s against normal and shading patterns 1, 2, and 3, respectively.
This section highlights the simulation and experimental results with different contingency analyses of the proposed and HC techniques (
Table 4 and
Table 5). All algorithms can track MPP efficiently (above 99% efficiency) when applied to uniform weather conditions. However, both the conventional techniques still provide some power oscillations and duty cycle perturbations after tracking the MPP location. Tracking and convergence speeds are both higher in the proposed technique than the conventional ones under the uniform weather condition. The conventional techniques cause enormous power loss and provide wrong perturbation size for shading patterns 2 and 3, though a reliable tracking operation assured for the uniform weather and shading pattern 1 conditions. The overall performance of the MPPT techniques is found similar between the simulation and experimental studies. Additionally, it does not exhibit steady-state oscillation, resulting in zero power loss. The tracking efficiencies, by considering uniform and the three shading patterns, are manipulated to 83.89%, 84.38%, and 99.96% in the INC, P&O, and the proposed MPPT schemes. Hence, the proposed MPPT technique exhibits much higher efficiency than conventional algorithms.
Tracking deviation and power loss are overcome in the proposed MPPT scheme with more than 99% power efficiency under all four analyzed weather conditions. Consequently, the proposed technique is more robust, dependable, and efficient than traditional MPPT algorithms under uniform and shading conditions of the PV curve.
7. Conclusions
In this study, an improved PI coordinated MPPT algorithm for the PV system under uniform weather condition and PSCs is proposed to enhance the tracking speed and mitigate steady-state oscillations in the PV power. The performance of the proposed MPPT method is validated both in the simulation platform and experimentally. Experimental and simulation results demonstrate that the coordinated PI-MPPT algorithm tracks the GMPPr (right GMPP), GMPPm (middle GMPP), and GMPPl (left GMPP)faster and is more reliable for the three shade-oriented patterns than conventional MPPT techniques in terms of the tracking of a correct MPP region and identifying the true GMPP faster. The results also show that the proposed MPPT method is faster, more robust, sustainable, and reliable than conventional MPPT schemes when its PV modules incorporated with bypass diodes and multiple MPPs. The robustness of the proposed MPPT technique is obtained by achieving a faster convergence speed and tracking speed as well as zero oscillations around the GMPP under SSC, resulting in negligible energy loss. The tracking efficiency of the proposed algorithm is 99.99%, 99.93%, 99.96%, and 99.86% under uniform weather and shading patterns 1, 2, and 3, respectively.
To proof the effectiveness of the proposed MPPT technique its performance is compared with conventional INC and P&O methods. From the comparison results it is observed that the tracking speed of the proposed method is found to be 13% and 11% faster compared to the conventional INC and perturb and observe (P&O) methods respectively. Also, the steady-state oscillations on the PV output power are observed very low compared to the other two methods.
Author Contributions
Conceptualization, H.I.; Data curation, H.I.; Formal analysis, H.I.; Funding acquisition, S.M., N.M.S., A.W. and M.A.; Investigation, S.M.; Methodology, H.I.; Project administration, S.M.; Resources, H.I.; Software, H.I.; Supervision, S.M., N.M.S. and T.K.S.; Validation, H.I.; Visualization, H.I.; Writing—original draft, H.I.; Writing—review & editing, H.I., S.M., N.M.S., T.K.S., A.W. and M.A. All authors have read and agreed to the published version of the manuscript.
Funding
This research was funded by the Taif University Researchers Supporting Project Number (TURSP-2020/146), Taif University, Taif, Saudi Arabia, and in part by the Joint Research Program between UAE-U and Asian Universities Alliance (AUA) under Grant 31R169.
Institutional Review Board Statement
Not applicable.
Informed Consent Statement
Not applicable.
Data Availability Statement
Data not applicable.
Acknowledgments
The authors would like to acknowledge Shameem Ahmad and Leong Wen Chek in their favor completing this paper.
Conflicts of Interest
The authors declare no conflict of interest.
Appendix A
The simulation codes represent the fundamental of MPPT algorithm are shown below.
Figure A1.
Fundamental MPPT codes of the grid-connected PV system.
Figure A1.
Fundamental MPPT codes of the grid-connected PV system.
References
- Zakaria, A.; Ismail, F.B.; Lipu, M.H.; Hannan, M.A. Uncertainty models for stochastic optimization in renewable energy applications. Renew. Energy 2020, 145, 1543–1571. [Google Scholar] [CrossRef]
- Fatima, T.; Shahzad, U.; Cui, L. Renewable and nonrenewable energy consumption, trade and CO2 emissions in high emitter countries: Does the income level matter? J. Environ. Plan. Manag. 2020, 1–25. [Google Scholar] [CrossRef]
- Ibrahim, A.; Aboelsaud, R.; Obukhov, S. Comprehensive Analysis of PSO and P&O for the Global Maximum Power Point Tracking of the PV under Partial Shading. In Proceedings of the 2019 International Youth Conference on Radio Electronics, Electrical and Power Engineering (REEPE), Moscow, Russia, 14–15 March 2019; pp. 1–6. [Google Scholar]
- Ozdemir, S.; Altin, N.; Sefa, I. Single stage three level grid interactive MPPT inverter for PV systems. Energy Convers. Manag. 2014, 80, 561–572. [Google Scholar] [CrossRef]
- Papež, N.; Sobola, D.; Škvarenina, Ľ.; Škarvada, P.; Hemzal, D.; Tofel, P.; Grmela, L. Degradation analysis of GaAs solar cells at thermal stress. Appl. Surf. Sci. 2018, 461, 212–220. [Google Scholar] [CrossRef]
- Papež, N.; Gajdoš, A.; Dallaev, R.; Sobola, D.; Sedlák, P.; Motúz, R.; Nebojsa, A.; Grmela, L. Performance analysis of GaAs based solar cells under gamma irradiation. Appl. Surf. Sci. 2020, 510, 145329. [Google Scholar] [CrossRef]
- Khezri, R.; Mahmoudi, A.; Haque, M.H.H. Optimal Capacity of Solar PV and Battery Storage for Australian Grid-Connected Households. IEEE Trans. Ind. Appl. 2020, 56, 5319–5329. [Google Scholar] [CrossRef]
- Joisher, M.; Singh, D.; Taheri, S.; Espinoza-Trejo, D.R.; Pouresmaeil, E.; Taheri, H. A Hybrid Evolutionary-Based MPPT for Photovoltaic Systems Under Partial Shading Conditions. IEEE Access 2020, 8, 38481–38492. [Google Scholar] [CrossRef]
- Wang, Y.; Li, Y.; Ruan, X. High-accuracy and fast-speed MPPT methods for PV string under partially shaded conditions. IEEE Trans. Ind. Electron. 2015, 63, 235–245. [Google Scholar] [CrossRef]
- Kermadi, M.; Berkouk, E.M. A hybrid pso-pi based maximum power point tracking algorithm using adaptive sampling time strategy. In Proceedings of the 4th International Conference on Electrical Engineering (ICEE), Boumerdes, Algeria, 13–15 December 2015; pp. 1–6. [Google Scholar]
- Bouchakour, A.; Borni, A.; Brahami, M. Comparative study of P&O-PI and fuzzy-PI MPPT controllers and their optimisation using GA and PSO for photovoltaic water pumping systems. Int. J. Ambient Energy 2019, 1–12. [Google Scholar] [CrossRef]
- Islam, H.; Mekhilef, S.; Shah, N.B.M.; Soon, T.K.; Seyedmahmousian, M.; Horan, B.; Stojcevski, A. Performance evaluation of maximum power point tracking approaches and photovoltaic systems. Energies 2018, 11, 365. [Google Scholar] [CrossRef] [Green Version]
- Sher, H.A.; Murtaza, A.F.; Noman, A.; Addoweesh, K.E.; Al-Haddad, K.; Chiaberge, M. A new sensorless hybrid MPPT algorithm based on fractional short-circuit current measurement and P&O MPPT. IEEE Trans. Sustain. Energy 2015, 6, 1426–1434. [Google Scholar]
- Kabalci, E.; Gokkus, G.; Gorgun, A. Design and implementation of a PI-MPPT based Buck-Boost converter. In Proceedings of the 2015 7th International Conference on Electronics, Computers and Artificial Intelligence (ECAI), Bucharest, Romania, 25–27 June 2015; pp. SG-23–SG-28. [Google Scholar]
- Khaled, A.; Aboubakeur, H.; Mohamed, B.; Nabil, A. A Fast MPPT Control Technique Using PID Controller in a Photovoltaic System. In Proceedings of the 2018 International Conference on Applied Smart Systems (ICASS), Medea, Algeria, 24–25 November 2018; pp. 1–5. [Google Scholar]
- Patel, A.; Tiwari, H. Implementation of INC-PIMPPT and its comparison with INC MPPT by direct duty cycle control for solar photovoltaics employing zeta converter. In Proceedings of the 2017 International Conference on Information, Communication, Instrumentation and Control (ICICIC), Indore, India, 17–19 August 2017; pp. 1–6. [Google Scholar]
- Liu, Y.; Liu, X.; Shi, D.; Zhang, Y.; Wu, Q.; Zhu, Z.; Lin, X. An MPPT Approach Using Improved Hill Climbing and Double Closed Loop Control. In Proceedings of the 2019 IEEE 46th Photovoltaic Specialists Conference (PVSC), Chicago, IL, USA, 16–21 June 2019; pp. 2935–2941. [Google Scholar]
- Sahoo, J.; Samanta, S.; Bhattacharyya, S. Adaptive PID controller with P&O MPPT algorithm for photovoltaic system. IETE J. Res. 2020, 66, 442–453. [Google Scholar]
- Anto, E.K.; Asumadu, J.A.; Okyere, P.Y. PID control for improving P&O-MPPT performance of a grid-connected solar PV system with Ziegler-Nichols tuning method. In Proceedings of the 2016 IEEE 11th Conference on Industrial Electronics and Applications (ICIEA), Hefei, China, 5–7 June 2016; pp. 1847–1852. [Google Scholar]
- Lyden, S.; Haque, M.E.; Gargoom, A.; Negnevitsky, M. Review of maximum power point tracking approaches suitable for PV systems under partial shading conditions. In Proceedings of the 2013 Australasian Universities Power Engineering Conference (AUPEC), Hobart, TAS, Australia, 29 September–3 October 2013; pp. 1–6. [Google Scholar]
- Motahhir, S.; El Hammoumi, A.; El Ghzizal, A. Photovoltaic system with quantitative comparative between an improved MPPT and existing INC and P&O methods under fast varying of solar irradiation. Energy Rep. 2018, 4, 341–350. [Google Scholar]
- Guo, B.; Su, M.; Sun, Y.; Wang, H.; Dan, H.; Tang, Z.; Cheng, B. A robust second-order sliding mode control for single-phase photovoltaic grid-connected voltage source inverter. IEEE Access 2019, 7, 53202–53212. [Google Scholar] [CrossRef]
- Mohamed, M.A.-E.-H. Efficient approximation of photovoltaic model using dependent thevenin equivalent circuit based on exponential sums function. In Proceedings of the 2015 IEEE 42nd Photovoltaic Specialist Conference (PVSC), New Orleans, LA, USA, 14–19 June 2015; pp. 1–6. [Google Scholar]
- Hejri, M.; Mokhtari, H. On the comprehensive parametrization of the photovoltaic (PV) cells and modules. IEEE J. Photovolt. 2016, 7, 250–258. [Google Scholar] [CrossRef]
- Villalva, M.G.; Gazoli, J.R.; Ruppert Filho, E. Modeling and circuit-based simulation of photovoltaic arrays. In Proceedings of the 2009 Brazilian Power Electronics Conference, Bonito-Mato Grosso do Sul, Brazil, 27 September–1 October 2009; pp. 1244–1254. [Google Scholar]
- Peng, Y.; Zheng, S.; Sun, W. Solar PV array reconfiguration under partial shading conditions using optimal control. In Proceedings of the 2019 Chinese Control Conference (CCC), Guangzhou, China, 27–30 July 2019; pp. 7442–7447. [Google Scholar]
- Senthilvel, A.; Vijeyakumar, K.; Vinothkumar, B. FPGA Based Implementation of MPPT Algorithms for Photovoltaic System under Partial Shading Conditions. Microprocess. Microsyst. 2020, 77, 103011. [Google Scholar] [CrossRef]
- El Khateb, A.H.; Abd Rahim, N.; Selvaraj, J.; Williams, B.W. DC-to-DC converter with low input current ripple for maximum photovoltaic power extraction. IEEE Trans. Ind. Electron. 2014, 62, 2246–2256. [Google Scholar] [CrossRef] [Green Version]
- Hauke, B. Basic calculation of a boost converter’s power stage. In Texas Instruments, Application Report November; Texas Instruments Incorporated: Dallas, TX, USA, 2009; pp. 1–9. [Google Scholar]
- da Silva, E.R.; Elbuluk, M.E. Fundamentals of power electronics. In Power Electronics for Renewable and Distributed Energy Systems; Springer: Berlin/Heidelberg, Germany, 2013; pp. 7–59. [Google Scholar]
- Zhang, R.; Wu, A.; Zhang, S.; Wang, Z.; Cang, S. Dynamical analysis and circuit implementation of a DC/DC single-stage boost converter with memristance load. Nonlinear Dyn. 2018, 93, 1741–1755. [Google Scholar] [CrossRef]
- De Souza, K.; De Castro, M.; Antunes, F. A DC/AC converter for single-phase grid-connected photovoltaic systems. In Proceedings of the IEEE 2002 28th Annual Conference of the Industrial Electronics Society, IECON 02, Sevilla, Spain, 5–8 November 2002; pp. 3268–3273. [Google Scholar]
- Panigrahi, R.; Mishra, S.K.; Srivastava, S. Grid integration of small-scale photovoltaic systems—A review. In Proceedings of the 2018 IEEE Industry Applications Society Annual Meeting (IAS), Portland, OR, USA, 23–27 September 2018; pp. 1–8. [Google Scholar]
- Sharif, S. Half-Sine Wave Modulation Technique a New Method for Generating Variable Frequency Sinusoidal Current. IEEE Trans. Power Electron. 2018, 34, 6575–6582. [Google Scholar] [CrossRef]
- Kok Soon, T.; Mekhilef, S.; Safari, A. Simple and low cost incremental conductance maximum power point tracking using buck-boost converter. J. Renew. Sustain. Energy 2013, 5, 023106. [Google Scholar] [CrossRef]
Figure 1.
Topology of single-phase grid-connected photovoltaic system.
Figure 1.
Topology of single-phase grid-connected photovoltaic system.
Figure 2.
Diagram of photovoltaic cell [
25].
Figure 2.
Diagram of photovoltaic cell [
25].
Figure 3.
P-V and I-V waveforms at different solar insolation levels.
Figure 3.
P-V and I-V waveforms at different solar insolation levels.
Figure 4.
Patterns for uniform and partial shading conditions are listed as: (a–d) Shading patterns for PV array of Isoltech 1STH-250-WH; (e–h) Shading patterns for Atlantis Energy System SS125LM.
Figure 4.
Patterns for uniform and partial shading conditions are listed as: (a–d) Shading patterns for PV array of Isoltech 1STH-250-WH; (e–h) Shading patterns for Atlantis Energy System SS125LM.
Figure 5.
A DC/DC boost converter and its functionality: (
a) boost converter configuration; (
b) ON state of the converter; (
c) OFF state of the converter [
31].
Figure 5.
A DC/DC boost converter and its functionality: (
a) boost converter configuration; (
b) ON state of the converter; (
c) OFF state of the converter [
31].
Figure 6.
A Complete closed-loop control system for the voltage-sourced inverter (VSI).
Figure 6.
A Complete closed-loop control system for the voltage-sourced inverter (VSI).
Figure 7.
Bipolar SPWM control complementary pulses.
Figure 7.
Bipolar SPWM control complementary pulses.
Figure 8.
Proposed PI coordinated MPPT algorithm.
Figure 8.
Proposed PI coordinated MPPT algorithm.
Figure 9.
P-V and I-V characteristic curves of the four weather conditions are showed as: (a) uniform weather; (b) shading pattern 1; (c) shading pattern 2; and (d) shading pattern 3.
Figure 9.
P-V and I-V characteristic curves of the four weather conditions are showed as: (a) uniform weather; (b) shading pattern 1; (c) shading pattern 2; and (d) shading pattern 3.
Figure 10.
Simulation results of INC, P&O, and Coordinated PI-MPPT algorithms at STC are listed as: (a) STC waveforms; (b) power; (c) voltage (d); current; and (e) duty cycle waveforms.
Figure 10.
Simulation results of INC, P&O, and Coordinated PI-MPPT algorithms at STC are listed as: (a) STC waveforms; (b) power; (c) voltage (d); current; and (e) duty cycle waveforms.
Figure 11.
Simulation results of INC, P&O, and Coordinated PI-MPPT algorithms at shading pattern 1, are listed as: (a) pattern 1; (b) power; (c) voltage; (d) current; and (e) duty cycle characteristics curves.
Figure 11.
Simulation results of INC, P&O, and Coordinated PI-MPPT algorithms at shading pattern 1, are listed as: (a) pattern 1; (b) power; (c) voltage; (d) current; and (e) duty cycle characteristics curves.
Figure 12.
Simulation results of INC, P&O, and Coordinated PI-MPPT algorithms at shading pattern 2, are listed as: (a) pattern 2; (b) power; (c) voltage; (d) current; and (e) duty cycle.
Figure 12.
Simulation results of INC, P&O, and Coordinated PI-MPPT algorithms at shading pattern 2, are listed as: (a) pattern 2; (b) power; (c) voltage; (d) current; and (e) duty cycle.
Figure 13.
Simulation results of INC, P&O, and Coordinated PI-MPPT algorithms at shading pattern 3. are listed as: (a) shading 3; (b) power; (c) voltage; (d) current; and (e) duty cycle characteristics.
Figure 13.
Simulation results of INC, P&O, and Coordinated PI-MPPT algorithms at shading pattern 3. are listed as: (a) shading 3; (b) power; (c) voltage; (d) current; and (e) duty cycle characteristics.
Figure 14.
Simulation results of the proposed VSI: (a) uniform weather; (b) shading pattern 1; (c) shading pattern 2; and (d) shading pattern 3.
Figure 14.
Simulation results of the proposed VSI: (a) uniform weather; (b) shading pattern 1; (c) shading pattern 2; and (d) shading pattern 3.
Figure 15.
Experimental setup.
Figure 15.
Experimental setup.
Figure 16.
Characteristic curves of the four irradiance profiles for experimental test are showed as: (a) uniform weather; (b) shading pattern 1; (c) shading pattern 2; and (d) shading pattern 3.
Figure 16.
Characteristic curves of the four irradiance profiles for experimental test are showed as: (a) uniform weather; (b) shading pattern 1; (c) shading pattern 2; and (d) shading pattern 3.
Figure 17.
Experimental results under STC: (a) INC-MPPT; (b) P&O-MPPT; and (c) proposed MPPT.
Figure 17.
Experimental results under STC: (a) INC-MPPT; (b) P&O-MPPT; and (c) proposed MPPT.
Figure 18.
Experimental comparison of three MPPT techniques at the right GMPP of the PSC: (a) conventional INC; (b) conventional P&O; and (c) coordinated PI-MPPT algorithms.
Figure 18.
Experimental comparison of three MPPT techniques at the right GMPP of the PSC: (a) conventional INC; (b) conventional P&O; and (c) coordinated PI-MPPT algorithms.
Figure 19.
Experimental comparison of discussed MPPT techniques at middle GMPP of PSC condition: (a) INC-MPPT; (b) P&O-MPPT; and (c) Proposed algorithm.
Figure 19.
Experimental comparison of discussed MPPT techniques at middle GMPP of PSC condition: (a) INC-MPPT; (b) P&O-MPPT; and (c) Proposed algorithm.
Figure 20.
Comparative analysis of the algorithms at the left GMPP of the PSC: (a) INC-MPPT; (b) P&O-MPPT; and (c) Proposed algorithm.
Figure 20.
Comparative analysis of the algorithms at the left GMPP of the PSC: (a) INC-MPPT; (b) P&O-MPPT; and (c) Proposed algorithm.
Figure 21.
Experimental results of the proposed VSI: (a) uniform weather; (b) shading pattern 1; (c) shading pattern 2; and (d) shading pattern 3.
Figure 21.
Experimental results of the proposed VSI: (a) uniform weather; (b) shading pattern 1; (c) shading pattern 2; and (d) shading pattern 3.
Table 1.
Design parameters of the PV array.
Table 1.
Design parameters of the PV array.
| Models/Parameters | MPPs | | | | Imp (A) | |
|---|
Simulation
(Isoltech 1STH-250-WH) | MPP | 223.7 | 183.9 | 8.71 | 8.14 | 1497 |
| 222.8 | 189.6 | 8.71 | 6.72 | 1275 |
| 219.7 | 123.7 | 8.71 | 7.47 | 924.4 |
| 215.9 | 59.98 | 8.71 | 8.13 | 487.64 |
Experiment
(Atlantis Energy System SS125LM) | MPP | 55.5 | 43.5 | 5.22 | 4.91 | 213.6 |
| 54.96 | 47.03 | 5.22 | 3.05 | 143.6 |
| 53.85 | 30.71 | 5.22 | 2.53 | 77.72 |
| 52.99 | 13.18 | 5.22 | 4.88 | 64.31 |
Table 2.
Inverter design parameters.
Table 2.
Inverter design parameters.
| Symbols | Quantities | Values |
|---|
| Nominal grid voltage/frequency | 250 V (RMS)/50 Hz |
| Rated grid current | 4.72 A (RMS) |
| Switching frequency | 10 kHz |
| Nominal DC-Link Voltage | 400 V |
| DC-Link Capacitance | 945 μF, 450 V |
| Bridge side inductor | 3 mH |
| Grid side inductor | 3 mH |
| Filter capacitor | 55 µF, 450 V |
| Filter damping resistor | 1.5 Ω |
| Proportional gain of PI | 3 |
| Integral gain of PI | 200 |
| Proportional gain of PR | 5.7 |
| Resonant gain of PR | 1128.3 |
| Resonant frequency of PR | 314.16 rad/s |
Table 3.
The tuned parameters of the PI controllers.
Table 3.
The tuned parameters of the PI controllers.
| Parameters/PSCs | PI Controller 1 | PI Controller 2 |
|---|
| | | |
|---|
| STC | 0.008 | 9.5 | 0.025 | 2.51 |
| Shading pattern 1 | 0.012 | 20.3 | 0.05 | 3.25 |
| Shading pattern 2 | 0.017 | 50.8 | 0.502 | 5.32 |
| Shading pattern 3 | 0.205 | 100.2 | 0.8 | 8.71 |
Table 4.
Simulation results comparison between the algorithms.
Table 4.
Simulation results comparison between the algorithms.
| Simulated Parameters | MPPT Algorithms |
|---|
| Parameters | INC | P&O | Proposed |
|---|
No PSC
(1497 W) | Oscillation (W) | 1470–1500 | 1473–1500 | No |
| Duty cycle | 0.442–0.452 | 0.44–0.46 | 0.4745 |
| %η of MPP | 98.2 | 98.3 | 99.99 |
| Tracking speed | 0.28 s | 0.26 s | 0.15 s |
PSC for shading pattern 1
(1275 W) | Oscillation (W) | 1150–1267 | 1150–1275 | No |
| Duty cycle | 0.38–0.41 | 0.37–0.41 | 0.43 |
| %η of | 99.48 | 99.66 | 99.93 |
| Tracking speed | 0.19 s | 0.25 s | 0.13 s |
PSC for shading pattern 2
(924.4 W) | Oscillations (W) | 625–925 | 650–914 | No |
| Duty cycle | 0.5–0.52 | 0.49–0.52 | 0.647 |
| %η of | 63.26 | 63.46 | 99.96 |
| Tracking speed | 0.29 s | 0.3 s | 0.22 s |
PSC for shading pattern 3
(487.6 W) | Oscillations (W) | 294–325 | 294–326 | No |
| Duty cycle | 0.18–0.32 | 0.44–0.46 | 0.829 |
| %η of | 75.3 | 76.8 | 99.86 |
| Tracking speed | 0.39 s | 0.5 s | 0.17 s |
Table 5.
Experimental results comparison between the algorithms.
Table 5.
Experimental results comparison between the algorithms.
| Simulated Parameters | MPPT Algorithms’ Performance |
|---|
| Parameters | INC | P&O | Proposed |
|---|
No PSC
(213.58 W) | Oscillation (W) | 210.5–212.66 | 211–213.27 | No |
| Duty cycle | 0.273–0.278 | 0.247–0.253 | 0.273 |
| %η of MPP | 99.59 | 99.88 | 99.99 |
| Tracking speed | 0.3 s | 0.28 s | 0.17 s |
PSC for shading pattern 1
(143.6 W) | Oscillation (W) | 137.7–140.98 | 139.8–143.06 | No |
| Duty cycle | 0.181–0.22 | 0.2–0.218 | 0.223 |
| %η of | 99.59 | 99.62 | 99.92 |
| Tracking speed | 0.18 s | 0.2 s | 0.12 s |
PSC for shading pattern 2
(77.72 W) | Oscillations (W) | 46.65–48.8 | 46.65–49.1 | No |
| Duty cycle | 0.152–0.158 | 0.168–0.187 | 0.489 |
| %η of | 62.22 | 62.22 | 99.95 |
| Tracking speed | 0.23 s | 0.213 s | 0.18 s |
PSC for shading pattern 3
(64.32 W) | Oscillations (W) | 47.52–48.53 | 48.415–48.3 | No |
| Duty cycle | 0.451–0.471 | 0.474–0.477 | 0.778 |
| %η of | 73.51 | 73.67 | 99.83 |
| Tracking speed | 0.42 s | 0.51 s | 0.16 s |
| Publisher’s Note: MDPI stays neutral with regard to jurisdictional claims in published maps and institutional affiliations. |
© 2021 by the authors. Licensee MDPI, Basel, Switzerland. This article is an open access article distributed under the terms and conditions of the Creative Commons Attribution (CC BY) license (http://creativecommons.org/licenses/by/4.0/).


 ,
, 


