1. Introduction
At the very beginning of its development, the railway encountered traffic safety problems. This problem still exists today. Railway safety is a remarkably complex and diversely comprehensive concept. It is one of the most important, if not the most important criteria for the sustainable performance of the railway as a complex transportation system. Without traffic safety, there is no high quality traffic system. Safer traffic is certainly a prerequisite for satisfying a society as a whole. However, traffic, with its dynamism, can also cause undesirable consequences by taking human lives and creating huge material damage. Roads that intersect with railways at the same level, i.e., level crossings, represent risk points, i.e., places where undesirable consequences occur and can occur for both road and railway traffic.
Level crossings should be accepted as a necessary evil and all available measures should be taken in order to reduce the negative consequences of their presence. Problems related to the existence of level crossings are numerous. At level crossings, the continuity of road vehicles is disturbed, and in some cases of railway vehicles too, which results in increased energy consumption, higher environmental pollution, lost time of passengers and staff, increased time of engaging mobile means, and reduced traffic capacity. Negative effects also include the costs of maintaining the level crossing as well as the costs related to certain investment projects. There are obviously many problems related to level crossings, but the main issue is sustainable traffic safety management.
Due to the above, and with the aim of sustainable traffic safety management, certain measures are being taken to reduce this danger to a minimum. The best solutions are when the intersection of roads is in uneven mode (via overpasses and underpasses). However, the fact is that in Bosnia and Herzegovina (BiH), there are a large number of road-railway crossings that are unlikely to be at two levels because their reconstruction requires very large investments, but often the crossings cannot be avoided for technical, historical, and other reasons, so the application of modern technical means is required for their security. The technical means used to secure level crossings are in fact a “warning” to road users that they are approaching a crossing over railway tracks, and these are not means to prevent irresponsible road users from crossing over railway tracks at a time when it should be crossed by a railway vehicle.
If we consider the importance of traffic and the degree of its safety in all spheres of human activity, then it is understandable why there is so much interest of all traffic participants, traffic organizations, and society as a whole in solving safety problems at railway crossings. As a first step, in a function of sustainable railway safety management, it is necessary to solve the issue of level crossings. In this paper, the degree of traffic safety at railway crossings has been evaluated using the example of the Šamac–Doboj railway section.
These are only some of the problems that manifest themselves in the field of traffic safety since they usually arise under the influence of a number of criteria that are not correlated. Considering the above, and the importance and relevance of the field of research, the following goals of the paper stand out. The first goal is the need to form a model for evaluating safety at level crossings and the possibility of forming a set of measures to improve the situation. Further, the second goal involves the development of a novel integrated fuzzy FUCOM (full consistency method; based on a fuzzy Heronian mean operator)–fuzzy PIPRECIA (pivot pairwise relative criteria importance assessment)–fuzzy MARCOS (measurement of alternatives and ranking according to compromise solution) model as a contribution to multi-criteria decision-making processes. The third goal of this paper is to create a novel integrated model for determining the significance of the criteria. All the above mentioned aims describe the originality of the developed integrated fuzzy model, its importance, and achieved contribution of the paper. The advantage of the developed integrated fuzzy FUCOM–fuzzy PIPRECIA–fuzzy MARCOS model is the fact that the created model eliminated the possibility of inadequate ranking compared to similar approaches as we stated further through the paper.
The rest of the paper is divided into five other sections. In
Section 2, a review of the literature related to the field of application is performed.
Section 3 presents materials and methods with a research flow diagram first presented explaining the overall methodology in detail and describing the parameters of the fuzzy multi-criteria decision-making (MCDM) model. The results of the research are presented in
Section 4 with a brief overview of the most important calculations.
Section 5 includes a sensitivity analysis and discussion of the results obtained. Finally, in
Section 6, which refers to the concluding remarks, the most important contributions of the paper are summarized and an overview of future research and a set of improvement measures are given.
2. Literature Review
Many accidents and incidents, especially those with a fatal consequence, occur at the intersections of railways and roads. In order to reduce the number of accidents at level crossings and maintain the safety level at these places, numerous studies have been conducted. Ci Lang et al. [
1] point out that level crossings are one of the most critical issues for the sustainable management of traffic safety and that road accidents account for a third of all railway accidents in Europe. Based on statistics on road accidents, the authors propose Bayesian networks for risk analysis at level crossings in order to establish a framework for improving safety at level crossings. Blagojević et al. [
2] developed a novel integrated entropy-fuzzy PIPRECIA-DEA (data envelopment analysis) model for determining the state of railway safety in BiH under some conditions of uncertainty. The obtained results have been verified through a sensitivity analysis, which implies a change in the impact of five most significant criteria and a comparison with two MCDM methods. Obradović et al. [
3] investigated level crossings in the territory of the Republic of Serbia, where they included 245 level crossings. The research was conducted in order to determine the current situation and identify deficiencies in the railway network. Based on the identified deficiencies, they proposed adequate design and management measures to improve traffic safety at level crossings. Kasalica et al. [
4] applied statistical models to estimate the frequency of accidents, the severity of the consequences of accidents and the empirical risk at level crossings in order to identify places of high risk on the railway network. The authors identified variables that were significantly related to the number and consequences of accidents. The proposed models of frequency and consequences of accidents were used to assess the reduction of accidents at level crossings by applying appropriate technical measures to raise safety levels. In addition, Kasalica et al. [
5] investigated the direct behavior of road traffic participants at passively secured railway crossings. The research was conducted on 61 road vehicle drivers. The results have shown that drivers who have limited visibility cannot estimate the speed of the approaching train well and, as a result, make riskier decisions and cause accidents at level crossings. Djordjević et al. [
6] have developed a new approach for assessing safety at railway level crossings based on the non-radial DEA model. The developed non-radial DEA model is used to assess the railway efficiency of European countries in terms of sustainable safety at level crossings considering desirable and undesirable criteria. The results of the sensitivity analysis of the developed model indicated certain weaknesses related to the number of criteria, as well as the accuracy of the input and output criteria. Pamučar et al. [
7] developed a group multi-criteria FUCOM–MAIRCA (full consistency method–multi-attributive ideal-real comparative analysis) model for selecting a level crossing which requires investing in its equipment in order to increase traffic safety. The FUCOM-MAIRCA model was tested in a case study that included the assessment of ten level crossings within the railway infrastructure in the Republic of Serbia. The developed approach enables bridging the gap that currently exists in the methodology for assessing the level crossings that require investing in their equipment for sustainable traffic safety. Salmon et al. [
8] used the basic principles of the Systems Theoretic Accident Model and Processes (STAMP) control structure method which were then added to the Event Analysis of Systemic Teamwork (EAST) framework and used to examine the sustainable management of level crossing safety. Task, social, and information networks for a life cycle of the railway crossing were developed along with an additional control network showing safety controls and their interrelations. The analysis of the networks points to a need to strengthen activities and controls around proactive risk management and performance monitoring, tightening the links between organizations responsible for safety management and increasing the flexibility of design standards. In order to improve safety at level crossings, Pedro and Márquez [
9] propose the use of advanced information technology, i.e., intelligent failure monitoring and reliability on level crossing safety devices. In addition, Djordjević et al. [
10] propose an information subsystem concept of level crossings within the existing information system of the Serbian Railways infrastructure. The main goal of the paper is to create conditions for more efficient management of level crossings in order to improve traffic safety. The concept of the information subsystem included solutions for monitoring the technical data of accidents at level crossings. Bester et al. [
11] defined a methodology based on stationary, homogeneous, and ergodic Markov processes to assess reliability and safety of devices at level crossings. The authors performed a hazard analysis and risk assessment at level crossings for the purpose of sustainable traffic safety using the tolerable hazard rate (THR) method and calculated the mean time between failures of device using the Windchill Quality Solutions software. Lutovac and Lutovac [
12] proposed a solution to eliminate the shortcomings of existing diagnostic systems and event loggers at level crossings. They developed software for local and remote reading and processing of data using a computer. It enables a more efficient system of maintenance and registration of events at level crossings in order to improve safety. Rudin-Brown et al. [
13] investigated drivers’ behavior at level crossings. Twenty-five drivers aged between 20 and 50 participated in a driving simulator study that compared the efficiency and drivers’ subjective perception of two traffic control devices at an active level crossing: flashing lights with boom barriers and standard traffic lights. Due to its common usage in most Australian states, a stop sign-controlled level crossing served as a passive referent. Although crossing violations were less likely at the level crossings controlled by active devices than at those controlled by stop signs, both types of active control were associated with a similar number of violations. Furthermore, the majority (72%) of drivers stated that they preferred flashing lights to traffic lights. Collectively, the results show that the installation of traffic lights at level crossings could not offer safety advantages over those already provided by flashing lights with boom barriers. Additionally, Lenné et al. [
14] compared drivers’ behavior at two railway level crossings with active controls, flashing red lights and traffic signals, to behavior at the current standard passive control of level crossings, a stop sign. Participants drove the advanced MUARC driving simulator for 30 min. During the simulated drive, participants had three level crossing scenarios. Each scenario consisted of one of three types of level crossing control. The results of the research have shown that traffic signals at level crossings do not provide any safety benefits. Evans [
15] investigates fatal accidents with fatalities at level crossings in Great Britain over the 64-year period 1946–2009. The number of fatal accidents and fatalities per year fell by about 65% in the first half of that period, but since then they have remained more or less constant at about 12 fatalities per year. The paper classifies level crossings into three types: railway-controlled, automatic, and passive. The safety performance of the three types of crossings was very different. Railway-controlled crossings are the best-performing type of crossing, with a declining number of fatal accidents. Automatic crossings have a higher accident rate per crossing than railway controlled or passive crossings, and the accident rates have not been reduced. Passive crossings are by far the most numerous, but many have low usage by road users. Their fatal accident rate remained remarkably constant over the period at about 0.9 fatal accidents per 1000 crossings per year. Hu So-Ren et al. [
16] developed an interesting generalized logit model in order to identify the key parameters responsible for different levels of consequences of level crossing accidents in Taiwan. The model has shown that the technical measures used in Taiwan to raise safety at level crossings, such as separators and obstacle detectors, do not affect the prevention of accidents with more severe consequences. Park et al. [
17] developed multi-stage accident prediction models using a linear regression technique (Poisson regression), as well as a recursive partitioning (RPART) non-parametric method for sustainable traffic safety. The authors classified level crossings into groups according to similar physical and traffic characteristics and used separate accident prediction models for each group. Saccomano et al. [
18] apply a risk-based model to identify level crossings that pose a high risk to sustainable traffic safety. The model consists of two prediction components: predicting the frequency of accidents and predicting the consequences of accidents at level crossings. Austin and Carson [
19] developed an accident prediction model using negative binomial regression. The instrumental variables technique was used in the model in order to correct the influence of variables on each other. However, the effects of several factors are not logical. For example, it has been observed that the presence of “stop” signals and traffic lights affects the increase in the predicted number of accidents, so it is contradictory to expect effects if these measures are applied to raise the level of safety.
3. Materials and Methods
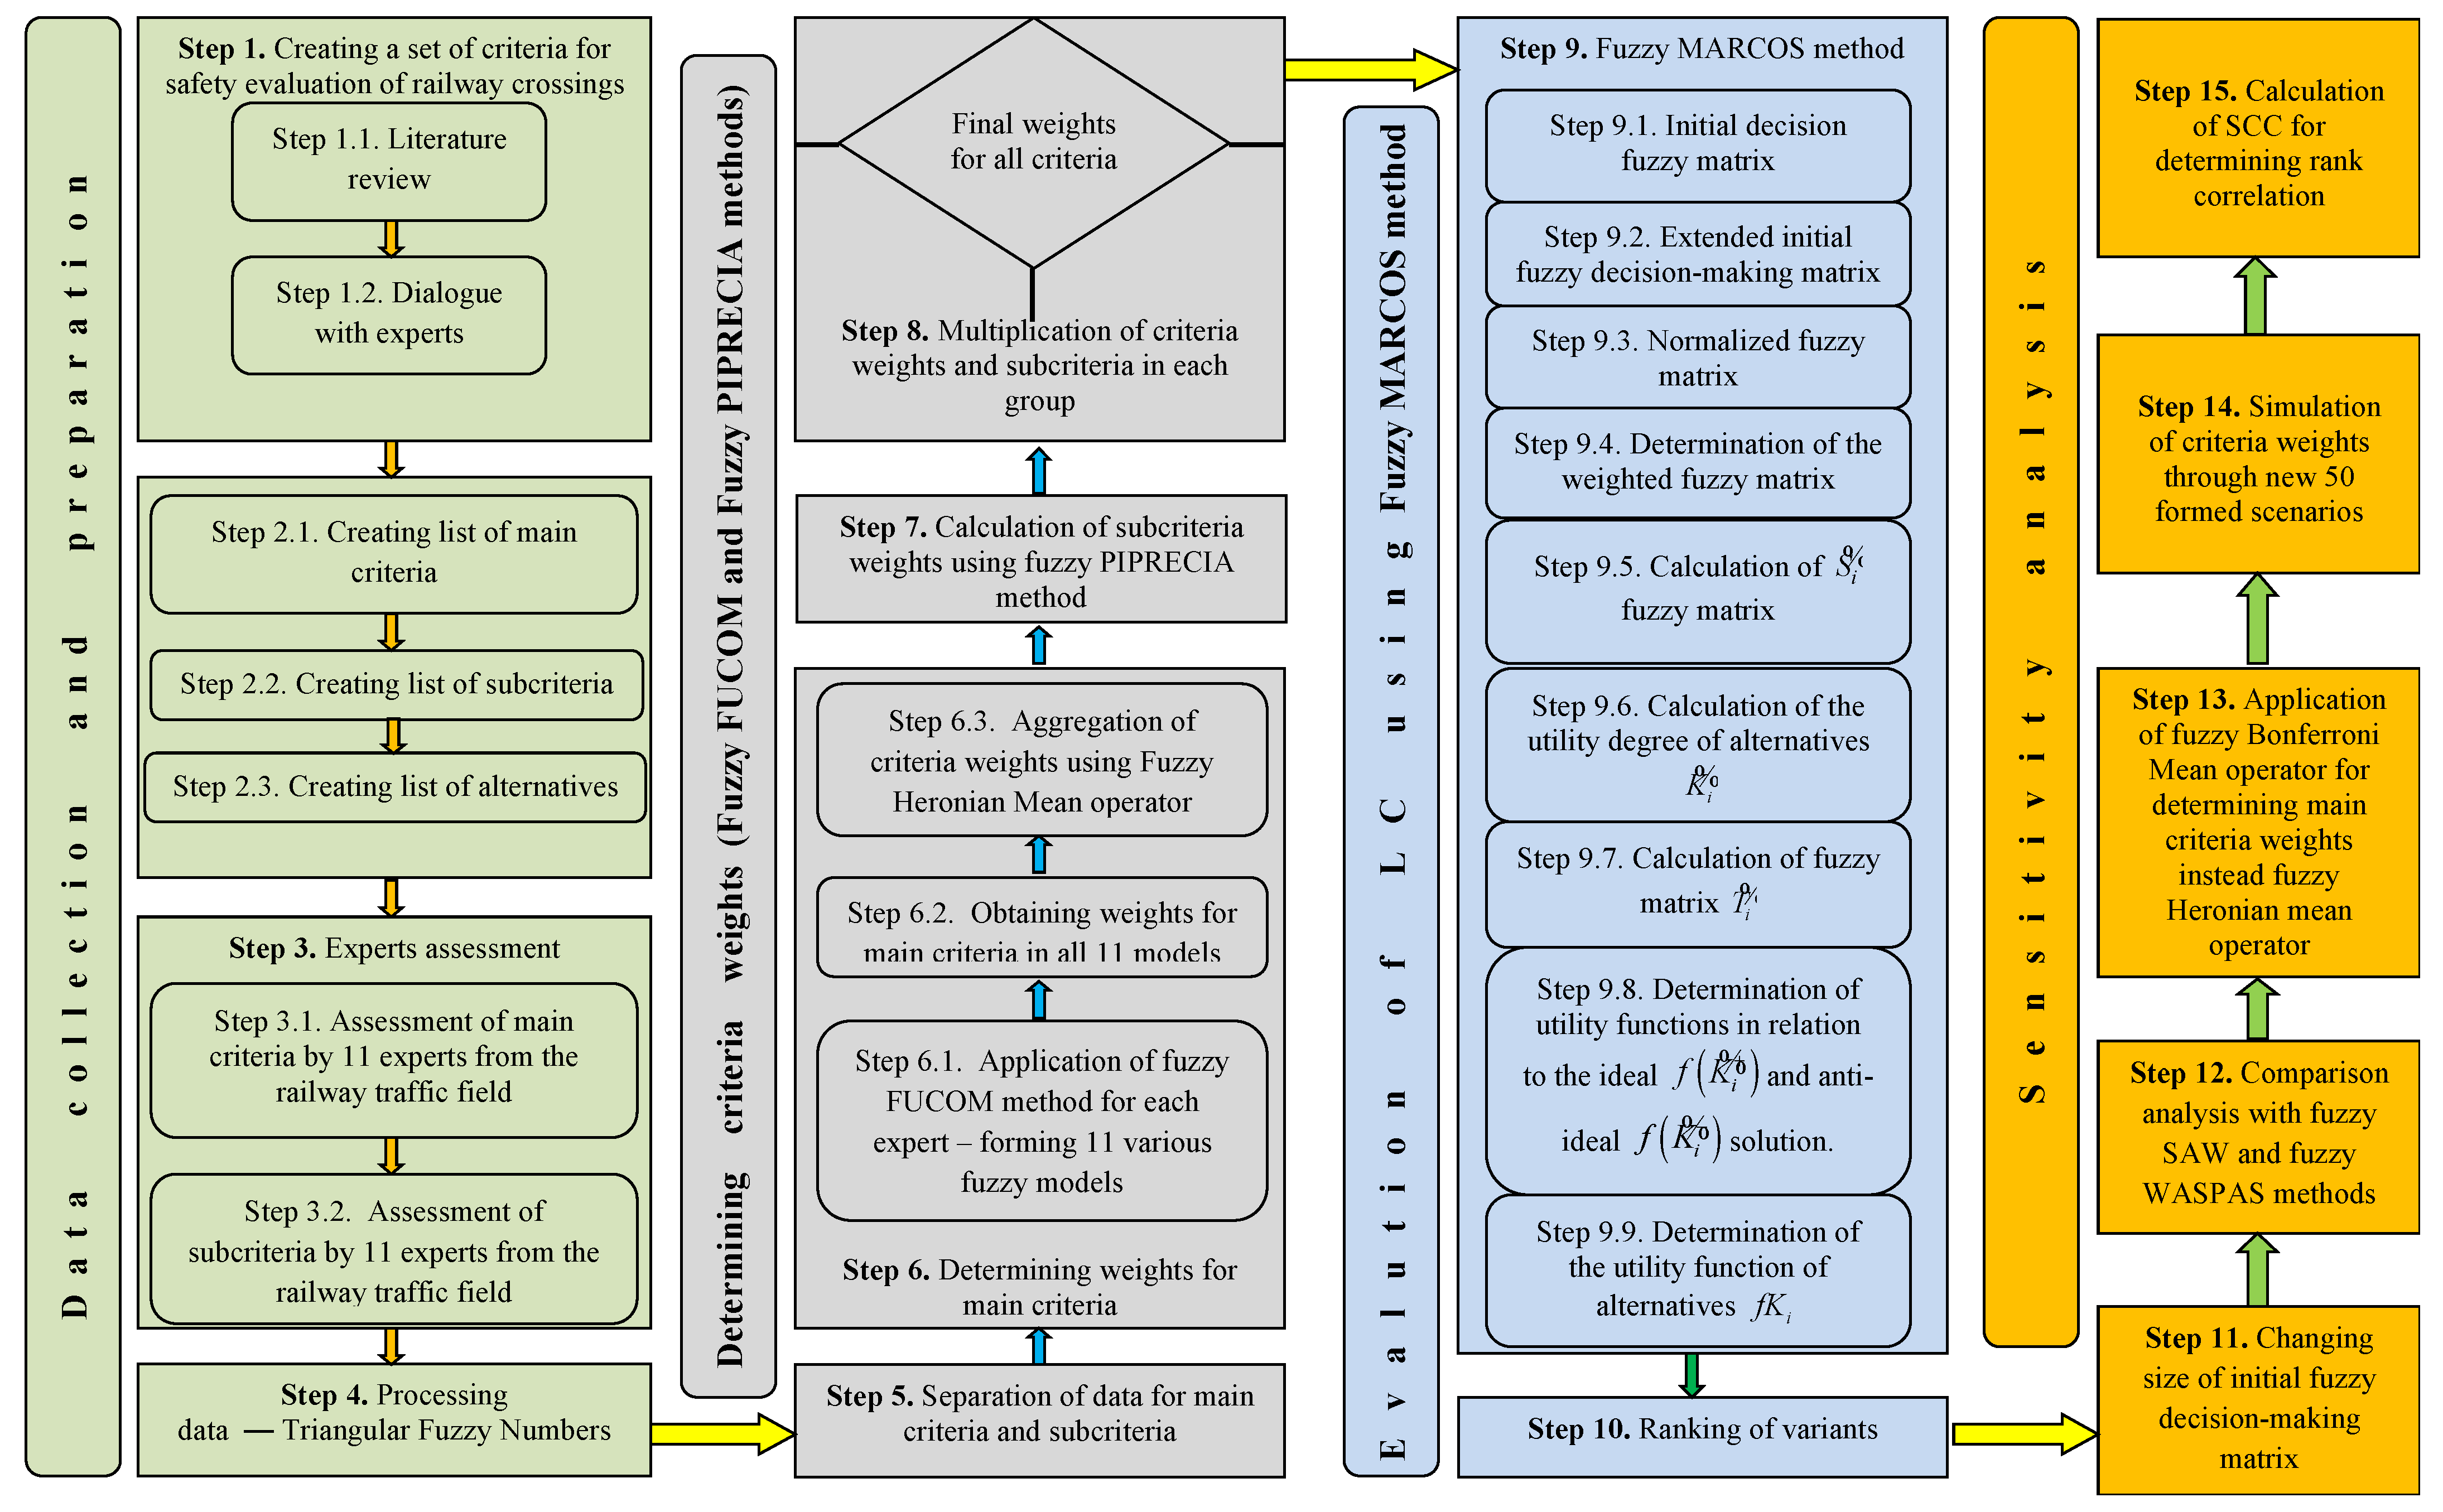
The overall research flow and applied methodology can be presented through four phases composed of a total of 15 steps (
Figure 1).
Figure 1 presents a diagram of research and a proposed integrated fuzzy MCDM model for the evaluation of level crossings on the Šamac–Doboj (Republic of Srpska–RS) railway section. The first phase is data collection and processing and consists of four steps. In the first step, based on a review of the literature of similar studies and discussion with experts in this field, a list of evaluation criteria was created. The second step involved creating a hierarchical structure by defining three main criteria: safety C1, road exploitation characteristics C2, and railway exploitation characteristics C3 at the first level of the hierarchical structure. At the second level, five sub-criteria were defined within each of the main groups of criteria. Safety criteria refer to the types of adverse events at level crossings:
C11—the number of serious accidents, it represents any collision or derailment of trains resulting in the death of at least one person, serious injuries to five or more persons. In addition, it refers to extensive damage to rolling stock (damage of at least EUR 2 million), infrastructure, or the environment, as well as other similar accidents that have an obvious impact on railway safety or on sustainable safety management.
C12—the number of accidents, which represents an unwanted sudden event or a specific series of such events that have serious consequences (collisions, derailments, accidents at level crossings, accidents involving persons caused by railway vehicles in motion, fires…) [
2].
C13—the number of incidents, which includes any event that is not classified as an accident or serious accident, but which is related to the traffic of trains or shunting rolling stock, and thus affects traffic safety.
C14—the number of persons killed, which means that all persons died immediately or within 30 days as a result of the adverse event.
C15—the number of injured persons who were hospitalized for more than 24 h after an accident, serious accident, or incident, other than suicide attempt.
Criteria related to road exploitation characteristics include a group of the following five sub-criteria:
C21—category of the road, which is defined by legal acts and depends on the parameters of the road itself. Three categories of roads appear in this paper: regional, local, and uncategorized.
C22—frequency of road traffic, which means the number of road vehicles on a daily basis that cross the level crossing.
C23—speed of movement of road vehicles, which is expressed in km/h and implies the speed of movement at which the road vehicle approaches the level crossing.
C24—visibility triangle, it represents a space where there are no visible obstacles, i.e., drivers of road vehicles are enabled unobstructed visibility of the railway on both sides. The size of safety triangle, i.e., the visibility of the railway track for road vehicle drivers depends on the road category itself.
C25—the slope of the road, it represents the geometric characteristic of the road and is expressed as a percentage.
When it comes to sub-criteria belonging to a group of railway exploitation characteristics as the third main criterion, the following are singled out:
C31—train speed, expressed in km/h, and it means the speed of the train when approaching and passing over the level crossing.
C32—frequency of railway traffic, it means the number of trains circulating on a daily basis on certain sections of the railway.
C33—the angle of intersection of the railway and the road, it means the angle at which the two types of traffic intersect and is related to the criterion referring to the triangle of visibility.
C34—method of security, when it comes to level crossings that are passively secured, the following methods of security are possible: visibility triangle, signal sign-Andreja′s cross, and stop traffic sign, i.e., some of the combinations of the mentioned methods of security.
C35—the width of the level crossing is expressed in meters and mainly depends on the number of tracks at the crossing. In urban zones and in the station area, there are road crossings where a road crosses several tracks. All this increases the probability of accidents at the level crossing.
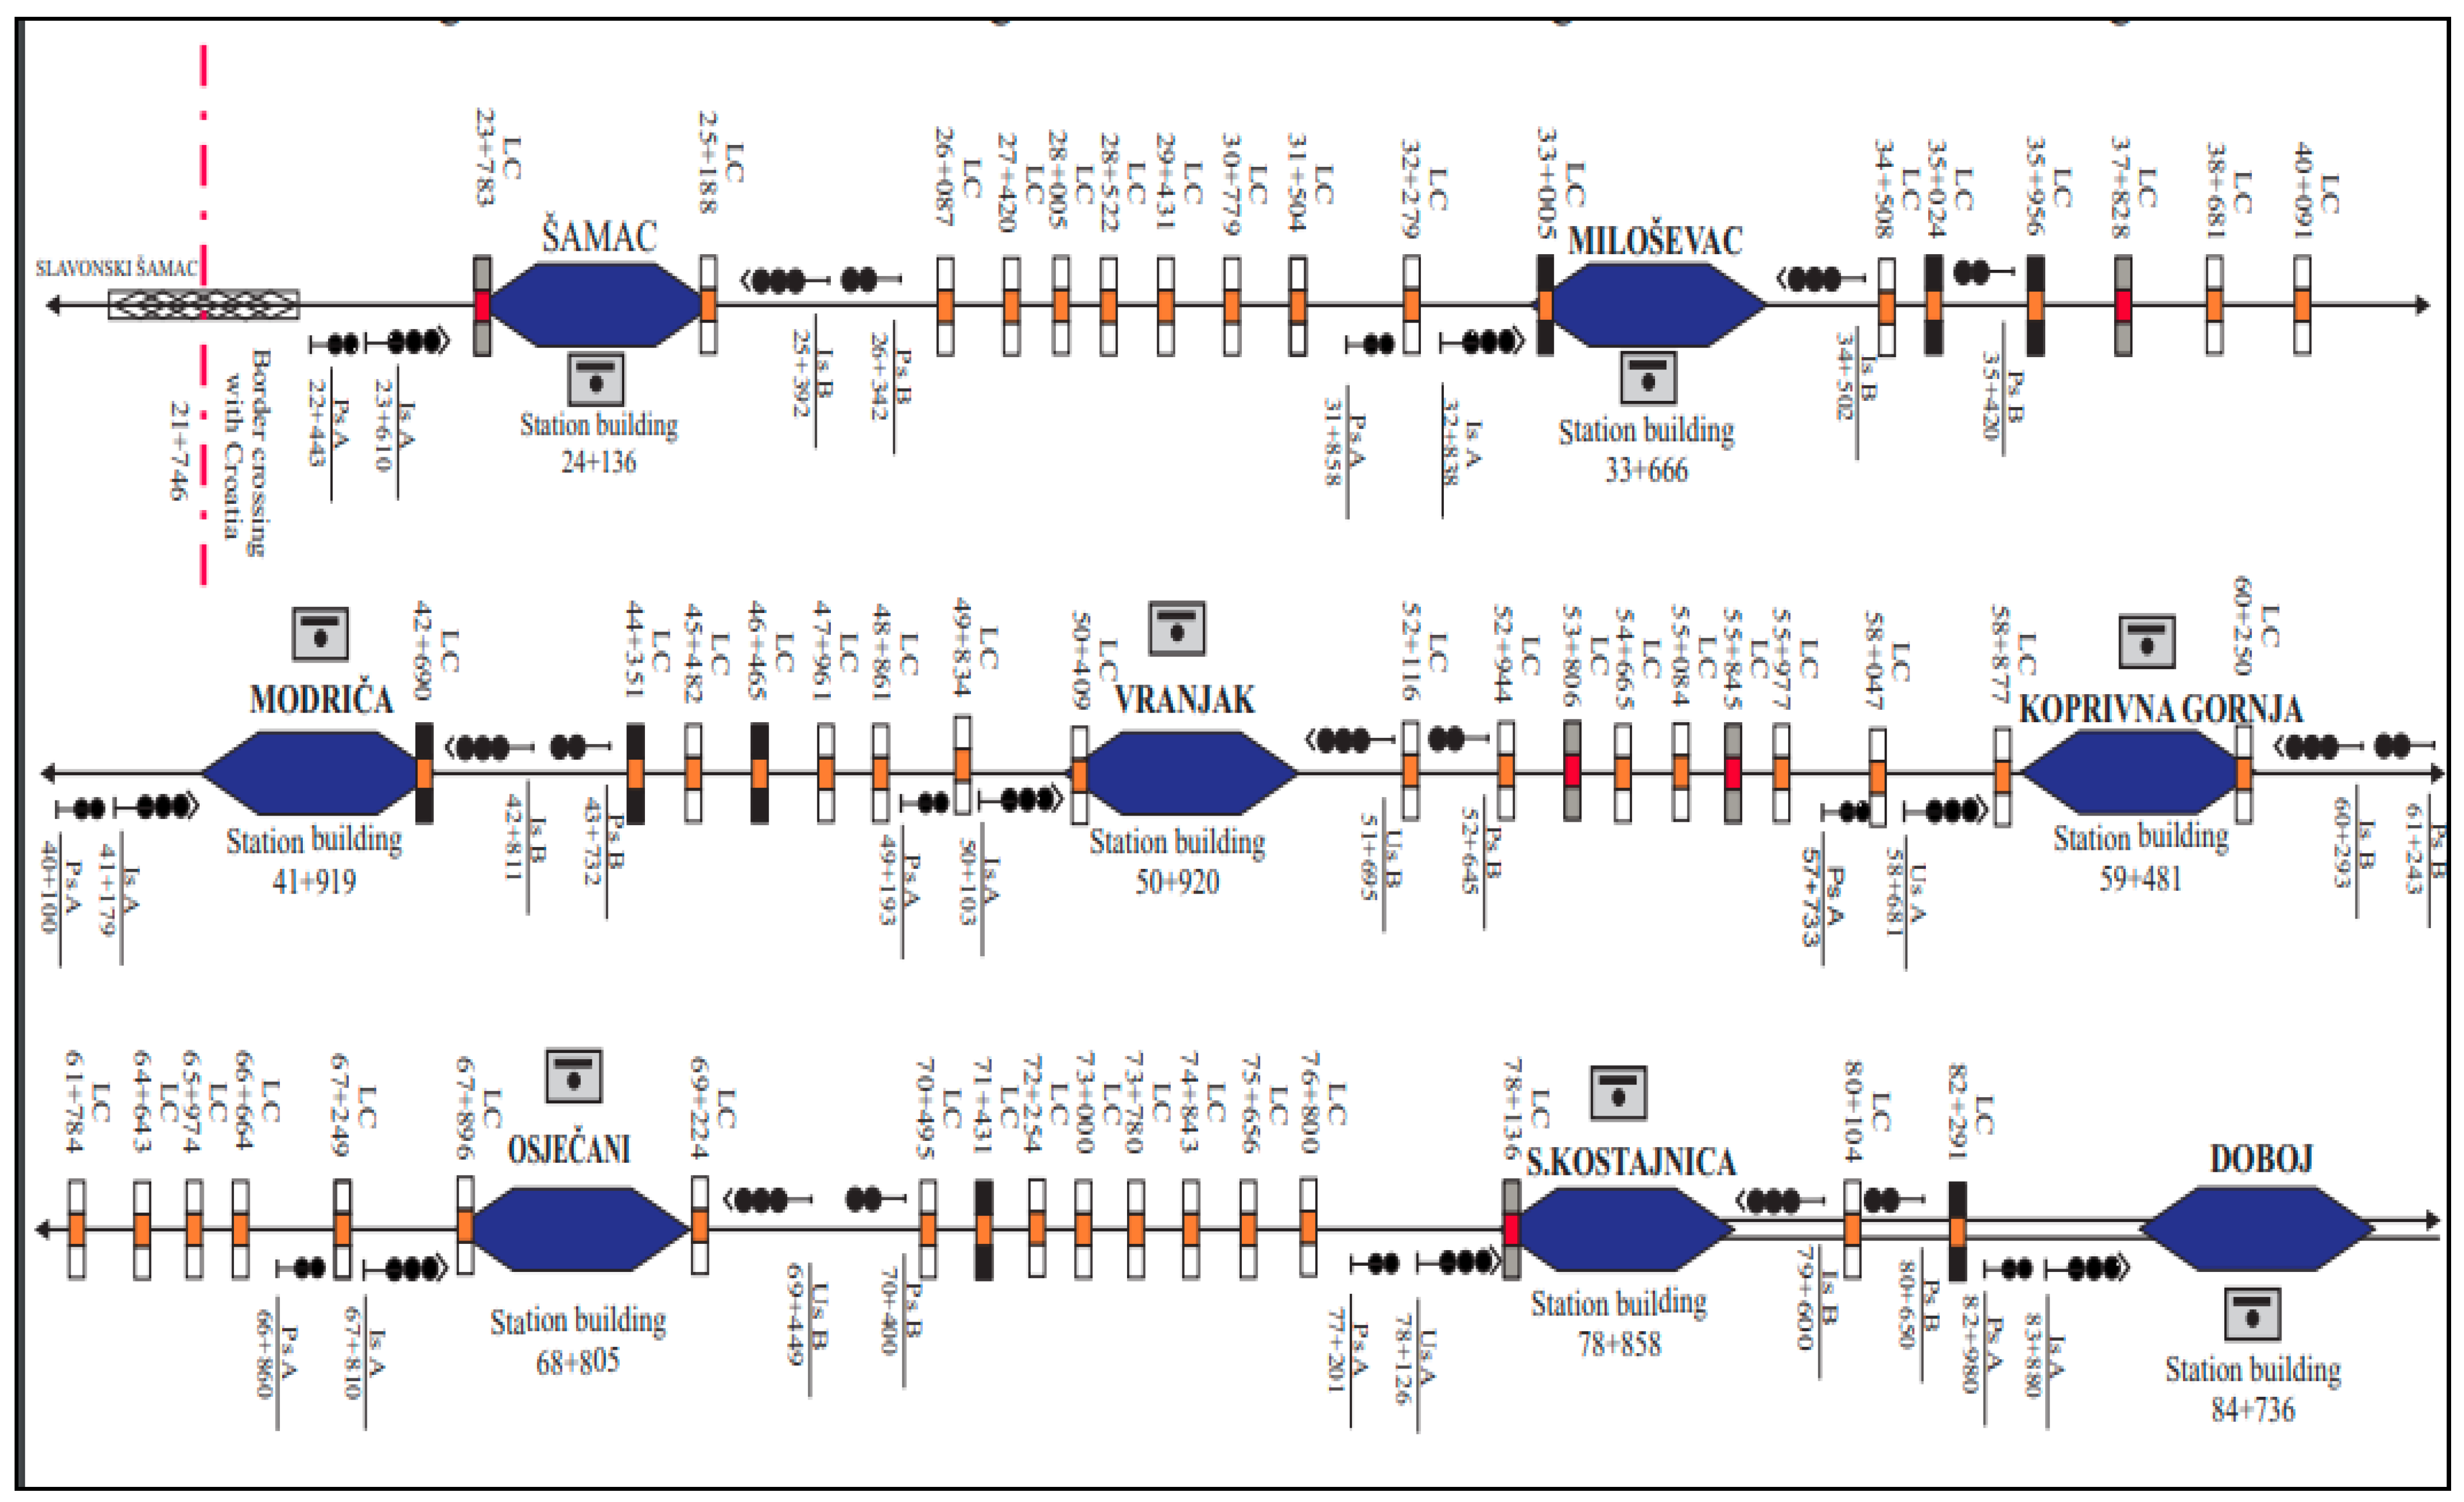
As the last activity of the second step in the first phase, a certain number of level crossings were selected to be evaluated on the basis of the previously explained criteria. In this paper, the Šamac-Doboj railway section was considered, as a section that stands out with a considerable number of adverse events at level crossings.
Figure 2 shows a graphical representation of all level crossings on a given section considering only those where some kind of accident occurred. The total number of level crossings on this section is 53, out of which 48 are passively and 5 are actively secured. In
Figure 2, actively secured crossings are marked in red, while level crossings where some kind of accident occurred are marked in black (
Figure 3) and there are a total of eight of them which are further considered in the MCDM model. Other (40) level crossings at which there were no accidents in the observed period are marked in orange.
Today, there are a total of 491 level crossings on the railway network in BiH, with a total length of 1048 km, out of which 57 are actively secured and 434 are passively secured level crossings. The current state of level crossings in BiH is a problem of the greatest interest for the railway and is a generator of accidents. There are 296 level crossings in the Republic of Srpska, out of which 13 are actively secured and 283 are passively secured level crossings.
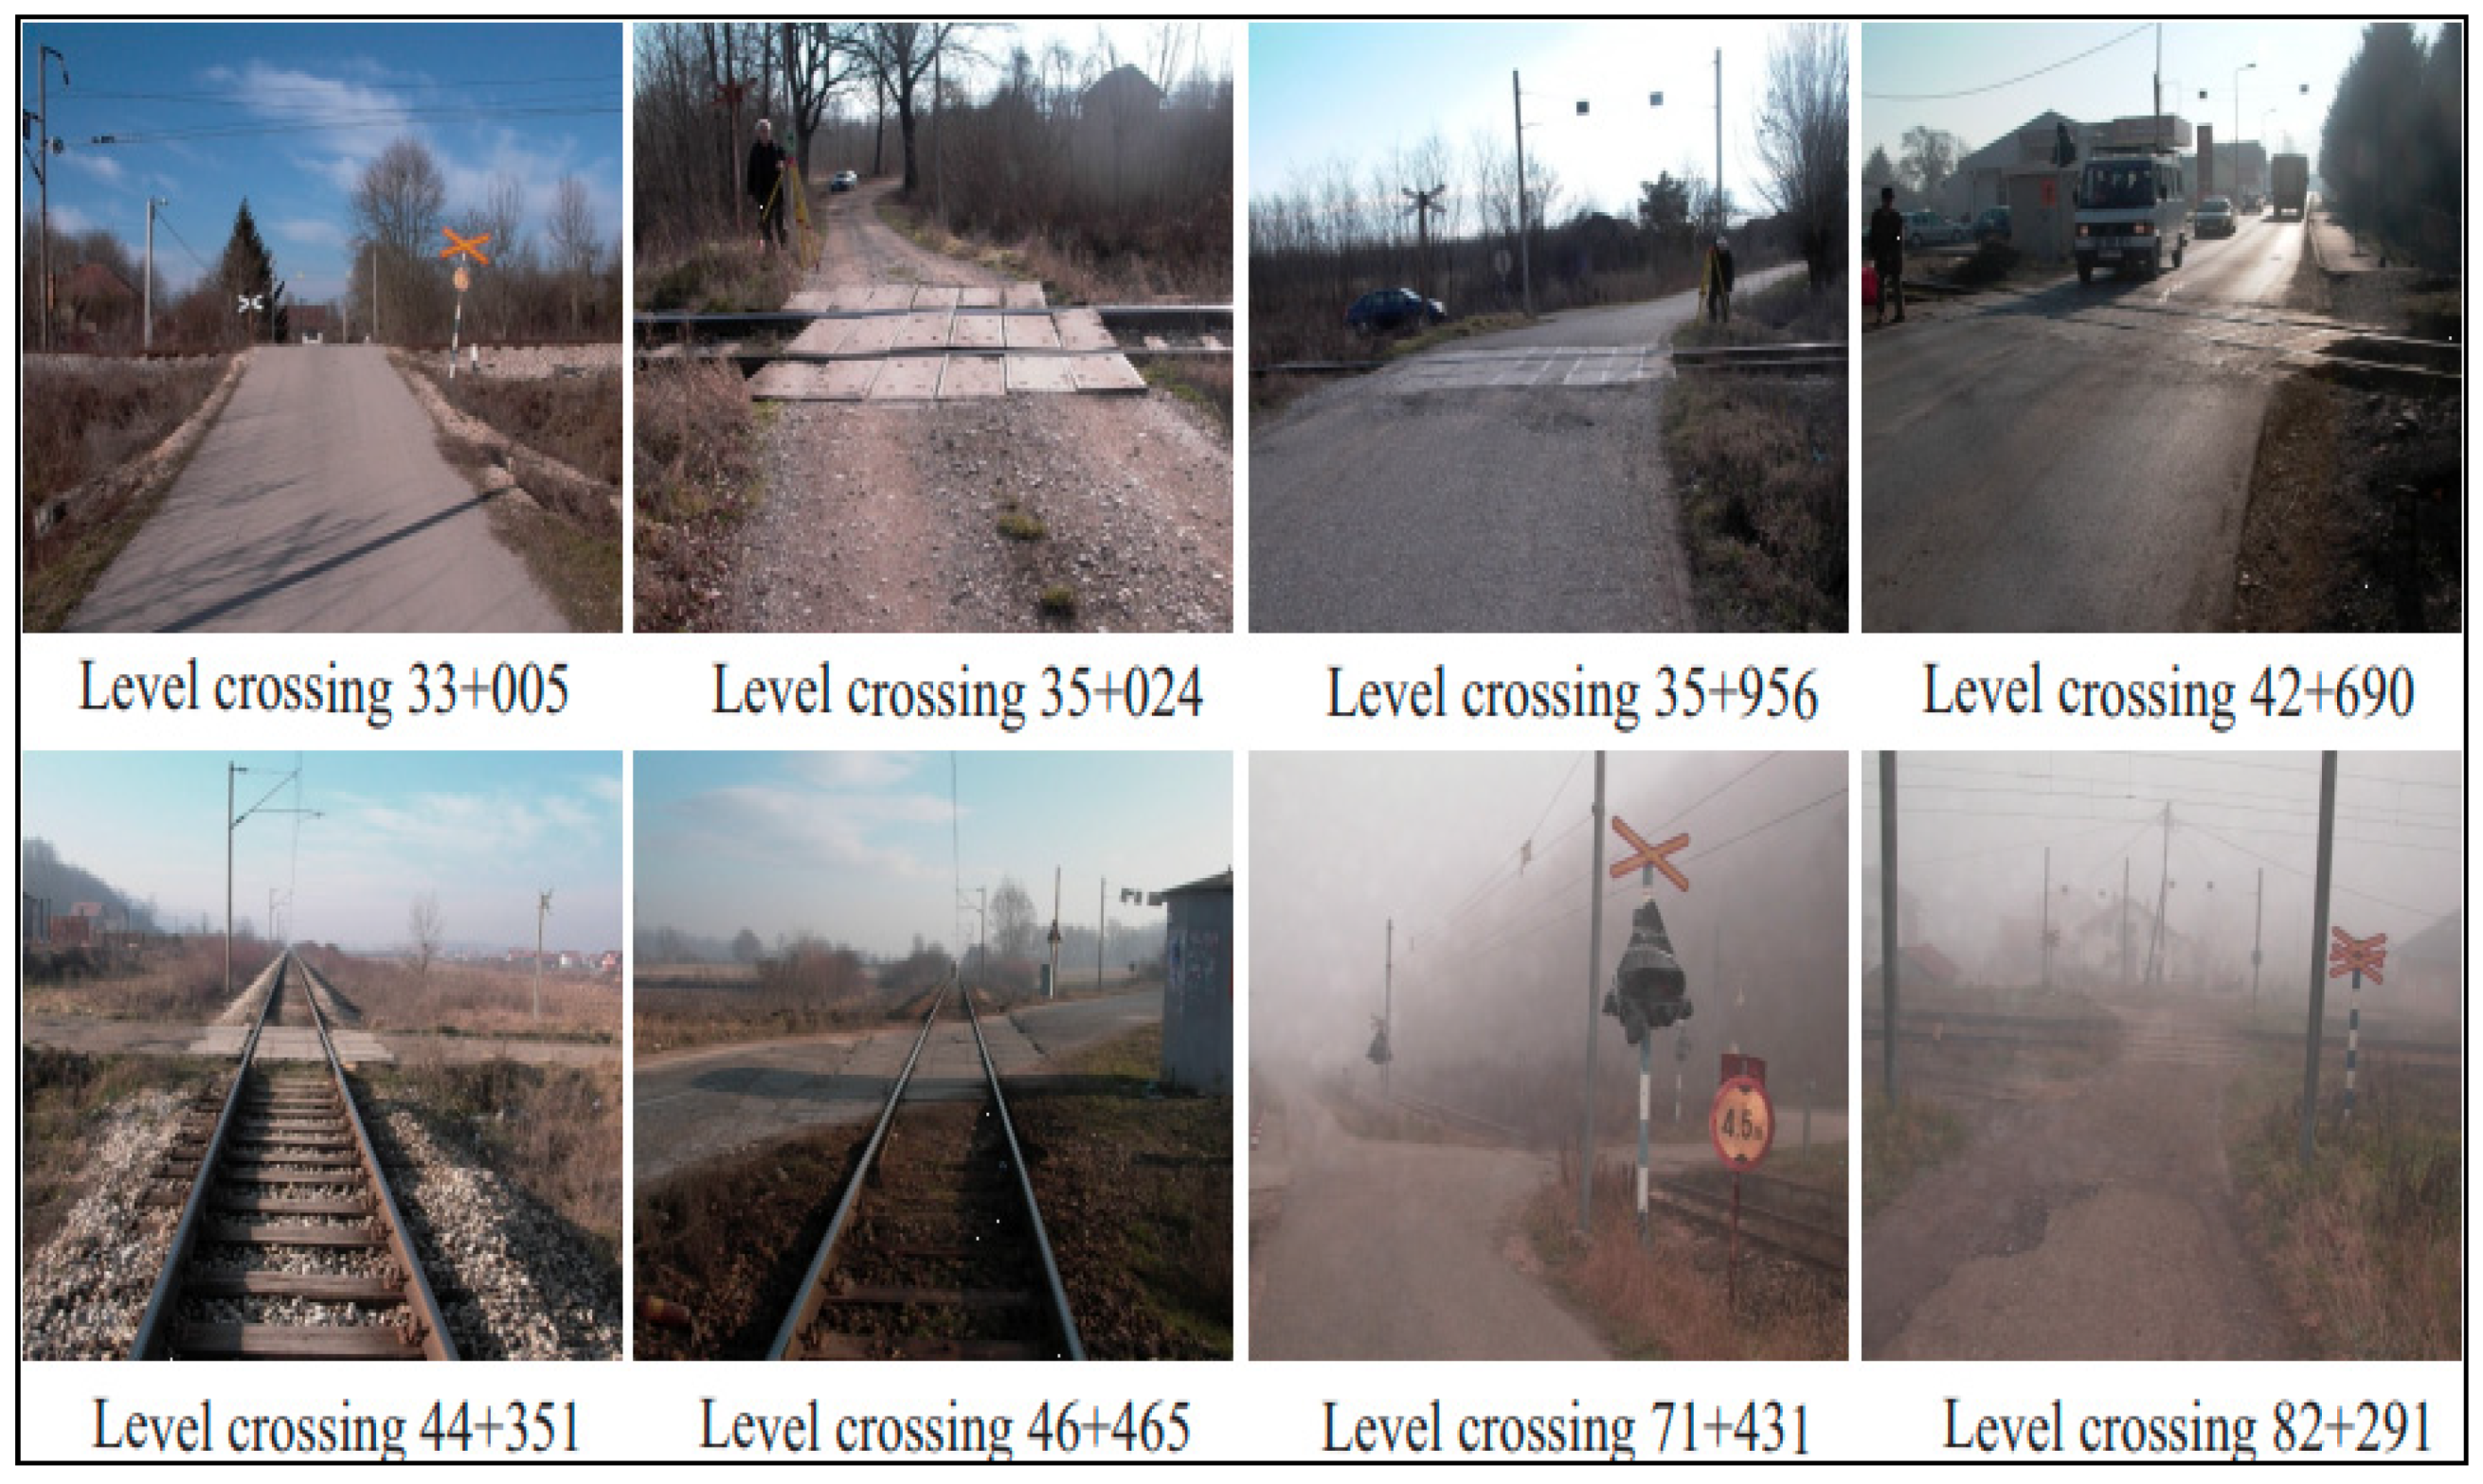
Figure 3 shows the level crossings that have been considered and evaluated in this study.
Eight most dangerous level crossings were analyzed, i.e., the crossings where accidents occurred. Field surveys were carried out, checking traffic safety, photographing and recording the crossing of the road over the railway with a video camera, and counting traffic participants. The basic characteristics of the considered level crossings are described in detail.
The level crossing at railway kilometer 33 + 005, by its location, belongs to the municipality of Modriča. The crossing is on an open railway and crosses one track. The functional significance of the road is local. The crossing is on a curve and the angle of intersection between the road and track is of 60 degrees. The slope of the road in relation to the crossing is 11%. The width of the road in the crossing zone is 4 m. The permitted speed over the crossing for road and railway vehicles is 50 km/h. The average annual daily traffic on the road is 78 vehicles per day, and for railway vehicles it is 4 trains per day. The crossing is secured only by the visibility triangle and there is not a sufficient visibility zone for safe traffic. There was one accident at this crossing in 2019.
The level crossing at railway kilometer 35 + 024, by its location, belongs to the municipality of Modriča. The crossing is on an open railway and crosses one track. The functional significance of the road is local. The crossing is on a curve and the angle of the intersection between the road and track is of 60 degrees. The slope of the road in relation to the crossing is 8.5%. The width of the road in the crossing zone is 4 m. The permitted speed over the crossing for road and railway vehicles is 50 km/h. The average annual daily traffic on the road is 105 vehicles per day, and for railway vehicles it is 4 trains per day. The crossing is secured with traffic signs and the visibility triangle. There is not a sufficient visibility zone for safe traffic at the crossing. There was one accident at this crossing in 2019.
The level crossing at railway kilometer 42 + 690, by its location, belongs to the municipality of Modriča. The crossing is on an open railway and crosses one track. The functional significance of the road is regional. The crossing is in a straight direction and the angle of the intersection between the road and track is of 90 degrees. The slope of the road in relation to the crossing is 0%. The width of the road in the crossing zone is 6 m. The permitted speed over the crossing for road vehicles is 60 km/h and for railway vehicles it is 50 km/h. The average annual daily traffic on the road is 562 vehicles per day and for railway vehicles it is 4 trains per day. The crossing is secured with traffic signs and the visibility triangle. There is not a sufficient visibility zone for safe traffic at the crossing. There were two incidents at this crossing in 2019.
The level crossing at railway kilometer 44 + 351, by its location, belongs to the municipality of Modriča. The crossing is on an open railway and crosses one track. The functional significance of the road is uncategorized. The crossing is in a straight direction and the angle of the intersection between the road and track is of 90 degrees. The slope of the road in relation to the crossing is 5.5%. The width of the road in the crossing zone is 3 m. The permitted speed over the crossing for road vehicles is 30 km/h and for railway vehicles it is 50 km/h. The average annual daily traffic on the road is 10 vehicles per day and for railway vehicles it is 4 trains per day. The crossing is secured only by the visibility triangle. There is not a sufficient visibility zone for safe traffic at the crossing. In 2019, there were three serious accidents with two people killed at this crossing.
The level crossing at railway kilometer 46 + 465, by its location, belongs to the municipality of Modriča. The crossing is on an open railway and crosses one track. The functional significance of the road is regional. The crossing is located in a straight direction and the angle of the intersection between the road and track is of 80 degrees. The slope of the road in relation to the crossing is 9.5%. The width of the road in the crossing zone is 6 m. The permitted speed over the crossing for road vehicles is 60 km/h and for railway vehicles it is 50 km/h. The average annual daily traffic on the road is 860 vehicles per day, and for railway vehicles it is 4 trains per day. The crossing is secured only by the visibility triangle. There is a sufficient visibility zone at the crossing for safe traffic. There was one incident at this crossing in 2019.
The level crossing at railway kilometer 71 + 431, by its location, belongs to the municipality of Doboj. The crossing is on an open railway and crosses one track. The functional significance of the road is local. The crossing is in a straight direction and the angle of the intersection between the road and track is of 90 degrees. The slope of the road in relation to the crossing is 0%. The width of the road in the crossing zone is 4 m. The permitted speed over the crossing for road and railway vehicles is 50 km/h. The average annual daily traffic on the road is 28 vehicles per day and for railway vehicles it is 4 trains per day. The crossing is secured with traffic signs and the visibility triangle. There is not a sufficient visibility zone for safe traffic at the crossing. In 2019, there was one serious accident with three people killed at this crossing.
The level crossing at railway kilometer 82 + 291, by its location, belongs to the municipality of Doboj. The crossing is on an open railway and crosses over two tracks. The functional significance of the road is local. The crossing is in a straight direction and the angle of the intersection between the road and track is of 100 degrees. The slope of the road in relation to the crossing is 0%. The width of the road in the crossing zone is 3 m. The permitted speed over the crossing for road and railway vehicles is 50 km/h. The average annual daily traffic on the road is 14 vehicles per day and for railway vehicles it is 4 trains per day. The crossing is secured only by the visibility triangle. There is not a sufficient visibility zone for safe traffic at the crossing. There was one incident at this crossing in 2019.
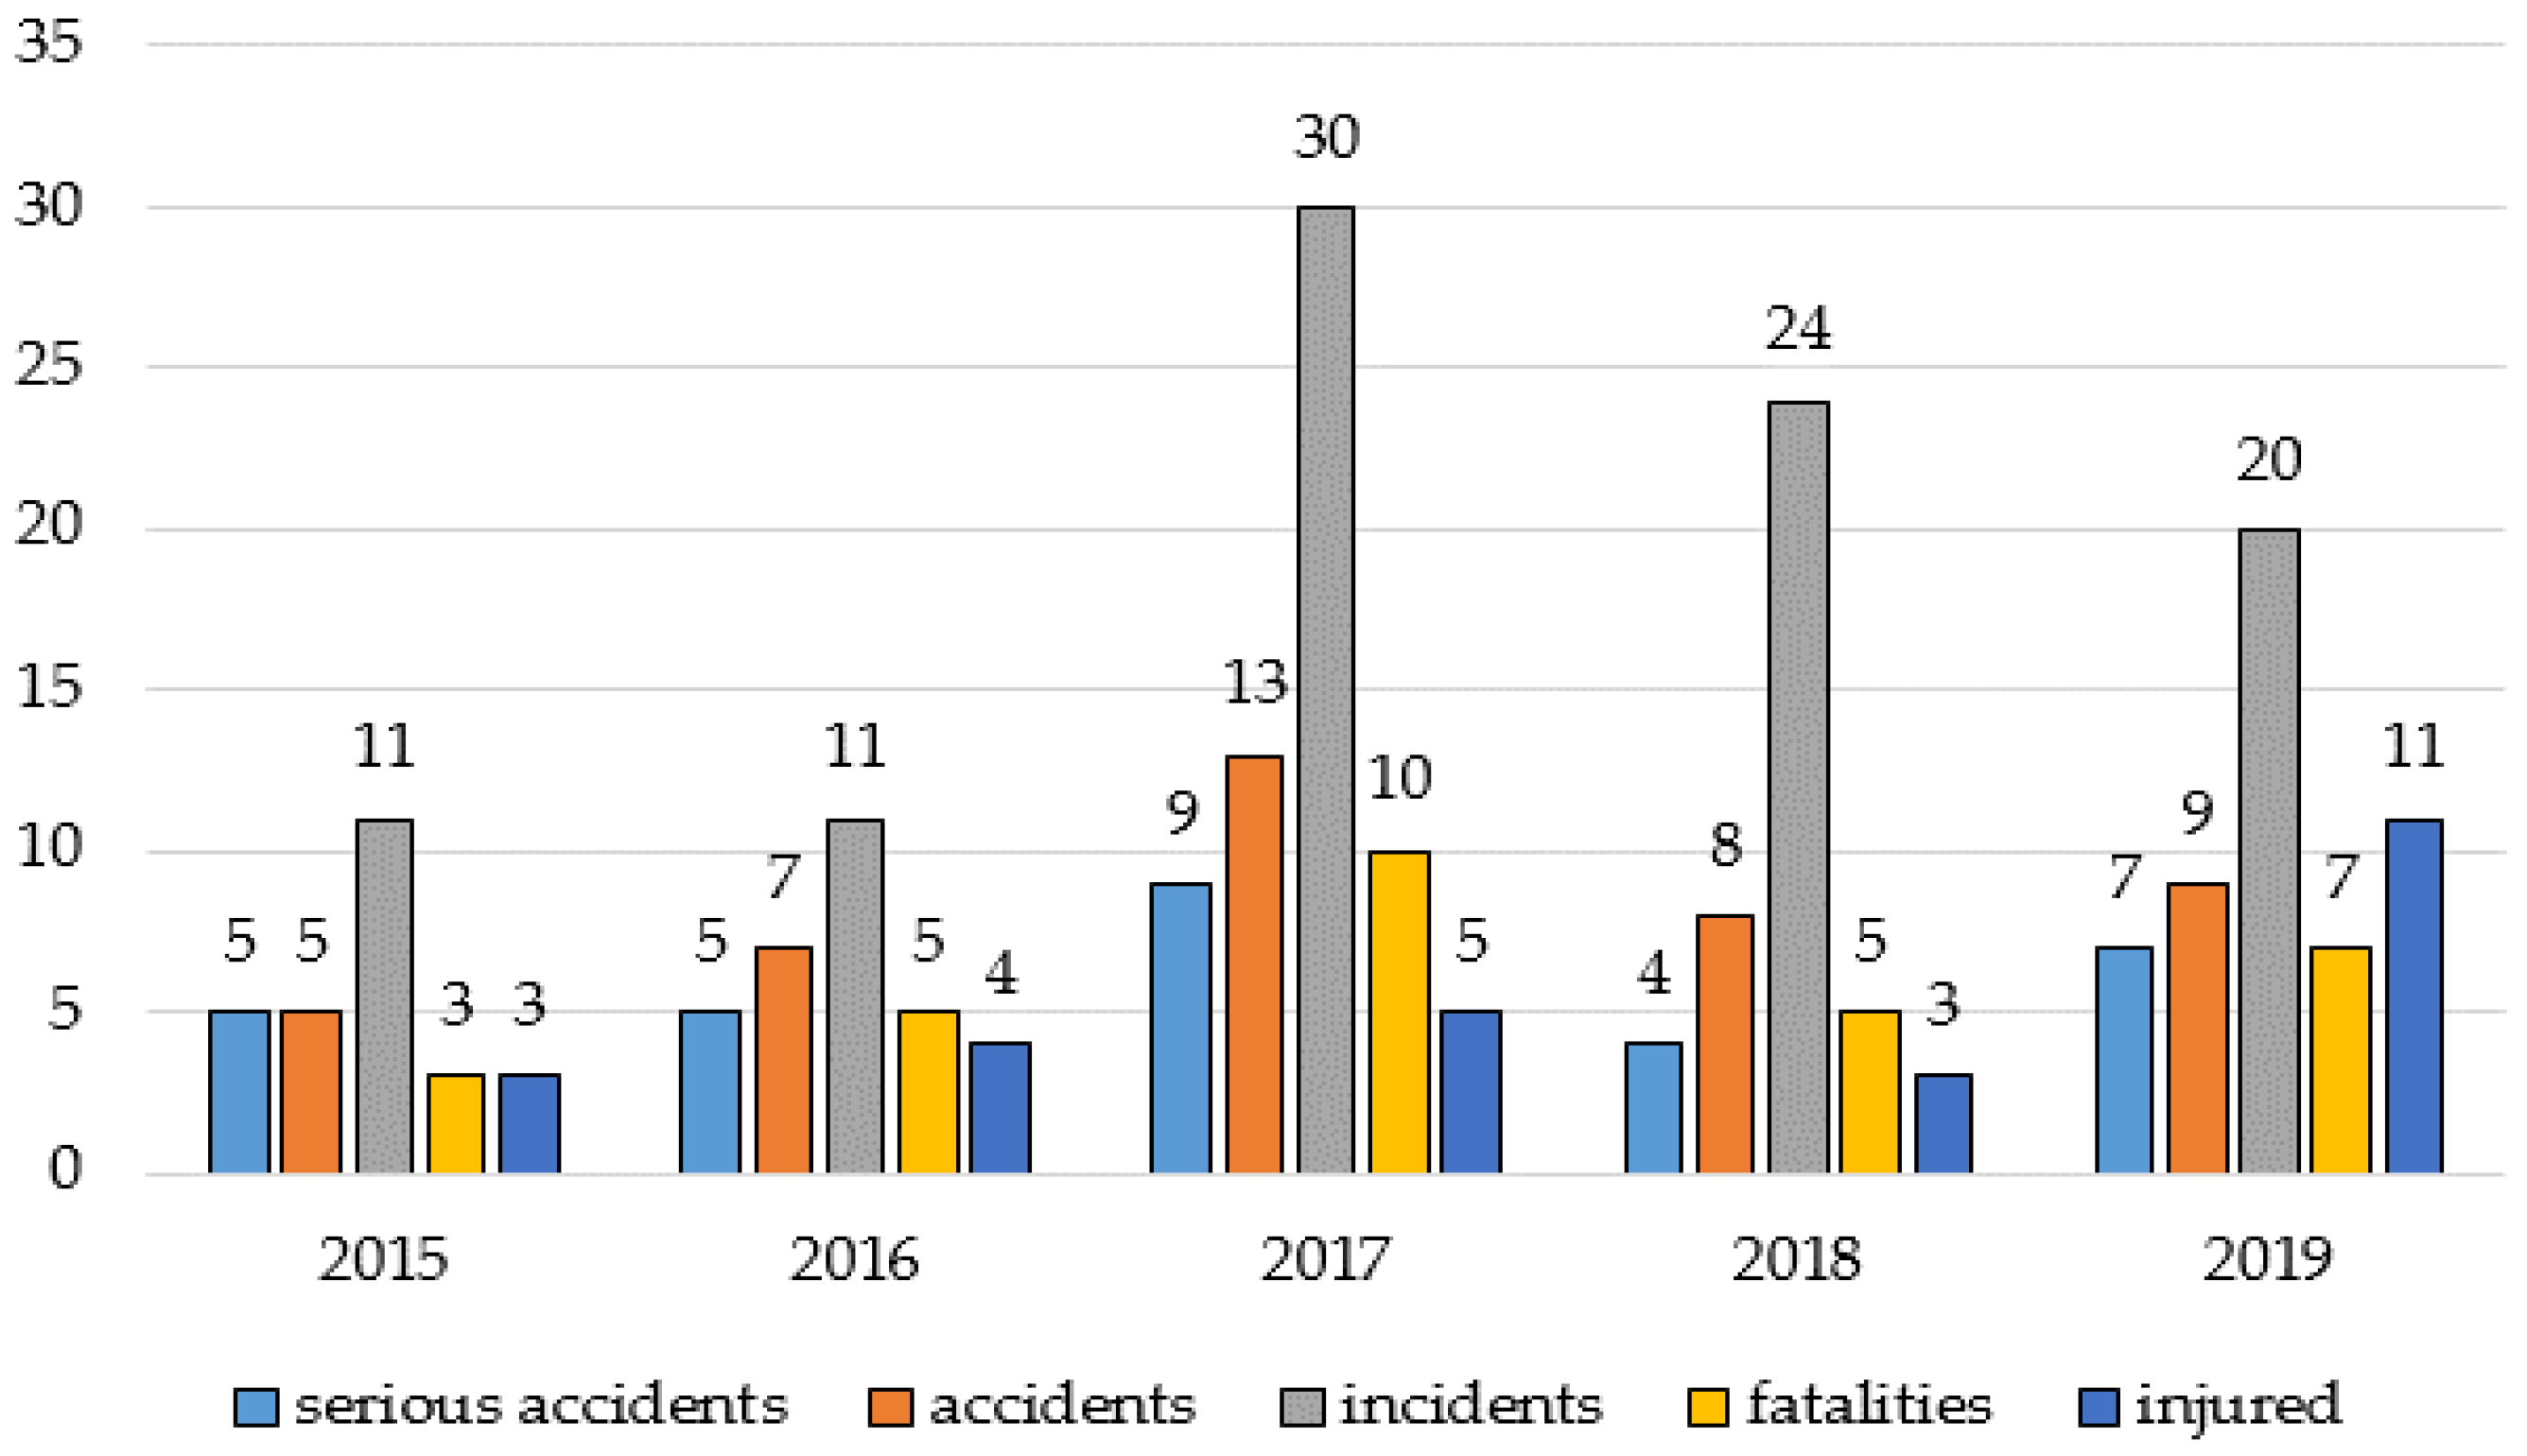
The analysis of serious accidents, accidents, and incidents, with killed and injured persons at level crossings in BiH in the last five years is shown in
Figure 4. It can be seen that there are variations in the number of accidents in the last five years and that in 2019 there was the largest number of injured persons, while the number of incidents decreased compared to the previous two years.
In the third step, the evaluation of criteria was performed by 11 decision-makers in a group decision-making process. In particular, the main group of criteria and all sub-criteria within the main groups were evaluated, which is a prerequisite for the application of this methodology. In the fourth step, data processing, i.e., fuzzy triangular numbers, was performed. The next phase involved the application of the fuzzy FUCOM method based on the fuzzy Heronian mean operator to determine the values of the main criteria. Then, fuzzy PIPRECIA was applied to determine the values of the sub-criteria.
The fuzzy FUCOM method [
20,
21] is an extension of the original FUCOM method [
22,
23,
24] with fuzzy triangular numbers (TFN) and consists of the following steps:
Step 1. Ranking of criteria using expert judgment.
Step 2. Determining the vector of comparative significance of the evaluation criteria using TFN.
Step 3. Defining the constraints of a nonlinear optimization model. The values of the weighting coefficients should satisfy two conditions, namely:
Condition 1. The ratio of the weight coefficients is equal to the comparative significance between the observed criteria.
Condition 2. The final values of the weighted coefficients should satisfy the condition of mathematical transitivity.
Step 4. Defining a model for determining the final values of the weighting coefficients of the evaluation criteria.
Step 5. Solving the model and obtaining the final weight of the criteria/sub-criteria
Since it is a group decision-making, the fuzzy form of the Heronian mean operator [
25] was used to average the weights of the main criteria.
The fuzzy PIPRECIA method [
26,
27,
28] consists of the steps given below.
Step 1. Forming a set of criteria and sorting the criteria according to marks from the first to the last. Step 2. Each decision-maker individually evaluates pre-sorted criteria by starting from the second criterion. Step 3. Determining the coefficient . Step 4. Determining the fuzzy weight . Step 5. Determining the relative weight of the criterion . In the following steps, the inverse methodology of fuzzy PIPRECIA method needs to be applied. Step 6. Performing the assessment, but this time starting from a penultimate criterion. Step 7. Determining the coefficient . Step 8. Determining the fuzzy weight . Step 9. Determining the relative weight of the criterion . Step 10. In order to determine the final weights of criteria, it is first necessary to perform the defuzzification of the fuzzy values and . Step 11. Checking the results obtained by applying Spearman and Pearson correlation coefficients.
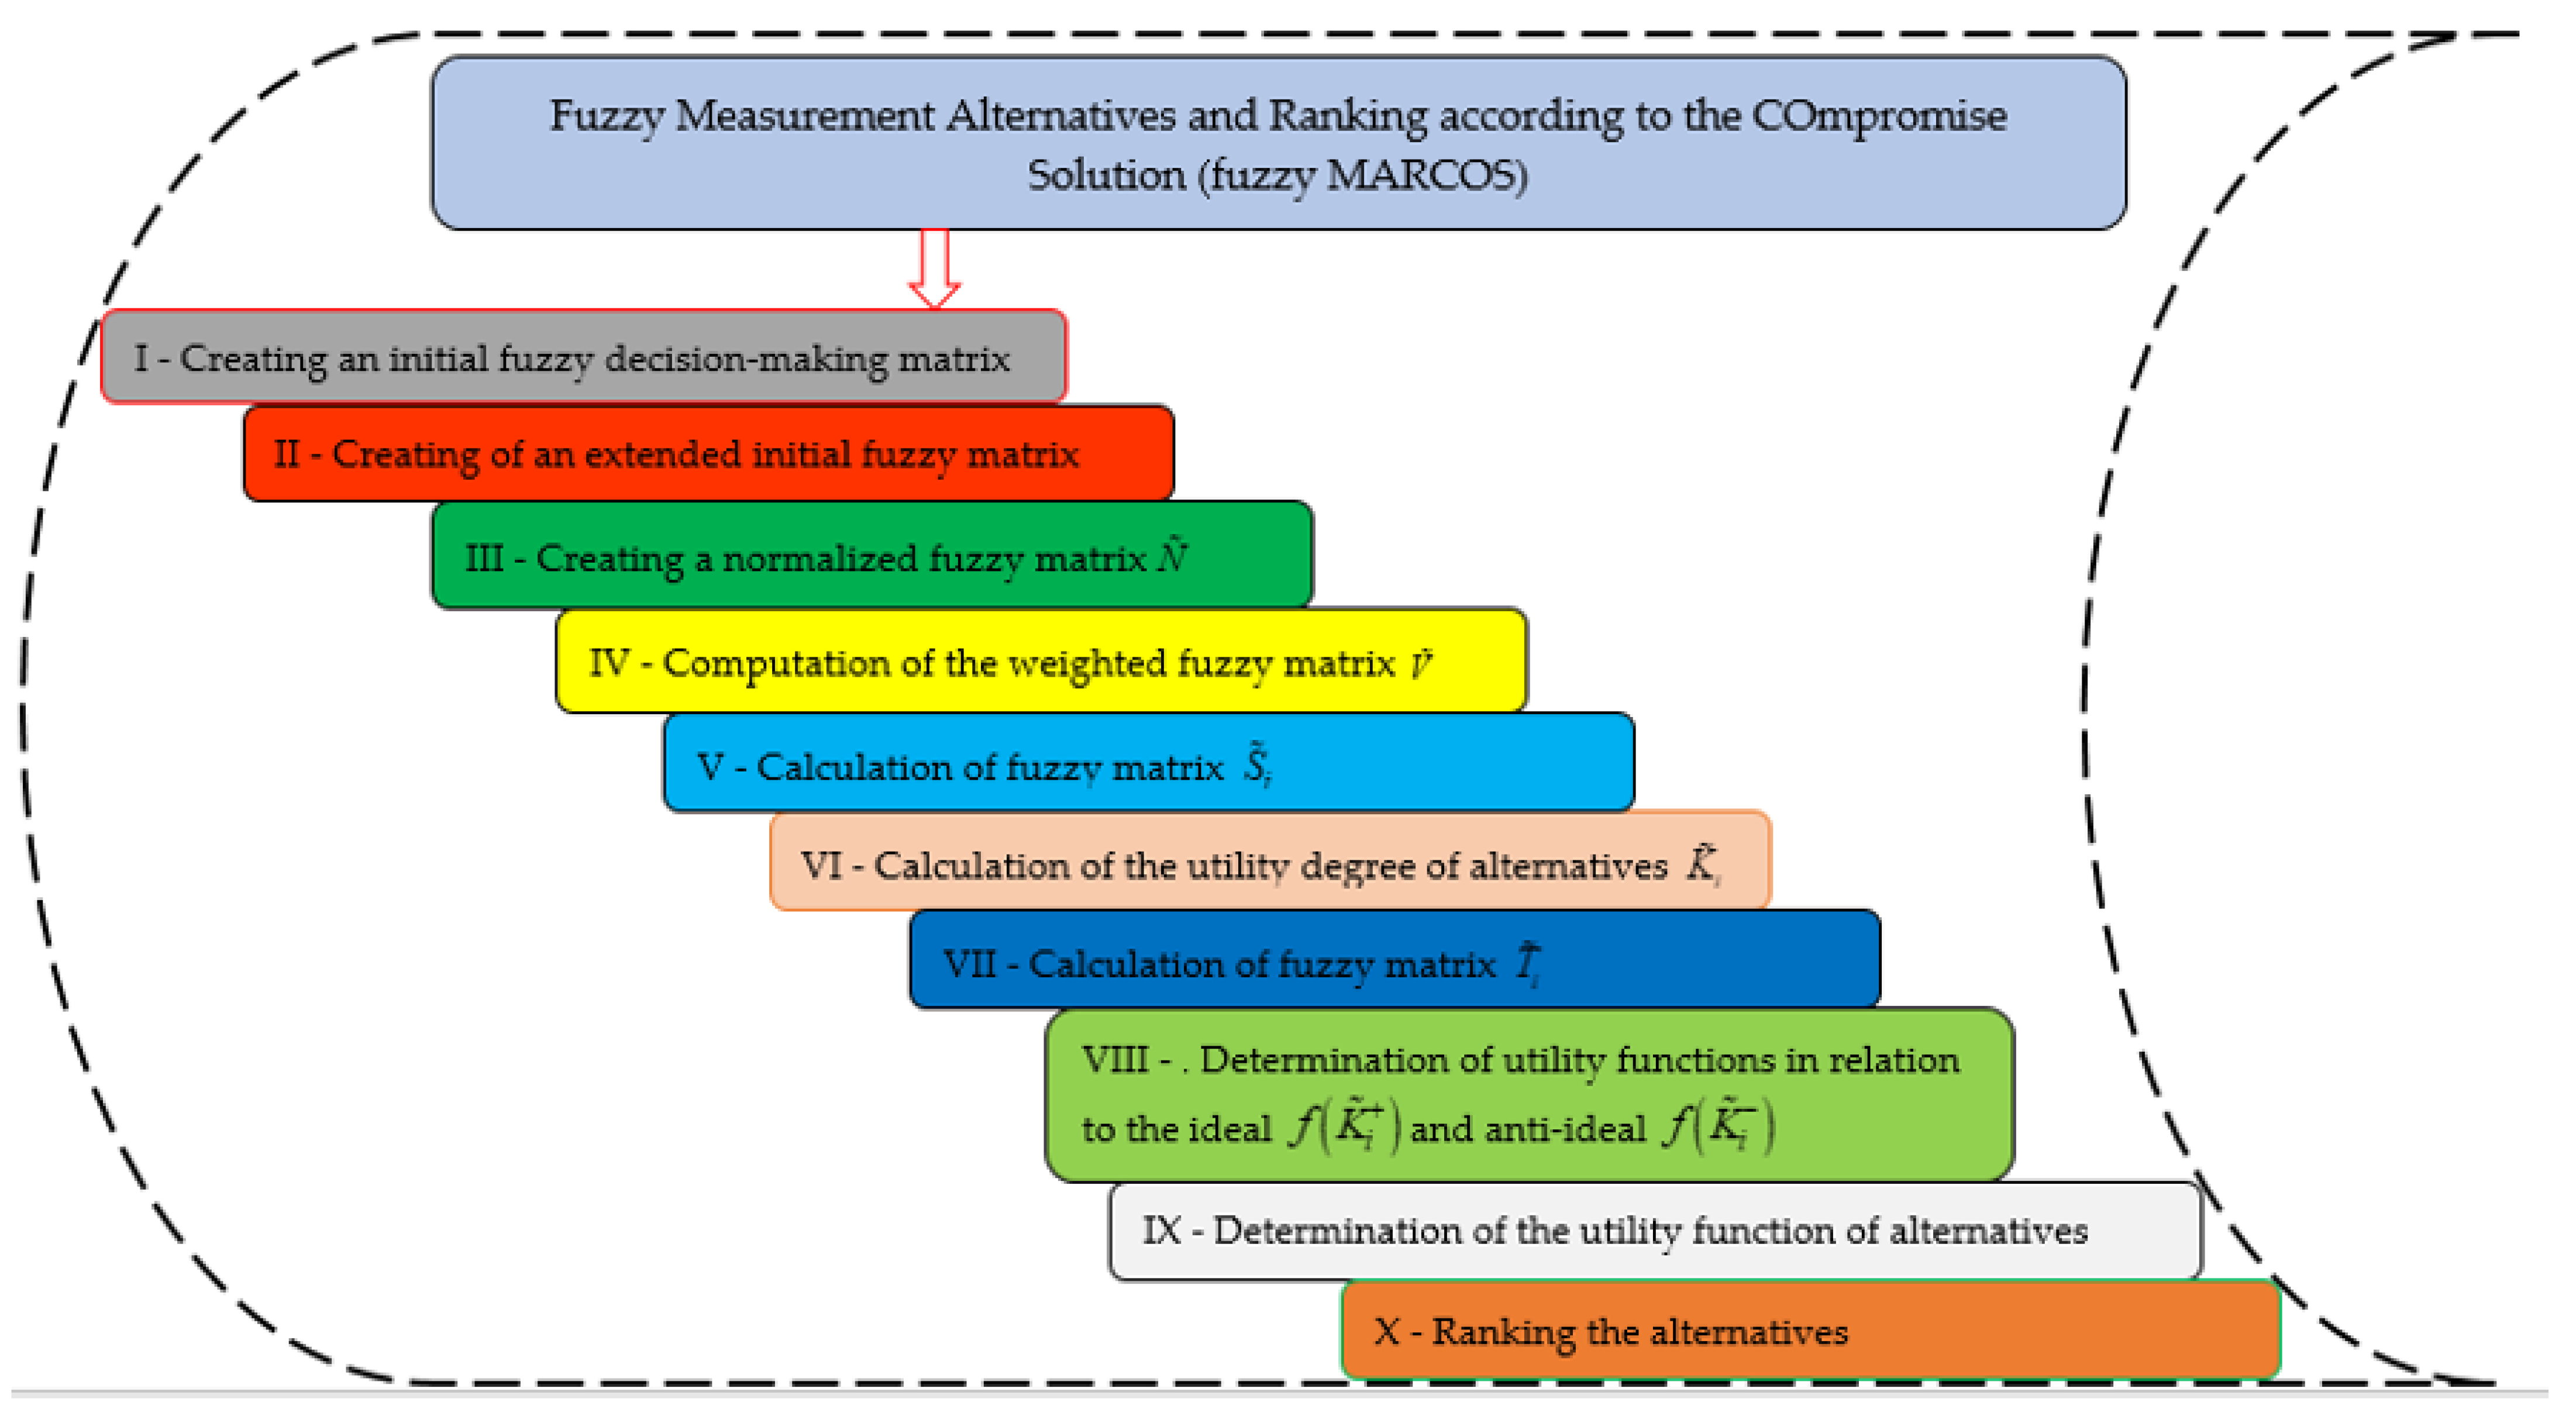
Primarily, 11 fuzzy models were formed to determine the weights of the main criteria using the fuzzy FUCOM method. The obtained values were aggregated using the fuzzy Heronian mean operator to obtain the final weights of the main criteria. After determining the weights of all sub-criteria using the fuzzy PIPRECIA method, the final weights of all criteria were determined by multiplying the values of the main criteria by the values of the sub-criteria. The next phase involved the application of the fuzzy MARCOS method in order to determine safety degree at the level crossings of the Šamac–Doboj section. The procedure for solving the MCDM model using the fuzzy MARCOS method [
29] is as follows (
Figure 5). In the first step, the initial fuzzy matrix is formed. After that, an extended fuzzy decision matrix, which implies the formation of an anti-ideal and ideal solution depending on the type of criteria, is created. The next step involves the normalization of the initial fuzzy matrix, which depends on the type of criteria, followed by weighting with the weight values of the criteria obtained using the fuzzy FUCOM–fuzzy PIPRECIA model based on averaging the main criteria with the fuzzy Heronian Mean operator. In the fifth step, the fuzzy values are summed by rows and a matrix of 1 × n is obtained, and it is used for further calculation of the function degrees of the alternatives. Then, the following matrix is calculated, which is the sum of the elements of the utility degree matrix. The maximum fuzzy triangle number is chosen and its defuzzification is performed in order to calculate the utility functions in relation to the ideal and anti-ideal solution.
After applying the overall previously described methodology, in the tenth step, the variants were ranked and the safety degree of level crossings was determined on the basis of the values obtained. The fourth phase involved the verification of the obtained results through four phases of sensitivity analysis. In the eleventh step, a change in the results caused by the influence of a change (decrease) in the size of the initial fuzzy matrix was determined. The twelfth step involved a comparative analysis of the original fuzzy FUCOM–Fuzzy PIPRECIA–fuzzy MARCOS model with two fuzzy approaches, namely: simple additive weighting (SAW) and weighted aggregated sum product assessment (WASPAS), and, in step 13, a change of an aggregator to average the values of the main criteria: Fuzzy MARCOS based on the fuzzy Bonferroni mean operator (Fuzzy MARCOS–Fuzzy BMO). Then, a significant sensitivity analysis was performed through the next step, which involves the formation of 30 scenarios in which new fuzzy values of all criteria are simulated, and in the last 15th step, the Spearman’s correlation coefficient (SCC) was calculated in order to determine the correlation of ranks.
5. Sensitivity Analysis and Discussion
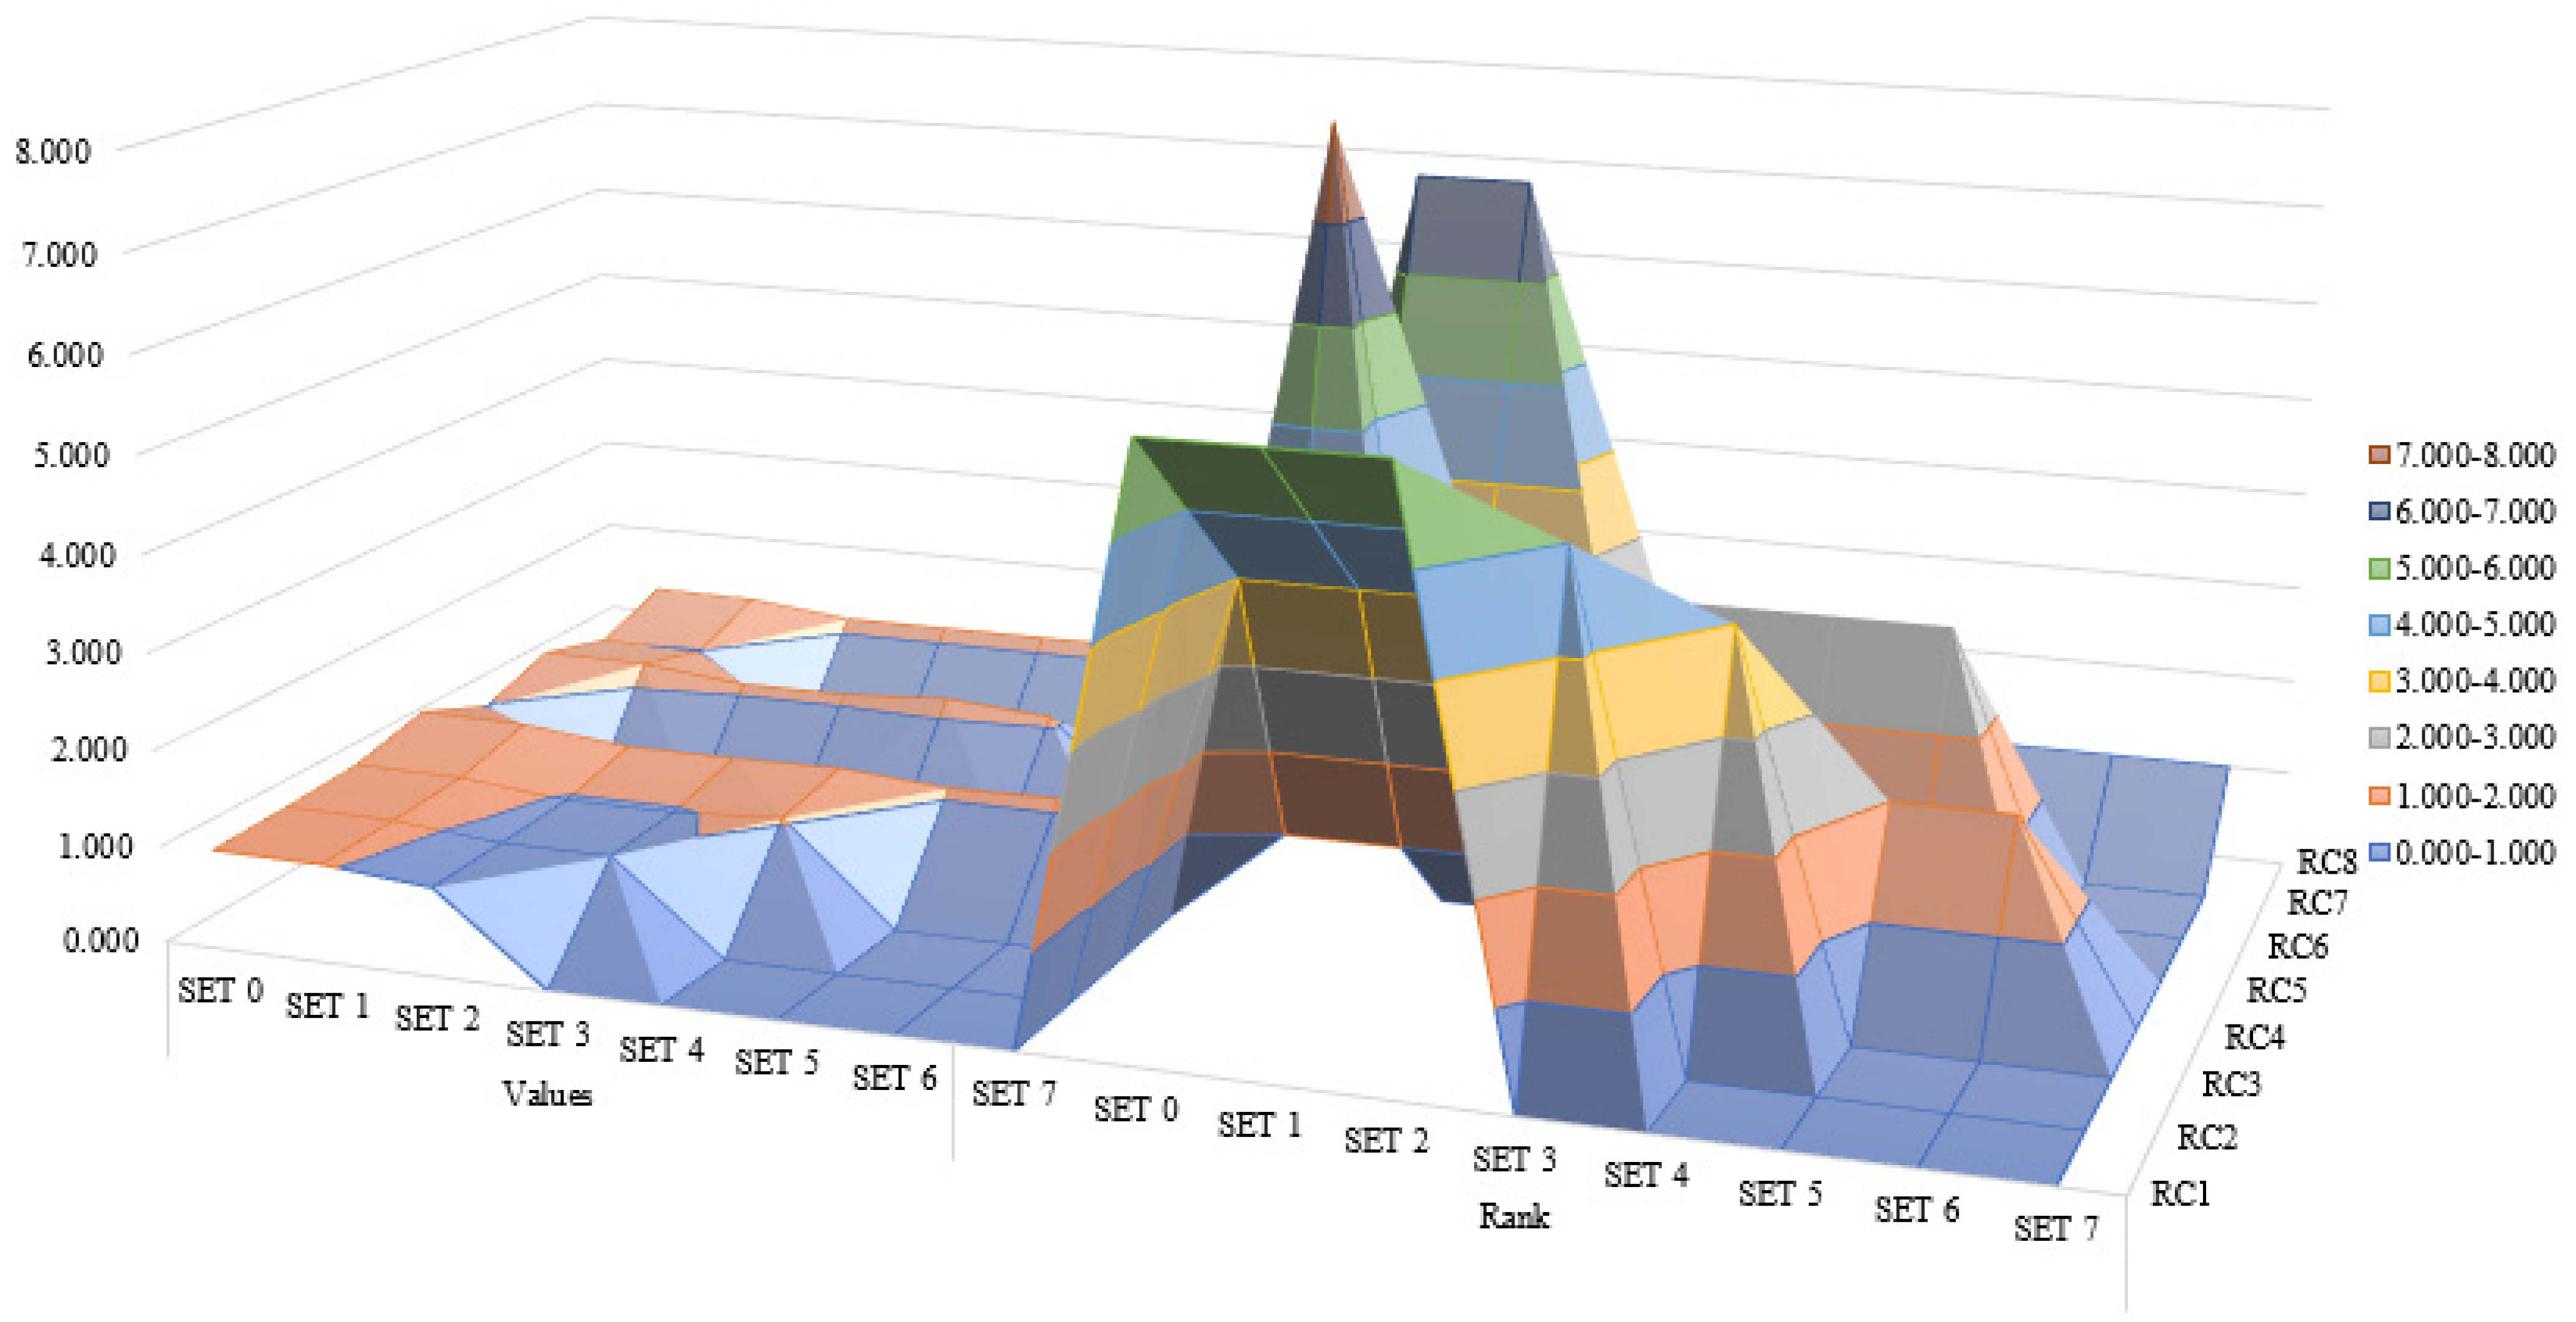
A sensitivity analysis was performed in several phases. The first phase involved changing the size of ranking of the initial matrix, forming a total of seven additional scenarios. In each of the scenarios, the last-ranked alternative was eliminated, and the calculation was performed again with the size of the matrix
n−1 comparing to the initial solution.
Figure 6 shows the results by comparing to the initial ranks and values with each scenario formed.
Figure 6 shows the values (left) and ranks (right) through the formed scenarios in terms of the size of the fuzzy rank of the initial decision matrix. It can be observed that the dynamic conditions of the fuzzy matrix affect the results. Specifically, in the first four scenarios when LC5, LC7, LC1, and LC2 were eliminated, respectively for each scenario separately, there was no change of ranks compared to the initial rank. When it comes to scenarios S5–S7, one change occurred when the first and second best alternatives changed their positions, which was caused by eliminating the third alterative solution LC3.
In the second part of the sensitivity analysis, a comparative analysis of the original fuzzy FUCOM–fuzzy PIPRECIA–fuzzy MARCOS model was performed with three fuzzy approaches, namely: fuzzy SAW [
30], fuzzy WASPAS [
30], and fuzzy MARCOS based on fuzzy BMO operator [
31,
32] (fuzzy MARCOS–fuzzy BMO).
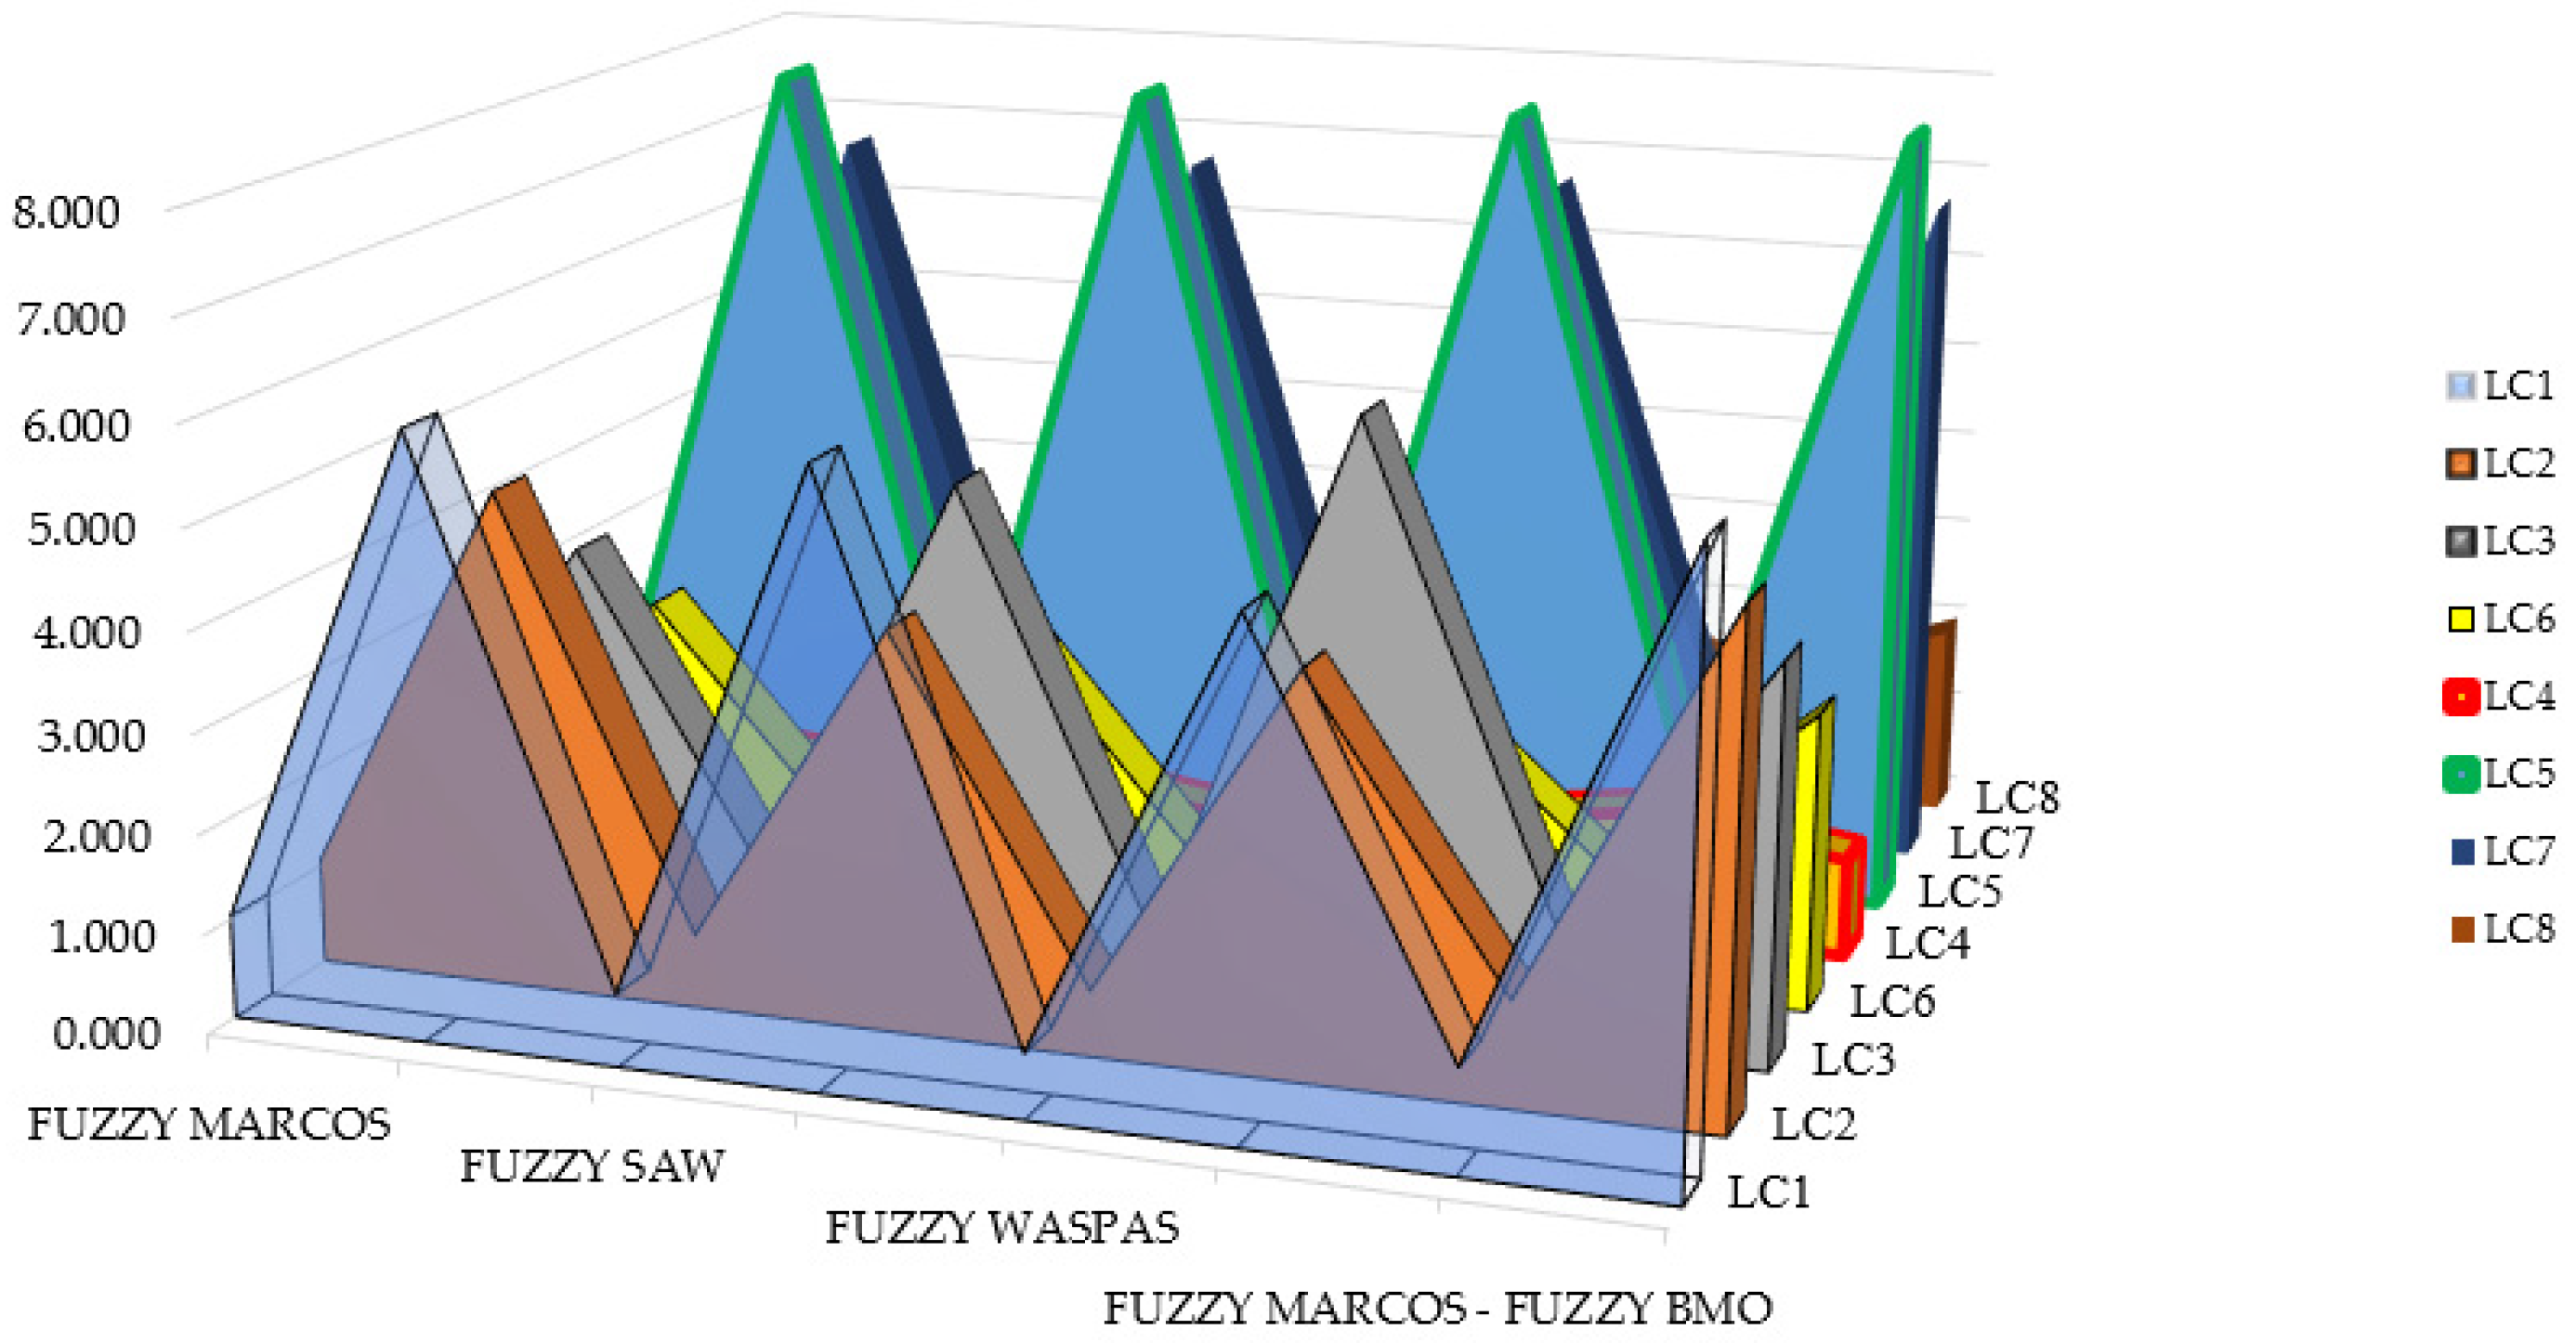
Figure 7 shows the results of a comparative analysis with three fuzzy approaches. Considering the obtained results, it can be concluded that there were certain changes in the ranks, which is a consequence of a different normalization approach in applying other approaches. Furthermore, one of the causes of changes in the rankings is reflected in a very small difference in the values of some alternative solutions obtained in the original model. When it comes to a comparative analysis with the fuzzy SAW method, the only change of rank occurred when LC2 and LC3 change their positions, LC2 is in the fourth position and vice versa regarding LC3. When it comes to the comparison with the fuzzy WASPAS method, there were slightly larger changes that are reflected in the change of ranks of LC1, LC2 and LC3 that change their ranks by one position. Observing the new changes, it can be concluded that the ranks still remain highly correlated. When the original fuzzy model is compared to a fuzzy model in which the fuzzy Bonferroni mean operator is used instead of the fuzzy Heronian mean operator, the initial ranks are retained. This means that changing the averaging operator in the main group of criteria does not play a role in the final result. In order to check rankings similarity, we calculated the WS coefficient (
Figure 8) which was developed in the paper [
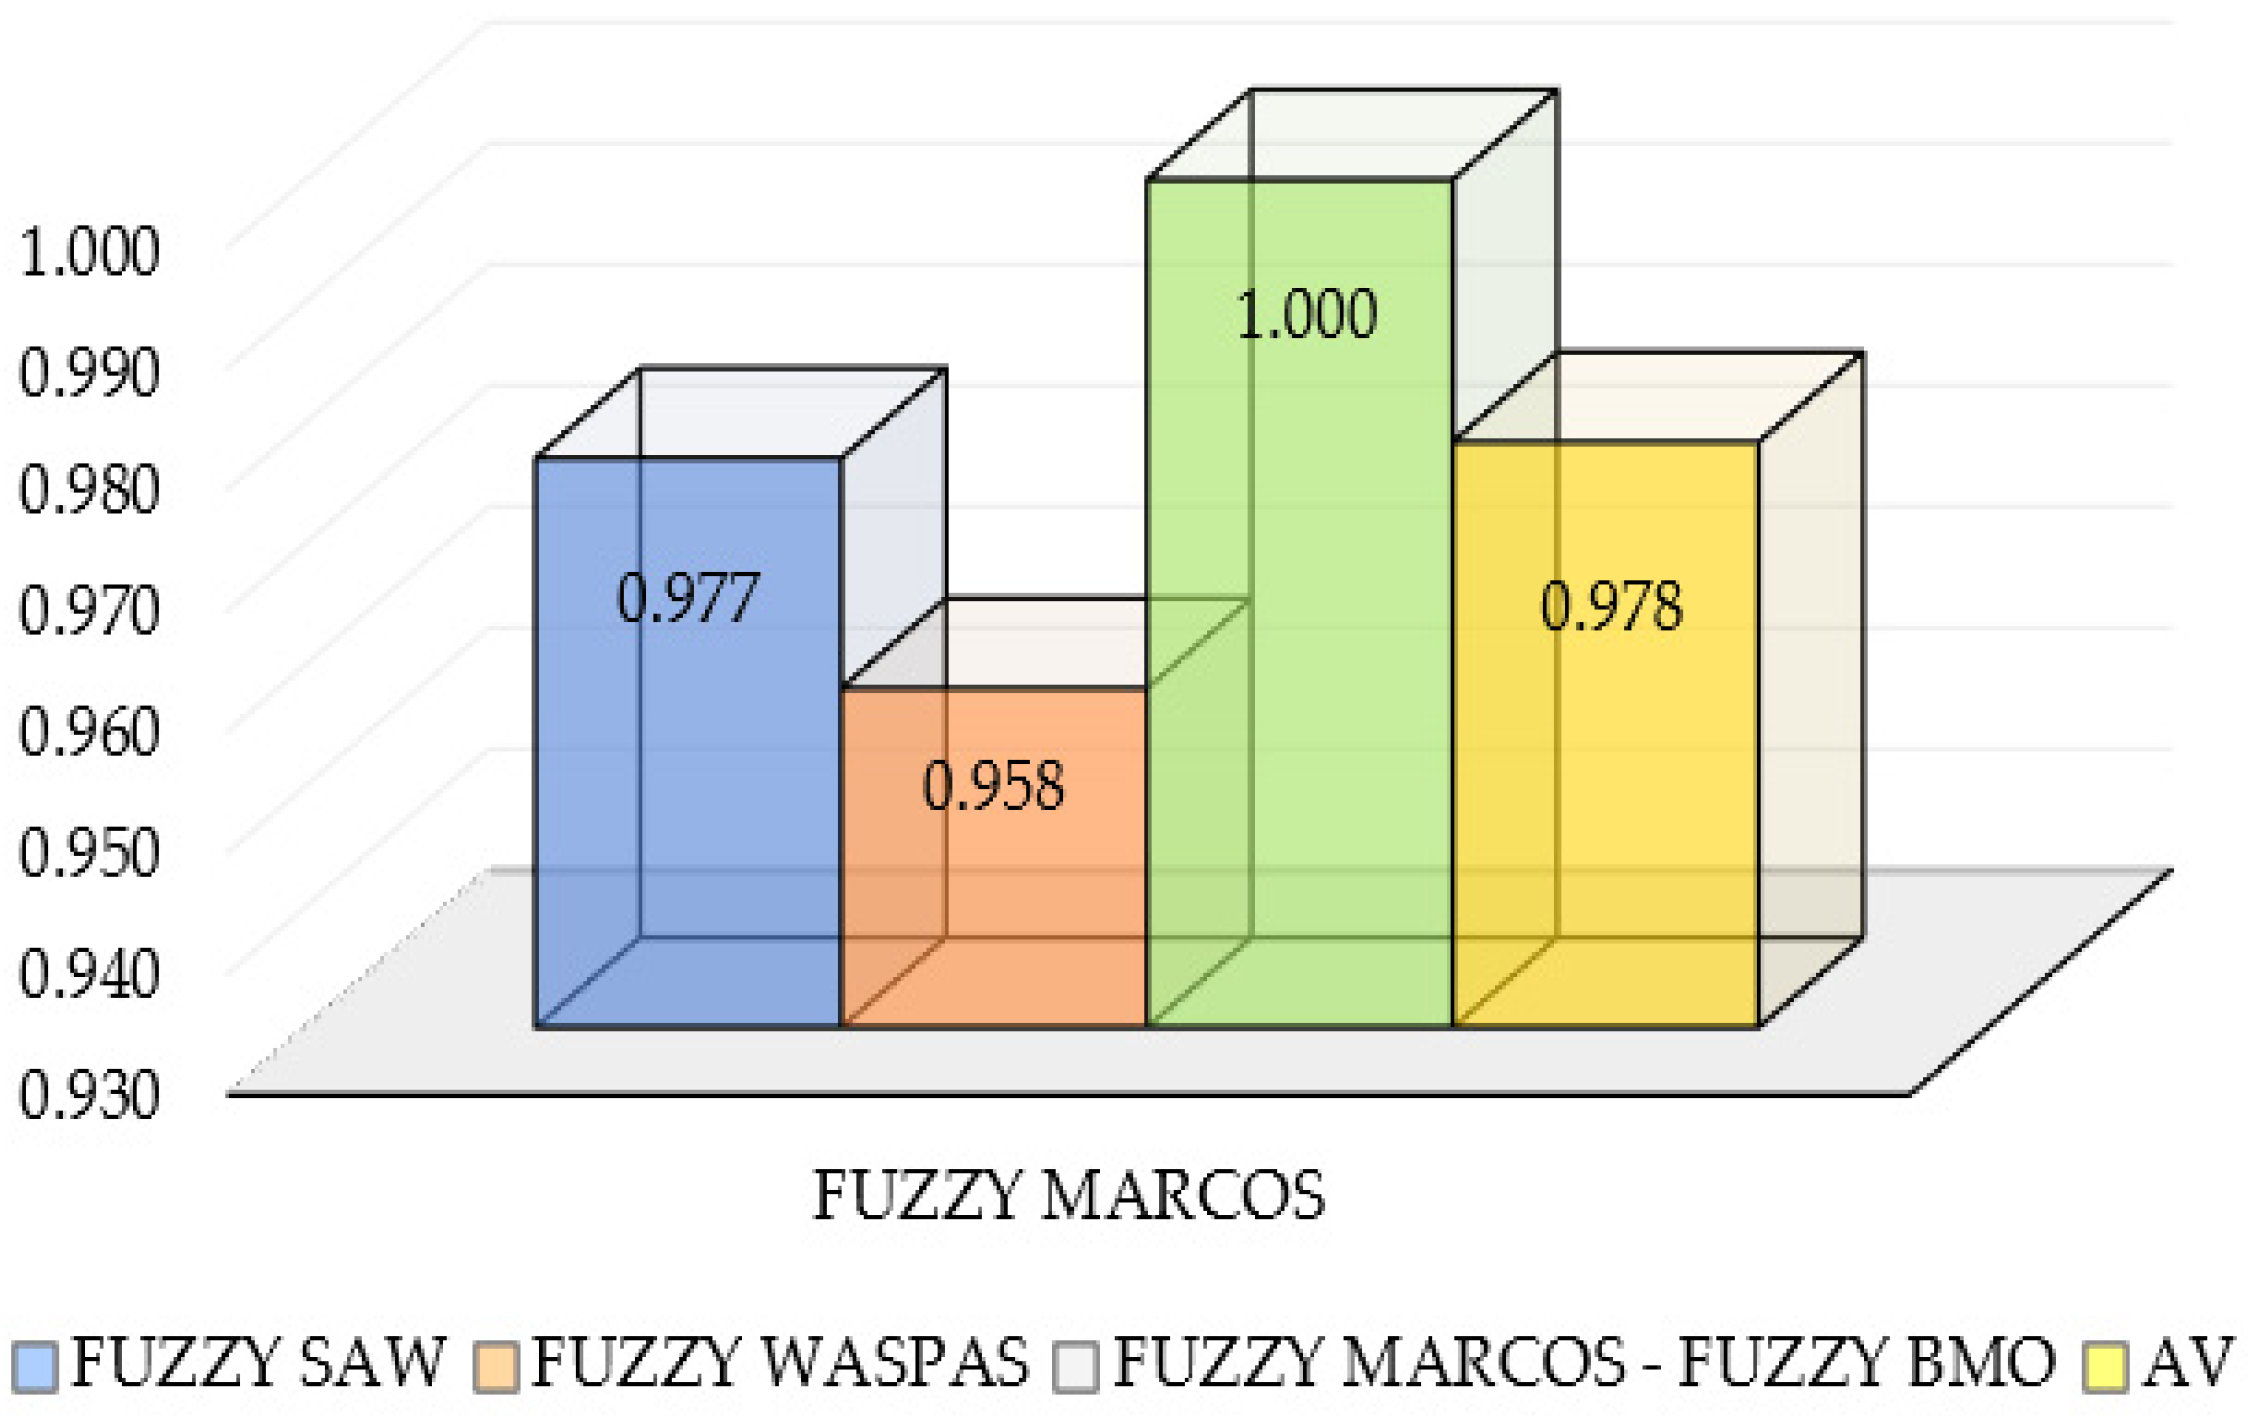
33]. Advantage of WS coefficient in fact that positions at the top of the ranking have a more significant impact on the similarity than those further away, which is right in the decision-making domain.
As can be seen in
Figure 8, previous discussion is proven, where WS coefficient has values 0.977 (Fuzzy SAW), 0.958 (Fuzzy WASPAS), and 1.000 (Fuzzy MARCOS–Fuzzy BMO) which show extremely high correlation in ranking alternatives.
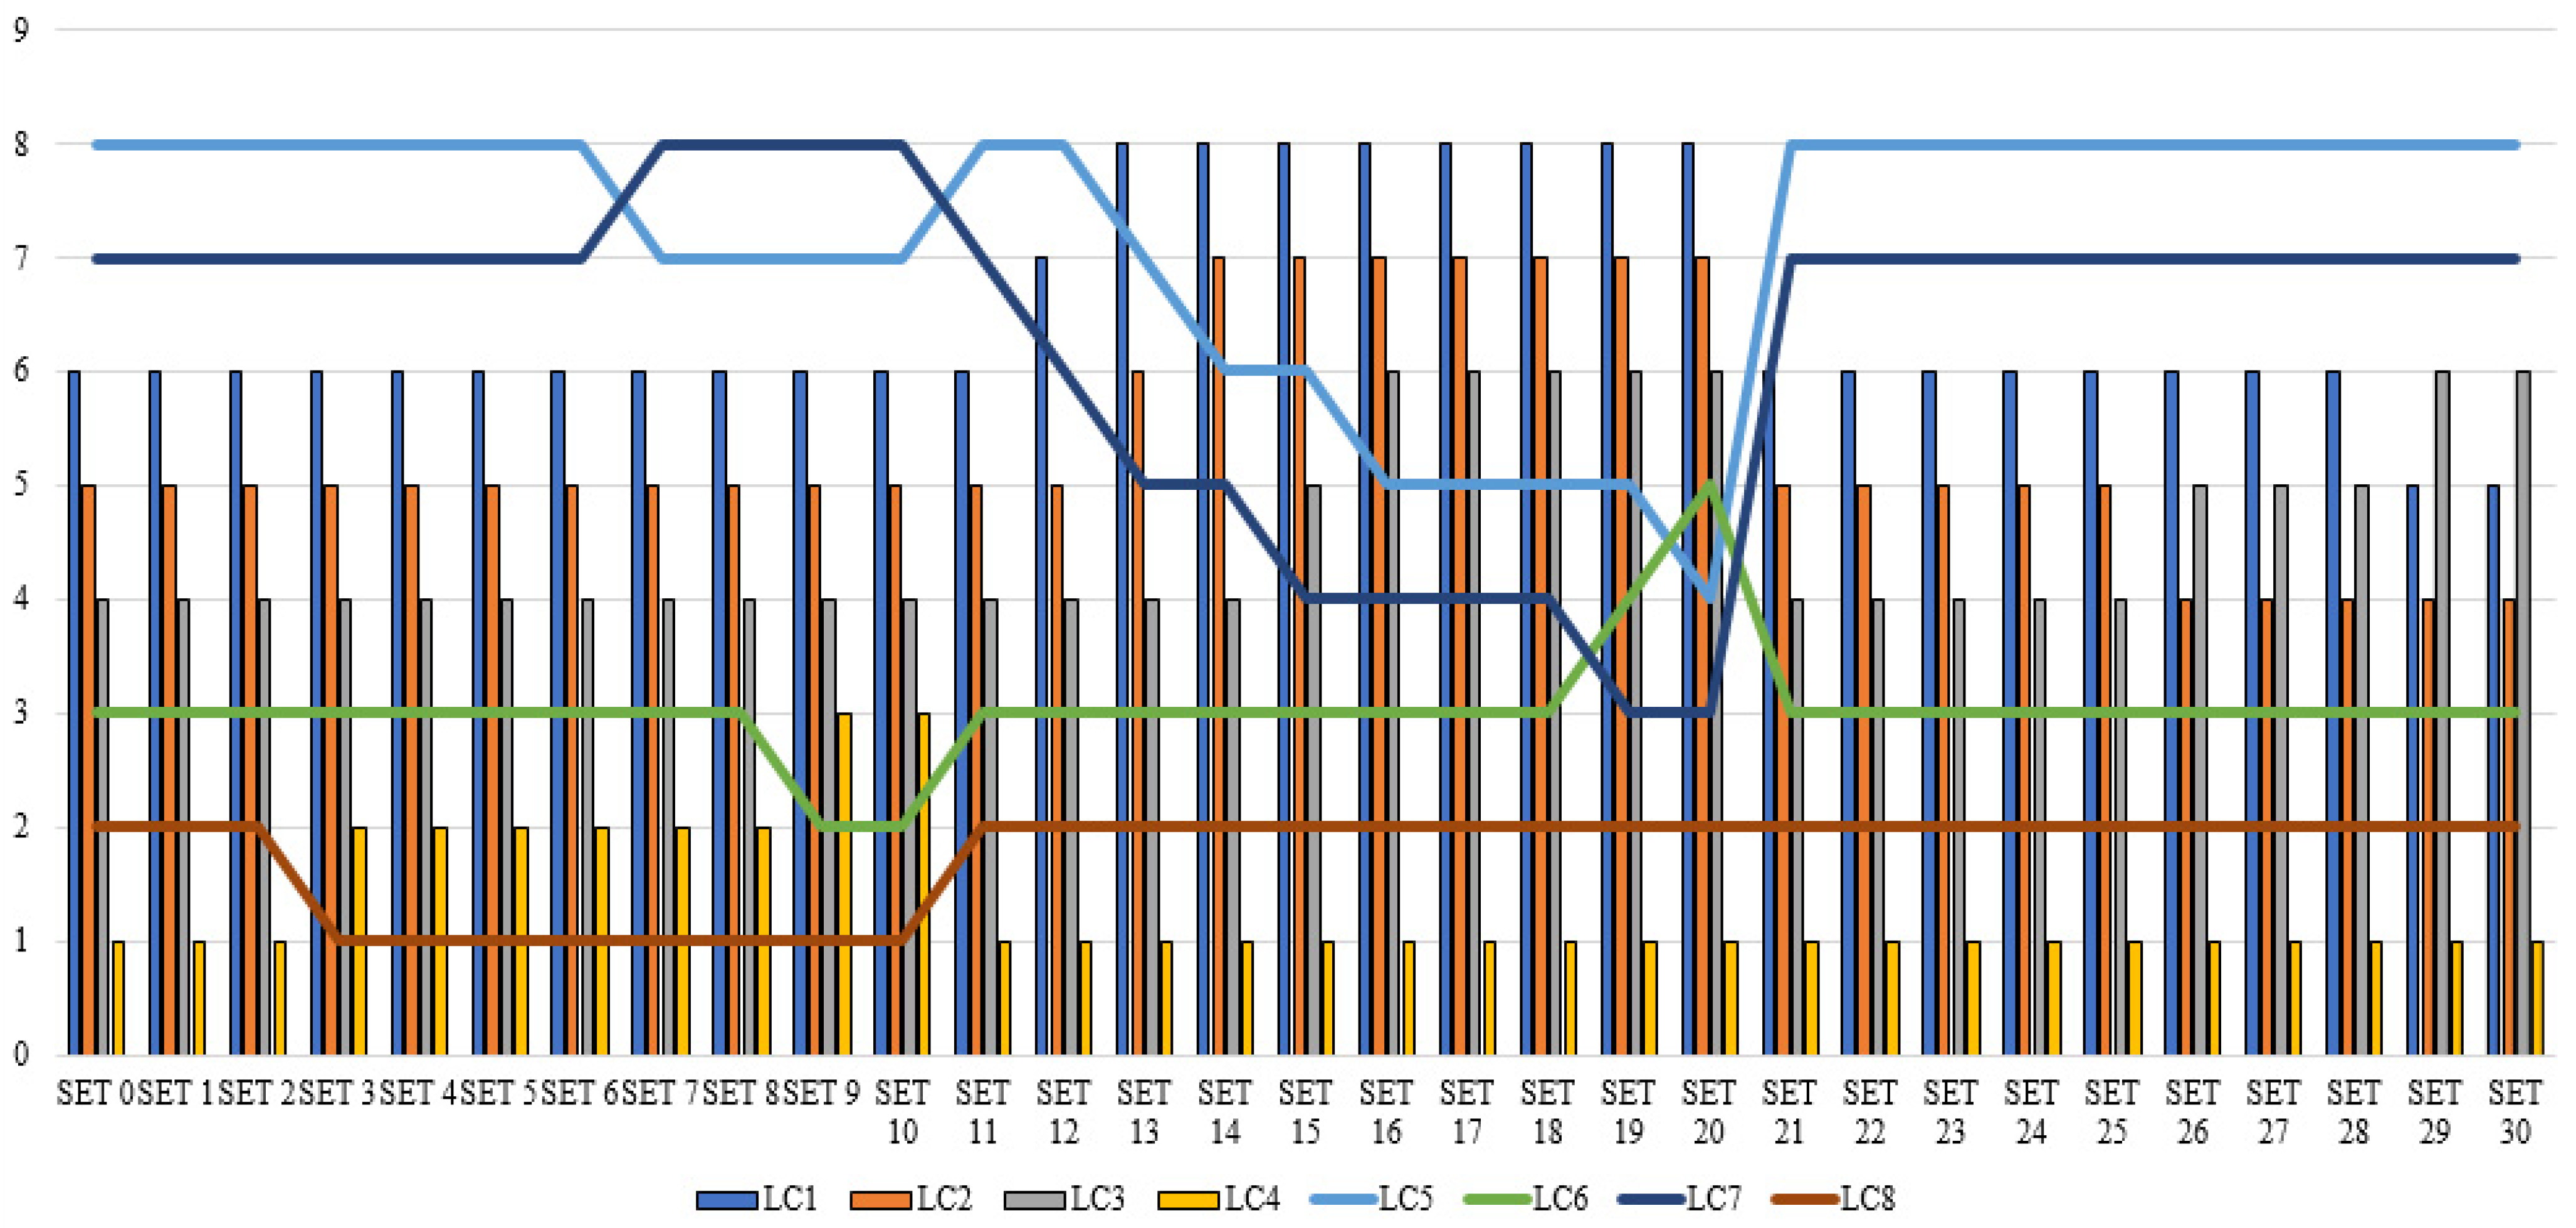
The third part of the sensitivity analysis involved the formation of 30 new scenarios with the reduction of the three most significant criteria and the verification of the impact on the final results. Thus, in the first 10 scenarios, the criterion C34 was reduced in the range of 5–95%, in S11–S20, the criterion C14 was reduced in the same range, and the criterion C24 was also reduced in the range of 5–95% in S21–S30.
The results obtained through the formed scenarios (
Figure 9) show the variation caused by a large percentage decrease in the values of three most significant criteria. When it comes to the safest level crossing LC4 in scenarios S3–S10 when the most significant criterion was reduced by 25–95% respectively for each scenario by 10%, it loses the first position. Then, the second-placed LC8 in the original model takes the first position. In scenarios S9 and S10, LC4 is in third place, while LC8 is still in the first place. In other scenarios, there is no change in the rank of the safest level crossing, which means that the change in the value of criteria C14 and C24 does not play any role in these alternative solutions. The third-placed LC6 changes its position in four scenarios, in S9 and S10 when it is in the second place caused by the reduction of criterion C14 by 85 and 95%; then, in scenarios S19 and S20 when it is in the fourth and fifth place, respectively. In these scenarios, criterion C14 is reduced by 85% and 95%, respectively. Alternatives LC1, LC2, and LC3 do not change their positions compared to the initial ranking in the first 11, 12, and 14 scenarios, which means that the change of criterion C34 does not affect their positions. Changes in these alternatives occur when the value of criterion C14 is reduced.
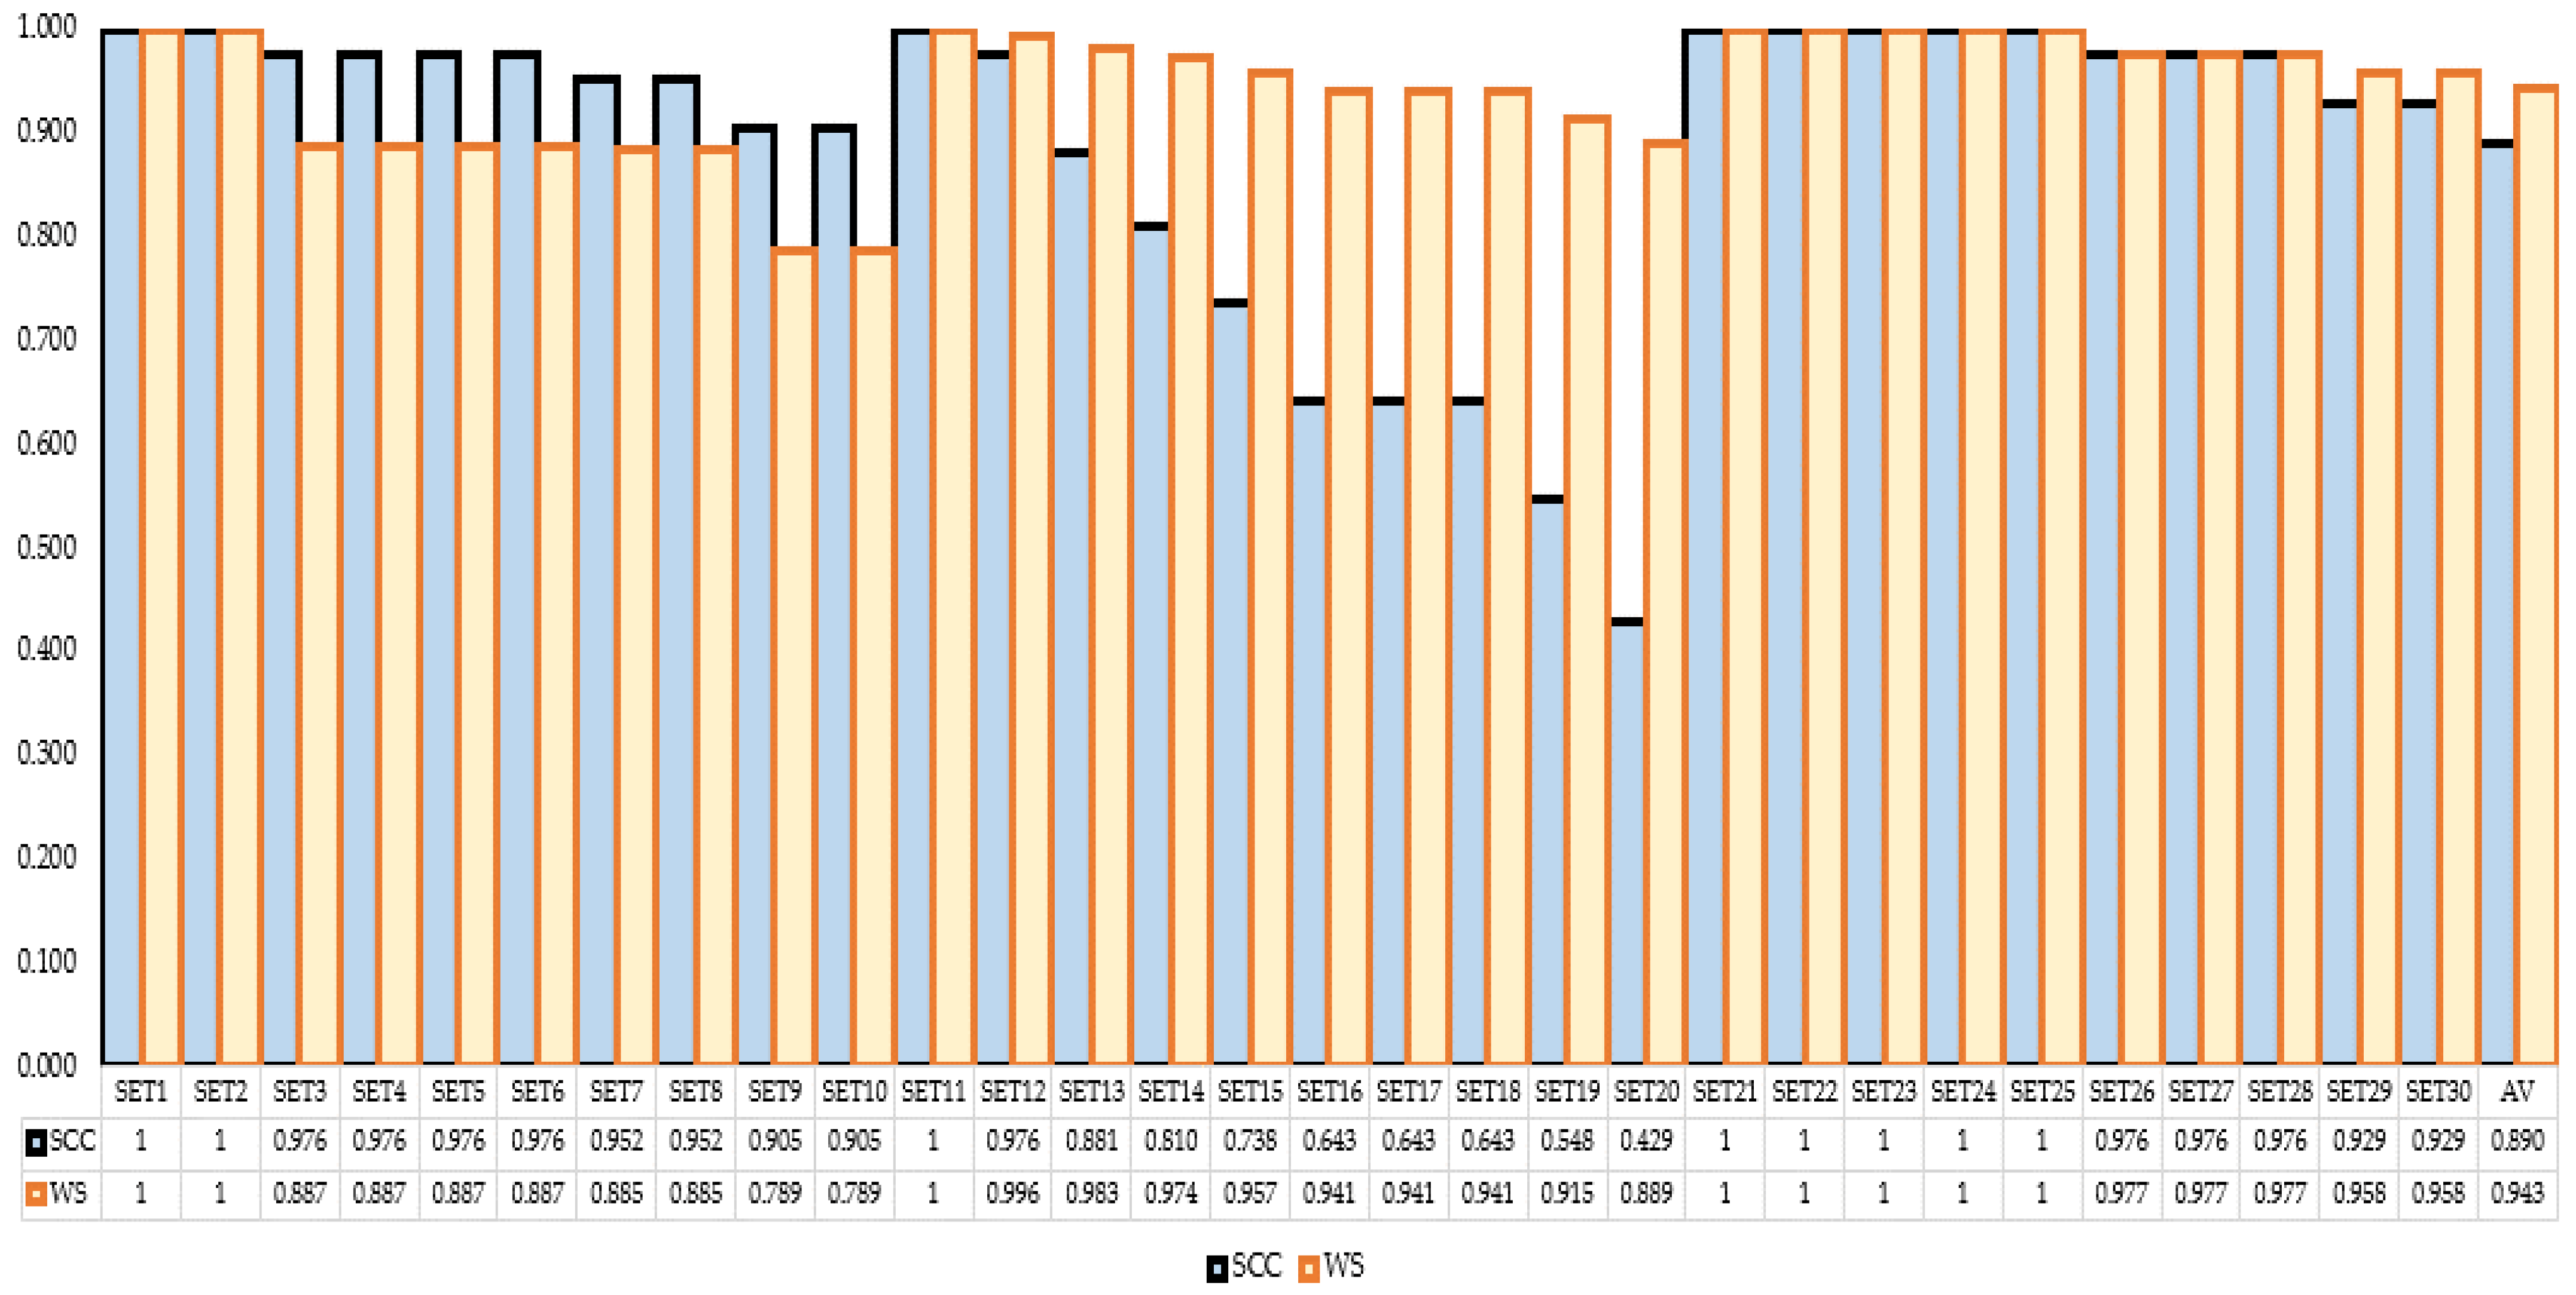
Since, in the newly formed scenarios, there was a change in the results comparing to the initial solution, i.e., the model proved to be sensitive to the effects of the criteria, the SCC was calculated to determine the correlation of the initial solution with all scenarios.
Figure 10 shows a statistical correlation—SCC [
34] and WS [
33,
35] of the initial rank results in relation to 30 scenarios in which the weight values of the criteria have been changed. A total correlation was observed in a total of eight scenarios out of 30 (SCC = 1.00). In the same number of scenarios, the SCC was 0.976, which means that there is a change in the ranks of the alternative solutions. In two scenarios (S7 and S8), SCC = 0.952, which means that there were two changes in ranks, while the value of the correlation coefficient was 0.929 in three scenarios. In other scenarios, the value of SCC was significantly lower and ranges 0.429–0.905, which means that there was a low correlation individually in some scenarios. In general, if all correlation coefficients are taken into account and the average SCC is calculated, it can be seen that the ranks were still highly correlated (SCC = 0.890). WS coefficient showed different values than SCC depending on rank changes because positions at the top of the ranking have a more significant impact on the similarity than those further away. For example, if we consider the third scenario where the two best alternatives changing their places, WS is less than SCC for 0.089 (SCC = 0.976, WS = 0.887). On the contrary, if we consider scenario 20 which has more changes in ranks, but not for best alternatives, WS has much higher value than SCC (SCC = 0.429, WS = 0.889). In general, if all correlation coefficients are taken into account and the average WS is calculated, it can be seen that the ranks are very highly correlated (WS = 0.943).


 ,
, 


