Article

Assessment and Evaluation of the Response of Vegetation Dynamics to Climate Variability in Africa

1
State Key Laboratory of Desert and Oasis Ecology, Xinjiang Institute of Ecology and Geography, Chinese Academy of Sciences, Urumqi 830011, China
2
Key Laboratory of GIS & RS Application Xinjiang Uygur Autonomous Region, Urumqi 830011, China
3
University of Chinese Academy of Sciences, Beijing 100049, China
4
School of Geography and Tourism, Chongqing Normal University, Chongqing 401331, China
5
Binjiang College, Nanjing University of Information Engineering, Nanjing 210044, China
6
Faculty of Environmental Studies, University of Lay Adventists of Kigali, 6392 Kigali, Rwanda
*
Author to whom correspondence should be addressed.
Sustainability 2021, 13(3), 1234; https://0-doi-org.brum.beds.ac.uk/10.3390/su13031234
Submission received: 9 December 2020 / Revised: 15 January 2021 / Accepted: 20 January 2021 / Published: 25 January 2021
(This article belongs to the Section Air, Climate Change and Sustainability)

Abstract

:
Understanding the impacts of climate variability and change on terrestrial ecosystems in Africa remains a critical issue for ecology as well as for regional and global climate policy making. However, acquiring this knowledge can be useful for future predictions towards improved governance for sustainable development. In this study, we analyzed the spatial–temporal characteristics of vegetation greenness, and identified the possible relationships with climatic factors and vulnerable plant species across Africa. Using a set of robust statistical metrics on the Normalized Difference Vegetation Index (NDVI3g) for precipitation and temperature over 34 years from 1982 to 2015, relevant results were obtained. The findings show that, for NDVI, the annual rate of increase (0.013 y−1) was less than that of decrease (−0.014 y−1). In contrast, climate data showed a sharper increase than a marked decrease. Temperature is increasing while rainfall is decreasing, both at a sharp rate in central Africa. In Africa, tree cover, broadleaved, deciduous, closed to open (>15%) and shrubland plant species are critically endangered. The tropical vegetation devastated by the climate variability, causes different plant species to gradually perish; some were cleared out from the areas which experienced degradation, while others were from that of improvement. This study provides valuable information to African governments in order to improve environmental sustainability and development that will lead to the sustainability of natural resources.

1. Introduction

In the climate system, vegetation cover influences energy, water and gas interactions with the atmosphere by acting as a principal source and sink in biogeochemical interaction. Hence, climate determines the natural vegetation distribution [1]. If there are any component changes, the dynamic equilibrium between climate and vegetation will also possibly be modified. In Africa, the disturbance is likely to appear from June 1997 to May 1998. The global climate system was disrupted by the most significant El Niño/Southern Oscillation (ENSO) phenomenon observed during this century [2,3]. Regarding the responses of the terrestrial biosphere in Africa, the most anomalous conditions normally occur over equatorial eastern Africa [4]. Further, the high increase in temperature [5], and interannual variability of rainfall resulted in a strong negative impact on vegetation and agriculture, hence the food security status of the region [6], especially in maize production in southern Africa [7]. Thus, the high spatial and temporal rainfall variability endures a daunting challenge for the management of agricultural activities in this continent [8]. Droughts and flooding events occur [9], while the risk of drought in southern Africa has been identified to increase by 12% in El Niño years [10].
A proper understanding of vegetation dynamics, in terms of space and time, can reverse the situation, and lower the impacts and losses already caused in affected areas so as to reduce the sufferings of the vulnerable population. Thus, it is substantial to quantify the vegetation change magnitude to understand and monitor the greenness and ecosystem dynamics [11]. The management of African tropical forests remains a challenge, and requires scientific decisions for its sustainability and preservation. This will be achieved by extensive research to help with vegetation monitoring through different investigations, since climate change is expected to continue. Researchers predict that climate change and its effects will continue to occur, as temperatures are expected to rise at 1.5 to 2 times the rate of the global temperature rise [12]. Rainfall is expected to continue to change, and the frequency and intensity of drought events are expected to increase as well [13]. The El Niño phenomenon should also be considered in future scenarios [14].
Many global and regional studies have focused on African vegetation dynamics and their relation to climate factors. For example, a 6 year regional study (1982–1987) examined the variability of NDVI and its relation to rainfall in Botswana and showed that the efficiency of rain use appears to rely more on the underlying soil than on the formation of vegetation [15]. Chamaille-Jammes, Fritz [16] assessed NDVI and rainfall relationship in the Hwange National park, Zimbabwe, where their findings revealed that the rainfall–NDVI relationship is stronger at the seasonal scale, due to the influence of field features, than at interannual scale. A satellite-derived rainfall and NDVI data for 20 years (1981–2000) were used to detect spatial and temporal interrelationships by applying component analysis. The findings stated that an earlier event of rainfall and subsequent “greening” is believed to have resulted in a moisture flux that encourages the next rainfall event [17]. Georganos, Abdi [18] used Geographically Weighted Regression to examine the NDVI–rainfall relationship in semi-arid Sahel from 2000 to 2012, and their results revealed that humid areas significantly correlated more than in wetlands and irrigated lands. They conclude that the rainfall–NDVI relationship varied temporally due to spatial trend differences.
Furthermore, climate change assessment in Africa shows a teleconnection trends between the Pacific Ocean basin climate conditions and vegetation conditions [19]. Kawabata, Ichii [20] analyzed the annual and seasonal vegetation activities for global monitoring of vegetation changes and their relationship with temperature and precipitation over a 9-year period. Their results revealed that in large regions of the northern middle-high latitudes and in tropical regions, particularly in western Africa, the gradual increase in temperature increased the vegetation. However, vegetation decreased in the arid and semi-arid southern hemisphere caused by the decrease in annual rainfall during this period. The influence of climate change on the productivity and phenology of vegetation in Sub-Saharan Africa was assessed, and the results showed that SSA vegetation is driven by various factors, particularly, rainfall in West Africa and parts of Central Africa, and ENSO as the key driver in Eastern and Southern Africa [21]. A long-term study (1982–2015) by Kalisa, Igbawua [22] assessed the climate impact on vegetation in east Africa, and the results revealed both positive and negative correlations before and after 1998, respectively, while NDVI correlated higher to rainfall than to temperature.
However, most previous studies conducted at regional scale were performed at short-term intervals and hardly took the endangered species across the vegetation biomes in Africa into account. There is a lack of accurate and updated information on the current status of African vegetation due to the limited design of effective policies on land degradation, desertification, forest management and food security. Therefore, there is a need for long-term continental studies which can address these research gaps in Africa. To this end, the objectives of this study are to: (1) investigate, at a continental scale, African spatial–temporal vegetation greenness changes and endangered plant species from 1982 to 2015, (2) assess the climate spatial–temporal changes and their effects on vegetation change, and (3) identify the regions that may be vulnerable to climate change using NDVI as a reflective indicator. Assessing the dynamics of African vegetation with climate change will help decision makers to understand how best to reduce disasters resulting from reduced vegetation so as to ensure the sustainable development of natural resources at continental scale.

2. Materials and Methods

2.1. Study Site and Data Description
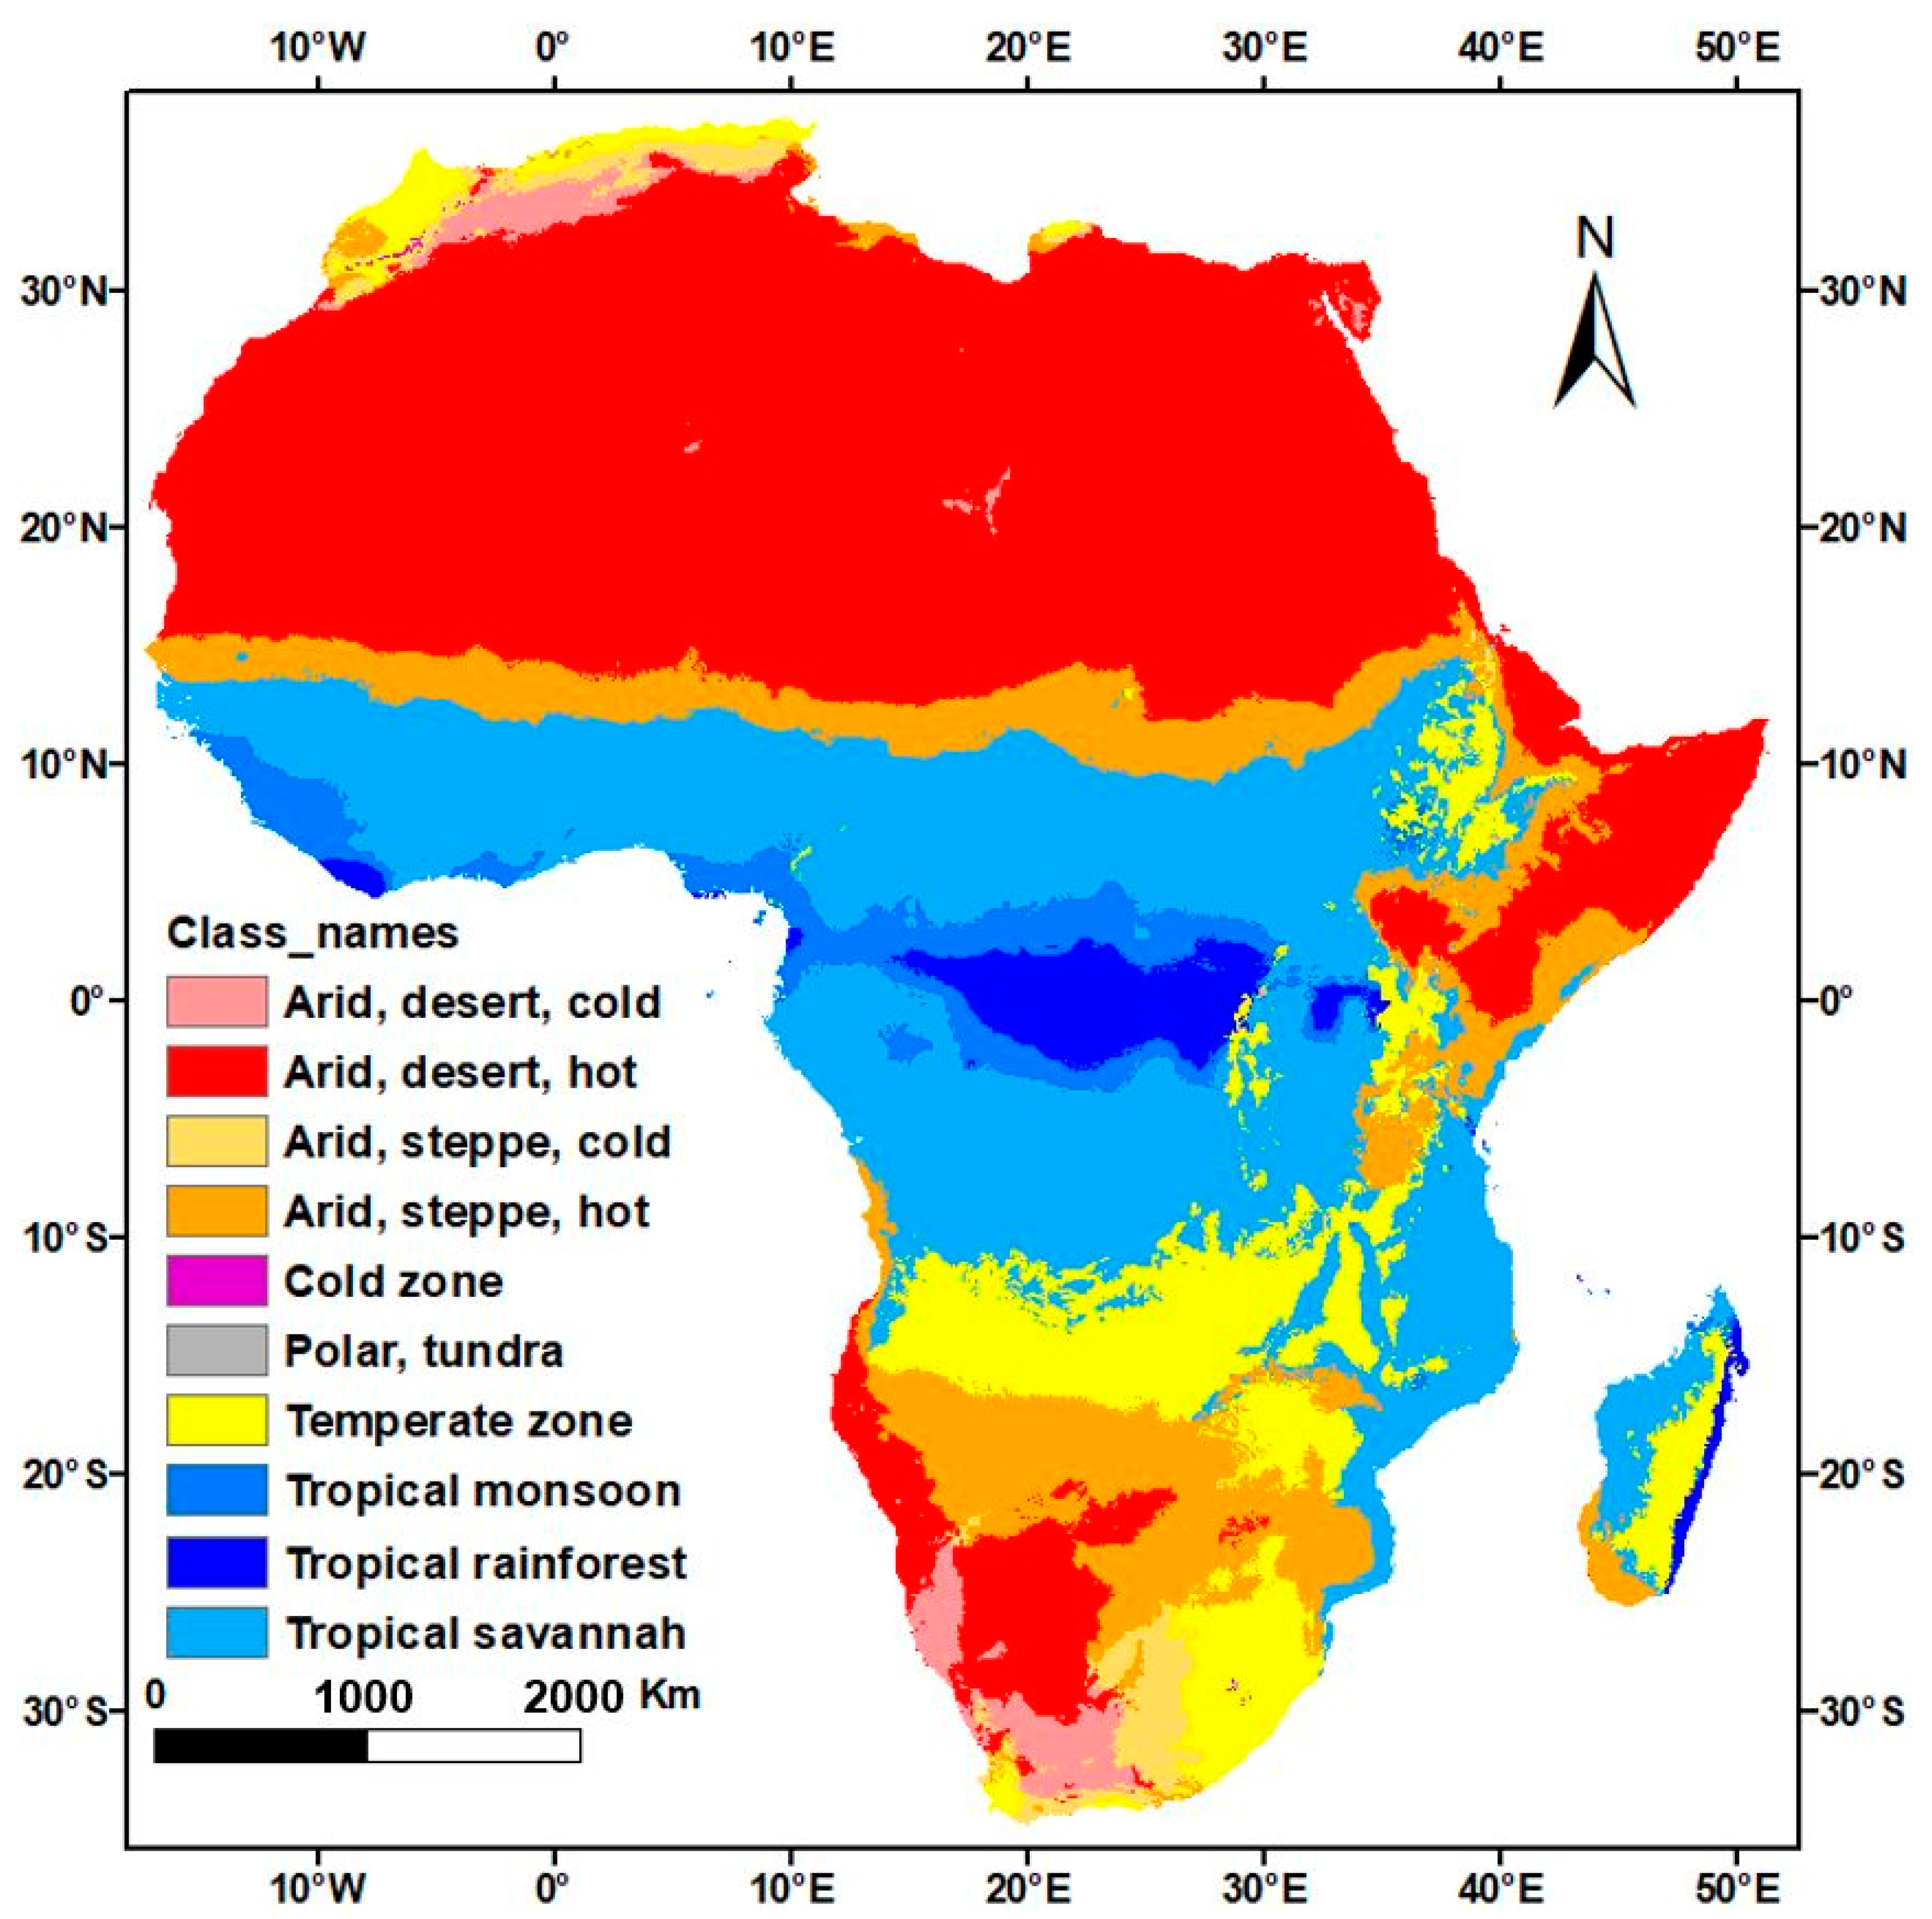
2.1.1. Study Area

Africa is the largest continent of all tropical land masses and takes second place among the world′s seven continents. It covers an area of 30 million km2, accounting for 20% of the world′s total land area. It extends about 8050 km from its northernmost point in Tunisia to its southernmost point in South Africa, and 7560 km wide, from its westernmost point in Senegal to its easternmost point in Somalia [23]. Africa generally falls under four seasonal temperatures, which are summarized and arranged as Summer (December–January–February), Autumn (March–April–May), Winter (June–July–August) and Spring (September–October–November) [21,24], but vary from country to country.
The climate system of the African continent is varied from humid equatorial to the Mediterranean climate system. Africa has five climate zones (Figure 1): tropical; arid hot and cold; temperate dry, hot, cold and warm; the boreal warm and cold, and the polar tundra found at the top of high mountains [25]. Rain in African does not fall in all parts at the same level. Some parts receive year-round precipitation (tropical rainforest) while others receive seasonal precipitation. In addition, some parts receive heavy rainfall while others receive very little (<250 mm y−1 in desert). Rain patterns tend to decrease the further you move from the equator. Rain is negligible in the Sahara Desert, at the horn of Africa, and in the Kalahari Desert. African vegetation is also distributed according to rain and climatic zones, where the NDVI average ranged from 0.79 in tropical to 0.24 in arid (Figure 2). According to the land cover map defined by the European Space Agency (ESA, Paris, France) Climate Change Initiative (CCI, Noordwijk, The Netherlands) project, among the 25 vegetation classes found in Africa, shrubland is the dominant one because it covers more than 20% of all African vegetation cover (Figure 3).

2.1.2. NDVI Data

The third-generation Normalized Difference Vegetation Index (NDVI3g) time series of Global Inventory Modeling and Mapping Studies (GIMMS) has been available for more than 34 years, since 1981 [21,26]. The spatial and temporal resolution of these data are 0.083° and 15 days, respectively. Despite that, the NDVI is more sensitive to the effects of soil background and requires remote sensing calibration [27], and this is our choice because it is widely used and acceptable [28], given that it fulfills all the necessary calibration requirements. The radiometric calibration, atmospheric attenuation, cloud filtering, orbital drifting, sensor degradation and all other effects not related to climate change have been used to confirm this dataset [26]. Therefore, the NDVI3g offers an extraordinary opportunity to examine the vegetation dynamics in depth, as well as the exchanges in response to climate changes over a long period. From the half-monthly NDVI3g datasets, we generated two NDVI time-series: the seasonal NDVI mean and annual maximum (NDVImax) from 1982 to 2015. We further processed the 34 NDVImax maps for 34 years, and 34 maps for each season among the four annual seasons, to one annual composite and four seasonal composites, resulting in 34 time series to be used as inputs for the trend analysis.

2.1.3. Climate Data

The Climate Hazards Group Infra-Red Precipitation and station (CHIRPS) is a rainfall dataset with more than 30 years of history. It streaks from 50° S to 50° N and covers all longitudes. The datasets are available at ftp://ftp.chg.ucsb.edu/pub/org/chg/products/CHIRPS/ from 1981 to the present. The 0.05° resolution satellite imagery creates gridded rainfall time series for trend analysis and seasonal drought monitoring [29]. CHIRPS has a low systematic and mean absolute errors compared to the Global Precipitation Climatology Centre (GPCC) and high-quality datasets in Africa [30]. Thus, these precipitation datasets have been chosen to be used in this study.
The global reanalysis ERA-Interim was produced by the European Center for Medium-Range Weather Forecast (ECMWF) [31] and the dataset is extended from 1979 to 2019. This interpolated to regular Lat/Lon grid open-access dataset is available on ECMWF data archive 2-m monthly mean of the daily mean temperature data with 73 km resolution, and was used in this paper after being downloaded from https://apps.ecmwf.int/Datasets/data/interim-full-moda/levtype%3Dsfc/.

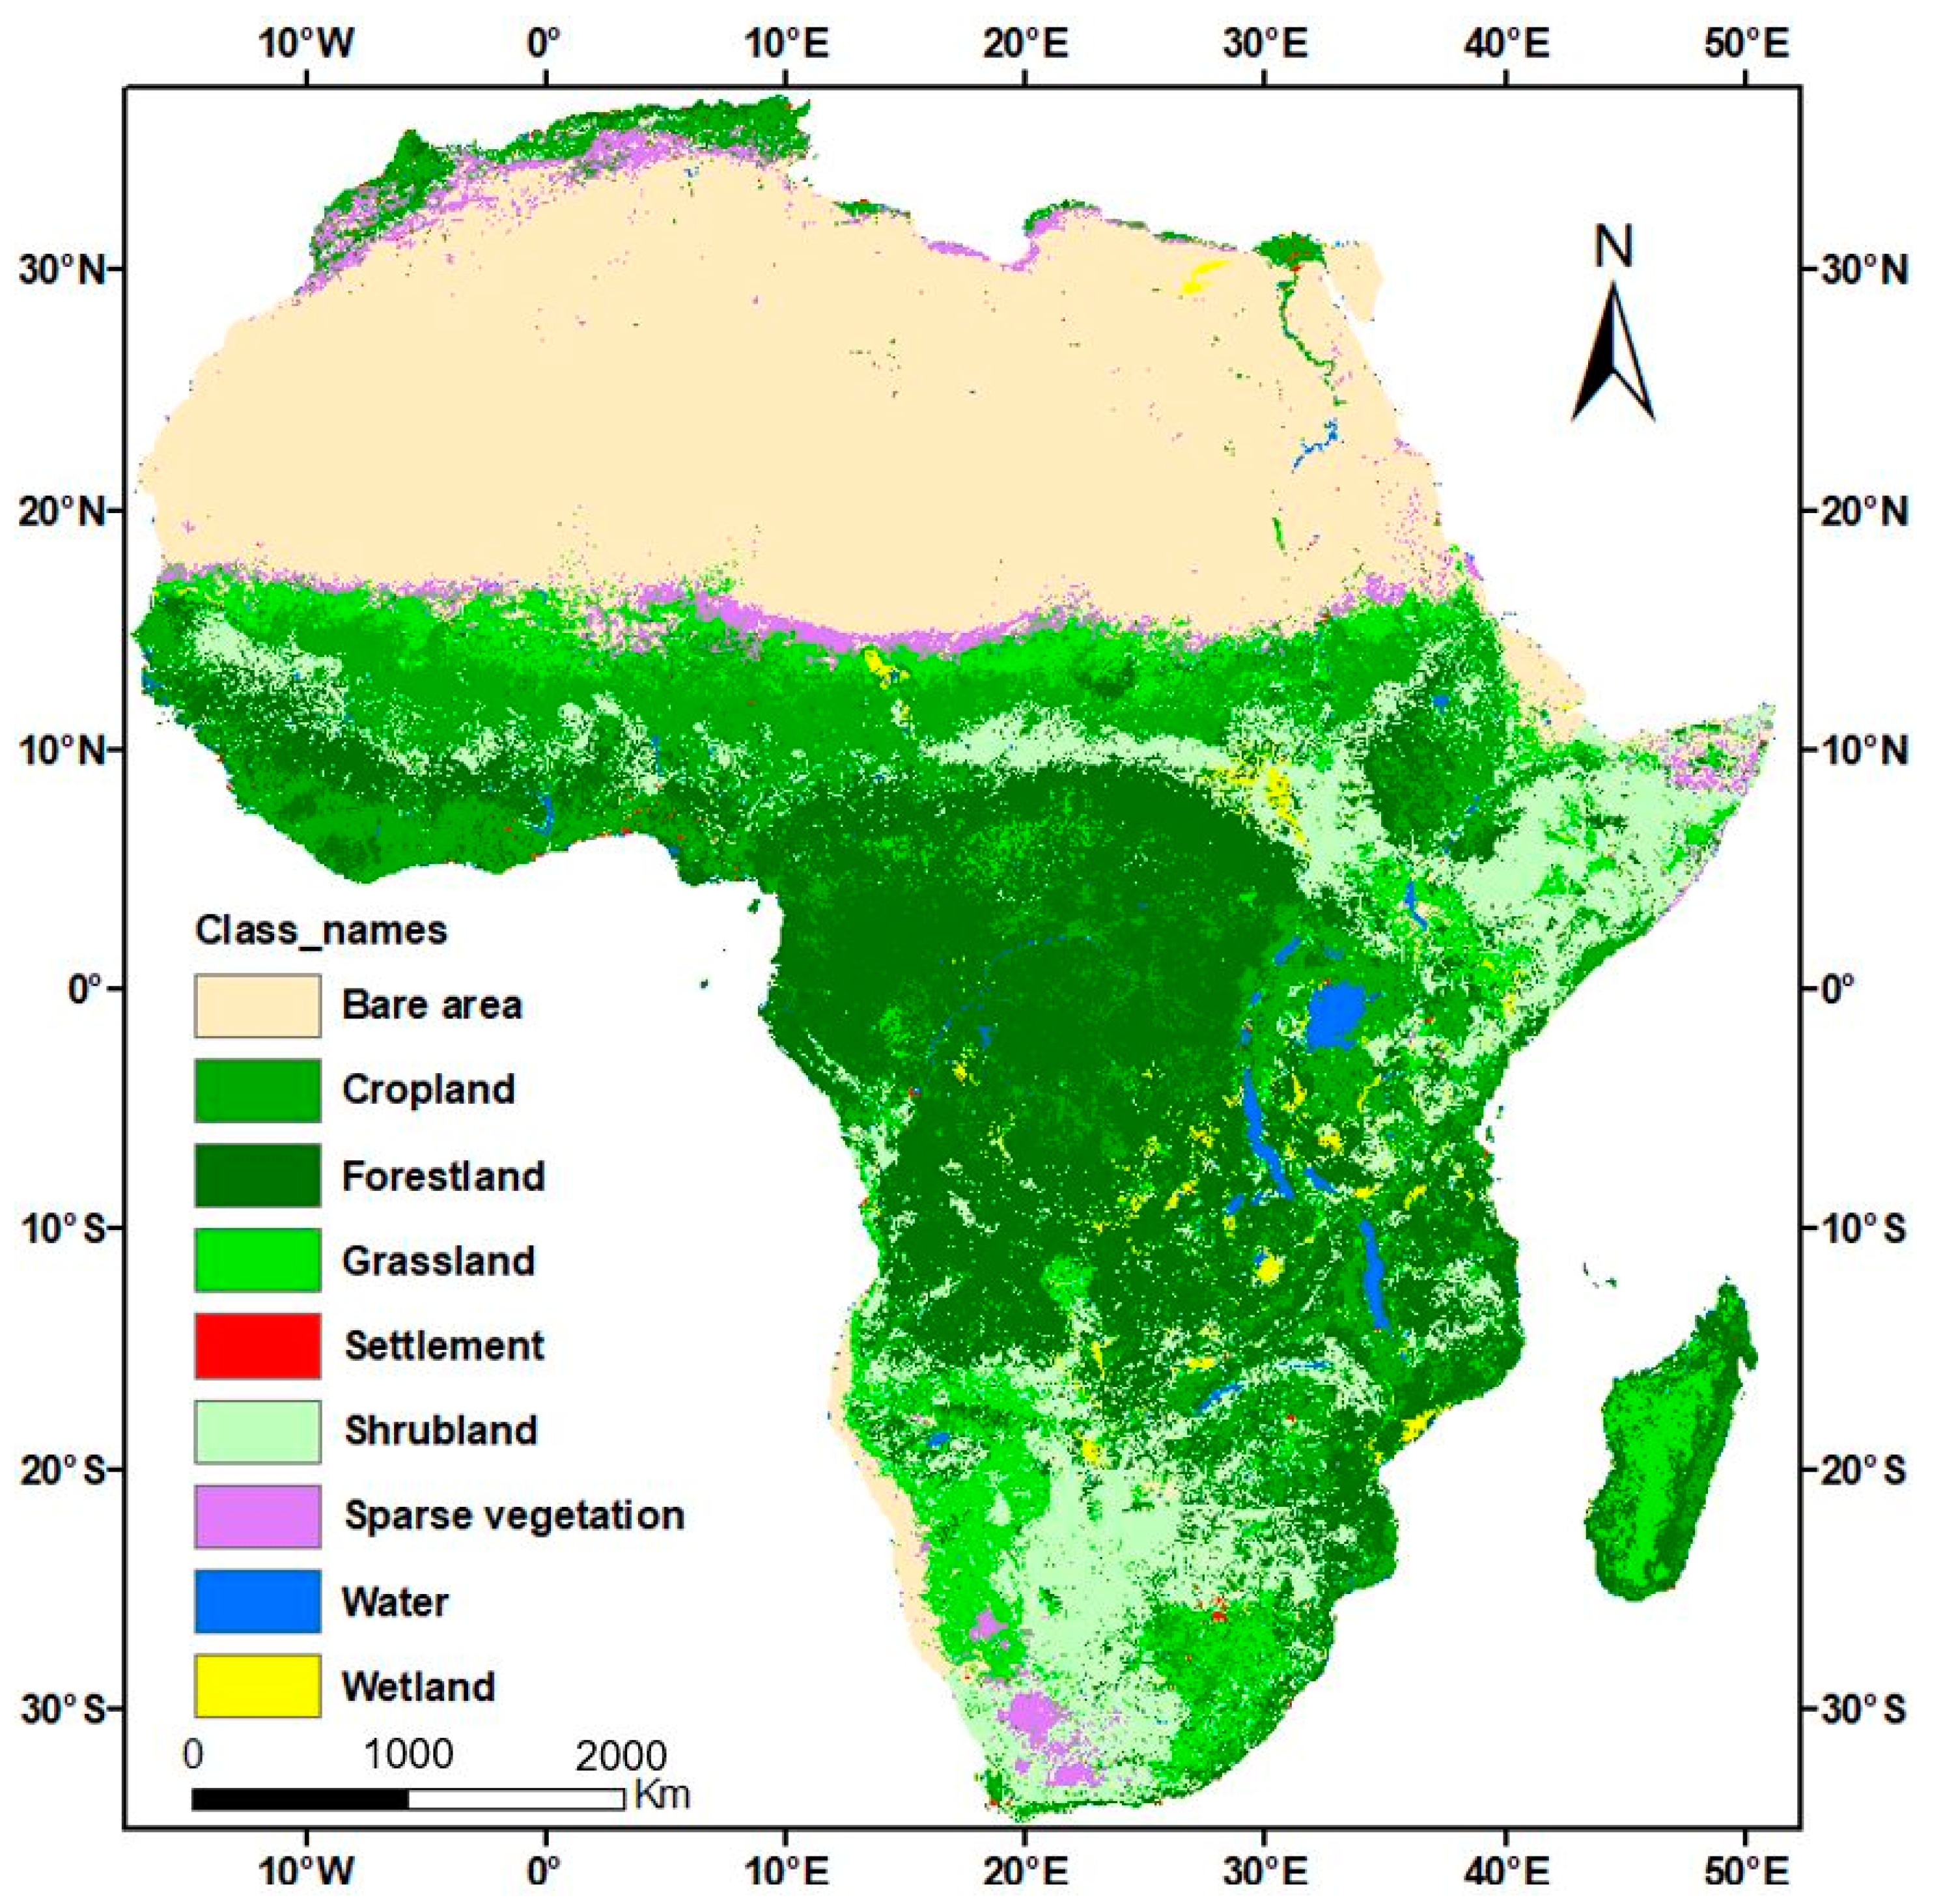
2.1.4. Land Cover Data

To assess the characteristics and evaluate the fluctuations in and extinction of vegetation types, we used a newly improved and consistent Land cover map from 1992 to 2015 of the European Space Agency (ESA) Climate Change Initiative (CCI) project, downloaded from an online open-access platform (https://www.esa-landcover-cci.org).

2.2. Methods

2.2.1. Pre-Processing of the Data

Before using different datasets with different spatial resolutions, a resampling was done to a common resolution of 0.083° to match their spatial resolution to that of the NDVI time-series. The NDVI values range from about −0.2 to 0.1 for snow, inland water bodies, deserts, exposed soils and sparsely vegetated areas, and from 0.1 to 0.1 for increasing amounts of vegetation [32]. Thus, the NDVI-values lower than 0.1 and desert areas in general were masked. Fractional vegetation cover (FVC) was estimated for each pixel [33].

2.2.2. Linear Regression Analysis

The spatial and temporal variations in annual and seasonal average NDVI, mean maximum temperature and cumulative precipitation were carefully analyzed using a linear regression analysis method in this research. To obtain the slope coefficients of trend lines, the time series values of each pixel were calculated
S l o p e = n i = 1 n X i Y i i = 1 n X i i = 1 n Y i n L = 1 n X 2 ( L = 1 n X ) 2
where   X   and   Y   are the values of the independent (years) and dependent (NDVI values) variables in the ith year, respectively, and n is the cumulative number of years (from 1982 to 2015) of the study period. Generally, if the slope = 0, the dependent variable shows a stability while when slope >0, the variation in the dependent variable shows an increasing trend, while when the slope is <0, it shows a decreasing trend. After that, the slope (Figure 4a) was multiplied to its p-value (Figure 4b) to clearly show the spatial distribution of significant trends with their strength (Figure 5a). The integration of the two maps (Figure 4a,b) were presented in classes.

2.2.3. Vegetation Types Analysis

Through the slope analysis result map, using the tabulation method, we computed the values of plant species in each type of variation (Table 1) in 1992 and in 2015. Then, we were able to identify how much of each vegetation type was in each of the five classes of NDVI trends. Thus, we computed the changes. From here, we were able to identify the vegetation degradation areas and, within the land cover map, we assessed the plant species and their transitions, and identified those on the path to destruction (extinction). Statistical analysis of each type of vegetation was carried out to ensure the true types of vegetation in danger.

2.2.4. NDVI and Key Meteorological Factors Correlation Analysis

Pearson′s correlation coefficients were precisely calculated for each pixel, between the mean annual NDVI as a dependent variable, and the mean annual temperature and accumulative annual precipitation as independent variables. To clearly understand and accurately assess the effect of climate variability on the vegetation change, we also calculated this correlation coefficient between the seasonal NDVI and seasonal temperature and precipitation by using Pearson′s correlation coefficients’ equation
r x y = i 1 n ( x i x ¯ ) ( y i y ¯ ) i = 1 n ( x i x ¯ ) i = 1 n ( y i y ¯ ) 2 ,
where y and x are the predictor (climate) and response (NDVI) variables, respectively.
In the correlation coefficient between two variables, with a value ranging from −1 to 1, having a correlation coefficient greater than zero means a positive correlation between the two specific variables and having a negative means a negative correlation between them. This means that a larger absolute value properly indicates a stronger correlation. All the above-defined seasons were considered for 34 years in this study. Thus, during this analysis, the non-vegetated areas were masked to better obtain real information.
We also applied the Spearman correlation statistics, which is the most popular nonparametric tool that can be used to remediate autocorrelation in trend analyses where there is a need to detrend or to normalize the distribution of analyzed variables [34,35].

3. Results

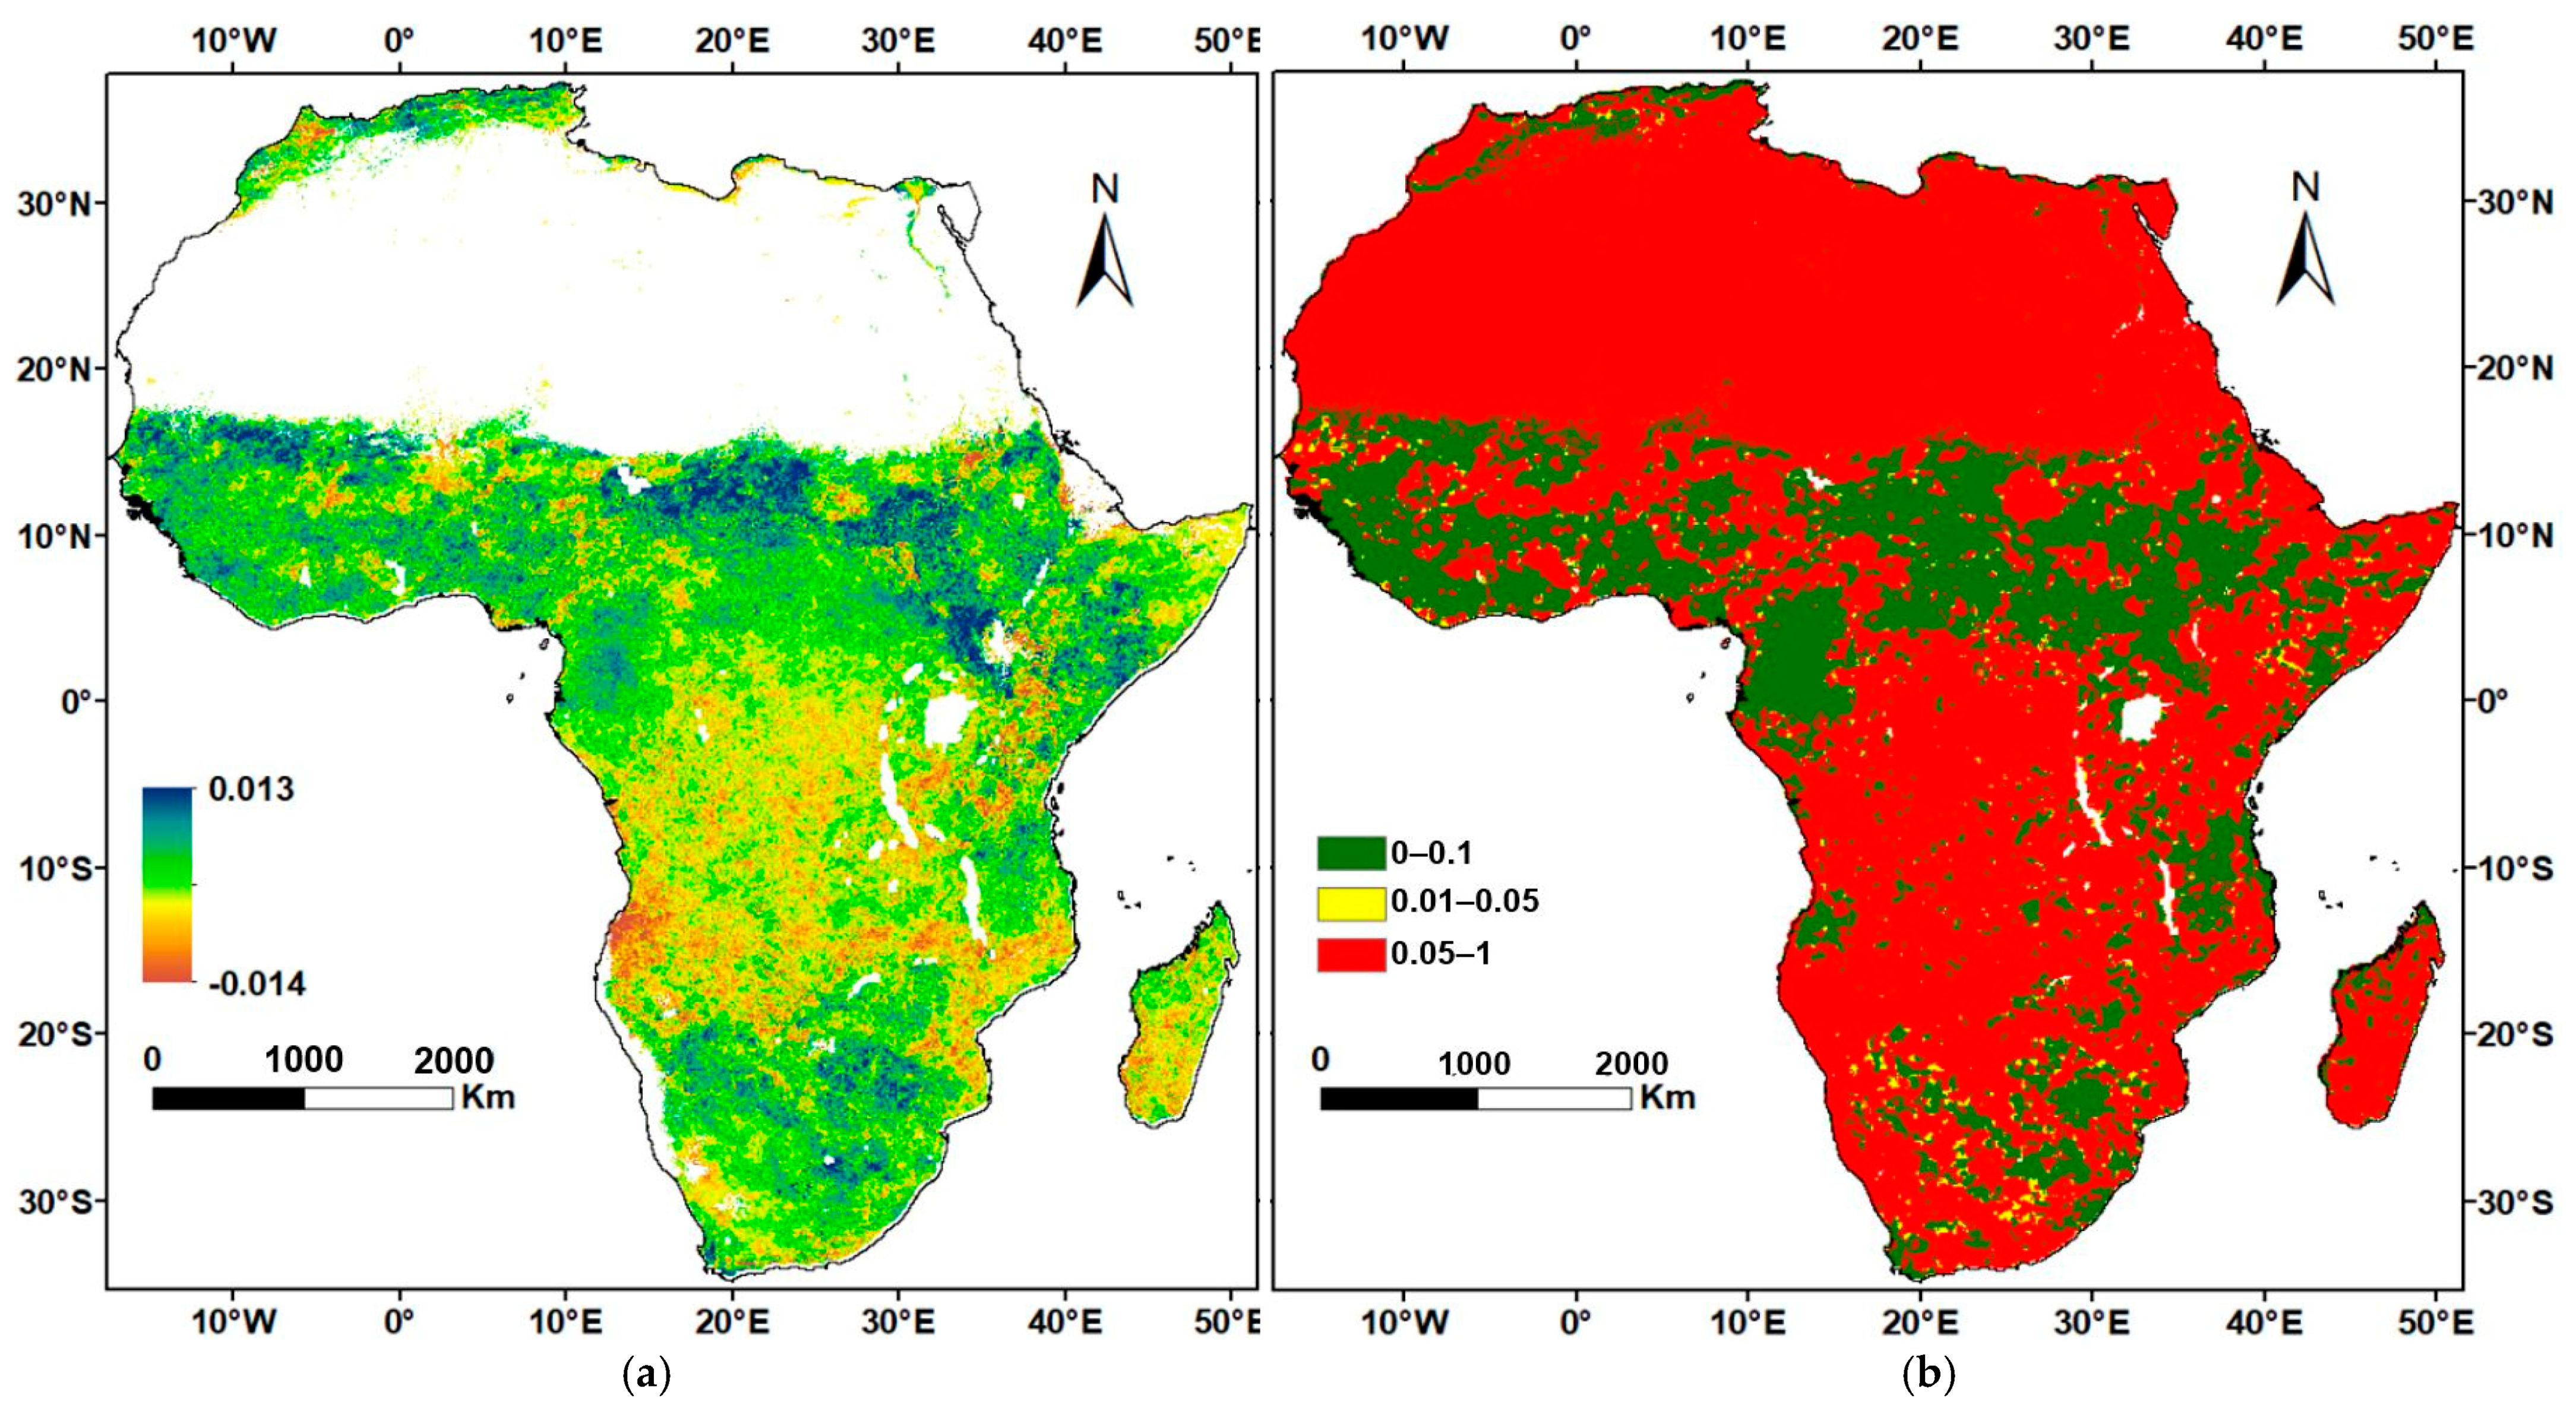
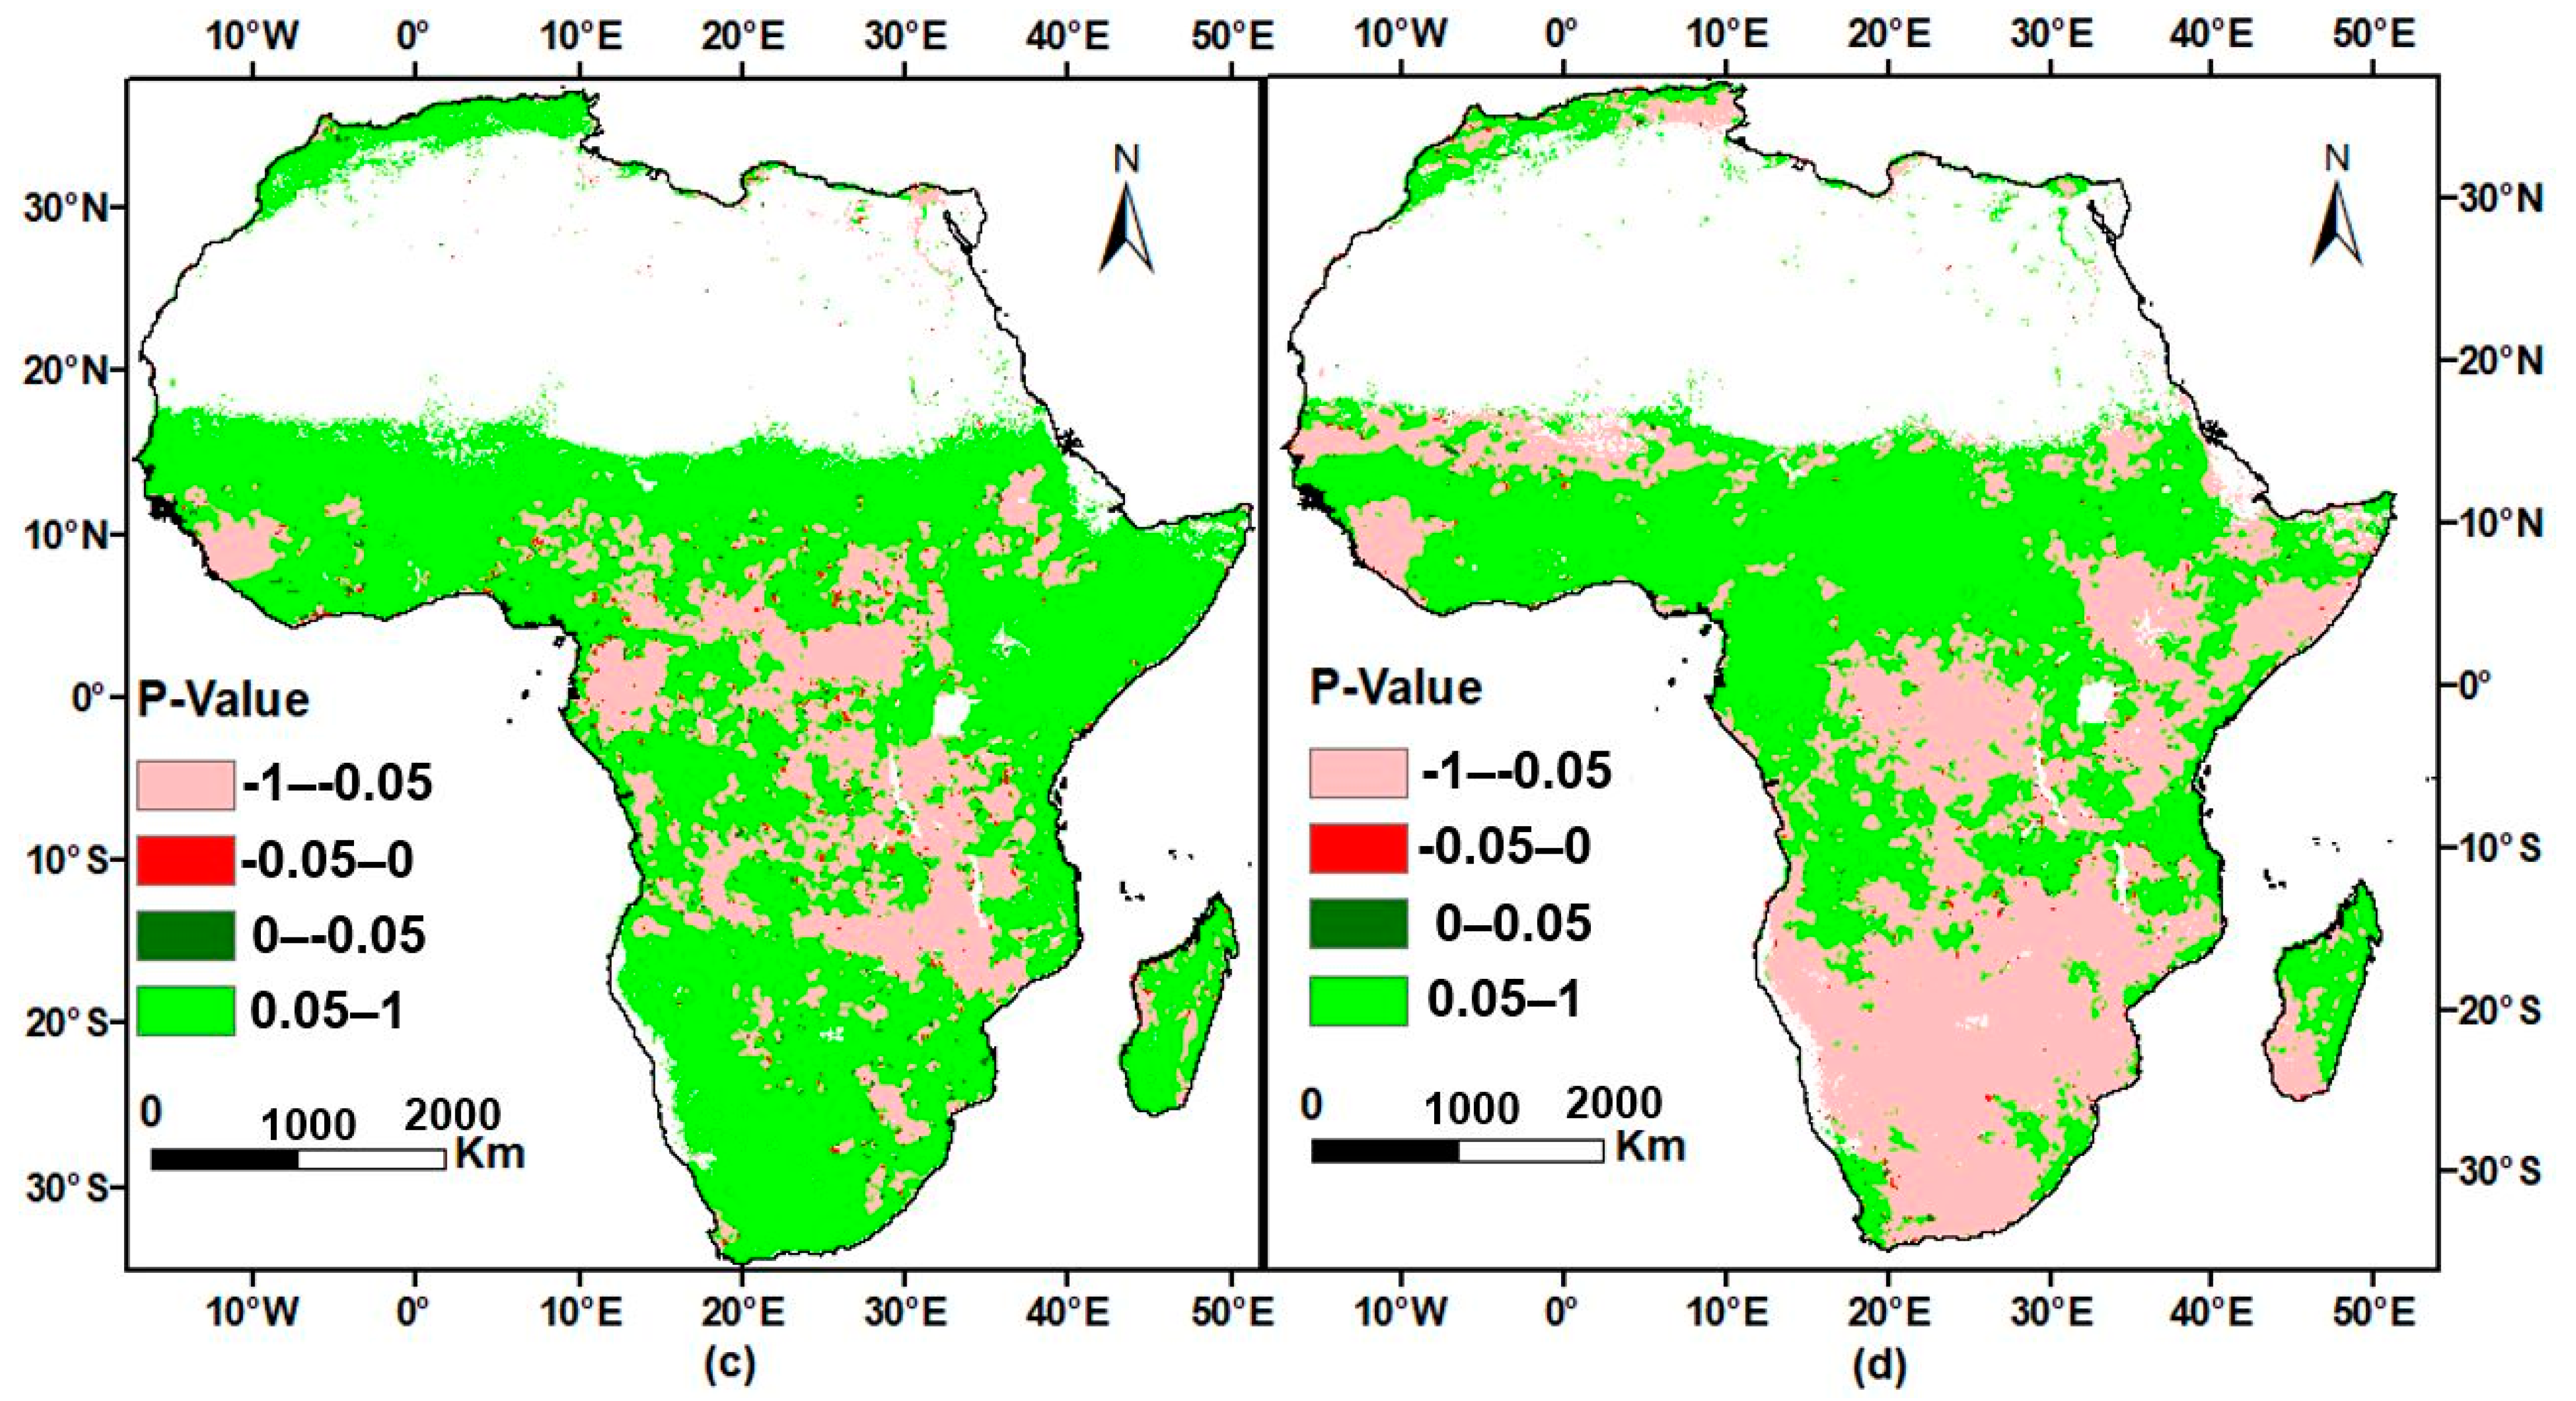
3.1. Characteristics of Trends in Vegetation Dynamics from 1982 to 2015

Based on the linear regression analysis, possible changes in average NDVI (Figure 4a,b and Figure 5a,b) over the 34 years considered by this study, revealed an upward trend in vegetation greenness across the northern part of Africa, including some portions in northern hot desert (Sahara), with an annual change up to 0.012 y−1. A significant declining trend in vegetation greenness was detected in the southern parts of central and eastern Africa, along the corridors of Angola toward southern Madagascar, with a rate as low as −0.014 y−1. In addition, vegetation in south-central tropical Africa demonstrated a mostly slight degradation and the desert area, like that in Namibia, demonstrated an increase in NDVI for some parts, especially in semi-arid zones. The overall trend of vegetation north of the equator shows an increase; however, the decreasing trends in certain areas cannot be ignored. The south part of the equator generally shows a slight degradation and stable state of vegetation. However, some strong degradation is highlighted along the line of tropical boundary from Angola to Madagascar, just around the southern part of central Africa and that of east Africa. East Africa shows a strong improvement; however, some parts in Tanzania, Kenya and Mozambique show a strong degradation.
The rate of vegetation degradation was classified into five classes, and the percentage of each of the five classes of the mean NDVI trends for the 34 years is shown in Figure 5a,b. From this, the large part of Africa shows a slight improvement, of 37% of the pixel′s area, and this number is not bigger than the stable or non-vegetated area, which is about 35.9% of the pixels. This class occupied 25.76% of stable vegetation, which tends to increase, and 10.14% of stable vegetation also tends to increase. Further, the number identified as a strong improvement was also high, at 13.4% of the pixel′s area and the number of pixels identified as a slight and significant degradation, at 11.5%, and 2%, respectively.
Table 2 shows the sequence of countries with a large area in each class of vegetation trends. Regardless of the size of each country, Angola typically experienced significant vegetation degradation to the largest surface area in all African countries, while Sudan experienced the largest strong improvement (Table 2a). For both slight degradation and slight improvement, RD Congo was ranked first. For the case of stable or non-vegetated area, the identified north desert countries were headed by Algeria, with the largest surface area.
Based on the results of the percentages of total variations in each country (Table 2b), Djibouti was identified to have experienced the most degraded vegetation, as its area of significant vegetation degradation is greater than its remaining parts, and no part of it has ever seen a strong improvement. Although Madagascar was not identified in the first five strongly degraded countries, the area from its central part to its southern part revealed a strong degradation. Furthermore, Sierra Leone and Liberia did not experience any strong degradation, but a great improvement. The island of Mauritius neither experienced a strong improvement nor a strong degradation. Further, based on the surface area of the countries, Djibouti is also the first with slight degradation, (Table 2b).

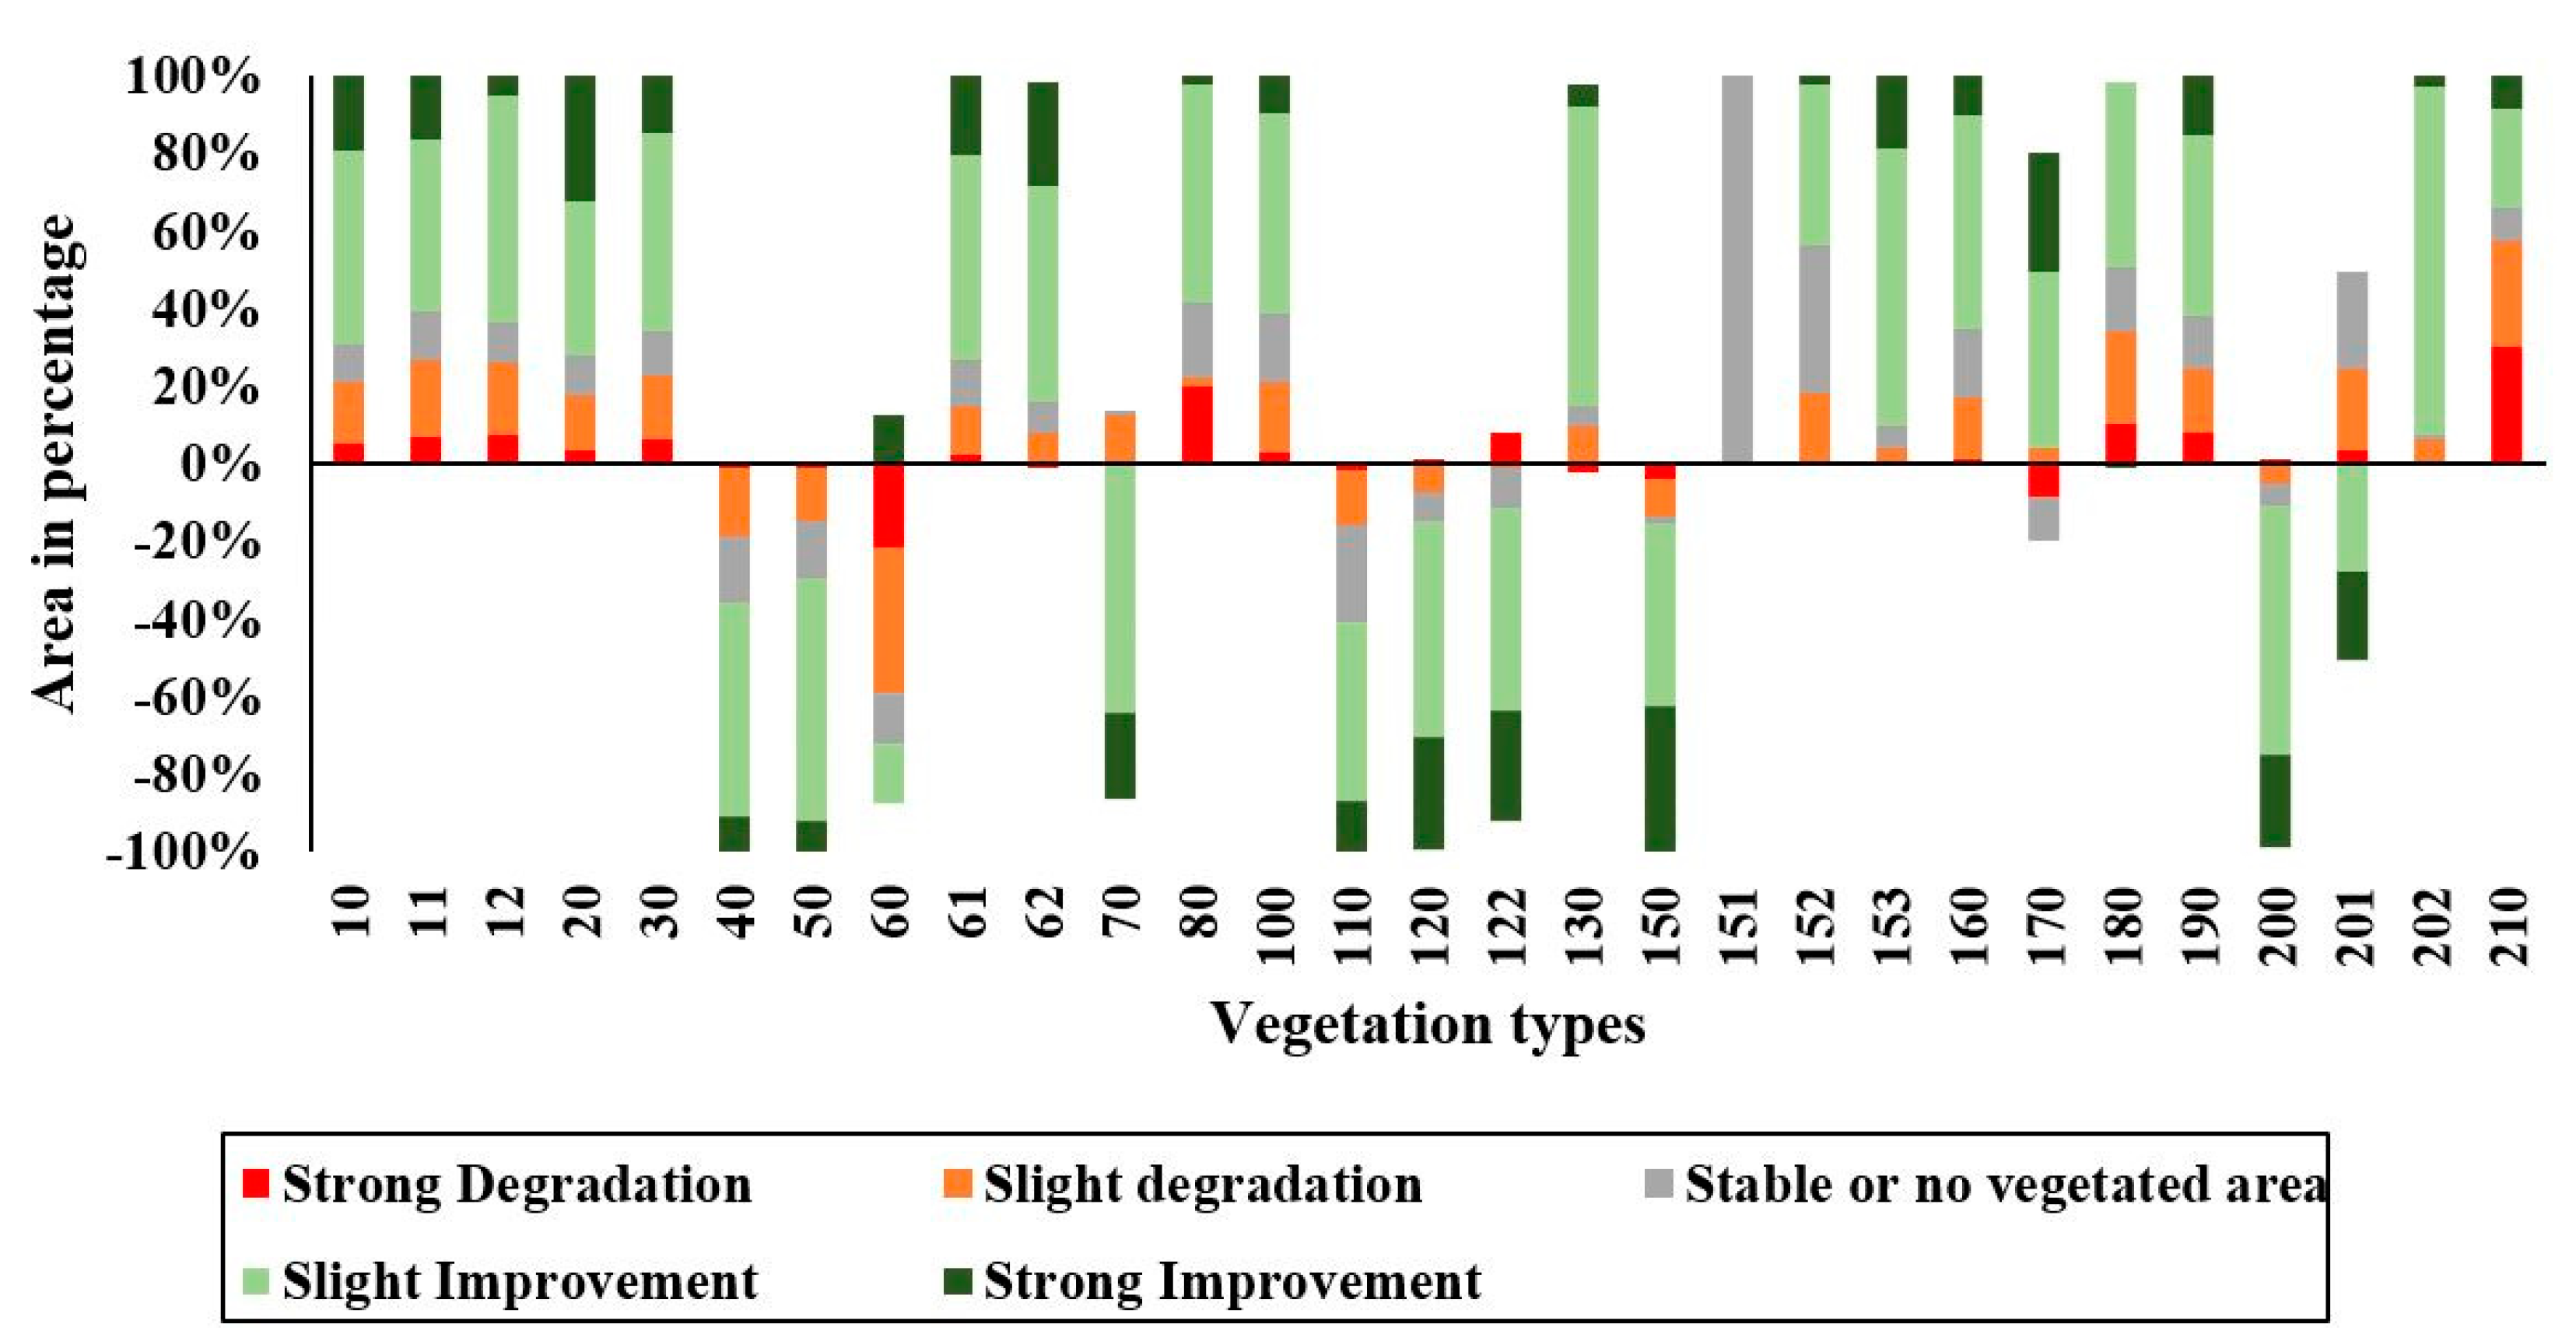
3.2. Trend Dynamics Per Vegetation Type

After assessing the rate of vegetation increase and decrease, the authors detected the areas where changes were recorded. Based on an area (in %), occupied by each vegetation type and other land cover in 1992, changes in the vegetation in this area until 2015 were calculated according to the vegetation rate resulting from NDVI trend analysis for 34 years (1982–2015). The results in Figure 6 show the vegetation fluctuation in each of the five classified vegetation trends of the annual mean NDVI from 1982 to 2015. Considering the percentage of vegetation cover changes between 1992 and 2015 for each vegetation type, the type of “Tree cover, Broadleaved, Deciduous, closed to open (>15%) (TBDCO) and Shrubland” were the most severely degraded in Africa, yet they were in the opposite classes. The TCBDCO accounted for more than 74%, 37.3%, 18.4% and 4.1% of cleared vegetations in the area that experienced strong, slight degradation, stable or non-vegetated area, and slight improvement respectively. They also increased by 8.7% in terms of strong improvement, whereas shrubland had about 63.1%, 47.2%, 30.6% and 23.5% of the cleaned vegetation of strong, slight improvement, stable or non-vegetated area and slight degradation, respectively, with a 1.1% increase in strong degradation. Figure 6 also shows that the “Mosaic natural vegetation (tree, shrub, herbaceous cover) (>50%)/cropland (<50%)” and other types of vegetation only experienced degradation in areas where NDVI had either strongly improved or strongly decreased. This is explained by the fact that their percentages are in the negative. These types of vegetation were replaced by those with an increase in such areas, such as “Herbaceous cover” and “Rainfed cropland”. All these types of ravaged vegetation cover are found in regions known for recurrent flooding, droughts, agriculture activities, logging and an increase in population. Thus, stakeholders are urged to take action on flood mitigation programs, logging and family planning, strictly for the prevention of ecosystems, using the efforts of local communities and local government.

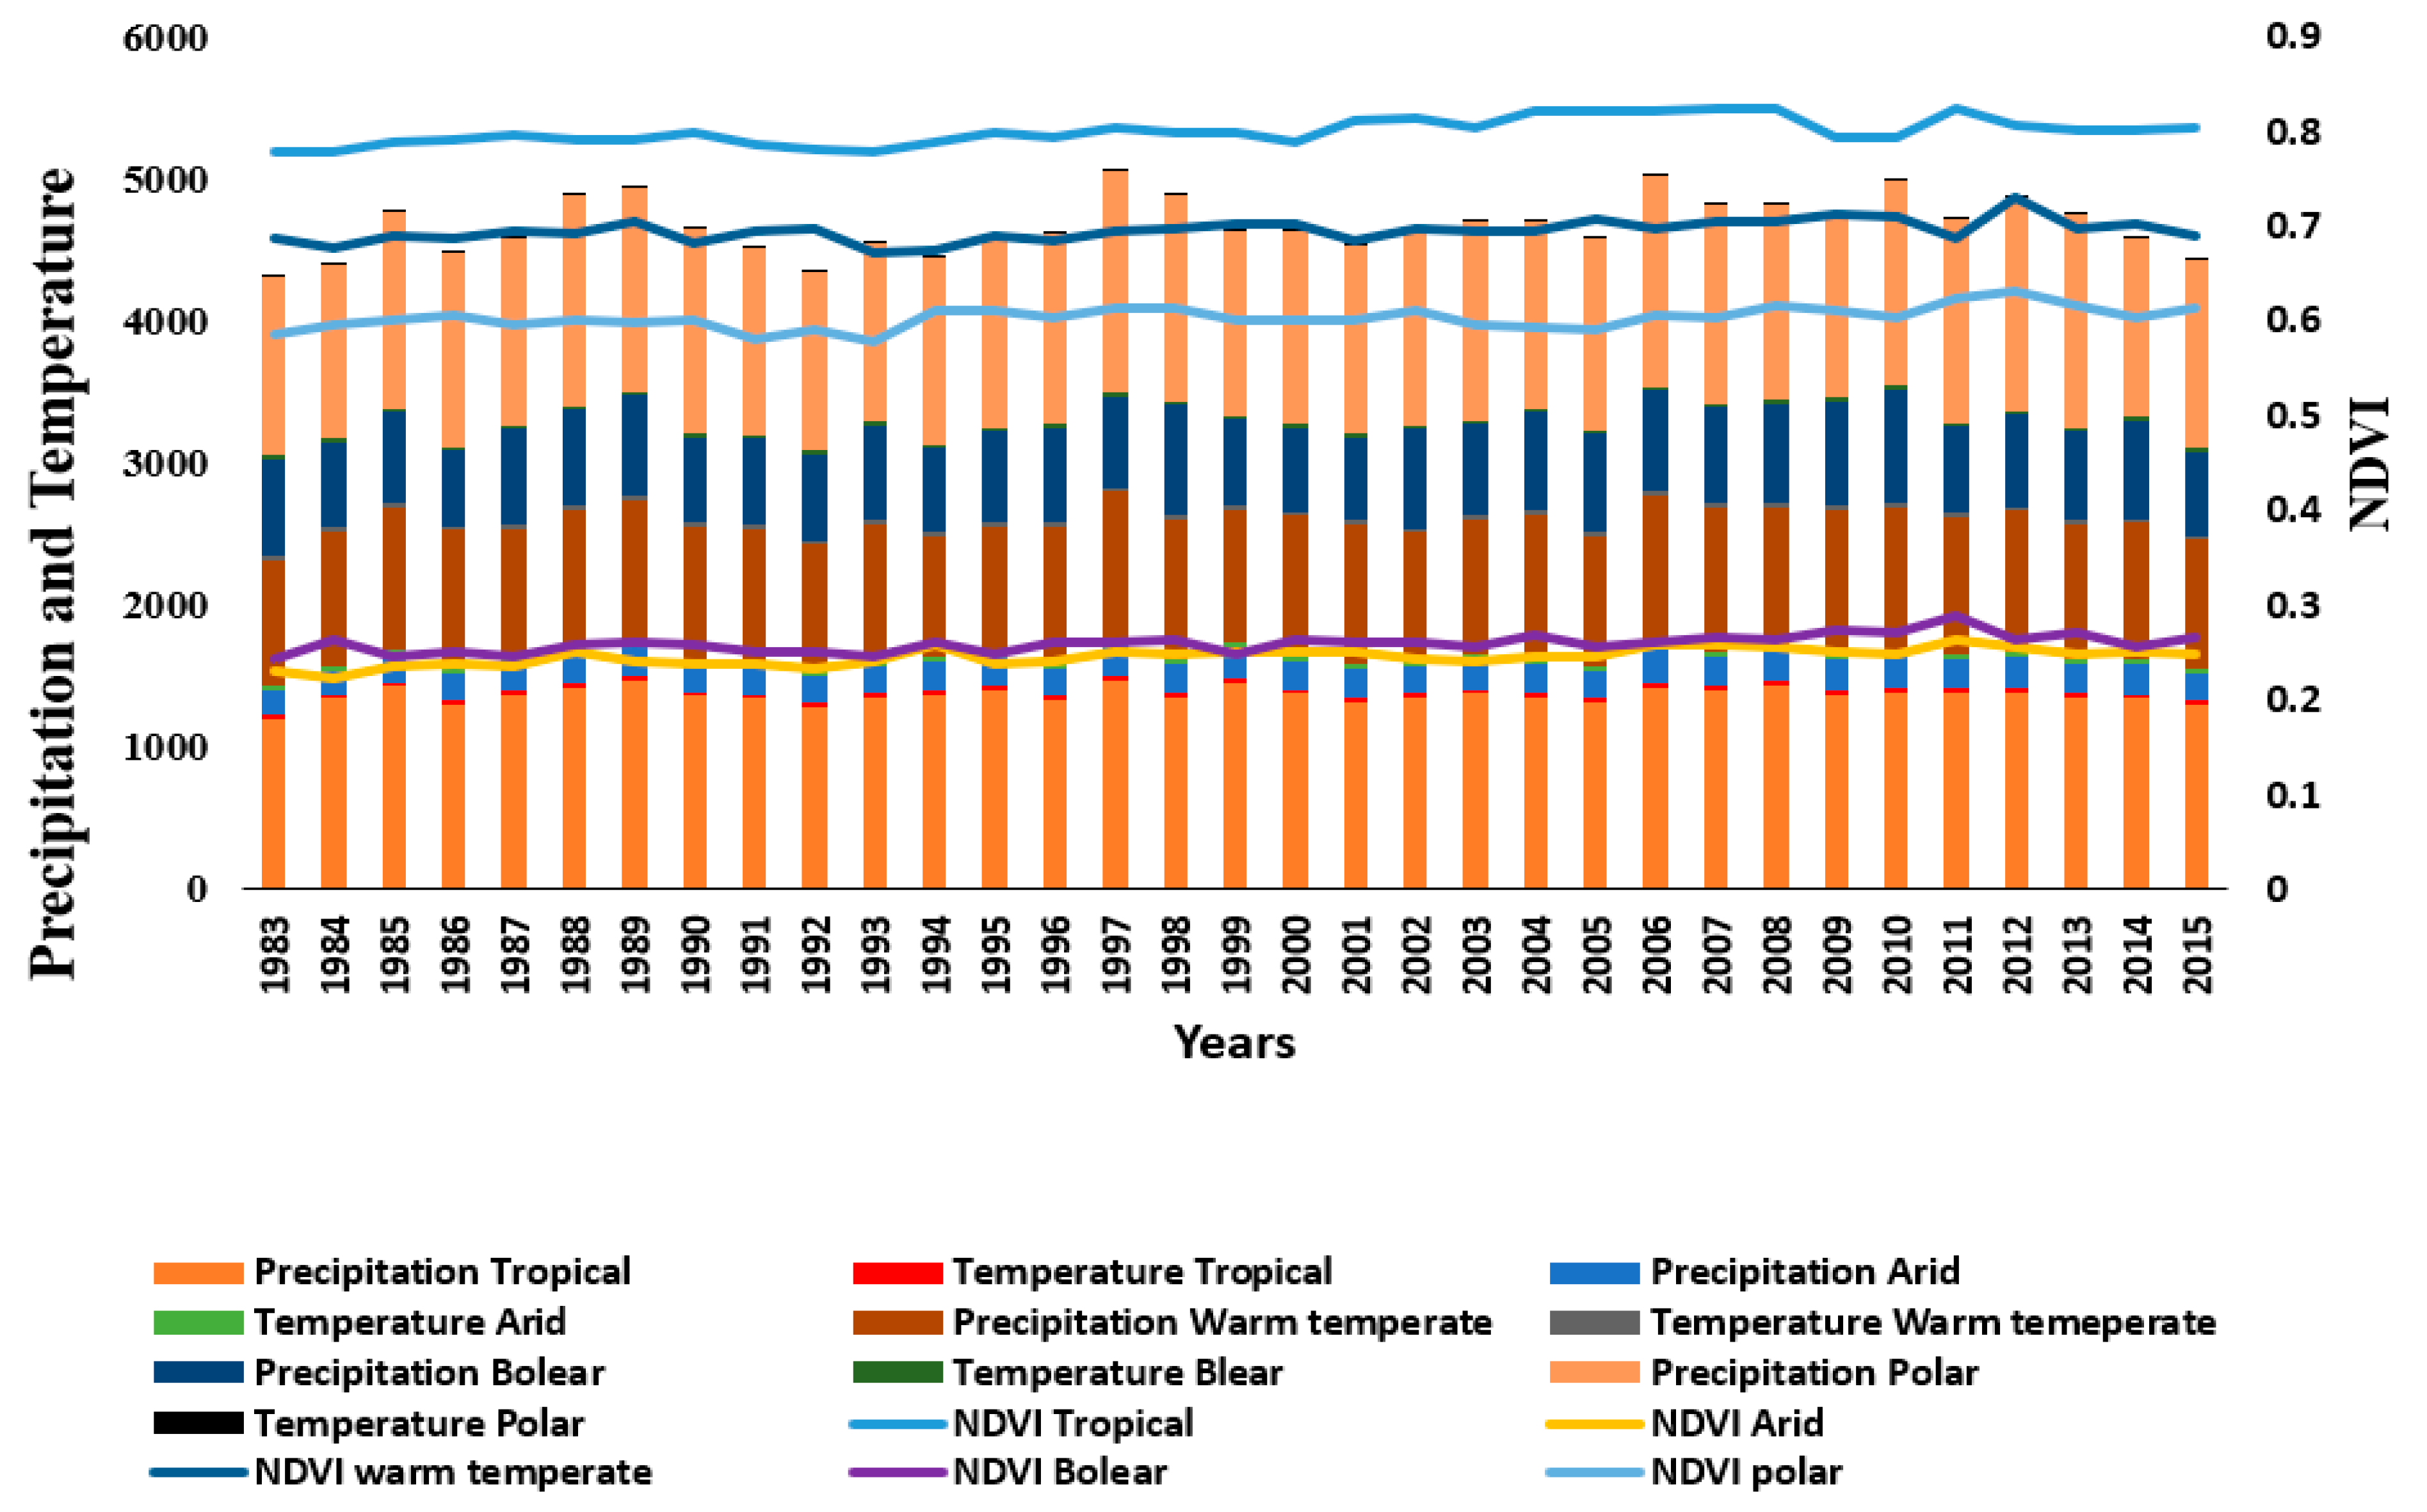
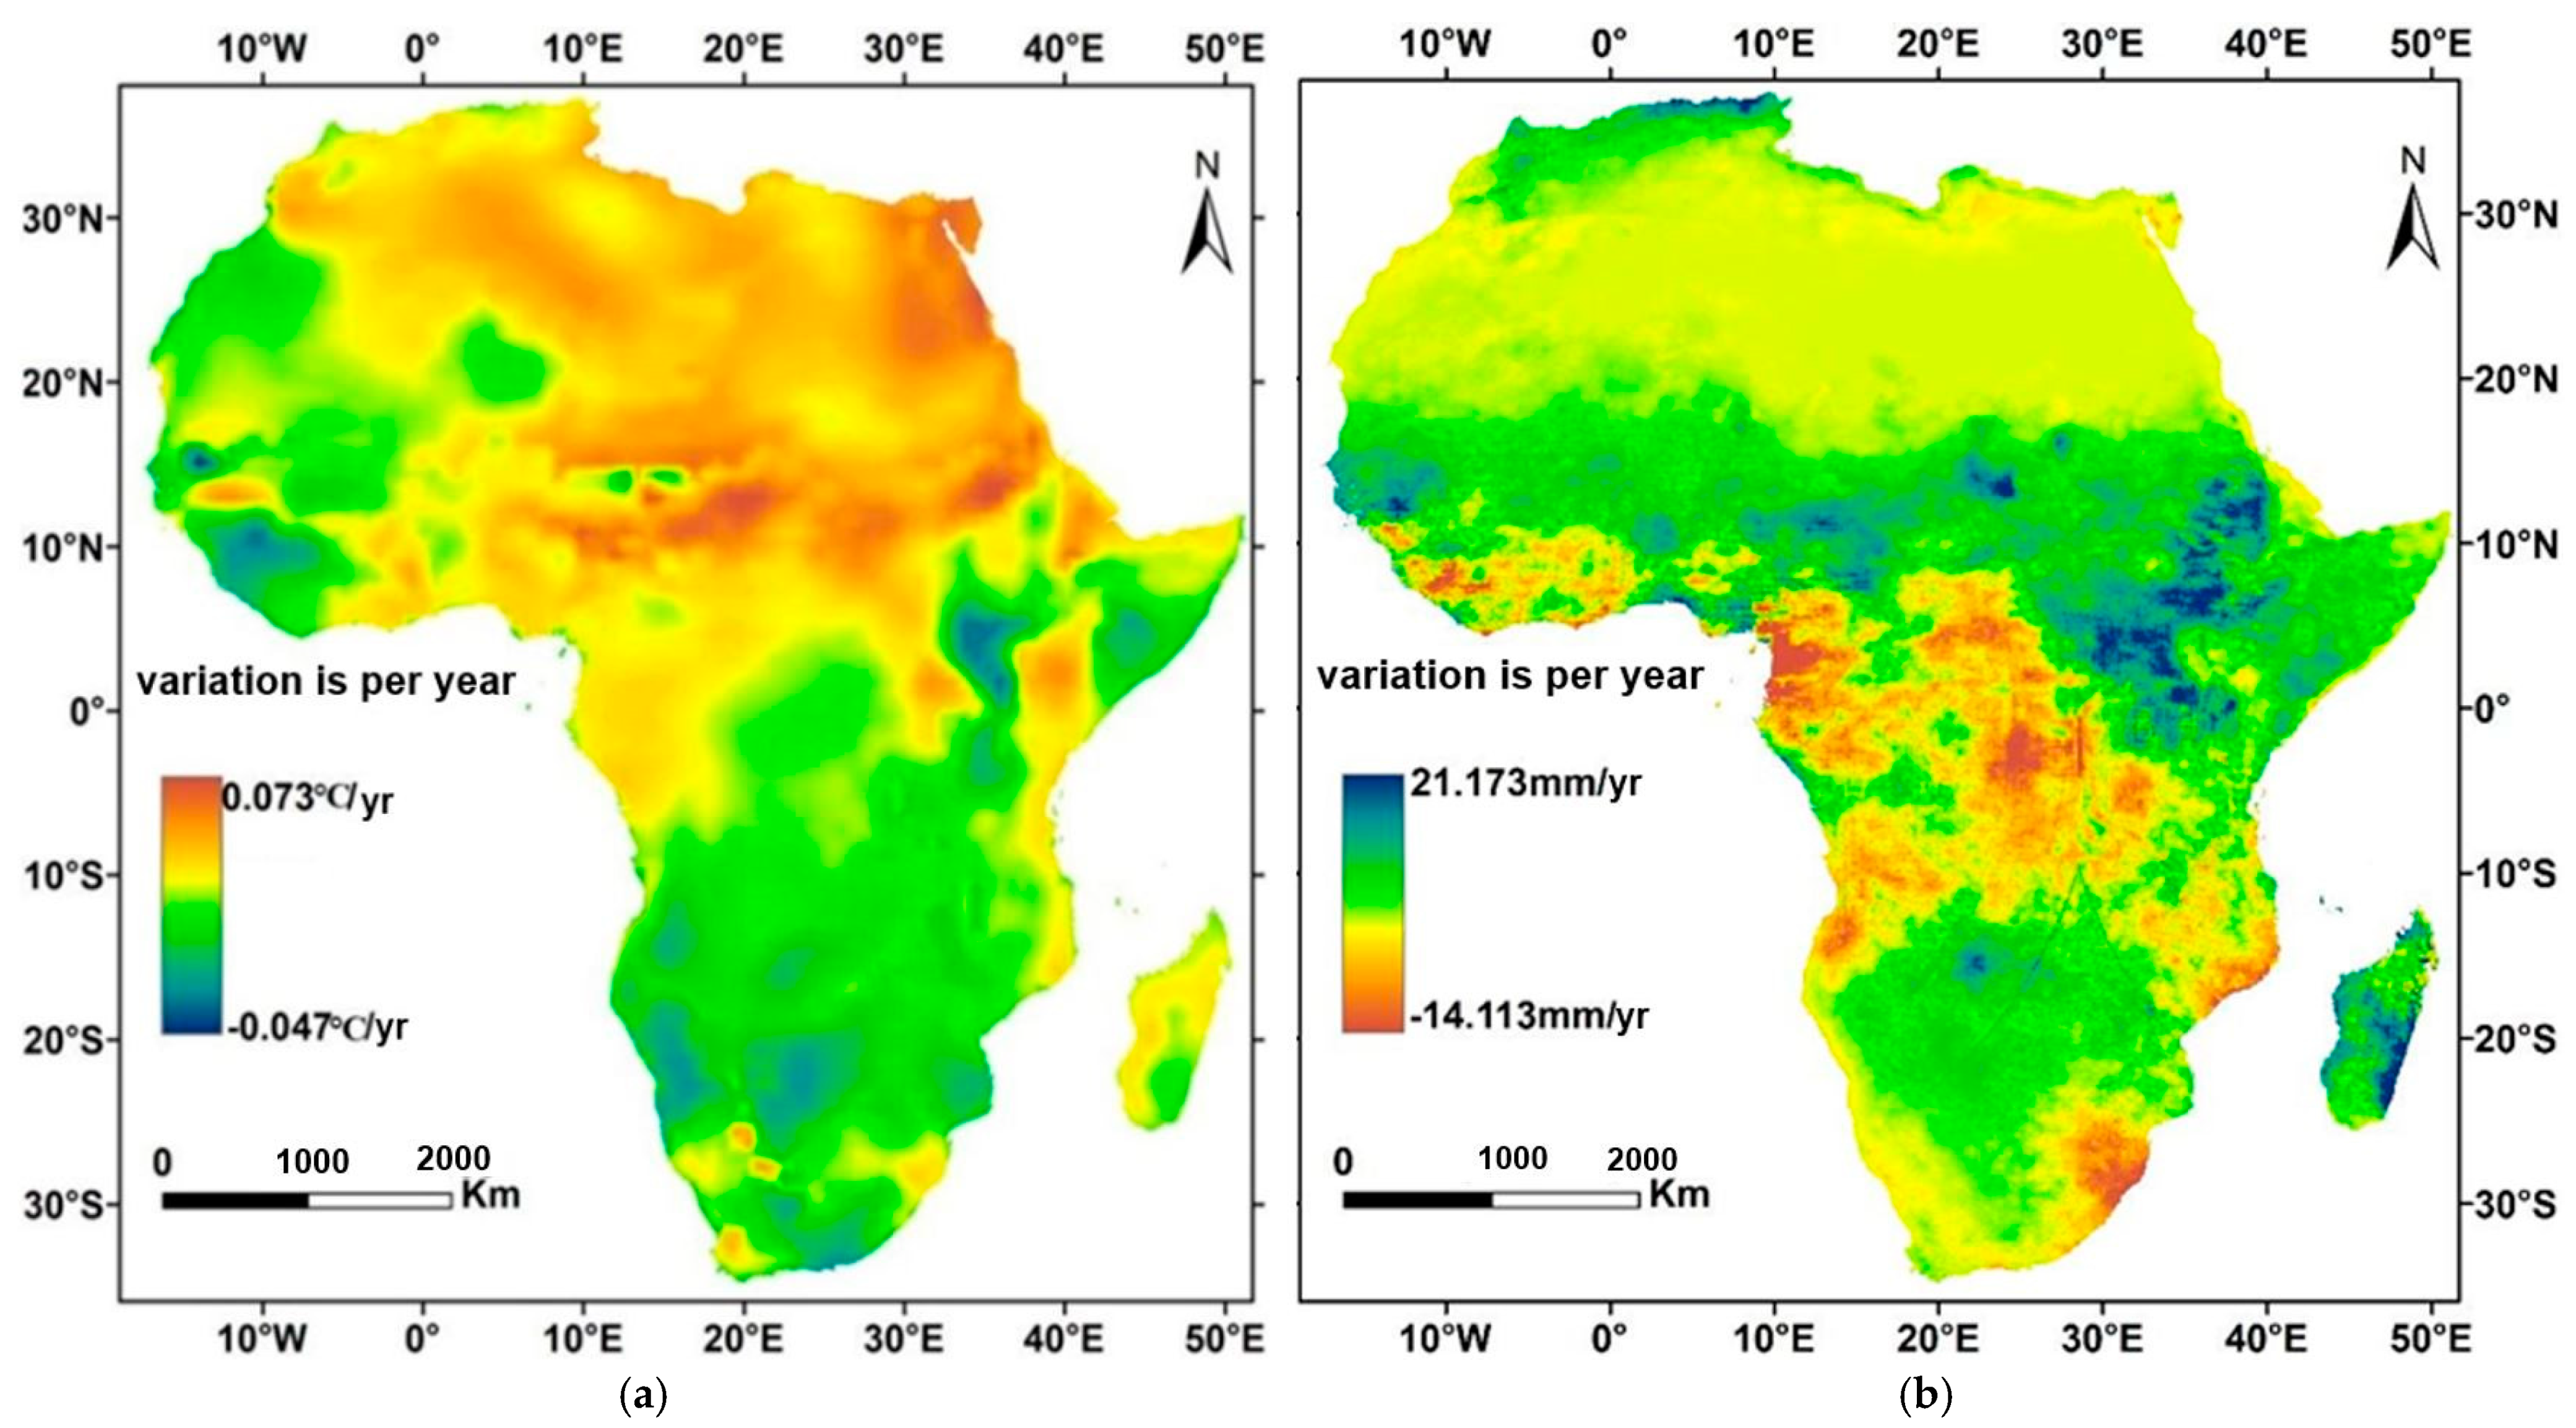
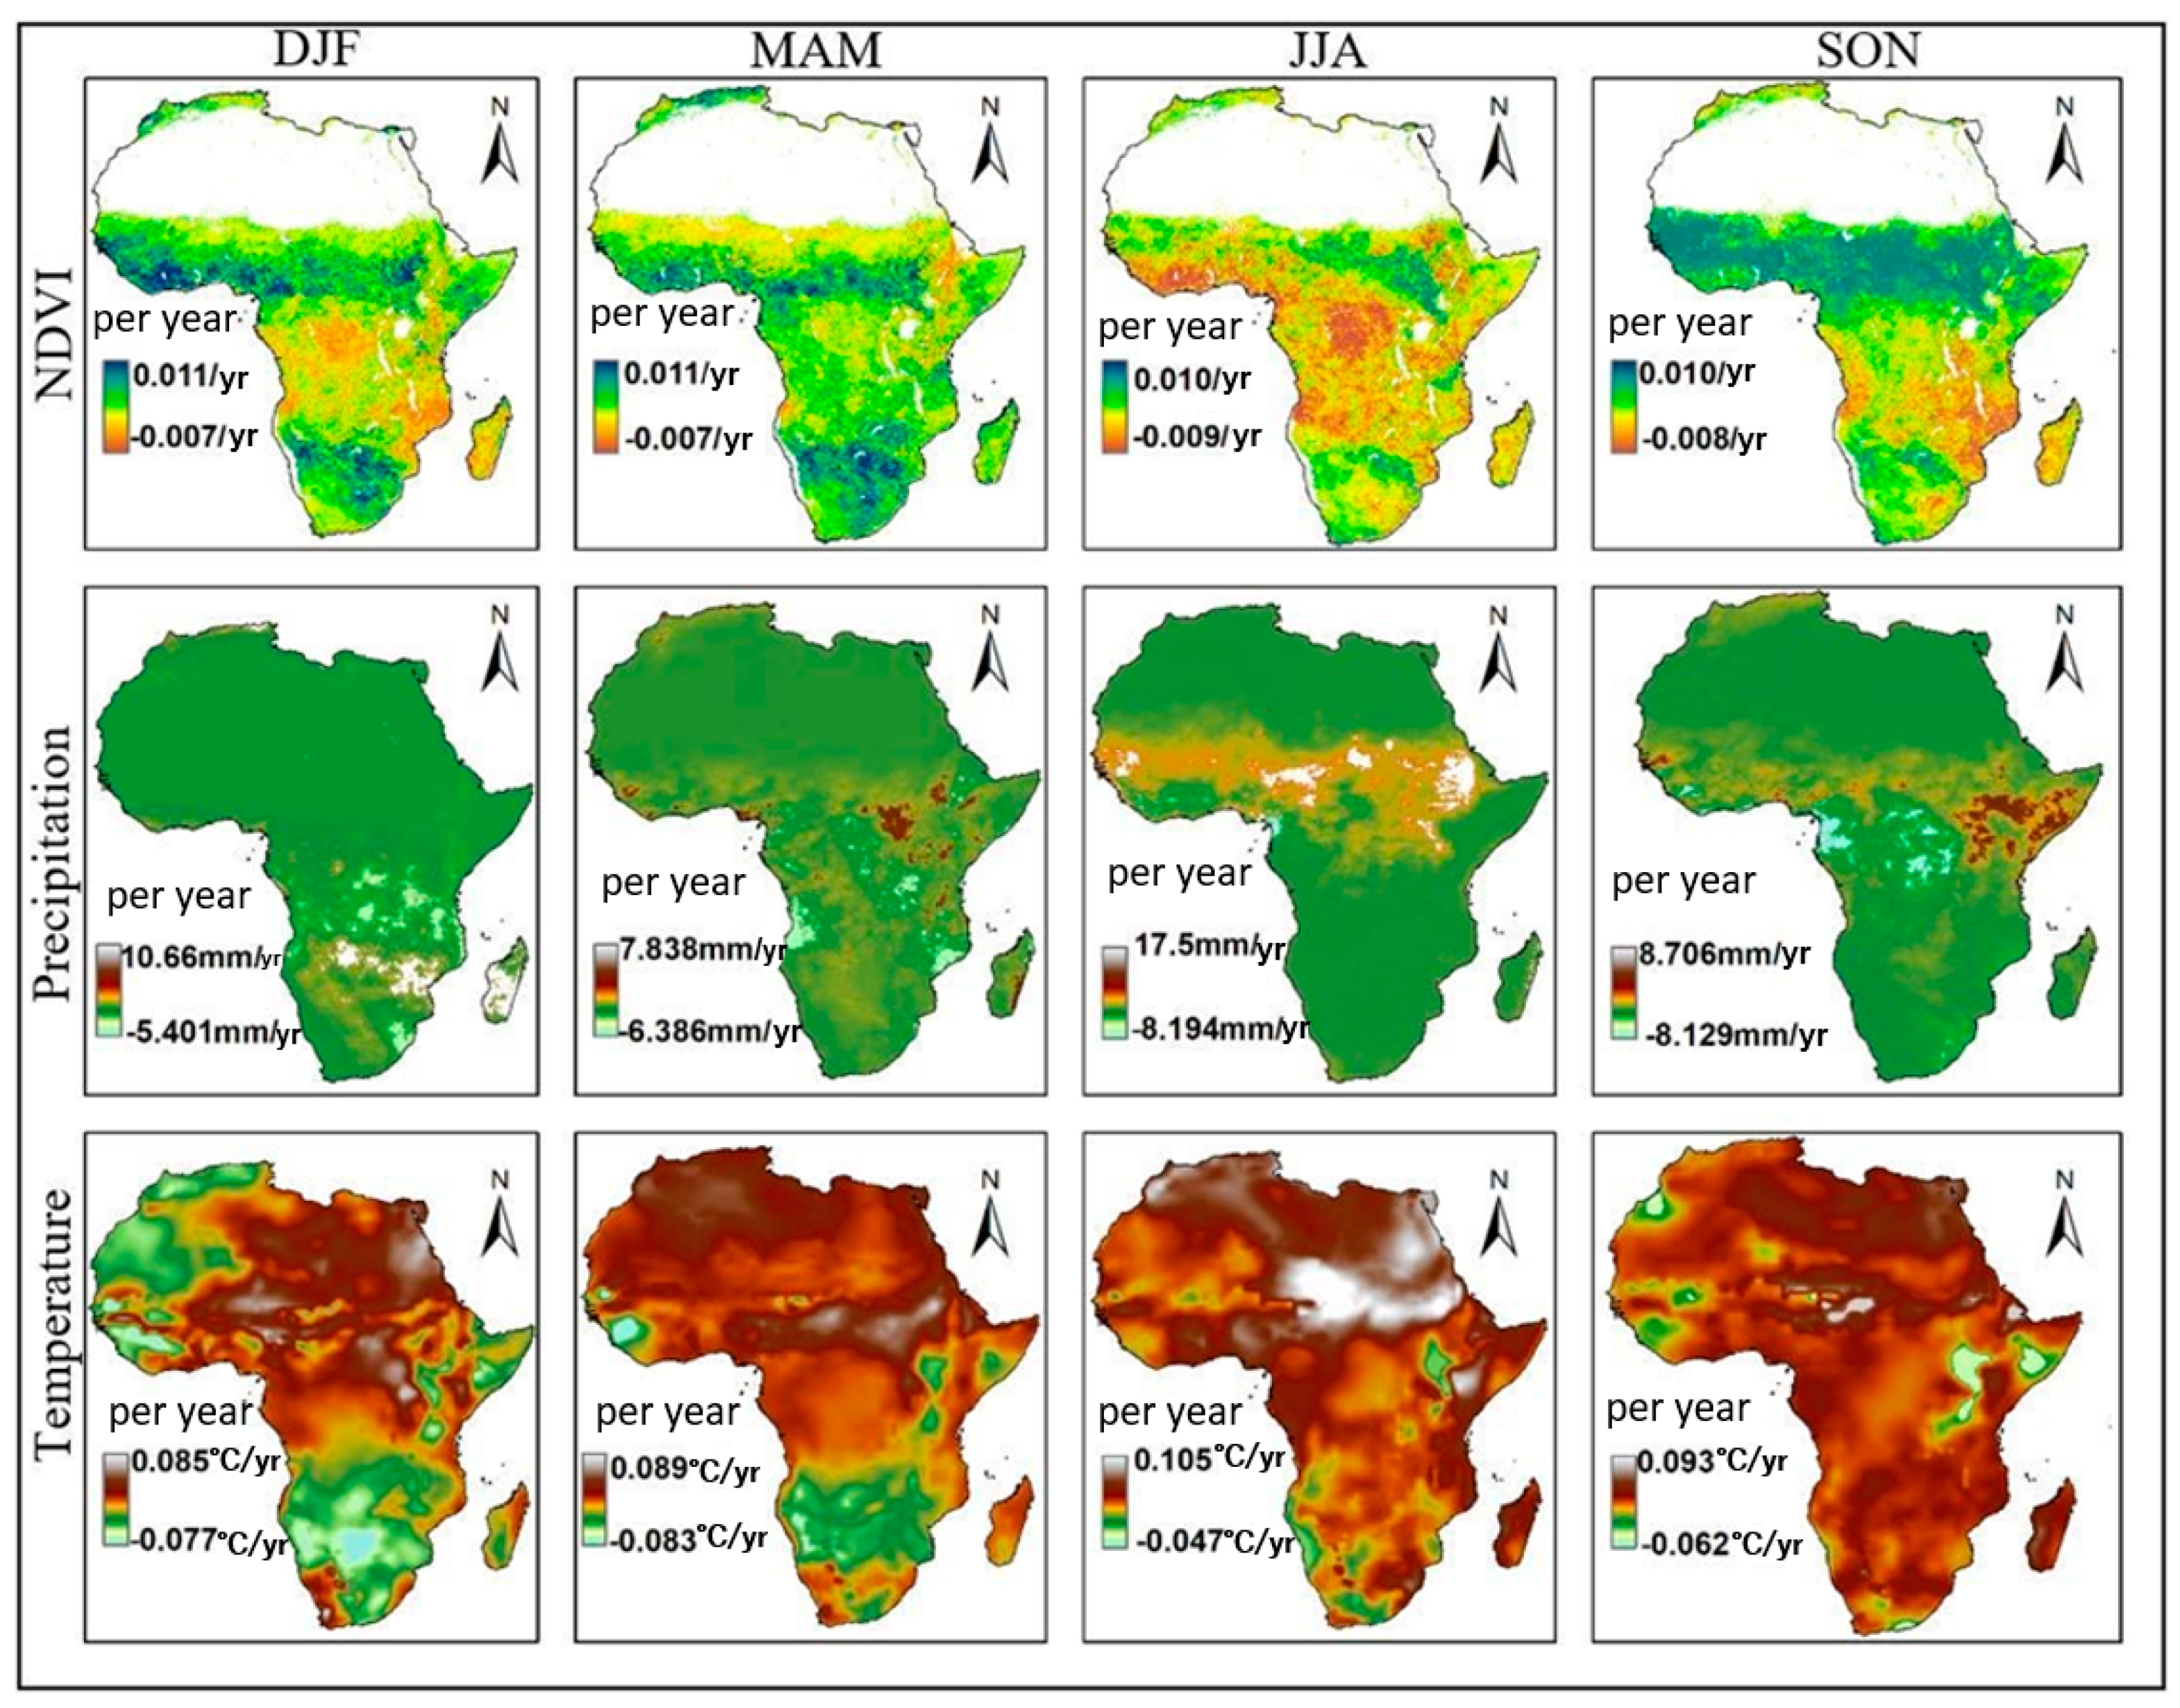
3.3. Climate Variability Trends from 1982 to 2015

Figure 7 shows the spatial distribution of annual climate change trends from 1982 to 2015. Except for the southwest Sahara, which shows a slight increase in temperature, the significant rate of increase rises up to 0.0734 °C y−1 of the temperature identified throughout the eastern Sahara Desert and strongly along the Sahel zone. Likewise, we identified a similar trend in northern Ethiopia, eastern Kenya and western Uganda. The significant decrease rate to −0.047 °C y−1 is identified in the western part of west Africa, in southeast Somalia, west Kenya and in the southern part of Africa. The eastern-north central and eastern Africa generally showed a slight decrease.
The precipitation variability during the 34 years of the study showed a significant increase at the rate of 21.17 mm y−1 in some parts, like that along the Sahel from Senegal to Ethiopia, yet did not occur in Djibouti and western part of Eritrea. This increase was seen again in the middle part of Madagascar and northern part of Tunisia, Algeria and Morocco, and in the high mountains of Ethiopia, South Sudan and northern Uganda. It further was identified in the northern and central part of southern Africa and south-central and eastern Africa. The observed significant decrease, to the rate of −14.1126 mm y−1, occurred strongly in central Africa, especially in the DR Congo, Angola, Gabon and south Cameroon. The same scenario occurred in southwestern, eastern and in east-southern Africa.
The spatial distribution of the seasonal climate and vegetation change trends from 1982 to 2015 is shown in Figure 8. The NDVI rate strongly increased in the tropical northern hemisphere and decreased in the southern hemisphere during the spring (SON) season, while the opposite trend is seen in autumn (MAM). Vegetation below the Sahel area has a strong increasing rate during summer (DJF), but was gradually reduced in autumn and increased back to the Sahel area during winter (JJA). Furthermore, central and west African vegetation strongly decreased during spring and summer, while, during winter, that in central and southwestern Africa showed a strongly increasing pattern.
The temperature reflected different spatial trends in every season, with the greatest increase generally observed in the northern part of Africa during the different seasons. During the spring season (SON), the temperature increased almost throughout the continent, with a significant increase occurring in northeast Africa, the Sahel zone and western Madagascar. The rate of change was from −0.062 to 0.093 °C y1. Even though this season does not show the greatest increase in temperature, a significant increase was displayed in most parts of Africa. However, during this season, the sub-Saharan areas are predominated by a slight increase in temperature. In summer, the temperature shows a decrease, mostly northwest of the Sahara Desert and in part of Southern Africa, while an increase occurred in central and north-west Africa. During this season, the rate of change was from −0.077 to 0.085 °C y−1.
Further, during the autumn (MAM), the temperature continued to decrease, mostly in the sub-Sahara, especially in the high mountains, while an increase is recorded north of the Sahara, precisely along Sahel, and in Algeria, Tunisia and Morocco. The winter (JJA) shows a wide area of decrease in temperature; however, its rate of decrease (−0.047 °C y−1) is very small compared to rest of the three seasons and it possesses the biggest rate of increase (0.105 °C y−1). While most parts of the continent show a decrease in temperature, central-western Sahel has a strong increase.
Although temperature and precipitation are recorded differently over the seasons, they both seem to be similar in some areas. In winter (JJA), precipitation occurred in a very small part of Africa, with a significant rate of both increase and decrease (17.5 and −8.194 mm y−1, respectively). This precipitation increases only in areas below the Sahel line and the Equator, especially in the high mountains of Ethiopia. It is in the same season that, especially in the West African countries bordering the ocean from Guinea Bissau to Gabon, a significant decrease in precipitation is also observed. These rates of change continue spreading in the spring, especially eastward. The rate of increase is strong in the Horn of Africa, and a sharp decline spreads strongly throughout Central Africa, particularly in Cameroon, Gabon, Democratic Republic of the Congo and the Central Africa Republic.
In summer (DJF), the rate of increase in precipitation over the 34 years in this study was observed only in the southern part of Africa, with a rate of 10.658 mm y−1. The significant increases turned out to be the continuation of spring (SON) in the southeast direction. It is in this season that a small rate of decrease in precipitation (−5.401 mm y−1) was observed. Central African countries generally have a problem of reduced rainfall occurrence in all seasons, except in autumn (March to May), where some of its parts experience an increase in rainfall. This is consistent with the apparent decrease in vegetation and the increase in temperature in this region.

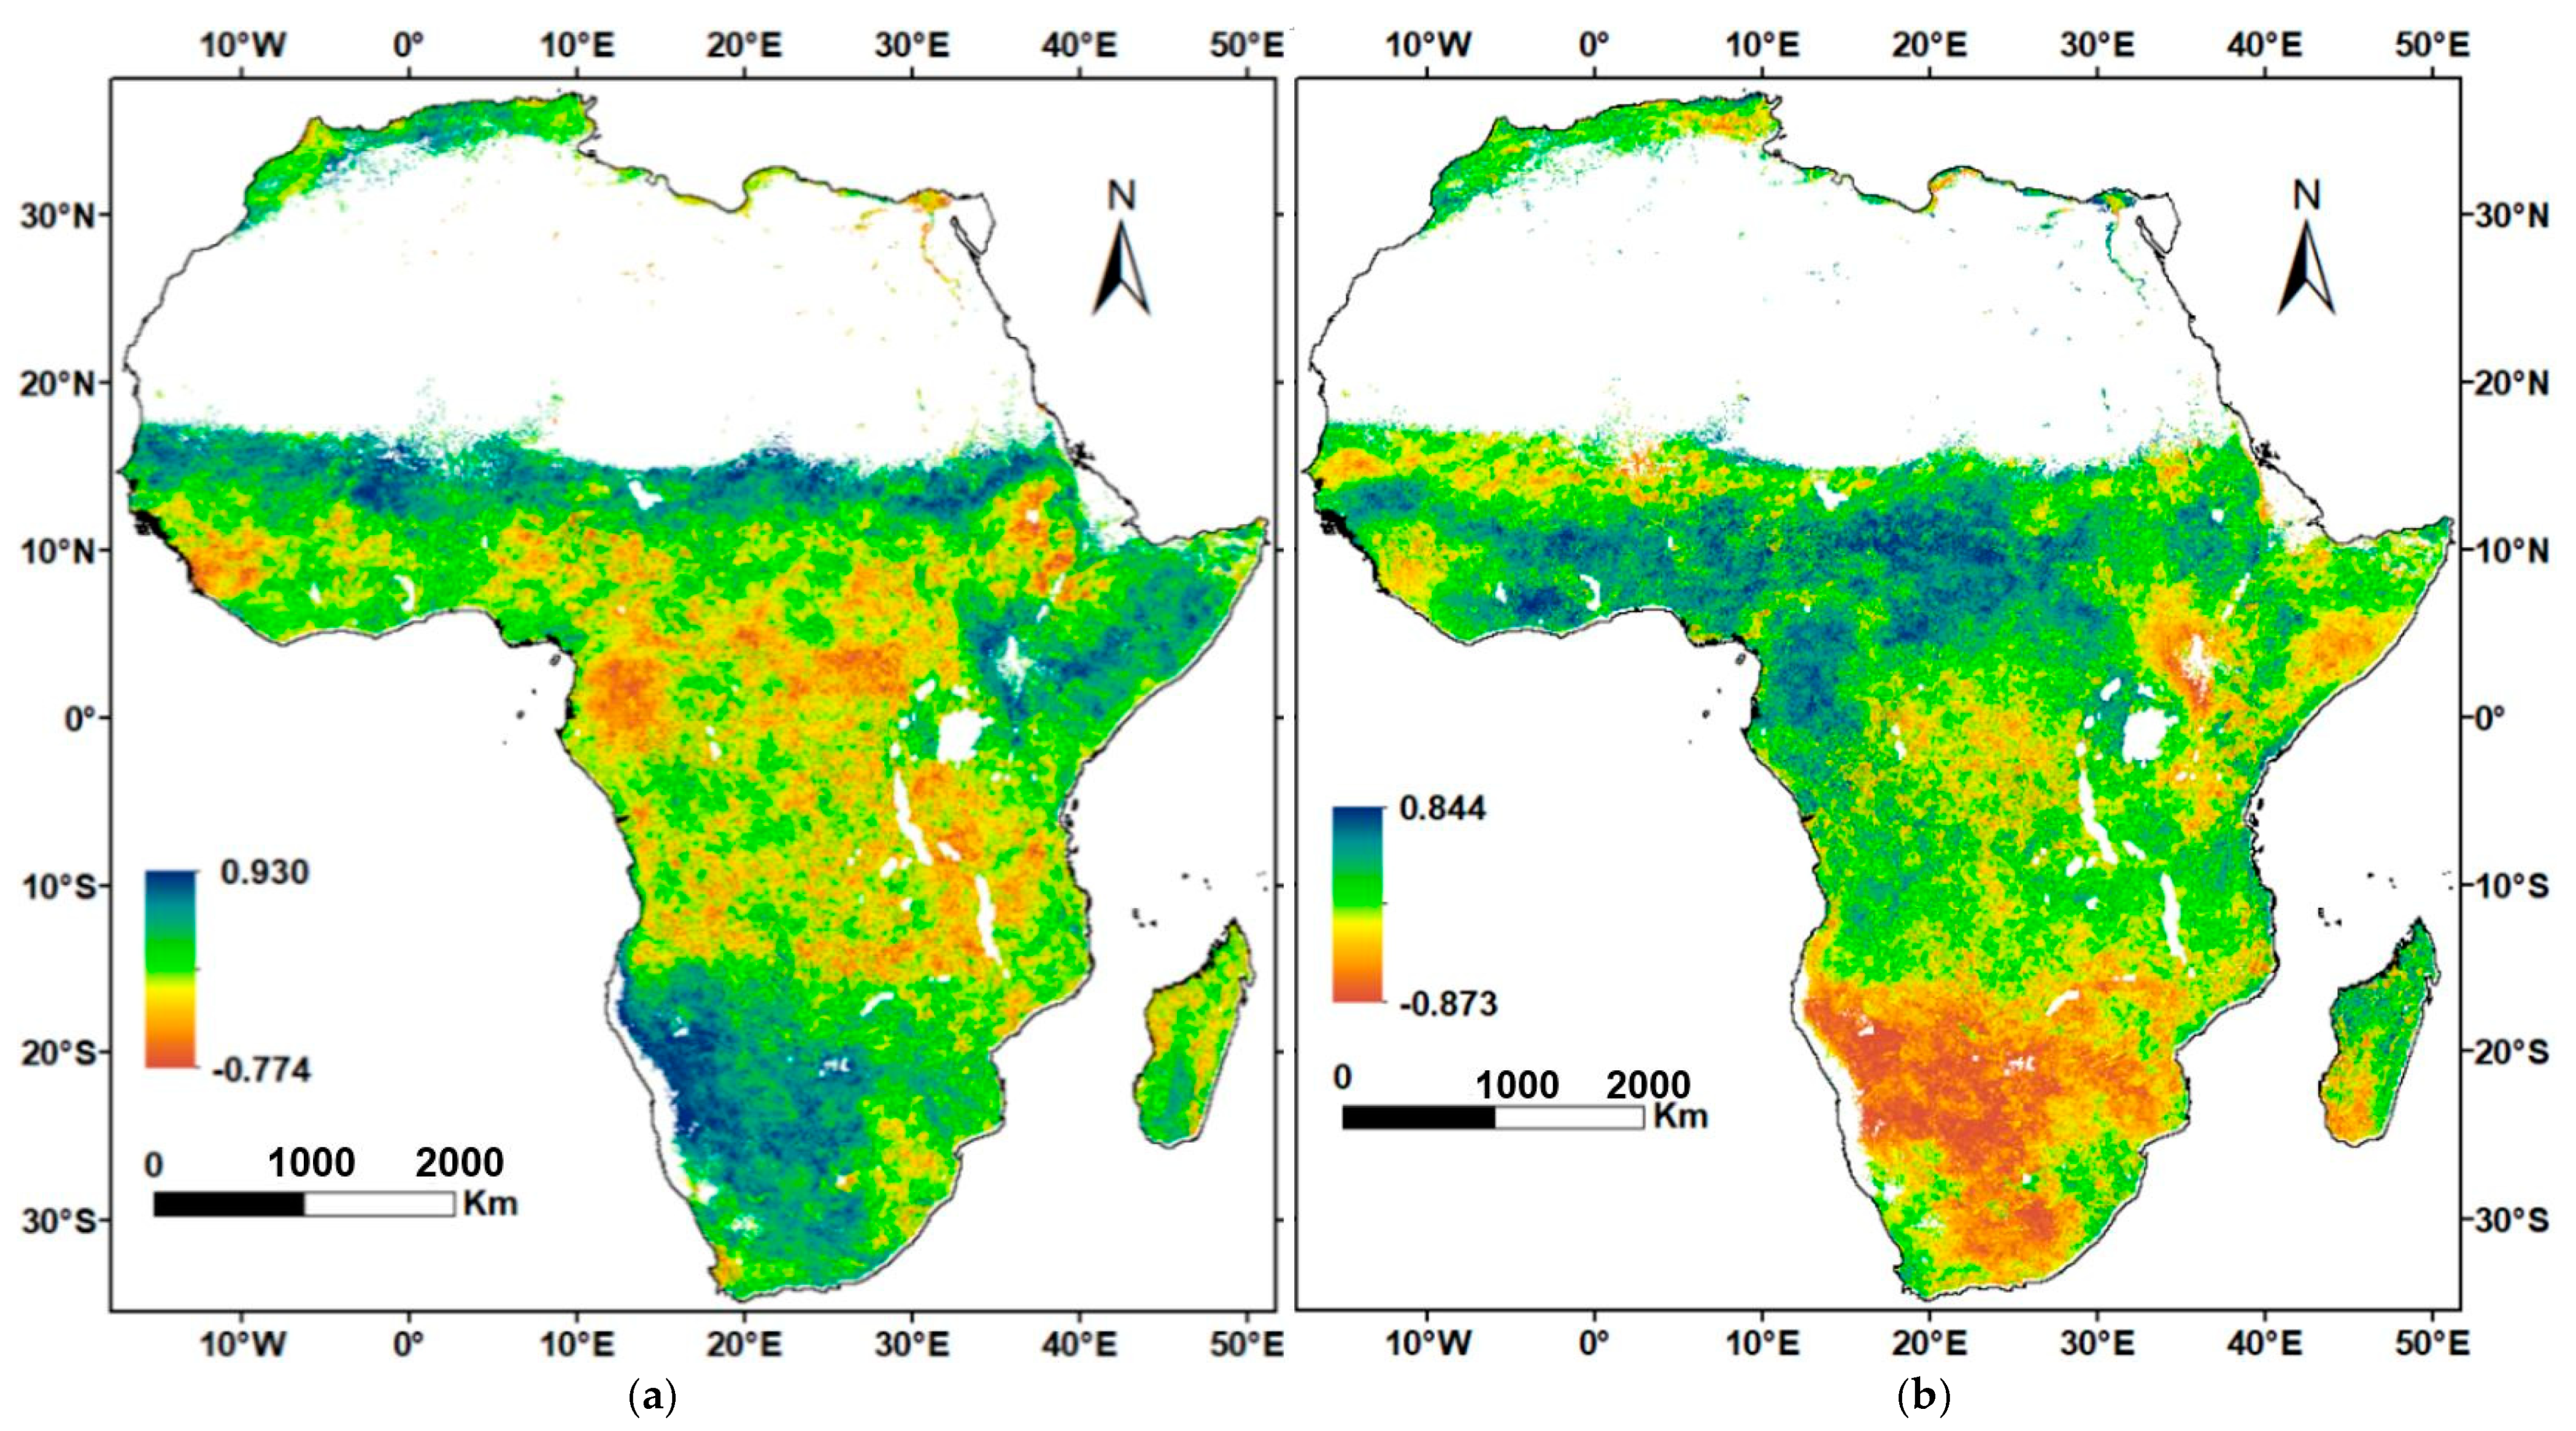
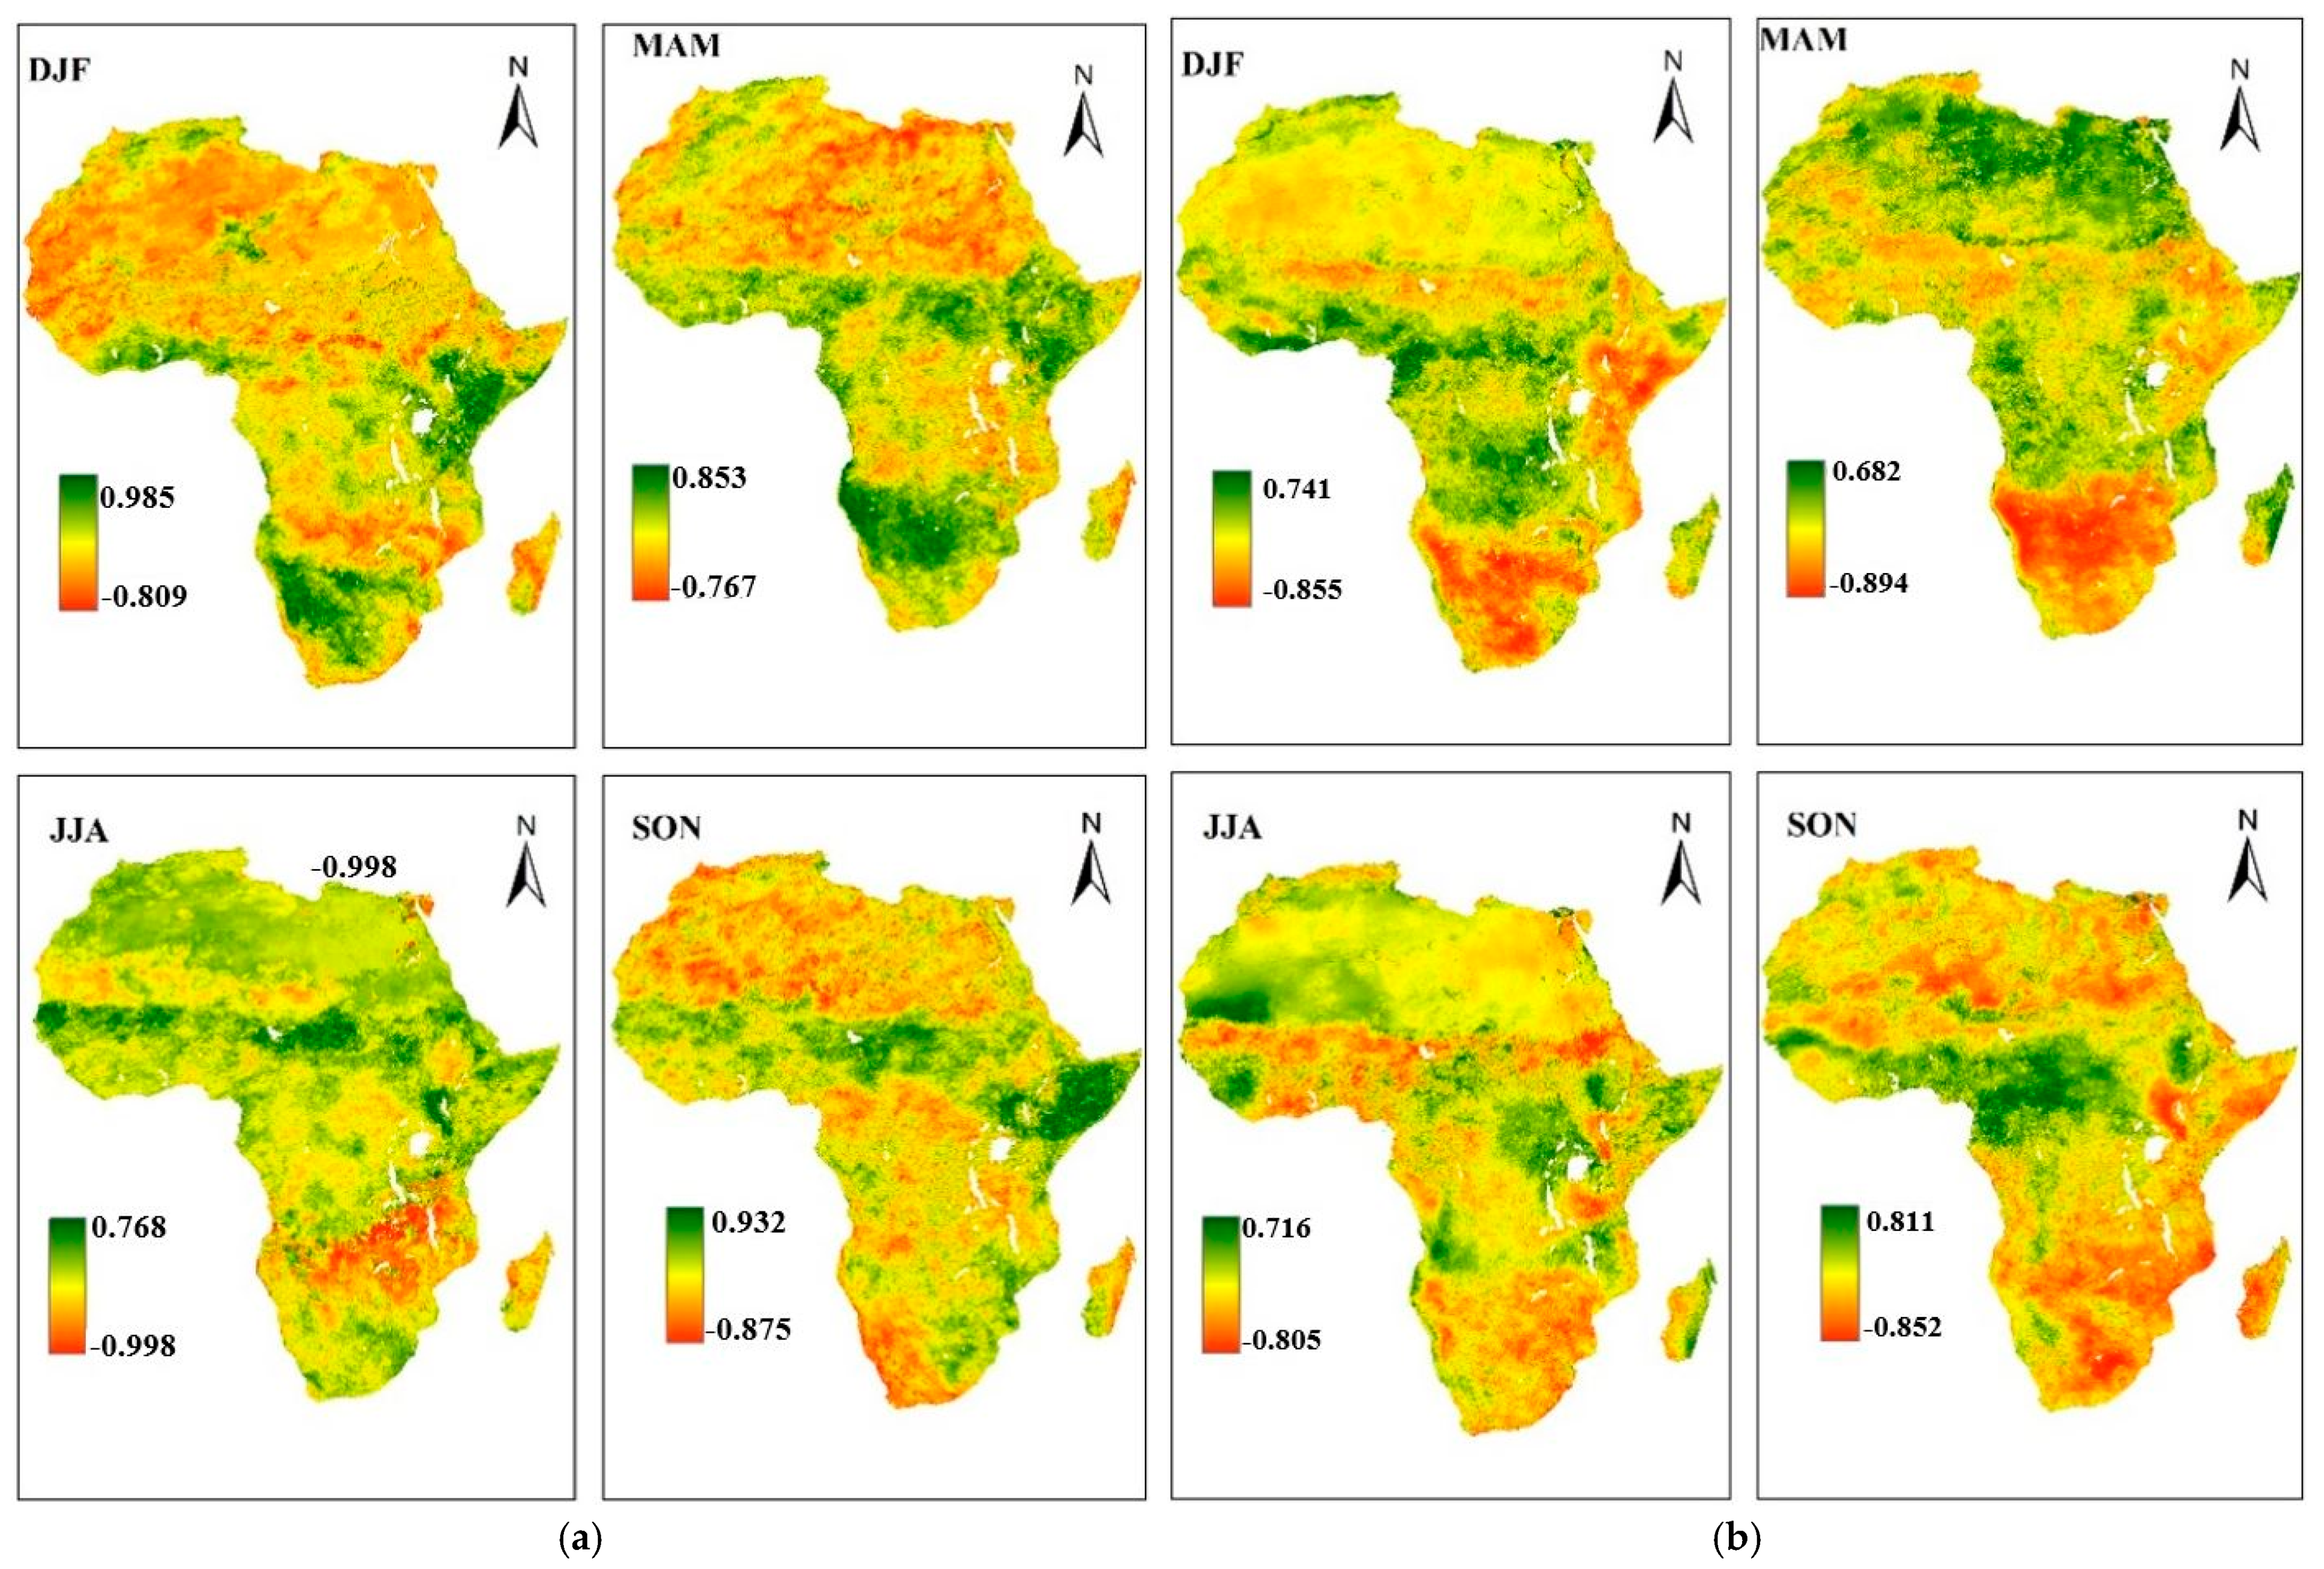
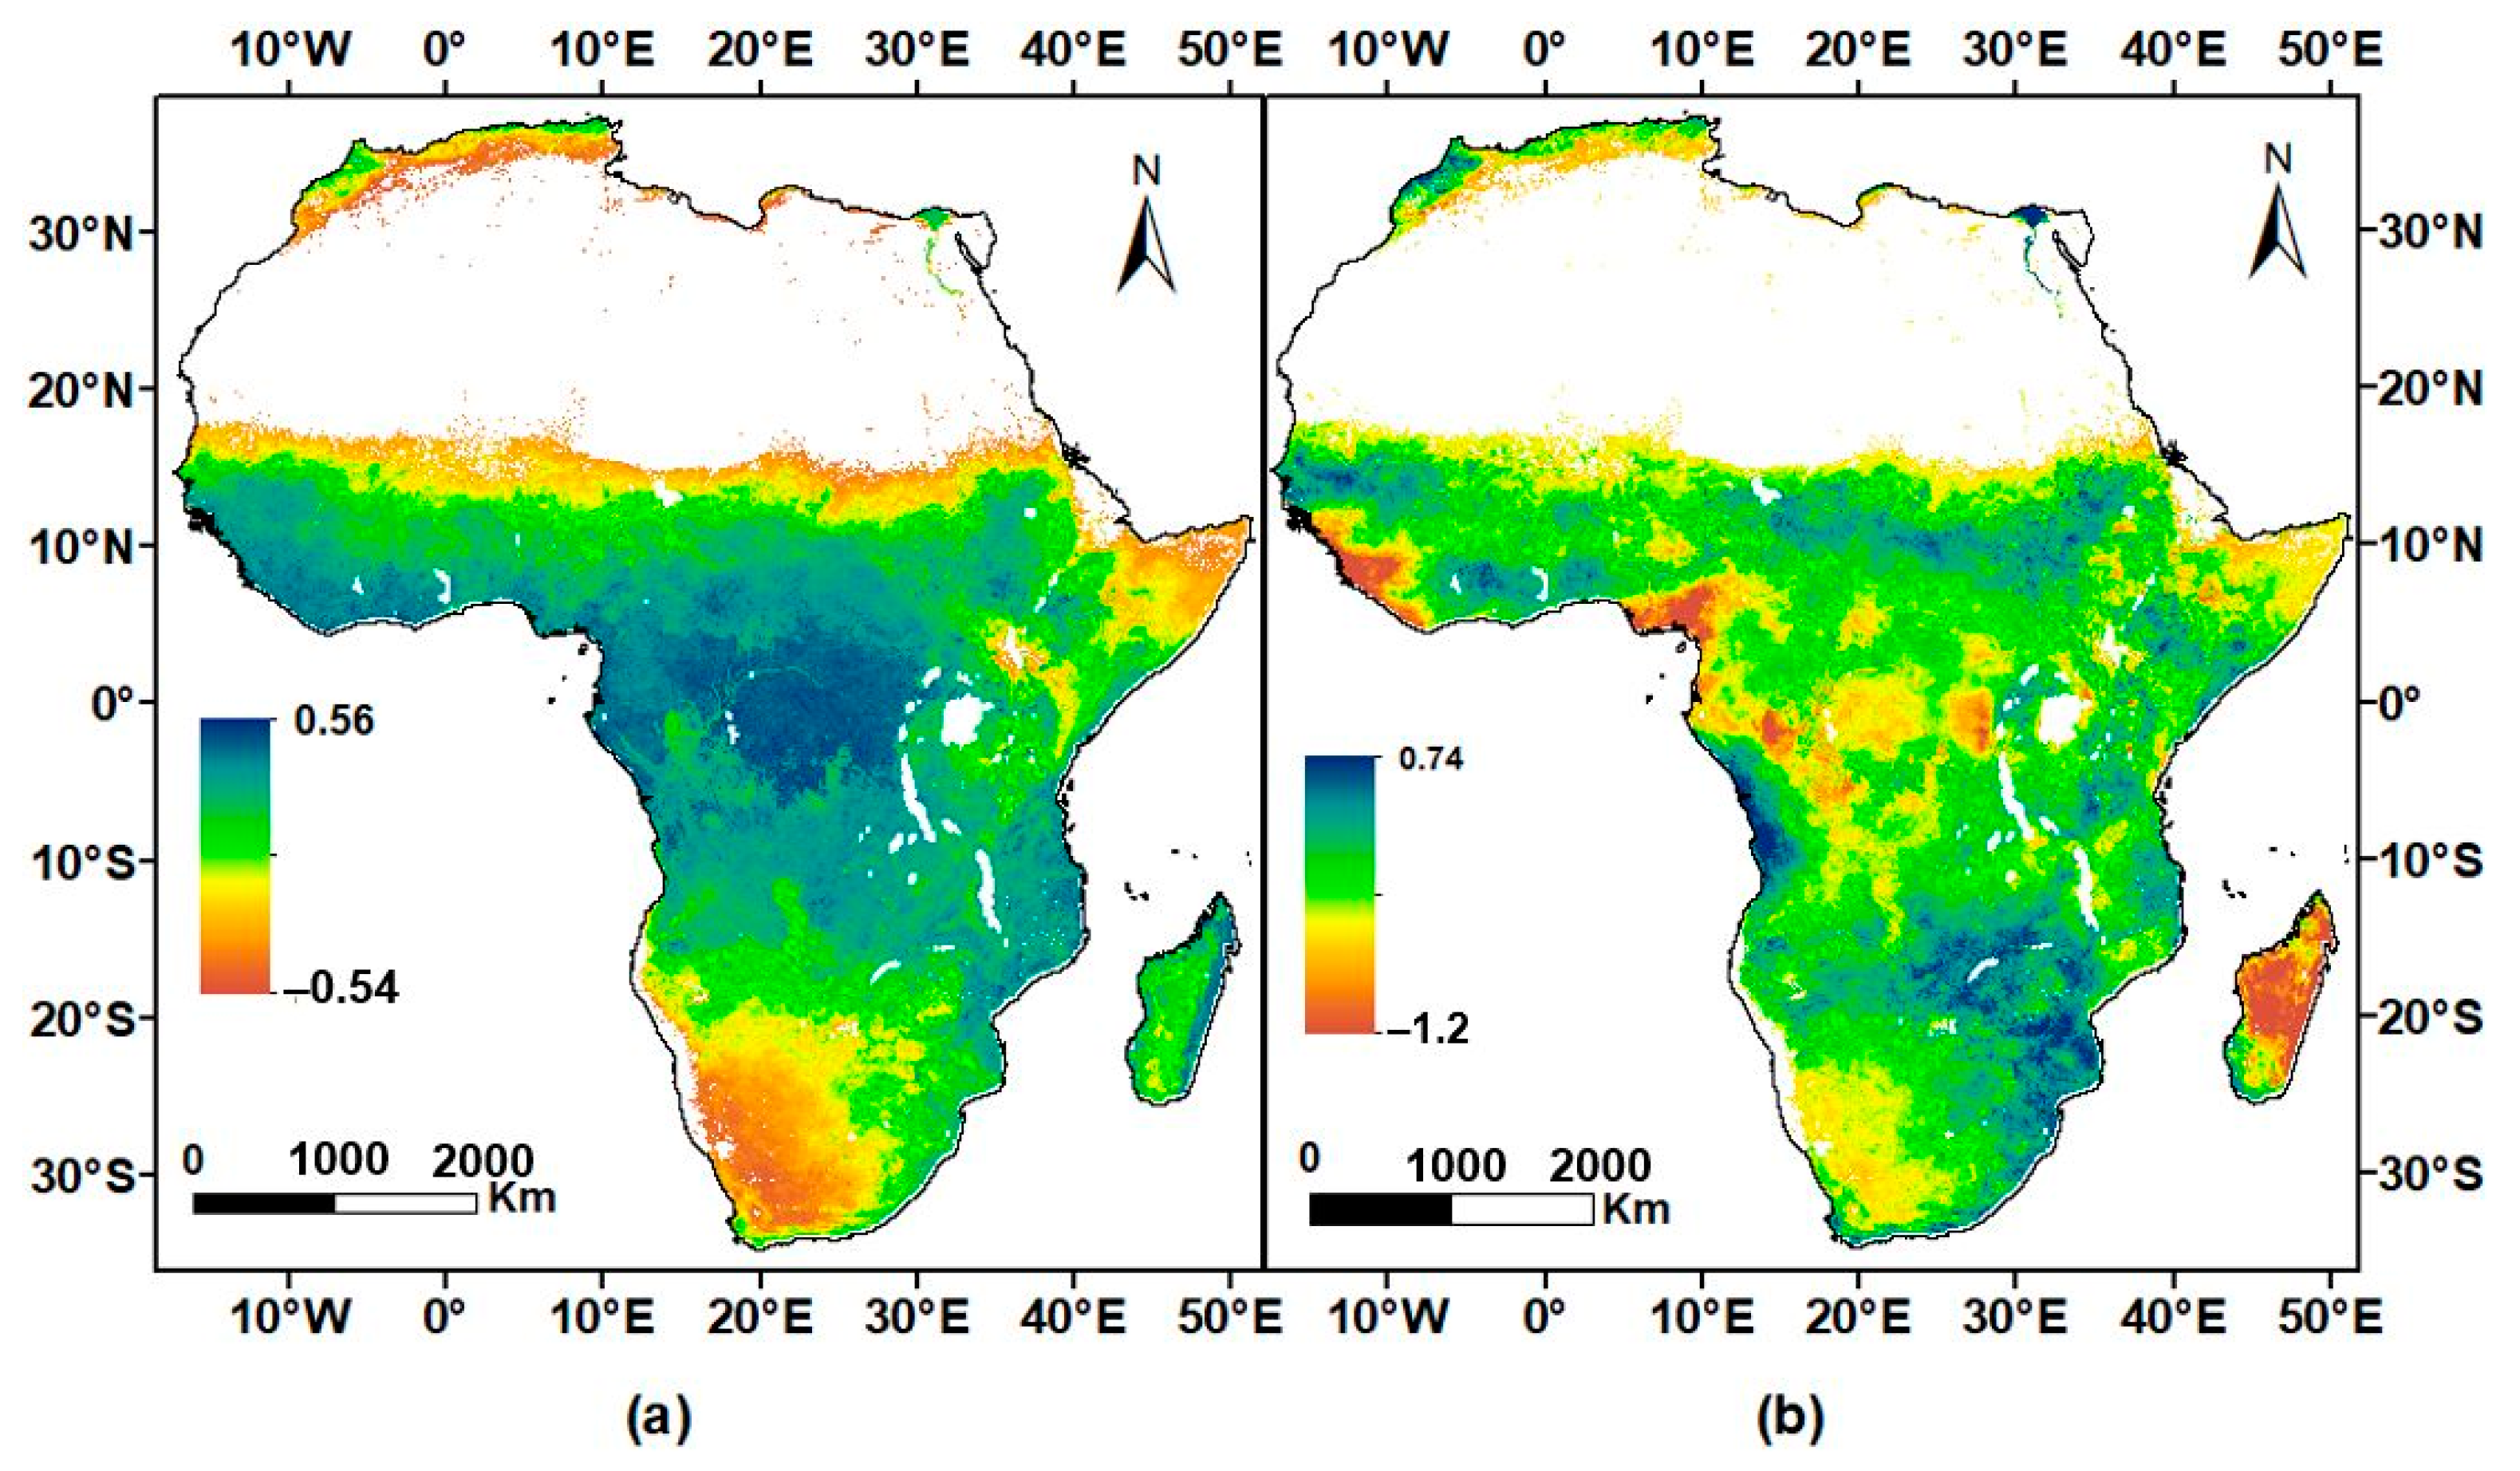
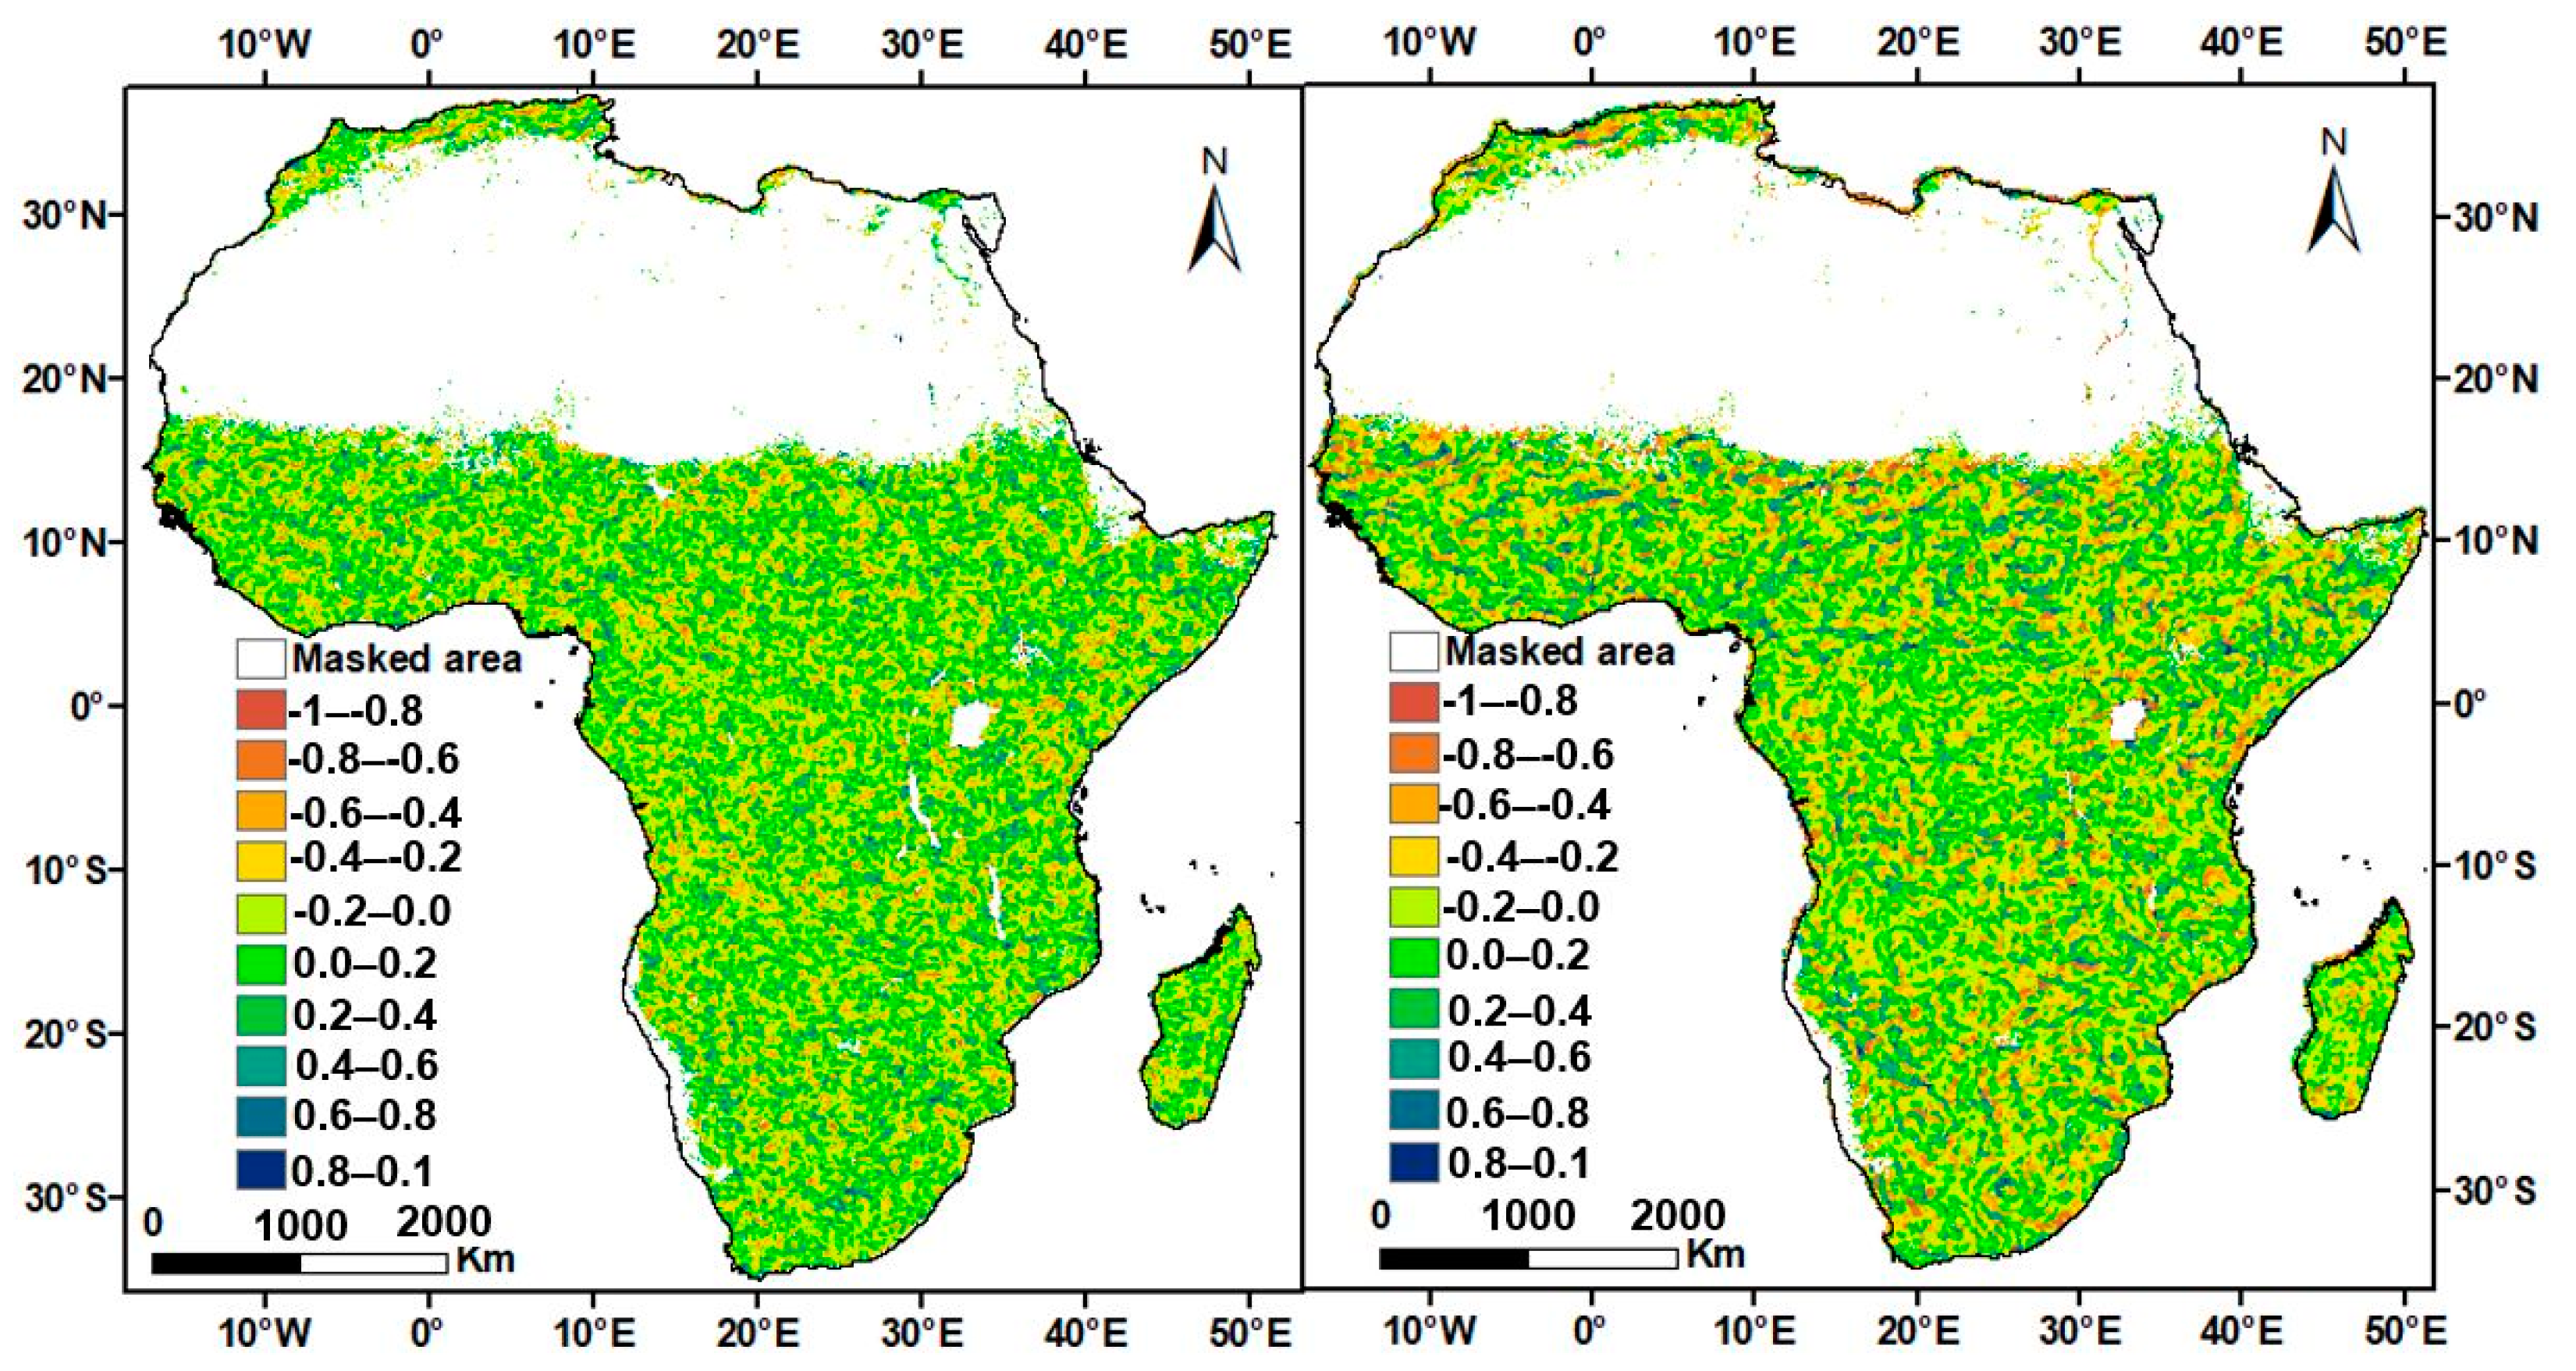
3.4. Correlation between NDVI and Climate Variability

The spatial analysis of correlation coefficients between the annual average NDVI and the annual cumulative precipitation and the annual average temperature in the entire African continent is presented in Figure 9 and Figure 10. Moreover, to find the relationship between vegetation dynamics and climatic variability, the correlation coefficients were found at the annual and seasonal levels. The mean NDVI revealed a positive correlation coefficient with precipitation in most vegetated areas, especially in arid steppe hot areas and its surrounding desert, hot zone. However, we cannot ignore some parts which showed negative correlations, like Serra Leone, Guinea, the eastern part of Democratic Republic of the Congo, Malawi, East Zambia, west Mozambique, Burundi and west Tanzania. The NDVI and precipitation, correlation coefficient rates during the 34 year period was up to 0.930 at 69% and down to −0.774 at 31% of the vegetated area. The part along the Sahel presented a high positive correlation coefficient, while the part in central Africa showed a slight negative correlation between annual mean NDVI and cumulative annual precipitation (Figure 9a). The significance test (Figure 9c) showed that there is no significant correlation between mean NDVI and cumulative annual precipitation, given that only 20% (positive 12.7% and 7.3% of negative) shows a p-value between −0.05 to 0.05. The main part, i.e., 61.2% shows a slight positive correlation, while the slight negative correlation was 23.7%.
The correlation coefficient rate between the annual NDVI and the mean temperature is shown in Figure 9b, and represents a higher negative rate, which is negatively correlated at −0.873 and positively correlated at 0.844. A very strong negative correlation coefficient (−0.873) was identified in the northern part of Southern Africa, especially around Namibia and Botswana, in south Madagascar, west of Ethiopia and the middle parts of Somalia.
In contrast, the highest correlation coefficient (i.e., 0.844) is observed in most parts of west African countries, north and west of Central Africa and in the Nile delta of Egypt. In addition, the evergreen forest in the tropical climate zone of Africa showed a positive correlation between mean NDVI and temperature. The significance test (Figure 9d) showed no correlation of significance when only 11.7% (positive 5.9% and negative 5.8%) showed p-values between −0.05 and 0.05. A slight positive correlation is shown by the main part by 53%, while the slight negative correlation was 35%.
Furthermore, the mean NDVI illustrates different amounts of responses to changes in seasonal precipitation and temperature (Figure 10a,b). Based on these results, in most of the vegetated areas in the study area, a positive correlation between the average NDVI and the accumulated seasonal precipitation is identified, and the correlation coefficients varied according to the seasons and space in the study area. On a seasonal scale, the area in all seasons accounted for up to 50% of the pixels with a positive correlation coefficient. A seasonal descending order, based on positive correlation coefficients of the simulated pixels, were observed in spring (SON), autumn (MAM), summer (DJF) and winter (JJA), with 67.21%, 63.28%, 54.82% and 50.95%, respectively. In winter, which shows a few positive correlation coefficients between the mean NDVI and precipitation, negative correlation coefficients were also found in the most vegetated areas, especially in south-east Africa, including Madagascar. In contrast, for the spring season, the negative correlation coefficient was most evident in the desert areas.
The correlation coefficients between the mean NDVI and temperature in all seasons exhibited an obvious spatial difference, mostly with a negative correlation, while none had a percentage lower than fifty. In addition, the biggest positive correlation coefficient rate identified from September to November was accounted for, from −0.852 to 0.811. During the spring season, African vegetation and temperature experienced both strong positive and negative correlations in different parts. It was in the autumn season (MAM) that the biggest negative correlation (−0.894) was recorded, particularly in the southern parts of Africa. Moreover, occupation of the space counted by pixels with negative correlation, which were the most predominant, was observed in chronological order, as follows: winter (JJA), summer (DJF), spring (SON) and autumn (MAM), as 74.95%, 68.45%, 66.66% and 65.64%, respectively. Further, a negative correlation between the mean NDVI and the temperature occurrence in winter was observed in most parts of strongly vegetated African countries along the Sahel region and Southern Africa, while a positive correlation was observed in the high mountains of eastern countries and eastern-northern parts of the DR Congo, and tropical west Africa.
The summer was the second highest in terms of pixel occupancy; the temperature strongly devastated the NDVI in east Africa, and southern Africa within the Kalahari Desert. During the spring season, the vegetation of east Africa and southern Africa and almost the entire of Madagascar, show a strongly negative correlation with temperature, while it showed positive correlations in most regions of central and southern west Africa at high correlation. In autumn, the correlation coefficient is significantly negative in southern Africa, in the southern part of Madagascar and in most regions of east Africa. Positive correlation coefficients were observed in central Africa and northeast Madagascar.
Moreover, Spearman correlation analysis was performed, where a very strong correlation between NDVI and precipitation is considered to be 0.98% (0.5 positive and 0.48 negative); strong correlation at 3.13% (1.64% of positive and 1.48% of negative); moderate correlation at 13.77% (7.08% of positive and 6.69% of negative); weak correlation at 32.77% (16.46% positive and 16.11% of negative) and very weak correlation at 49.55% (24.65% positive and 24.915 of negative). For NDVI and temperature, a very strong correlation is 1.43% (0.69% of positive and 0.74% of negative); strong correlation is 6.46% (3.02% of positive and 3.46% of negative); moderate correlation is 18.14% (8.78% of positive and 9.36% of negative); weak correlation is 32.01% (15.71% of positive and 16.30% of negative) and very weak correlation is 41.94% (20.73% of positive and 21.20% of negative) (Figure A2). The NDVI–precipitation occupied a larger size, between −1 and −0.9525, from −0.2941 to 0.325 and from 0.9525 to 1 with 62.3%, 53.5% and 63.91%, respectively, while the NDVI–temperature occupied a larger size on the correlation between −0.9529 and −0.2941, and from 0.3255 to 0.9529, with 57.7% and 55.8%, respectively (Figure A1).

3.5. Residual Analysis

Residual-based NDVI-temperature linear regression analysis was used to remove the limitation of temporal autocorrelation and to show the normal distribution between NDVI and climate factors. Figure 11 showed a slight increase in the trend of the NDVI–temperature relationship in tropical Africa, particularly in tropical rainforests up to 0.056 y−1 and a slight decrease in arid and semi-arid regions of the Sahara and Kalahari Deserts −0.54 y−1. In the tropical savanna and temperate zones, especially in northeastern southern Africa, eastern Africa and southwestern Central Africa, NDVI–precipitation residuals increased slightly, to 0.74 y−1. In tropical rainforests, tropical monsoons, arid and semi-arid zones, it declined slightly to −1.2 y−1. These findings suggest that the average patterns in NDVI–temperature residuals and NDVI–precipitation have strong geographic characteristics. The outcome revealed that positive NDVI–precipitation residuals in areas with increasing vegetation trends are spatially aggregated, and are mainly located along the Sahel belt, in the eastern semi-arid zone, in some parts of western Africa and southeast Africa. Regarding NDVI–temperature, it is obvious that the main increases are seen in the slight increase in vegetation in Madagascar and in some tropical regions.

4. Discussions

4.1. Analysis of Vegetation Trend Dynamics

One of many ways in which change in vegetation can be revealed and quantified is by analyzing the fluctuating time series of consecutive years and providing the direction of change through slope analysis [36]. Trends with zero slope values are stable vegetation, while the positive and negative trends represent an increase and decrease in vegetation, respectively [37]. For this study, the results revealed that over 79.16% of Africa showed improved vegetation density. This is consistent with the results of Ndayisaba, Guo [11], which reported that over 82.1% of vegetation was improving. This resulted from the increase in precipitation, and reforestation. The highlight is that, in 2011, there was a significant increase in vegetation, although it is not clear whether there were any special precipitation anomalies. Our results are consistent with those of Davis-Reddy [21], which reported a sharp increase in NDVI in 2011 and Brandt, Rasmussen [38], and, equally, testified to the increase in vegetation cover between 1992 and 2011, resulting in a slight increase in the population, driven by the increase in CO2 and rainfall. Although the increase in NDVI has been observed from 1992, a strong increase in all climate zones was noticed from 2011 to 2015.
Significant degradation occurred in Central and Eastern Africa, bordering the countries in Southern Africa, from Angola, Zambia and Mozambique to Madagascar (Figure 4a and Figure 5a). This degradation occurs strongly during summer season, the months from December to February (Figure 8 and Figure 10a) which may have been influenced by the ENSO events that were reported to be the strongest during this season [39]. Further, from 1982 to 1984, especially in arid areas, there has been a dramatic decline in NDVI, possibly due to drought conditions from 1982 to 1985 in northern tropical Africa [40]. In 1993, there was a sharp decline in NDVI in tropical, boreal and polar climate zones, and in 1992, there was a sharp decline for arid and warm temperate zones (Figure 2), which may have resulted from an obvious drop in rainfall occurrence from 1990. This finding is consistent with the results of Davis-Reddy [21], indicating that NDVI decreased in Southern Africa in 1992/1993 and resulted from the warm ENSO phase and low rainfall event.
However, NDVI shows limitations in identifying and attributing changes in vegetation cover: (1) In arid regions, where seasonal variations in the content of atmospheric aerosol, such as dust and soil background, can cause significant changes in NDVI that are not accompanied by vegetation change [41,42], and in heterogeneous savanna regions, NDVI may have been affected by mixed land cover effects. These areas were masked and the NDVI value < 0.1 was removed to achieve a robust assessment. (2) The NDVI often tends to saturate in densely vegetated areas like tropical rainforest; however, these areas were not excluded from the analysis, to consider the abrupt change and shift which may happen.

4.2. Climate Variability Trends

It is obvious that precipitation is increasing significantly from the Saharan region to the Horn of Africa, in most of Madagascar, in the northern part of southern Africa and northern Morocco and Tunisia. It is declining markedly in central Africa, in a small southern part of west Africa and even in southern Africa. The temperature is notably decreasing in western and southern Africa, and increasing rapidly in northeastern Africa and the northwestern part of Central Africa (Figure 7).
Furthermore, the report highlighted wetter rains in Tanzania and Kenya from March to May. This is consistent with our results, which show an increase in the precipitation rate in this region (Figure 8). Looking at a small-scale map, the results of increasing and decreasing precipitation rates are consistent with those of Ndayisaba, Guo [11], which showed that precipitation decreases in the west and increases in the east of Rwanda. The temperature increased at a remarkable rate of 0.0734 °C y−1, with a decrease of −0.0472 °C y−1. This shows that the temperature has risen to 0.86 °C in the last 34 years (1982–2015). The results are consistent with those of the IPCC 2014, which reported an increase of 0.85 °C for the period of 1880–2012 [43]. Indeed, the IPCC reported that the African land surface temperature increased by 0.5–2 °C over the last century [44].

4.3. Correlation between Temperature, Precipitation and NDVI

Although a large part of Africa did not show a significant correlation, the annual correlation between NDVI and climate data in Figure 9 demonstrates a strong positive correlation between NDVI and precipitation in the semi-arid zone up to 0.930.
In winter (JJA), precipitation in north Africa above the Sahel region decreases; however, NDVI increases along Morocco and the Nile delta in Egypt. This results from the fact that, in this season, the temperature is too cold and the decrease in precipitation often triggers colder weather across the region, which can increase the greenery of the vegetation. Furthermore, this can result from the use of irrigation in agricultural activities. Moreover, from December to February, precipitation decreases, resulting in a decrease in vegetation in south-central Africa, especially in Zambia, Zimbabwe, Mozambique and Botswana. This may be caused by the drier than normal weather caused by ENSO, as reported by [45].
The annual temperature is positively correlated with NDVI in West Africa and in the western and northern parts of central Africa (Figure 9b and Figure 10a). This correlation is also observed from September to November (Figure 10b). The evergreen forest is a humid tropical zone, which is the main cause of the positive correlation. Furthermore, this correlation also may be resulted from aerodynamic effects, explained by Sanderson and Santini [46], as the forest drags and slows the wind speeds, resulting in an enhanced transfer of heat and moisture between forest and air.
The seasonal correlation between NDVI and climate data showed a strong negative correlation between temperature and NDVI in south and east Africa during almost all four seasons (Figure 10), and along southern Sahel in winter. However, it identified a slight positive correlation in other regions, including deserts. The strong seasonal negative correlation between NDVI and temperature across the Sahel, in JJA, for a small area in MAM, and in the west and east of DJF, may be due to reforestation, which decreased warm days in the region [47].
The seasonal NDVI and precipitation were generally correlated in vegetated areas, while they were negatively correlated, particularly in desert areas. The forest of western Madagascar showed a positive correlation with temperature, while it showed a negative correlation with precipitation over all seasons. Results of non-significant correlation, and annual changes in precipitation and temperature, were not able to explain the variation in vegetation, thus there are other factors, like human activities, which may mainly affect the vegetation. Moreover, there are the other key factors (climate and non-climate) that are responsible for vegetation cover changes at the country level, e.g., for climate factors, Igbawua, Zhang [48] reported that the dynamics of vegetation have also affected demography and land use, and are responsive to the humidity. The other non-climate factors which affect vegetation changes in Africa are numerous. For example, recent developmental progress in Africa controls tropical rainforest growths and revegetation due to stages in urbanization processes experienced at country-levels, including oil spillages in the mangroves of west Africa [49].

5. Conclusions

Throughout Africa, during the 34-year period (1982 to 2015), the spatial–temporal vegetation dynamics were assessed through the NDVI3g time series from the GIMMS analysis.
To overcome data constraints from different regions (arid, rainforest), the datasets are treated with caution. To identify and analyze the main factors, CHIRPS precipitation and ERA-Interim temperature datasets were used in this study. The various statistical matrices, including linear regression and spearman analyses, were applied to help identify the rate of increases and decreases in vegetation changes in Africa.
The results indicate that vegetation has a positive annual rate of 0.013 y−1 over a statistical pixel area greater than 79.16% of the total area. The precipitation exhibited a historic increase of 21.17 mm y−1 and the temperature showed an increase rate of 0.0734 °C y−1. It was noted that the rate of decrease (−0.014 y−1) for vegetation occupied a statistical pixel area of 20.84% of the total area. This rate is higher than the rate of increase, at the rate of 0.001 y−1, explaining the implicit strong degradation of the vegetation.
While for temperature and precipitation, the increases are greater than the decreases, which are −0.0472 °C y−1 and −14.11 mm y−1, respectively. Particularly in central Africa, the findings showed that there was a significant increase in temperature and a significant decrease in rainfall. Thus, the tropical vegetation has undergone destructive changes, and therefore gradually perishes different plant species, especially tree cover, broadleaved, deciduous, closed to open (>15%) and shrubland. These can be attributed to urbanization processes at the country level, which are currently spreading throughout most parts of tropical Africa. However, our analysis did not consider urbanization effects, which is a limitation of the study. Because the simple linear regression analysis is commonly used to establish relationships between variables, but not their causation, a relationship between two variables does not mean one causes the other to change. However, our study still shows the influence of climate variability, given the positive correlation between vegetation and precipitation throughout Africa, except in deserts, and a strong negative correlation between vegetation and temperature in almost all the vegetated areas, except the tropical rainforest zone (Figure 1). Additionally, our study shows a large, stable and a continuous decrease in vegetation, mostly in the central and eastern parts of Africa. Furthermore, the increase in temperature caused by global warming remains a serious problem in Africa. Therefore, it is suggested to ensure the reduction in all sources of temperature rise. We can conclude that monitoring the level of climate change is essential to identify the onset of depression, regardless of geographical influences. Future studies should consider a more detailed investigation of the influence of current urbanization processes on African vegetation and endangered plant species.

Author Contributions

Conceptualization, S.U., L.J., Y.D., L.N., T.Y. and T.W. and G.L.; investigation and supervision, A.B. and W.X.; methodology and writing—original draft, V.N.; software L.J. and T.Y. All authors contributed to the proper reading and improvement of the ideas in the final manuscript. All authors have read and agreed to the published version of the manuscript.

Funding

This research was funded by the National Program on Key Basic Research Project of China, Grant number 2018YFE0106000; Science and Technology Partnership Program, Ministry of Science and Technology of China, Grant number KY 201702010.

Institutional Review Board Statement

Not applicable.

Informed Consent Statement

Not applicable.

Data Availability Statement

This article used five datasets and the five datasets related to this article are NDVI3g, https://ecocast.arc.nasa.gov/data/pub/gimms/ [26], CHIRPS, ftp://ftp.chg.ucsb.edu/pub/org/chg/products/CHIRPS/ [29], ERA-interim, https://apps.ecmwf.int/datasets/data/interim-full-moda/levtype%3Dsfc/ [31], land cover https://www.esa-landcover-cci.org and climate zone, downloaded from www.gloh2o.org/koppen [25].

Acknowledgments

The authors are deeply grateful to the European Centre for the Medium Range Weather Forecast (ECMWF), ESA CCI Land Cover project, United States Geological survey and the NASA team for the provision of data. Moreover, the authors would like to acknowledge the Chinese government, Xinjiang Institute of Ecology and Geography, (UCAS), and University of Chinese Academy of Sciences (UCAS), for their financial support and lab facilities during this study.

Conflicts of Interest

The authors declare that there is no conflict of interest.

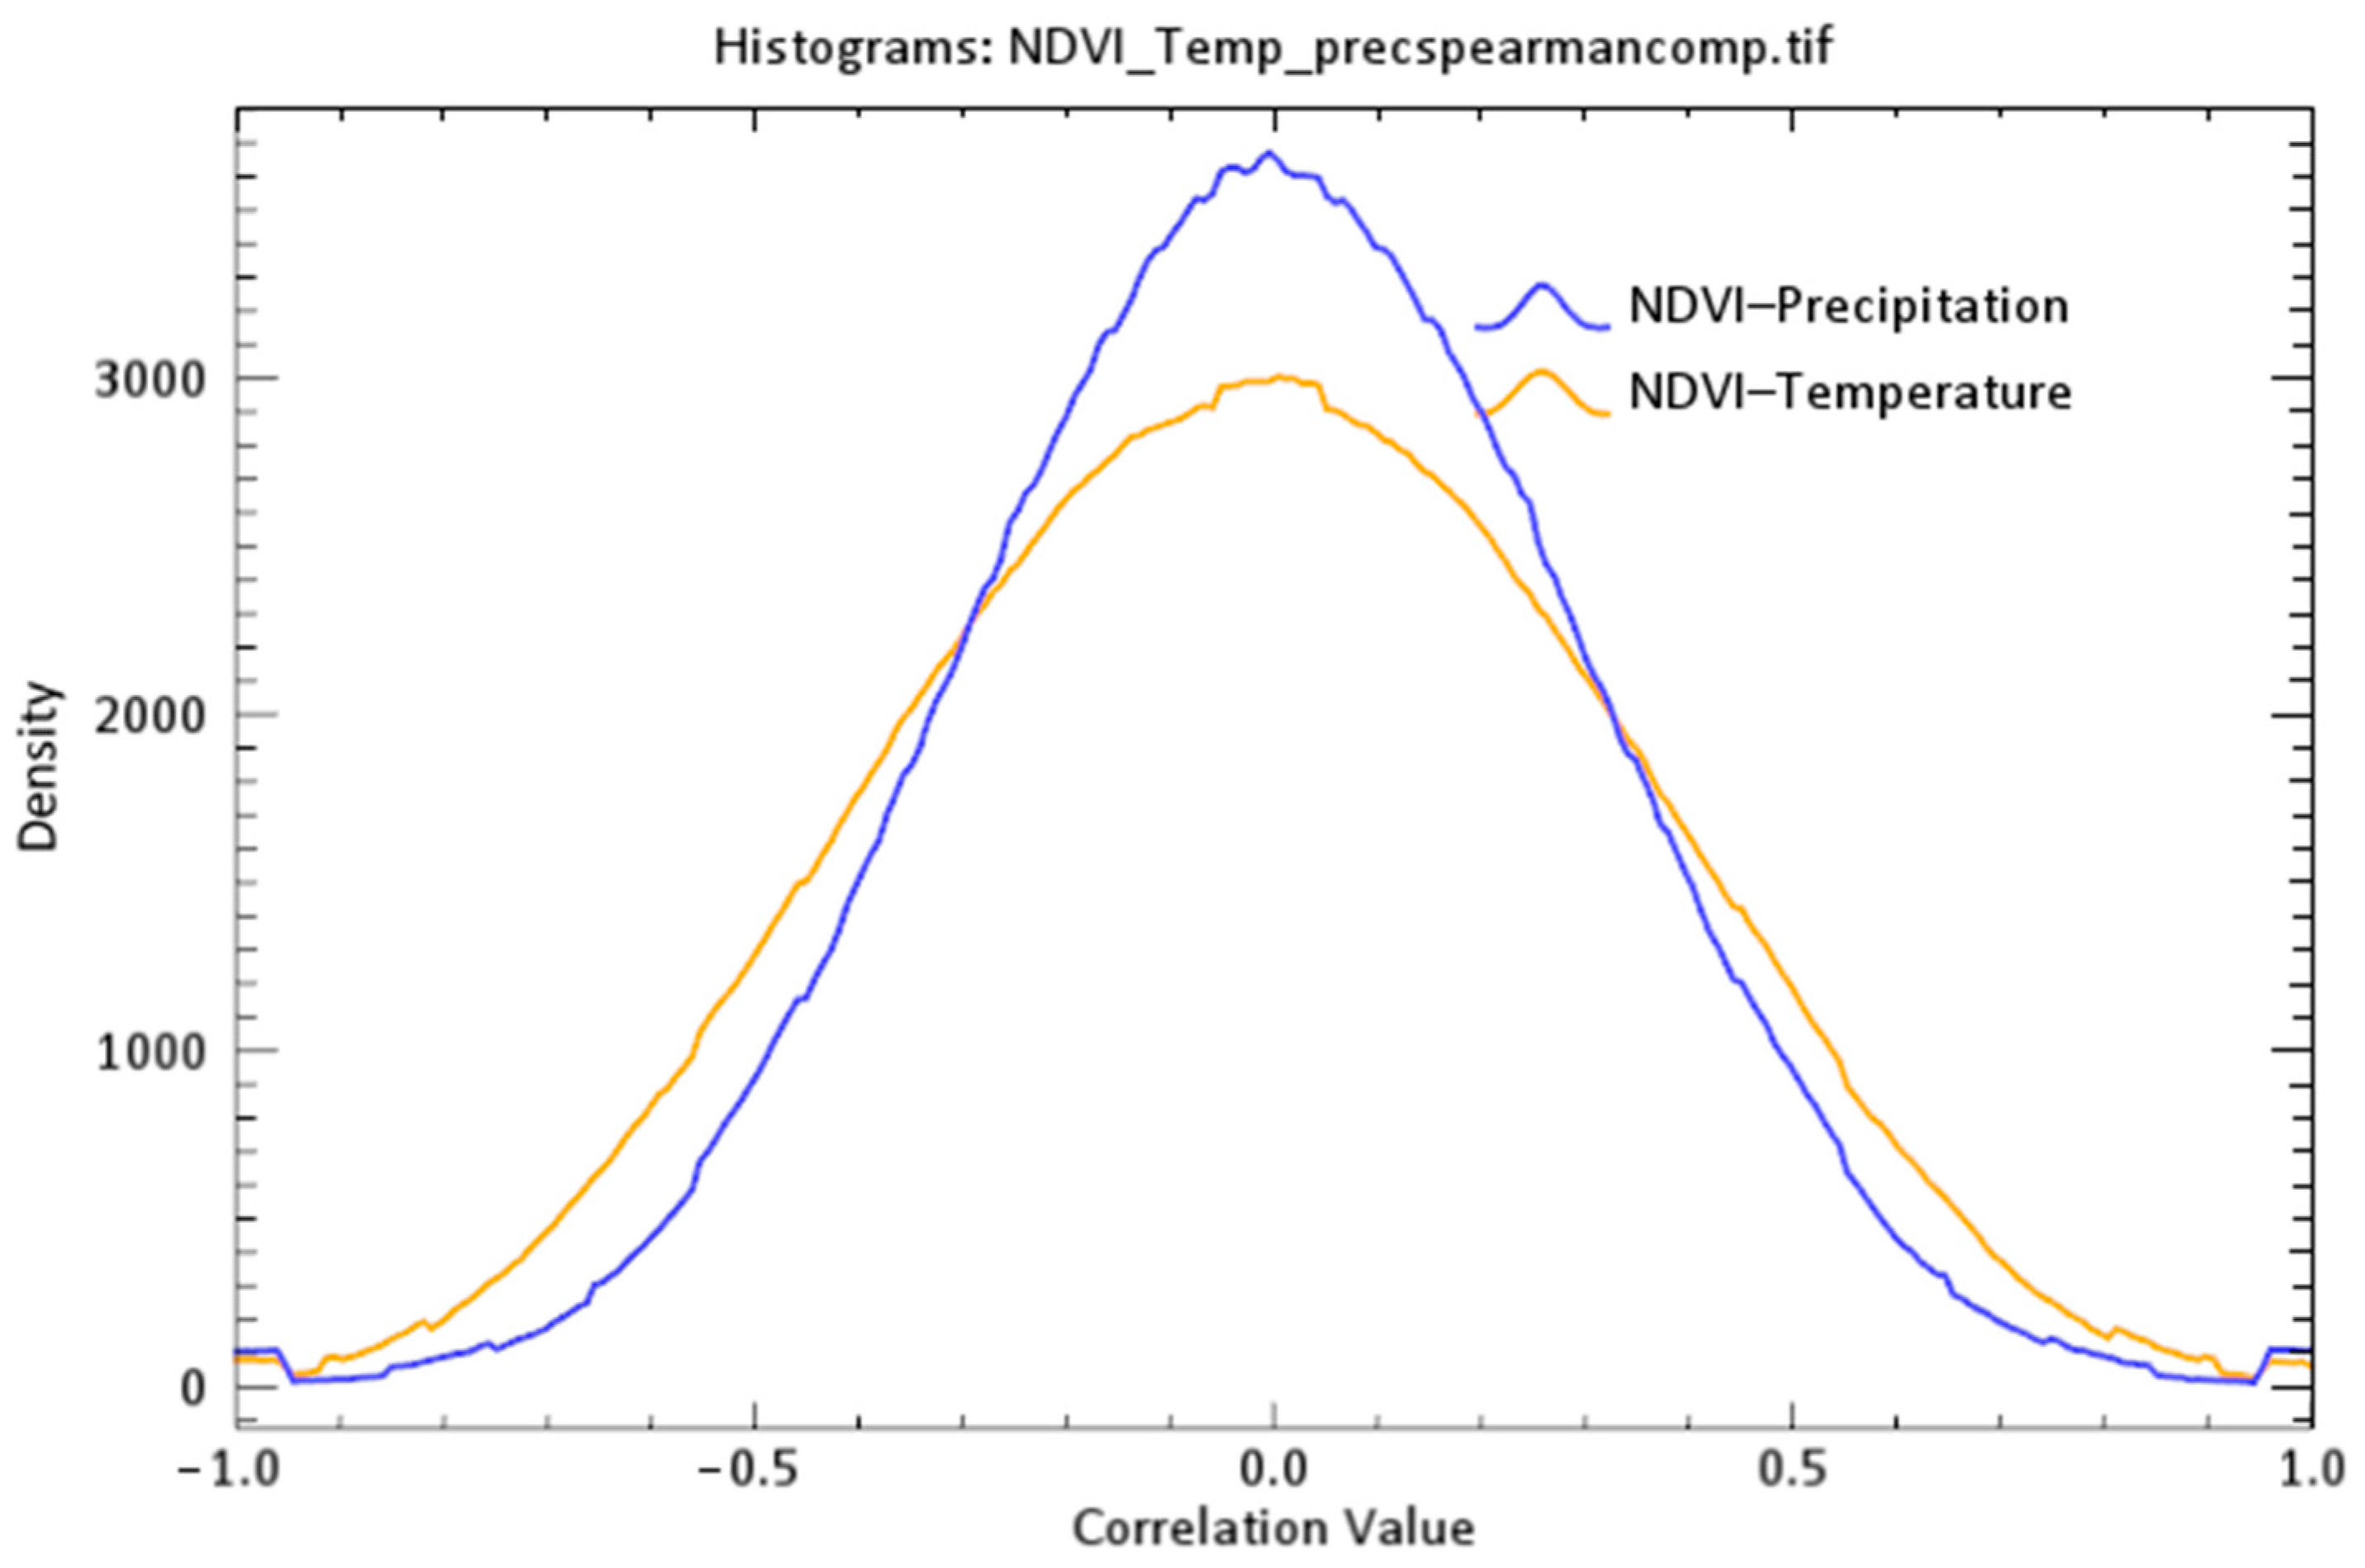
Appendix A. The NDVI-Precipitation and NDVI-Temperature Spearman Correlations

Figure A1. Spearman correlation between NDVI and precipitation, NDVI and temperature from 1982 to 2015.
Sustainability 13 01234 g0a1
Figure A2. Spearman correlation between (left) NDVI and precipitation, (right) NDVI and temperature from 1982 to 2015, with assigned classification of 0–0.19: very weak, 0.2–0.39: weak, 0.4–0.59: moderate, 0.6–0.79: strong, 0.8–1 very strong correlation, in the positive and negative direction.
Sustainability 13 01234 g0a2

References

  1. Sellers, P.J.; Dickinson, R.E.; Randall, D.A.; Betts, A.K.; Hall, F.G.; Berry, J.A.; Collatz, G.J.; Denning, A.S.; Mooney, H.A.; Nobre, C.A.; et al. Modeling the exchanges of energy, water, and carbon between continents and the atmosphere. Science 1997, 275, 502–509. [Google Scholar] [CrossRef] [PubMed] [Green Version]
  2. McPhaden, M.J. Genesis and Evolution of the 1997-98 El Nino. Science 1999, 283, 950–954. [Google Scholar] [CrossRef] [PubMed] [Green Version]
  3. Mason, S.J. El Niño, climate change, and Southern African climate. Environmetrics 2001, 12, 327–345. [Google Scholar] [CrossRef]
  4. Anyamba, A.; Tucker, C.; Eastman, J. NDVI anomaly patterns over Africa during the 1997/98 ENSO warm event. Int. J. Remote Sens. 2001, 22, 1847–1860. [Google Scholar]
  5. Engelbrecht, F.; Adegoke, J.; Bopape, M.-J.; Naidoo, M.; Garland, R.M.; Thatcher, M.; McGregor, J.; Katzfey, J.; Werner, M.; Ichoku, C.; et al. Projections of rapidly rising surface temperatures over Africa under low mitigation. Environ. Res. Lett. 2015, 10, 085004. [Google Scholar] [CrossRef]
  6. Fer, I.; Tietjen, B.; Jeltsch, F.; Wolff, C. The influence of El Niño–Southern Oscillation regimes on eastern African vegetation and its future implications under the RCP8.5 warming scenario. Biogeosciences 2017, 14, 4355–4374. [Google Scholar] [CrossRef] [Green Version]
  7. Stige, L.C.; Stave, J.; Chan, K.-S.; Ciannelli, L.; Pettorelli, N.; Glantz, M.; Herren, H.R.; Stenseth, N.C. The effect of climate variation on agro-pastoral production in Africa. Proc. Natl. Acad. Sci. USA 2006, 103, 3049–3053. [Google Scholar] [CrossRef] [PubMed] [Green Version]
  8. Maidment, R.I.; Grimes, D.; Black, E.; Tarnavsky, E.; Young, M.; Greatrex, H.; Allan, R.P.; Stein, T.H.M.; Nkonde, E.; Senkunda, S.; et al. A new, long-term daily satellite-based rainfall dataset for operational monitoring in Africa. Sci. Data 2017, 4, 170063. [Google Scholar] [CrossRef]
  9. Ogutu, J.O.; Piepho, H.; Dublin, H.T.; Bhola, N.; Reid, R.S. El Niño-Southern Oscillation, rainfall, temperature and Normalized Difference Vegetation Index fluctuations in the Mara-Serengeti ecosystem. Afr. J. Ecol. 2008, 46, 132–143. [Google Scholar] [CrossRef]
  10. Thomson, M.C.; Abayomi, K.; Barnston, A.G.; Levy, M.; Dilley, M. El Niño and drought in southern Africa. Lancet 2003, 361, 437–438. [Google Scholar] [CrossRef]
  11. Ndayisaba, F.; Guo, H.; Bao, A.; Guo, H.; Karamage, F.; Kayiranga, A. Understanding the Spatial Temporal Vegetation Dynamics in Rwanda. Remote. Sens. 2016, 8, 129. [Google Scholar] [CrossRef] [Green Version]
  12. Barros, V.R.; Field, C.B. Climate Change 2014: Impacts, Adaptation, and Vulnerability. Part B: Regional Aspects; Cambridge University Press: Cambridge, UK, 2014. [Google Scholar]
  13. Engelbrecht, C.J.; Engelbrecht, F.A.; Dyson, L.L. High-resolution model-projected changes in mid-tropospheric closed-lows and extreme rainfall events over southern Africa. Int. J. Clim. 2013, 33, 173–187. [Google Scholar] [CrossRef]
  14. Cai, W.; Borlace, S.; Lengaigne, M.; Van Rensch, P.; Collins, M.; Vecchi, G.A.; Timmermann, A.; Santoso, A.; McPhaden, M.J.; Wu, L.; et al. Increasing frequency of extreme El Niño events due to greenhouse warming. Nat. Clim. Chang. 2014, 4, 111–116. [Google Scholar] [CrossRef] [Green Version]
  15. Nicholson, S.; Farrar, T. The influence of soil type on the relationships between NDVI, rainfall, and soil moisture in semiarid Botswana. I. NDVI response to rainfall. Remote Sens. Environ. 1994, 50, 107–120. [Google Scholar] [CrossRef]
  16. Chamaille-Jammes, S.; Fritz, H.; Murindagomo, F. Spatial patterns of the NDVI–rainfall relationship at the seasonal and inter-annual time scales in an African savanna. Int. J. Remote Sens. 2006, 27, 5185–5200. [Google Scholar] [CrossRef]
  17. Chikoore, H.; Jury, M.R. Intraseasonal Variability of Satellite-Derived Rainfall and Vegetation over Southern Africa. Earth Interact. 2010, 14, 1–26. [Google Scholar] [CrossRef]
  18. Georganos, S.; Abdi, A.; Tenenbaum, D.E.; Kalogirou, S. Examining the NDVI-rainfall relationship in the semi-arid Sahel using geographically weighted regression. J. Arid. Environ. 2017, 146, 64–74. [Google Scholar] [CrossRef]
  19. Anyamba, A.; Eastman, J.R. Interannual variability of NDVI over Africa and its relation to El Niño/Southern Oscillation. Int. J. Remote. Sens. 1996, 17, 2533–2548. [Google Scholar] [CrossRef]
  20. Kawabata, A.; Ichii, K.; Yamaguchi, Y. Global monitoring of interannual changes in vegetation activities using NDVI and its relationships to temperature and precipitation. Int. J. Remote Sens. 2001, 22, 1377–1382. [Google Scholar] [CrossRef]
  21. Davis-Reddy, C. Assessing Vegetation Dynamics in Response to Climate Variability and Change across Sub-Saharan Africa; Stellenbosch University: Stellenosch, South Africa, 2018. [Google Scholar]
  22. Kalisa, W.; Igbawua, T.; Henchiri, M.; Ali, S.; Zhang, S.; Bai, Y.; Zhang, J. Assessment of climate impact on vegetation dynamics over East Africa from 1982 to 2015. Sci. Rep. 2019, 9, 1–20. [Google Scholar] [CrossRef] [Green Version]
  23. Medany, M.; Niang-Diop, I.; Nyong, T.; Tabo, R.; Vogel, C. Background paper on impacts, vulnerability and adaptation to climate change in Africa. In Proceedings of the UNFCCC Convention, Accra, Ghana, 21–23 September 2006. [Google Scholar]
  24. Hijmans, R.J.; Cameron, S.E.; Parra, J.L.; Jones, P.G.; Jarvis, A. Very high resolution interpolated climate surfaces for global land areas. Int. J. Clim. 2005, 25, 1965–1978. [Google Scholar] [CrossRef]
  25. Beck, H.E.; Zimmermann, N.E.; McVicar, T.R.; Vergopolan, N.; Berg, A.; Wood, E.F. Present and future Köppen-Geiger climate classification maps at 1-km resolution. Sci. Data 2018, 5, 180214. [Google Scholar] [CrossRef] [PubMed] [Green Version]
  26. Tucker, C.J.; Pinzon, J.E.; Brown, M.E.; Slayback, D.A.; Pak, E.; Mahoney, R.; Vermote, E.F.; El Saleous, N. An extended AVHRR 8-km NDVI dataset compatible with MODIS and SPOT vegetation NDVI data. Int. J. Remote. Sens. 2005, 26, 4485–4498. [Google Scholar] [CrossRef]
  27. Xue, J.; Su, B. Significant Remote Sensing Vegetation Indices: A Review of Developments and Applications. J. Sens. 2017, 2017, 1–17. [Google Scholar] [CrossRef] [Green Version]
  28. Karnieli, A.; Agam, N.; Pinker, R.T.; Anderson, M.; Imhoff, M.L.; Gutman, G.G.; Panov, N.; Goldberg, A. Use of NDVI and Land Surface Temperature for Drought Assessment: Merits and Limitations. J. Clim. 2010, 23, 618–633. [Google Scholar] [CrossRef]
  29. Funk, C.; Peterson, P.; Landsfeld, M.; Pedreros, D.; Verdin, J.; Shukla, S.; Husak, G.; Rowland, J.; Harrison, L.; Hoell, A.; et al. The climate hazards infrared precipitation with stations—a new environmental record for monitoring extremes. Sci. Data 2015, 2, 1–21. [Google Scholar] [CrossRef] [PubMed] [Green Version]
  30. Peterson, P.; Funk, C.C.; Husak, G.J.; Pedreros, D.H.; Landsfeld, M.; Verdin, J.P.; Shukla, S. The Climate Hazards Group InfraRed Precipitation (CHIRP) with Stations (CHIRPS): Development and Validation. AGUFM 2013, H33E–1417. Available online: https://ui.adsabs.harvard.edu/abs/2013AGUFM.H33E1417P/ (accessed on 22 January 2021).
  31. Dee, D.P.; Uppala, S.M.; Simmons, A.J.; Berrisford, P.; Poli, P.; Kobayashi, S.; Andrae, U.; Balmaseda, M.A.; Balsamo, G.; Bauer, P.; et al. The ERA-Interim reanalysis: Configuration and performance of the data assimilation system. Q. J. R. Meteorol. Soc. 2011, 137, 553–597. [Google Scholar] [CrossRef]
  32. Bogaert, J.; Zhou, L.; Tucker, C.J.; Myneni, R.B.; Ceulemans, R. Evidence for a persistent and extensive greening trend in Eurasia inferred from satellite vegetation index data. J. Geophys. Res. Space Phys. 2002, 107. [Google Scholar] [CrossRef]
  33. Zhang, X.; Liao, C.; Li, J.; Sun, Q. Fractional vegetation cover estimation in arid and semi-arid environments using HJ-1 satellite hyperspectral data. Int. J. Appl. Earth Obs. Geoinf. 2013, 21, 506–512. [Google Scholar] [CrossRef]
  34. Croux, C.; Dehon, C. Influence functions of the Spearman and Kendall correlation measures. Stat. Methods Appl. 2010, 19, 497–515. [Google Scholar] [CrossRef] [Green Version]
  35. Spearman, C. “General Intelligence”, Objectively Determined and Measured; APA PsycNet: Washington, DC, USA, 1904; Volume 15, pp. 201–293. [Google Scholar]
  36. Reed, B.C. Trend Analysis of Time-Series Phenology of North America Derived from Satellite Data. GISci. Remote Sens. 2006, 43, 24–38. [Google Scholar] [CrossRef]
  37. Duan, H.; Yan, C.; Tsunekawa, A.; Song, X.; Li, S.; Xie, J. Assessing vegetation dynamics in the Three-North Shelter Forest region of China using AVHRR NDVI data. Environ. Earth Sci. 2011, 64, 1011–1020. [Google Scholar] [CrossRef]
  38. Brandt, M.; Rasmussen, K.; Peñuelas, J.; Tian, F.; Schurgers, G.; Verger, A.; Mertz, O.; Palmer, J.R.B.; Fensholt, R. Human population growth offsets climate-driven increase in woody vegetation in sub-Saharan Africa. Nat. Ecol. Evol. 2017, 1, 0081. [Google Scholar] [CrossRef] [PubMed] [Green Version]
  39. Mason, S.; Jury, M. Climatic variability and change over southern Africa: A reflection on underlying processes. Prog. Phys. Geogr. Earth Environ. 1997, 21, 23–50. [Google Scholar] [CrossRef]
  40. Nicholson, S. The nature of rainfall variability over Africa on time scales of decades to millenia. Glob. Planet. Chang. 2000, 26, 137–158. [Google Scholar] [CrossRef]
  41. Pinzon, J.E.; Tucker, C.J. A non-stationary 1981–2012 AVHRR NDVI3g time series. Remote Sens. 2014, 6, 6929–6960. [Google Scholar] [CrossRef] [Green Version]
  42. Huete, A.R.; Tucker, C.J. Investigation of soil influences in AVHRR red and near-infrared vegetation index imagery. Int. J. Remote. Sens. 1991, 12, 1223–1242. [Google Scholar] [CrossRef]
  43. Pachauri, R.K.; Allen, M.R.; Barros, V.R.; Broome, J.; Cramer, W.; Christ, R.; Church, J.A.; Clarke, L.; Dahe, Q.; Dasgupta, P.; et al. Climate Change 2014: Synthesis Report. Contribution of Working Groups I, II and III to the fifth assessment report of the Intergovernmental Panel on Climate Change; IPCC: Geneva, Switzerland, 2014. [Google Scholar]
  44. Field, C.B. Climate Change 2014–Impacts, Adaptation and Vulnerability: Regional Aspects; Cambridge University Press: Cambridge, UK, 2014. [Google Scholar]
  45. Cashin, P.; Mohaddes, K.; Raissi, M. Fair weather or foul? The macroeconomic effects of El Niño. J. Int. Econ. 2017, 106, 37–54. [Google Scholar] [CrossRef] [Green Version]
  46. Sanderson, M.; Santini, M.; Valentini, R.; Pope, E. Relationships between forests and weather. In EC Directorate General of the Environment; Met Office Hadley Centre: Exeter, UK, 2012. [Google Scholar]
  47. Diba, I.; Camara, M.; Diedhiou, A. Impacts of the Sahel-Sahara Interface Reforestation on West African Climate: Intra-Annual Variability and Extreme Temperature Events. Atmos. Clim. Sci. 2019, 9, 35–61. [Google Scholar] [CrossRef] [Green Version]
  48. Igbawua, T.; Zhang, J.; Chang, Q.; Yao, F. Vegetation dynamics in relation with climate over Nigeria from 1982 to 2011. Environ. Earth Sci. 2016, 75, 518. [Google Scholar] [CrossRef]
  49. Ochege, F.U.; Okpala-Okaka, C. Remote sensing of vegetation cover changes in the humid tropical rainforests of South-eastern Nigeria (1984–2014). Cogent Geosci. 2017, 3, 1307566. [Google Scholar] [CrossRef]
Figure 1. The distribution of African climatic zones with Köppen–Geiger classification. Source [25].
Sustainability 13 01234 g001
Figure 2. Spatial–temporary differentiation in annual mean normalized difference vegetation index (NDVI), precipitation (mm) and temperature (°C) for five climate zones of Africa over 34 years.
Sustainability 13 01234 g002
Figure 3. Spatial distribution of landcover in Africa in 2015. Source: Climate Change Initiative Land Cover (CCI-LC) maps.
Sustainability 13 01234 g003
Figure 4. Change in the trends of the mean NDVI from 1982 to 2015. (a) annual change trends in NDVI: the yellow to green color shows the trend of increase in vegetation greenness per year, while the decreases are marked by yellow to red color; and (b) significance (p-value) of the change trends in NDVI are classified as strong significance from 0 to 0.01, from 0.01 to 0.05 as significant and 0.05 to 1 as no significant results.
Sustainability 13 01234 g004
Figure 5. Change in the trends of the mean NDVI from 1982 to 2015: (a) The overall trends in five types: slight degradation, slight improvement, stable or without vegetation, significant degradation, and significant improvement; (b) percentage of each in the four classified trends, where Sl D stands for Slight Degradation; Sl I, Slight Improvement, St and nv, Stable or non-vegetation; S D, Strong degradation and SI, Strong Improvement.
Sustainability 13 01234 g005
Figure 6. Vegetation exchange in % from 1992 to 2015 classified in the NDVI trend result of the vegetation dynamics (1982–2015) where, 10: rainfed cropland; 11: herbaceous cover; 12: tree or shrub cover; 20: cropland, irrigated or post flooding; 30: mosaic croplands (>50%)/natural vegetation (tree, shrub, herbaceous cover) (<50%); 40: mosaic natural vegetation (tree, shrub, herbaceous cover) (>50%)/cropland (<50%); 50: tree cover, broadleaved, evergreen, closed to open (>15%); 60: tree cover, broadleaved, deciduous, closed to open (>15%); 61: tree cover, broadleaved, deciduous, closed (>40%); 62: tree cover, broadleaved, deciduous, open (1540%); 70: tree cover, needleleaved, evergreen, closed to open (>15%); 80: tree cover, needleleaved, deciduous, closed to open (>15%); 90: tree cover, mixed leaf type (broadleaved and needleleaved); 100: mosaic tree and shrub(>50%)/herbaceous cover (<50%); 110: mosaic herbaceous cover (>50%)/tree and shrub (<50%); 120: shrubland; 122: deciduous shrubland; 130: grassland; 150: sparse vegetation (tree, shrub, herbaceous cover) (<15%); 151: sparse tree (<15%) ;152: sparse shrub (<15%); 153: sparse herbaceous cover (<15%) ;160: tree cover, flooded, fresh or brakish water; 170: tree cover, flooded, saline water; 180: shrub or herbaceous cover, flooded, fresh/saline/brakish water; 190: urban areas; 200: bare areas; 201: consolidated bare areas; 202: unconsolidated bare areas; 210: water bodies. Following the legend of the global Land Cover map using the United National Land Cover Classification System (UN-LCCS), which is quite compatible with the plant functional types used in many models.
Sustainability 13 01234 g006
Figure 7. Trends in annual rainfall and temperature over Africa from 1982 to 2015 based on Chirps and European Center for Medium-Range Weather Forecast Re-Analysis (ERA)-Interim/European center for medium-range weather forecast (ECMWF). (a), Spatial distribution of annual mean temperature. (b), Spatial distribution annual accumulated precipitation from 1982 to 2015.
Sustainability 13 01234 g007
Figure 8. Spatial distribution of NDVI, temperature and precipitation seasonal variation rate from 1982 to 2015.
Sustainability 13 01234 g008
Figure 9. A 34 year correlation coefficient between NDVI and climate variables and their p-values. (a,c): NDVI and precipitation correlation and their p-value distribution, (b,d): NDVI and temperature correlation and their p-value distribution from1982 to 2015. Notably, −0.05–0 and 0–0.05 are considered a negative and positive significant correlation, respectively, while <−0.05 and >0.05 are considered slight negative and positive significant correlations, respectively.
Sustainability 13 01234 g009aSustainability 13 01234 g009b
Figure 10. (a) Spatial distribution of the correlation coefficients between the mean NDVI and seasonal precipitation; (b) Spatial distribution of the correlation coefficients between the mean NDVI and seasonal temperature.
Sustainability 13 01234 g010
Figure 11. Overall trends of the NDVI residuals in a regression of (a) the mean NDVI–temperature and (b) NDVI–precipitation.
Sustainability 13 01234 g011
Table 1. Division of the degrees of variation in the NDVI change trend.
SlopeTrend Magnitudep-ValueVariation
Positive0.002–0.0130–0.01Strong improvement
0.0003–0.0020.01–0.05Slight improvement
Negative–Positive−0.0003–0.00030.05–1Stable or non-vegetated area
Negative−0.002–−0.00030.01–0.05Slight degradation
−0.014–−0.0020–0.01Strong degradation
Table 2. The representation of the 9 countries most identified with high vegetation trends (area in pixel).
Strong DegradationSlight DegradationStable or Non-Vegetated AreaSlight ImprovementStrong Improvement
aNDVI Trends Variation Area (in Pixel) for Each Country
Angola10.21DR, Congo44.88Algeria168.04DR Congo94.12Sudan28.44
Tanzania4.60Angola34.39Libya146.66South Africa63.96Ethiopia27.91
Kenya3.79Zambia18.26Egypt78.42Ethiopia43.30Chad26.70
Mozambique3.50Mozambique18.21Sudan77.14Sudan38.65South Africa22.39
Zambia3.15 14.27Niger62.36Nigeria38.64South Sudan21.72
Madagascar3.07Tanzania13.11Mauritania57.63Namibia37.88Nigeria20.19
DR Congo2.79Morocco10.34Mali51.41Angola36.70Mali16.04
Ethiopia2.64Namibia10.03DR Congo40.74C A R35.03Botswana12.94
Sudan2.52Sudan9.77Chad38.84Tanzania34.70Kenya11.92
bThe Percentage of NDVI Trends Based on the Area of Each Country
Djibouti19.63Djibouti53.38Libya93.99Eq G72.57Senegal49.89
Angola9.93Angola33.47Egypt90.44C A R69.22Sierra Leone45.11
Kenya8.48Madagascar30.58Algeria79.01Lesotho68.01South Sudan42.27
Eritrea7.42Zambia30.01Mauritania64.42Congo64.62Liberia33.78
Malawi7.33Mozambique29.28Niger62.08Burundi64.43Togo32.94
Tanzania6.67Rwanda26.50Mauritius50.00Liberia63.85The Gambia31.32
Madagascar6.58Malawi26.01Sudan49.29Swaziland63.03Guinea-Bissau31.14
Mozambique5.63Tunisia25.80Mali48.32Gabon62.89Guinea31.12
Zambia5.18DR Congo24.25Tunisia43.43Guinea62.69Ethiopia30.68
In the column of Slight Improvement, table a line 8 and table b line 2, C A R stands for Central African Republic. In the same column, table b line 1, Eq G stands for Equatorial Guinea. In same column, table a line1, DR, Congo stands for Democratic Republic of the Congo.
Publisher’s Note: MDPI stays neutral with regard to jurisdictional claims in published maps and institutional affiliations.

