1. Introduction
Unsafe drinking water contributes to diarrheal disease and is a major cause of morbidity and mortality in low-income contexts, especially among children under five years of age [
1]. In spite of decades of work to improve access to safe water, an estimated 1.8 billion people worldwide still rely on microbiologically contaminated water sources [
2]. In sub-Saharan Africa, as of 2017, only 58% of the population had access to at least basic drinking water services, and over 90 million people still relied on surface water as their source for drinking water [
3]. In Rwanda, access to “improved” water sources—those that are constructed to protect against contamination but not guaranteed to be free of fecal matter—increased by 18% from 1990 to 2015, with coverage at 78% in 2015 [
3]. Access to a basic drinking water service—an improved source less than 30 min round trip, including queuing—in Rwanda increased from 47% in 2000 to 57% in 2015 [
3].
In spite of this progress, unsafe water remains a leading risk-factor for disease in Rwanda, where diarrheal diseases cause an estimated 10% of total child mortality [
1]. A recent, nationally representative survey of household drinking water quality found that fecal contamination of water at the point of use is widespread in Rwanda. While 25% of household drinking water samples met the World Health Organization (WHO) guideline of no detectable thermotolerant coliforms (TTC), 42.5% of samples exceeded 100TTC/100 mL [
4] and were therefore considered of high risk to human health.
A 2015 systematic review found that, while source-based water quality interventions are not protective against diarrhea, household filters contribute to a 52% reduction in diarrheal disease. This reduction was greatest in trials of household filters combined with safe storage containers [
5]. Although these findings support the use of household water treatment in households relying on unsafe water and a wide range of such interventions have been implemented in sub-Saharan Africa, the practice of household water treatment remains low in the region. A recent analysis of the Demographic and Health Survey data collected from 2013 to 2016 in 23 sub-Saharan African countries found that, while 29% of households reported using unimproved drinking water sources, only 18% reported using an adequate treatment method—bleach, boiling, filtration or solar disinfection [
6].
Given the persistent challenge of unsafe drinking water in Rwanda, household water treatment presents a viable option for reducing microbiological contamination of drinking water at the point of consumption and thereby reducing the risk of diarrhea. Previous water quality interventions in Rwanda have demonstrated varying adoption rates, health impacts, cost-effectiveness, scalability and sustainability [
7,
8,
9,
10]. This process evaluation explores the viability of incorporating a proven household water filter into a low-touch, government-endorsed initiative that relied upon community health clubs to support household-level adoption of recommended behaviors to improve health.
Study Objectives
The primary objective of the study was to determine whether the membrane-based household water filter could be integrated successfully into CBEHPP, as measured by: (1) coverage—the filters reach the target population; (2) use—household members adopt the filter and use it consistently and correctly; (3) drinking water quality—the filter produces safe drinking water over a two-year period; and (4) caregiver reported childhood diarrhea. In addition to this overarching objective, the study also aimed to determine if distributing and promoting use of the household filter could lead to higher uptake of household water treatment practices than the promotion of water treatment (boiling or chlorination) and safe handling practices alone. Finally, the project design hypothesized that the integration of the filter into CBEHPP could achieve meaningful water quality and health impacts in a less resource- and time-intensive manner than Tubeho Neza.
This paper reports on the findings of the process evaluation, including measures of the first two indicators, coverage and use, as well as a discussion of the effectiveness of integrating the household water filter into CBEHPP in comparison with other water filter programming in Rwanda. Subsequent publications will report on the third and fourth indicators, water quality and health impact, from the RCT.
2. Background
Household-level water treatment interventions have previously been deployed in Rwanda to address microbial contamination of drinking water. In 2014, the Tubeho Neza Program, a joint venture between the UK-based company DelAgua Health and the Rwanda Ministry of Health, distributed more than 100,000 membrane-based household water filters in the Western Province of Rwanda. This distribution took place over four months and focused on reaching families in the two lowest income groups—Ubudehes—in intervention villages. Tubeho Neza engaged Community Health Workers (CHWs) for filter distribution and household-level education. This education included culturally appropriate and locally informed behavior change messaging [
11]. A randomized controlled trial (RCT) of Tubeho Neza found a 38% reduction in the prevalence of households with detectable fecal contamination in drinking water and a 29% reduction in the prevalence of caregiver reported childhood diarrhea one year after filter distribution [
7]. The water filter was associated with a significant decrease in parasitic Cryptosporidium exposure 6–12 months after filter distribution, as measured by blood samples indicating serologic response (relative risk [RR]: 0.62, 95% confidence interval [CI]: 0.44–0.89) [
12].
The Community Based Environmental Health Promotion Program (CBEHPP) is another large-scale public health intervention in Rwanda that relies upon behavior change communication to support the uptake of household water treatment and other environmental health and personal health and hygiene behaviors. CBEHPP was launched by the Rwanda Ministry of Health (MoH) in 2009 and is ongoing. The program relies upon village-level Community Health Club (CHCs), which are led by volunteer facilitators. CHCs are open to all households in a given village and do not have other entry requirements. These CHCs hold weekly meetings, during which the facilitators provide in-person instruction on twenty topics and assign homework for households to complete outside of the meetings. While the reliance on CHCs is consistent throughout CBEHPP, the program has various funding elements and activities, and each element has a specific emphasis or focuses [
13].
In 2013, a randomized, controlled trial (RCT) was conducted on 150 randomly selected villages in Rusizi District, Rwanda, in order to assess the effectiveness of CBEHPP and its community health clubs. In this trial, 50 villages received a full intervention of twenty CHC meetings; 50 villages received a light intervention consisting of eight CHC meetings; and 50 villages had no CHC meetings. The study found no statistically significant differences in the prevalence of caregiver-reported diarrhea in children under five between the three groups [
8].
The health impact findings of the two Rwanda-based studies contrast each other. The use of household-level education and behavior change communication in combination with an effective household water filter resulted in improved water quality and health, while no positive health impacts were found to be attributable to education and behavior change messaging alone. With CBEHPP ongoing in Rwanda, these findings pointed to an opportunity to integrate these interventions in a way that could demonstrate health impact through the on-going CBEHPP program by incorporating the membrane-based household water filter used in Tubeho Neza with the CHC approach as it was applied in CBEHPP. In concept, the integration of this water filter and associated behavior messaging and support into a national program with the support and engagement of the Ministry of Health would enable a more impactful, sustainable and scalable intervention.
3. Study Context
CBEHPP is implemented on behalf of the Rwanda Ministry of Health through contracts supported by USAID and other funders. Within CBEHPP, the Integrated Nutrition and WASH Activity Program, branded as the Gikuriro program, was a five-year (2015–2020), USAID-funded integrated nutrition and water, sanitation and hygiene (WASH) program led by a consortium between Catholic Relief Services (CRS) and the Netherlands Development Organization (SNV). The purpose of Gikuriro was to improve the nutritional status of children under five years of age and women of reproductive age. Toward this end, the key activities were capacity building and delivery of nutrition and WASH services. The WASH-related activities followed the standard CBEHPP program model, and CHC facilitators were responsible for educating households on WASH behaviors, with boiling or chlorination as the preferred household water treatment method, accompanied by safe storage [
13].
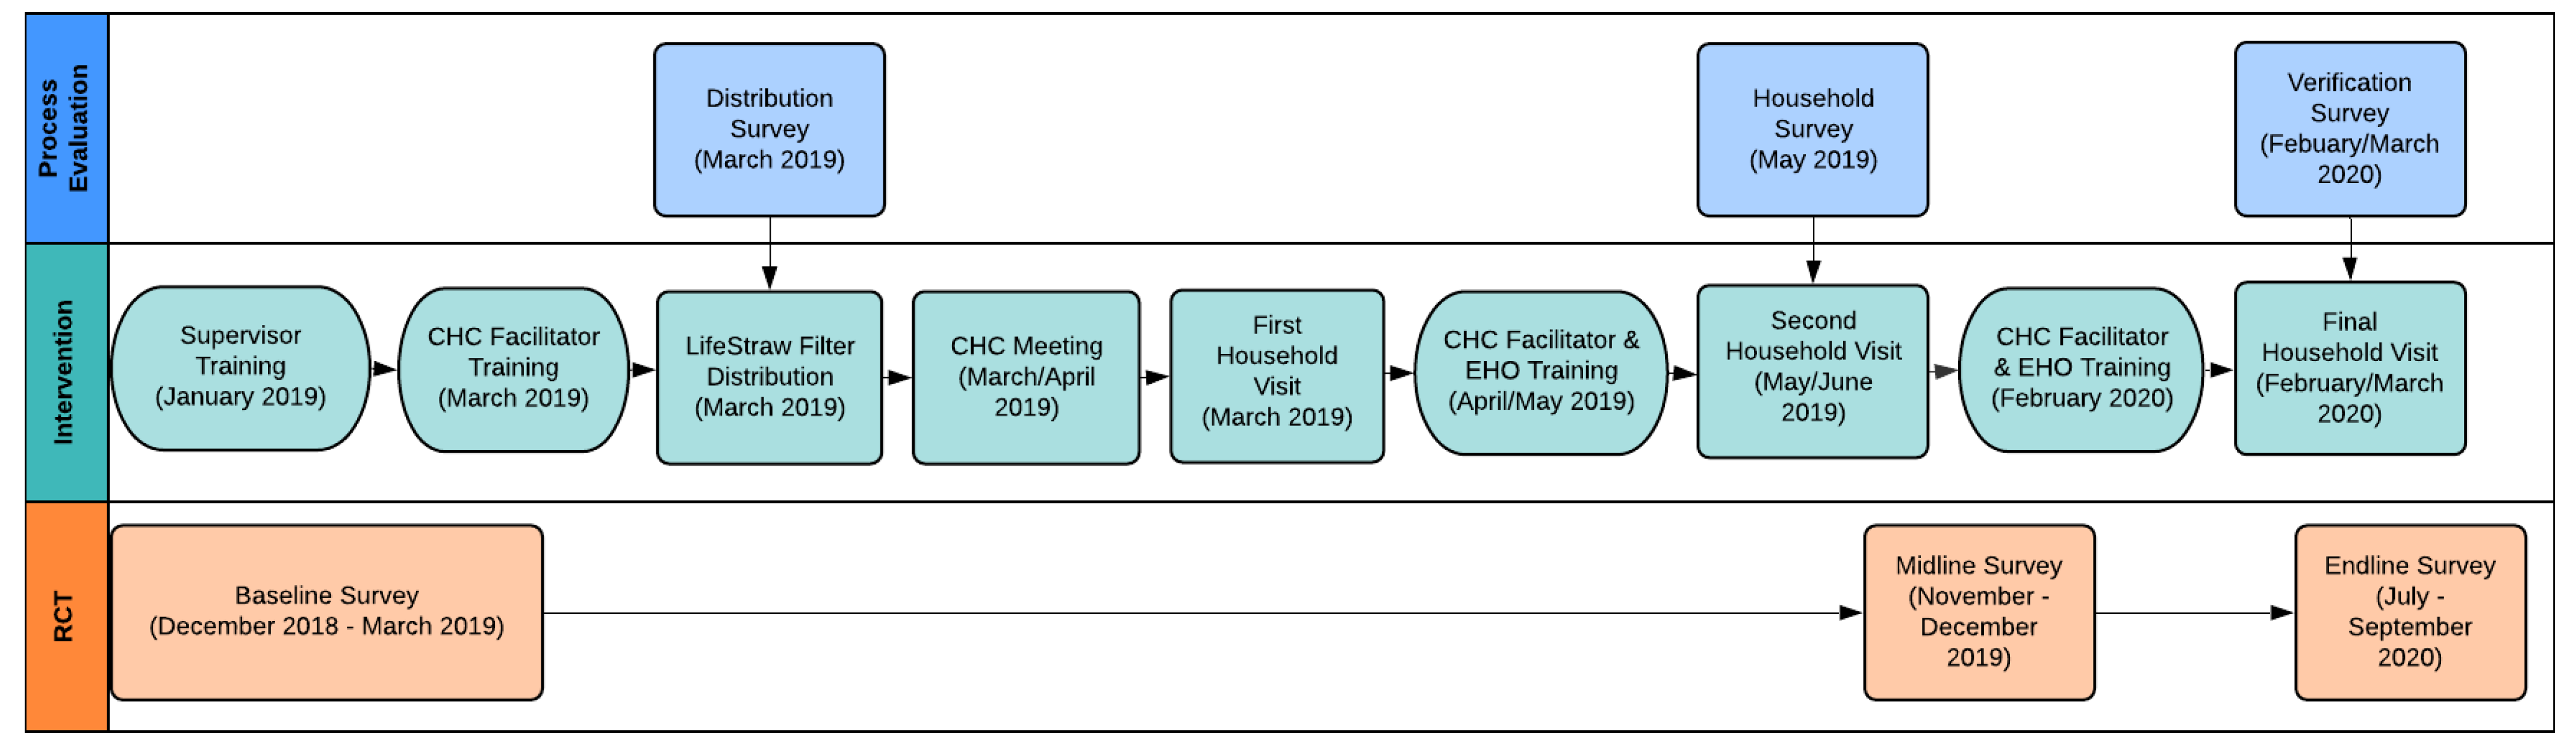
Given the WASH focus of Gikuriro, this program was selected to apply the integrated approach—household water filters and CHCs—while running a concurrent study to determine the effectiveness of this integration. In short, distribution of the filter and support of its use was to be incorporated into the ongoing Gikuriro activities that were focused on WASH education through CHCs, with an RCT and process evaluation to be run in parallel. The RCT was carried out from December 2018 through September 2020; the process evaluation took place from February 2019 through May 2020. Together, the RCT and process evaluation will be referred to as the study.
The study took place in Rwamagana, one of the eight districts in the Eastern Province where Gikuriro was implemented [
13]. Rwamagana is immediately to the east of Rwanda’s capital city Kigali and, in 2012, had a population of around 313,000 people [
14]. In Rwamagana, CRS and SNV collaborated with the local NGO African Evangelistic Enterprise (AEE) and relevant district authorities for program implementation.
A baseline survey conducted by CRS and SNV at the beginning of the Gikuriro program found a mean household size in Rwamagana of just over 5 people (mean: 5.2, Std. Dev. 1.8, n = 1001) [
15]. Of the households surveyed in Rwamagana for a subsequent Gikuriro program report, 37.4% self-reported as being in Ubudehe 1 or 2. The Ubudehe system designates household socioeconomic status as falling within four categories, with Ubudehe 1 covering the poorest households and Ubudehe 4 the most affluent households [
16]. For broader context, the 2016–2017 Fifth Integrated Household Living Conditions Survey (EICVs) conducted by the National Institute of Statistics of Rwanda (NISR) found that Rwamagana had the fourth lowest poverty rate of Rwanda’s thirty districts [
17].
The 2016–2017 EICVs found that 88.3% of households in Rwamagana relied on improved drinking water sources as their main source of water. Protected springs were the most common improved water source, with 48.8% of households reporting that as their primary source. Public standpipes were relied upon by 28.8% of households, while only 10.7% of households had water that was piped into the dwelling or yard. With regards to unimproved water sources, 7.6% relied primarily on surface water, 0.4% on unprotected springs, and 3.7% on other water sources.
Rwamagana was found to exceed the national average with respect to the% of households that had received information about environmental issues—90.2% of households in Rwamagana as compared to 81.4% in Kigali. Of those, the majority (66.5%) had received this information from meetings or trainings, with the remainder (33.5%) learning of these issues from the radio or TV. This implies a general familiarity with the use of meetings and trainings for the distribution of environmental and public health messaging [
18].
In recent years, Rwamagana District has performed well in regards to Imihigo, which consists of annual, District-centered performance targets to accelerate the social and economic development of the Rwandan population. Imihigo has been implemented since 2006 and includes multiple targets across different aspects of well-being, with access to clean water being one key indicator. Rwamagana District was at the top of all of Rwanda’s 30 districts in Imihigo for fiscal years 2016–2017 and 2017–2018 [
19].
4. Methods
4.1. Program Description
The study intended to integrate best practices regarding distribution and promotion of a household water filter developed during Tubeho Neza with the on-going CBHEPP program. With funding from the Gates Foundation, researchers at Emory University (the evaluators) contracted the Gikuriro Program to implement the water filter intervention (the implementers), with technical support from expert staff and researchers previously involved in developing and implementing the Tubeo Neza program (the authors of this paper and staff, together the promoters). In this arrangement, the implementers led the distribution of filters and training and supported CHC facilitators to educate and provide support to households on the use of the filters, while the promoters provided expertise, training and support to the implementers and conducted a process evaluation on the promotion and use of the water filter. The evaluators conducted an RCT on the intervention’s impact on water quality and health outcomes. We highlight these three roles throughout this process evaluation in order to identify and distinguish key organizational factors relevant to describing the observed outcomes.
Figure 1 describes the timeline and activities of each of these three elements—the intervention, the impact evaluation, and the process evaluation.
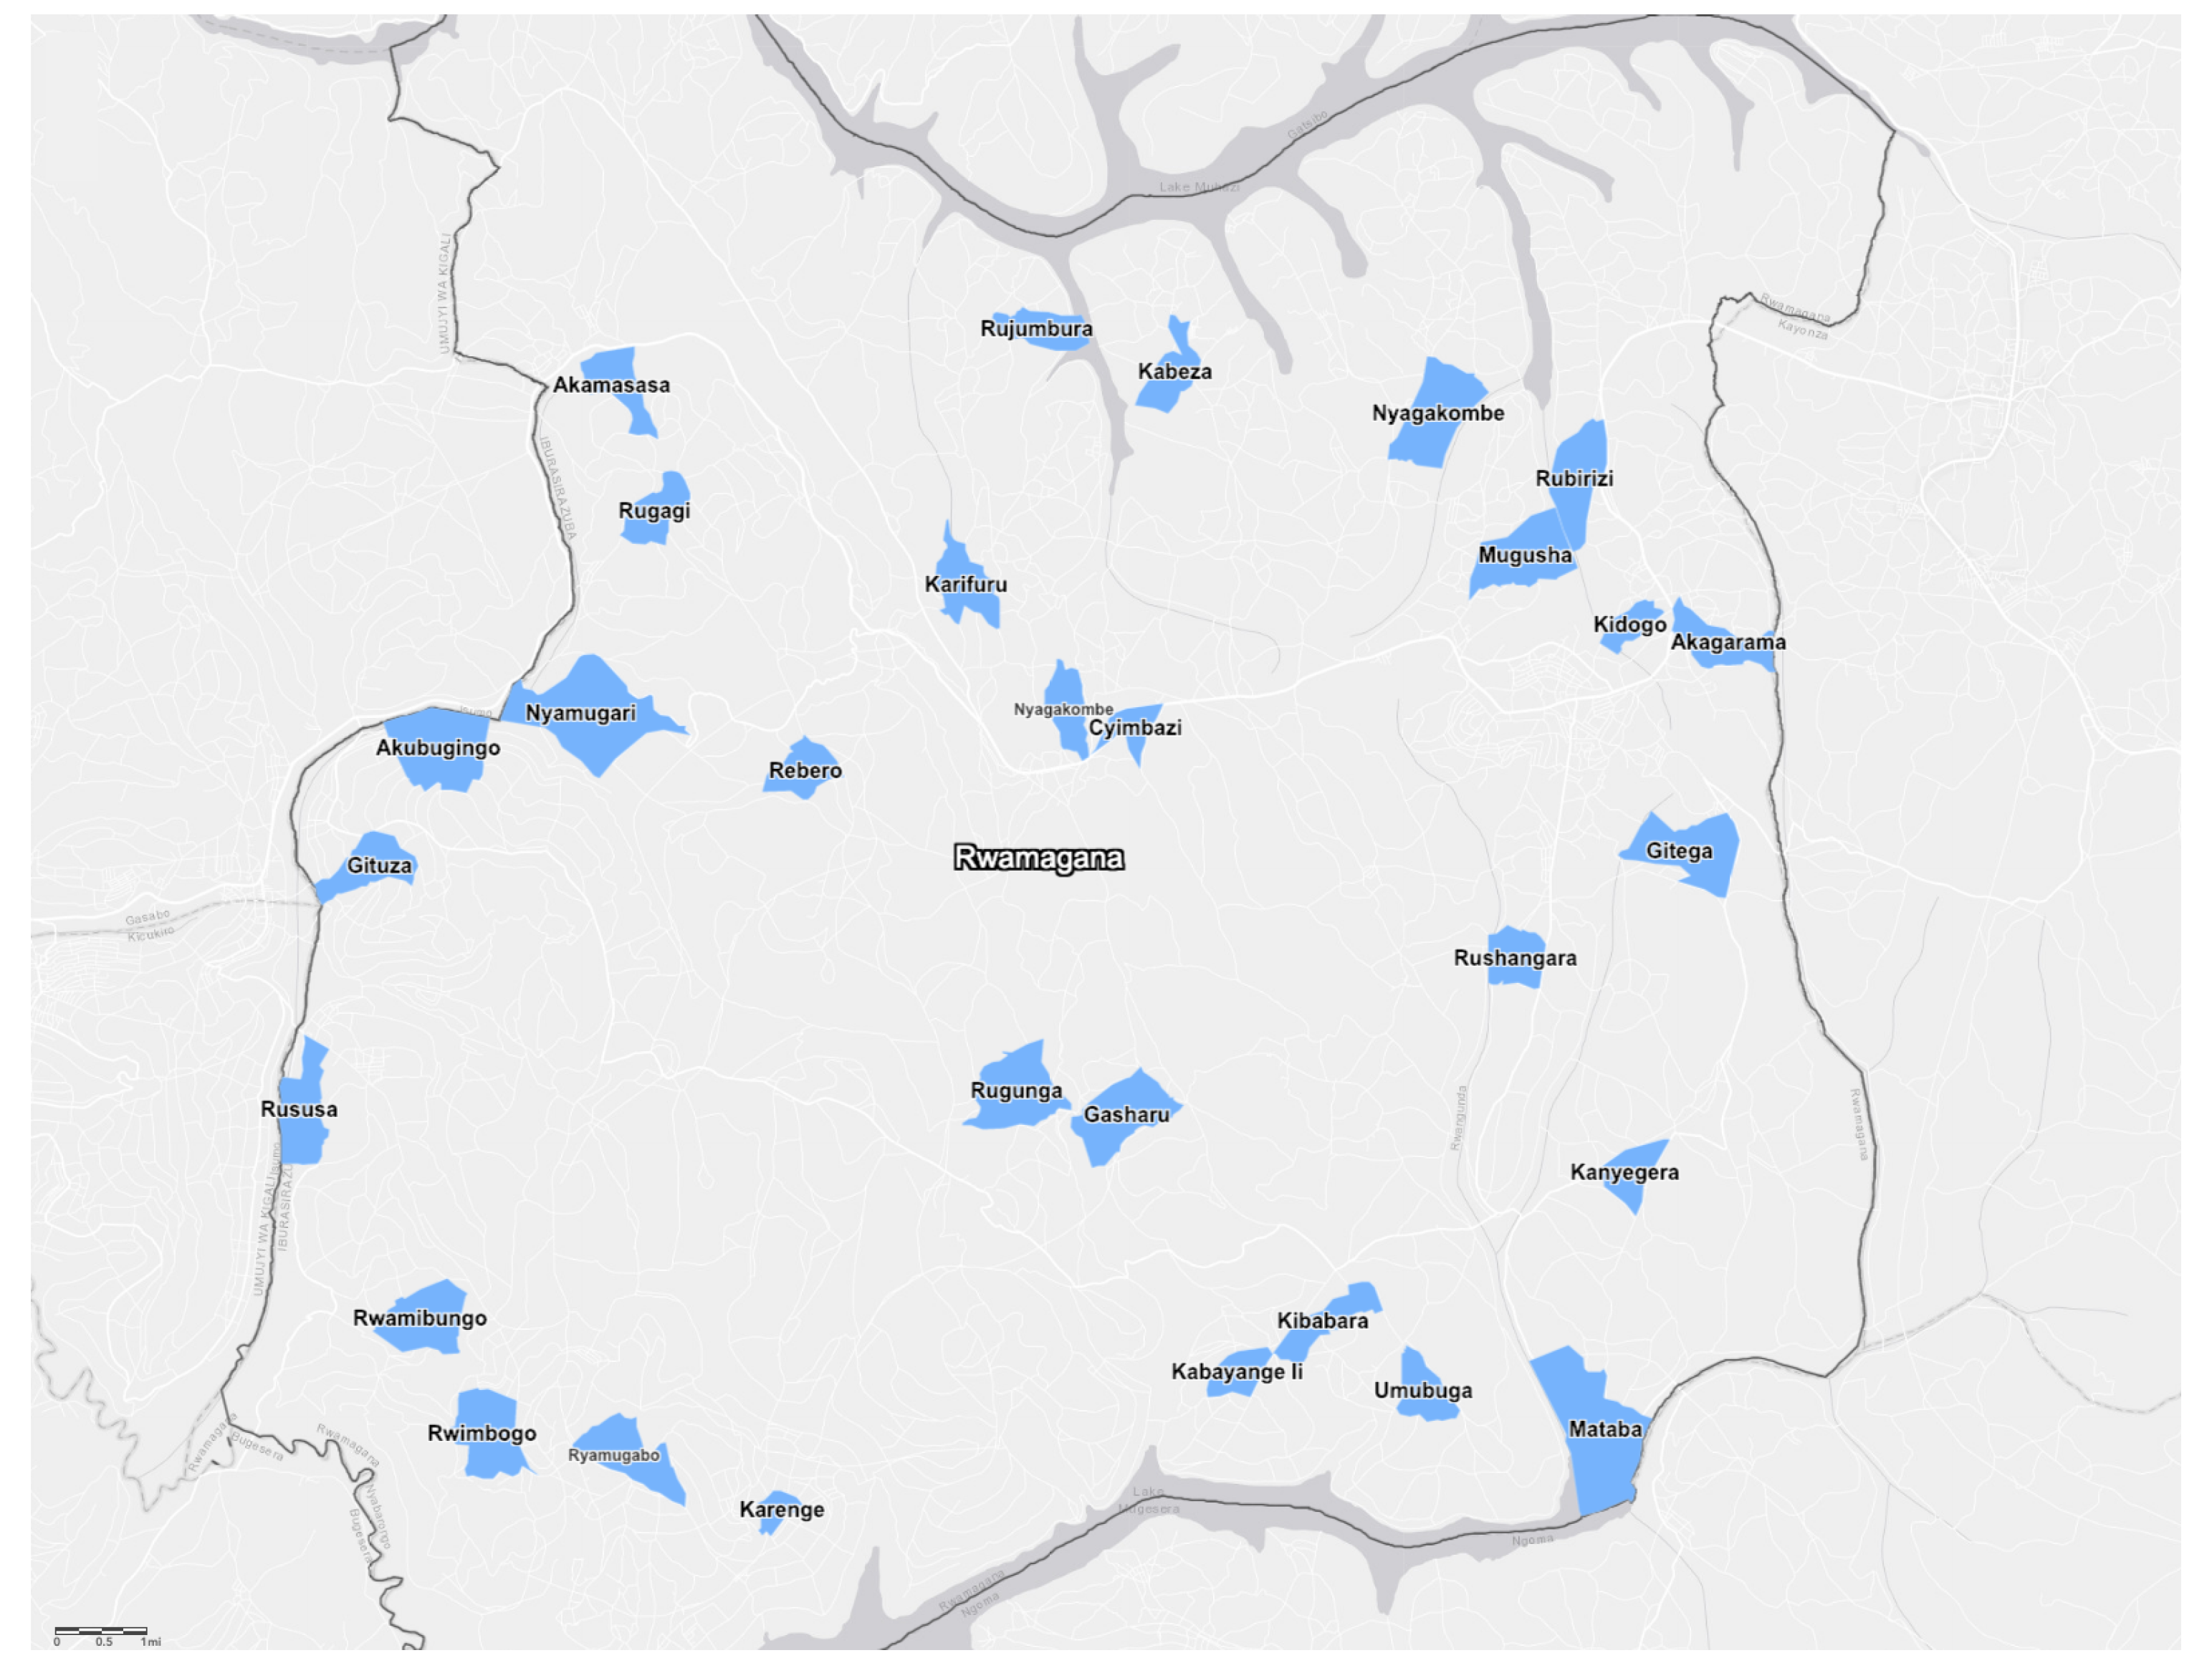
The cluster-randomized controlled trial led by the evaluators took place in sixty villages in Rwamagana District (
Figure 2). Thirty villages taking part in Gikuriro were randomly allocated to receive the filter, with the remaining villages serving as controls for one year after filter distribution in treatment villages. Within a treatment village, filters were to be distributed to households that: (1) were current members of the village’s community health club, and (2) had a pregnant woman and/or a child under five years of age within the household. This represented a subset of households participating in Gikuriro (signalled by membership in the CHC), with a focus on the program’s target population (children under five years of age and women of reproductive age).
After randomization of villages into treatment and control, the evaluators were not directly involved in detailed design or supervision of the intervention; however, the implementers and the promoters were operating under contracts and budgets provided by the evaluators. The implementers were responsible for leading the planning and execution of filter distribution, supporting CHC facilitators in CHC-level and household-level education and training on the filters, and carrying out monthly monitoring visits. The promoters were responsible for training the implementers on filter use and maintenance as well as survey data collection, providing education and training materials to support CHC facilitators and households in filter use and maintenance, and supporting implementers throughout the intervention.
4.2. Intervention Hardware and Software
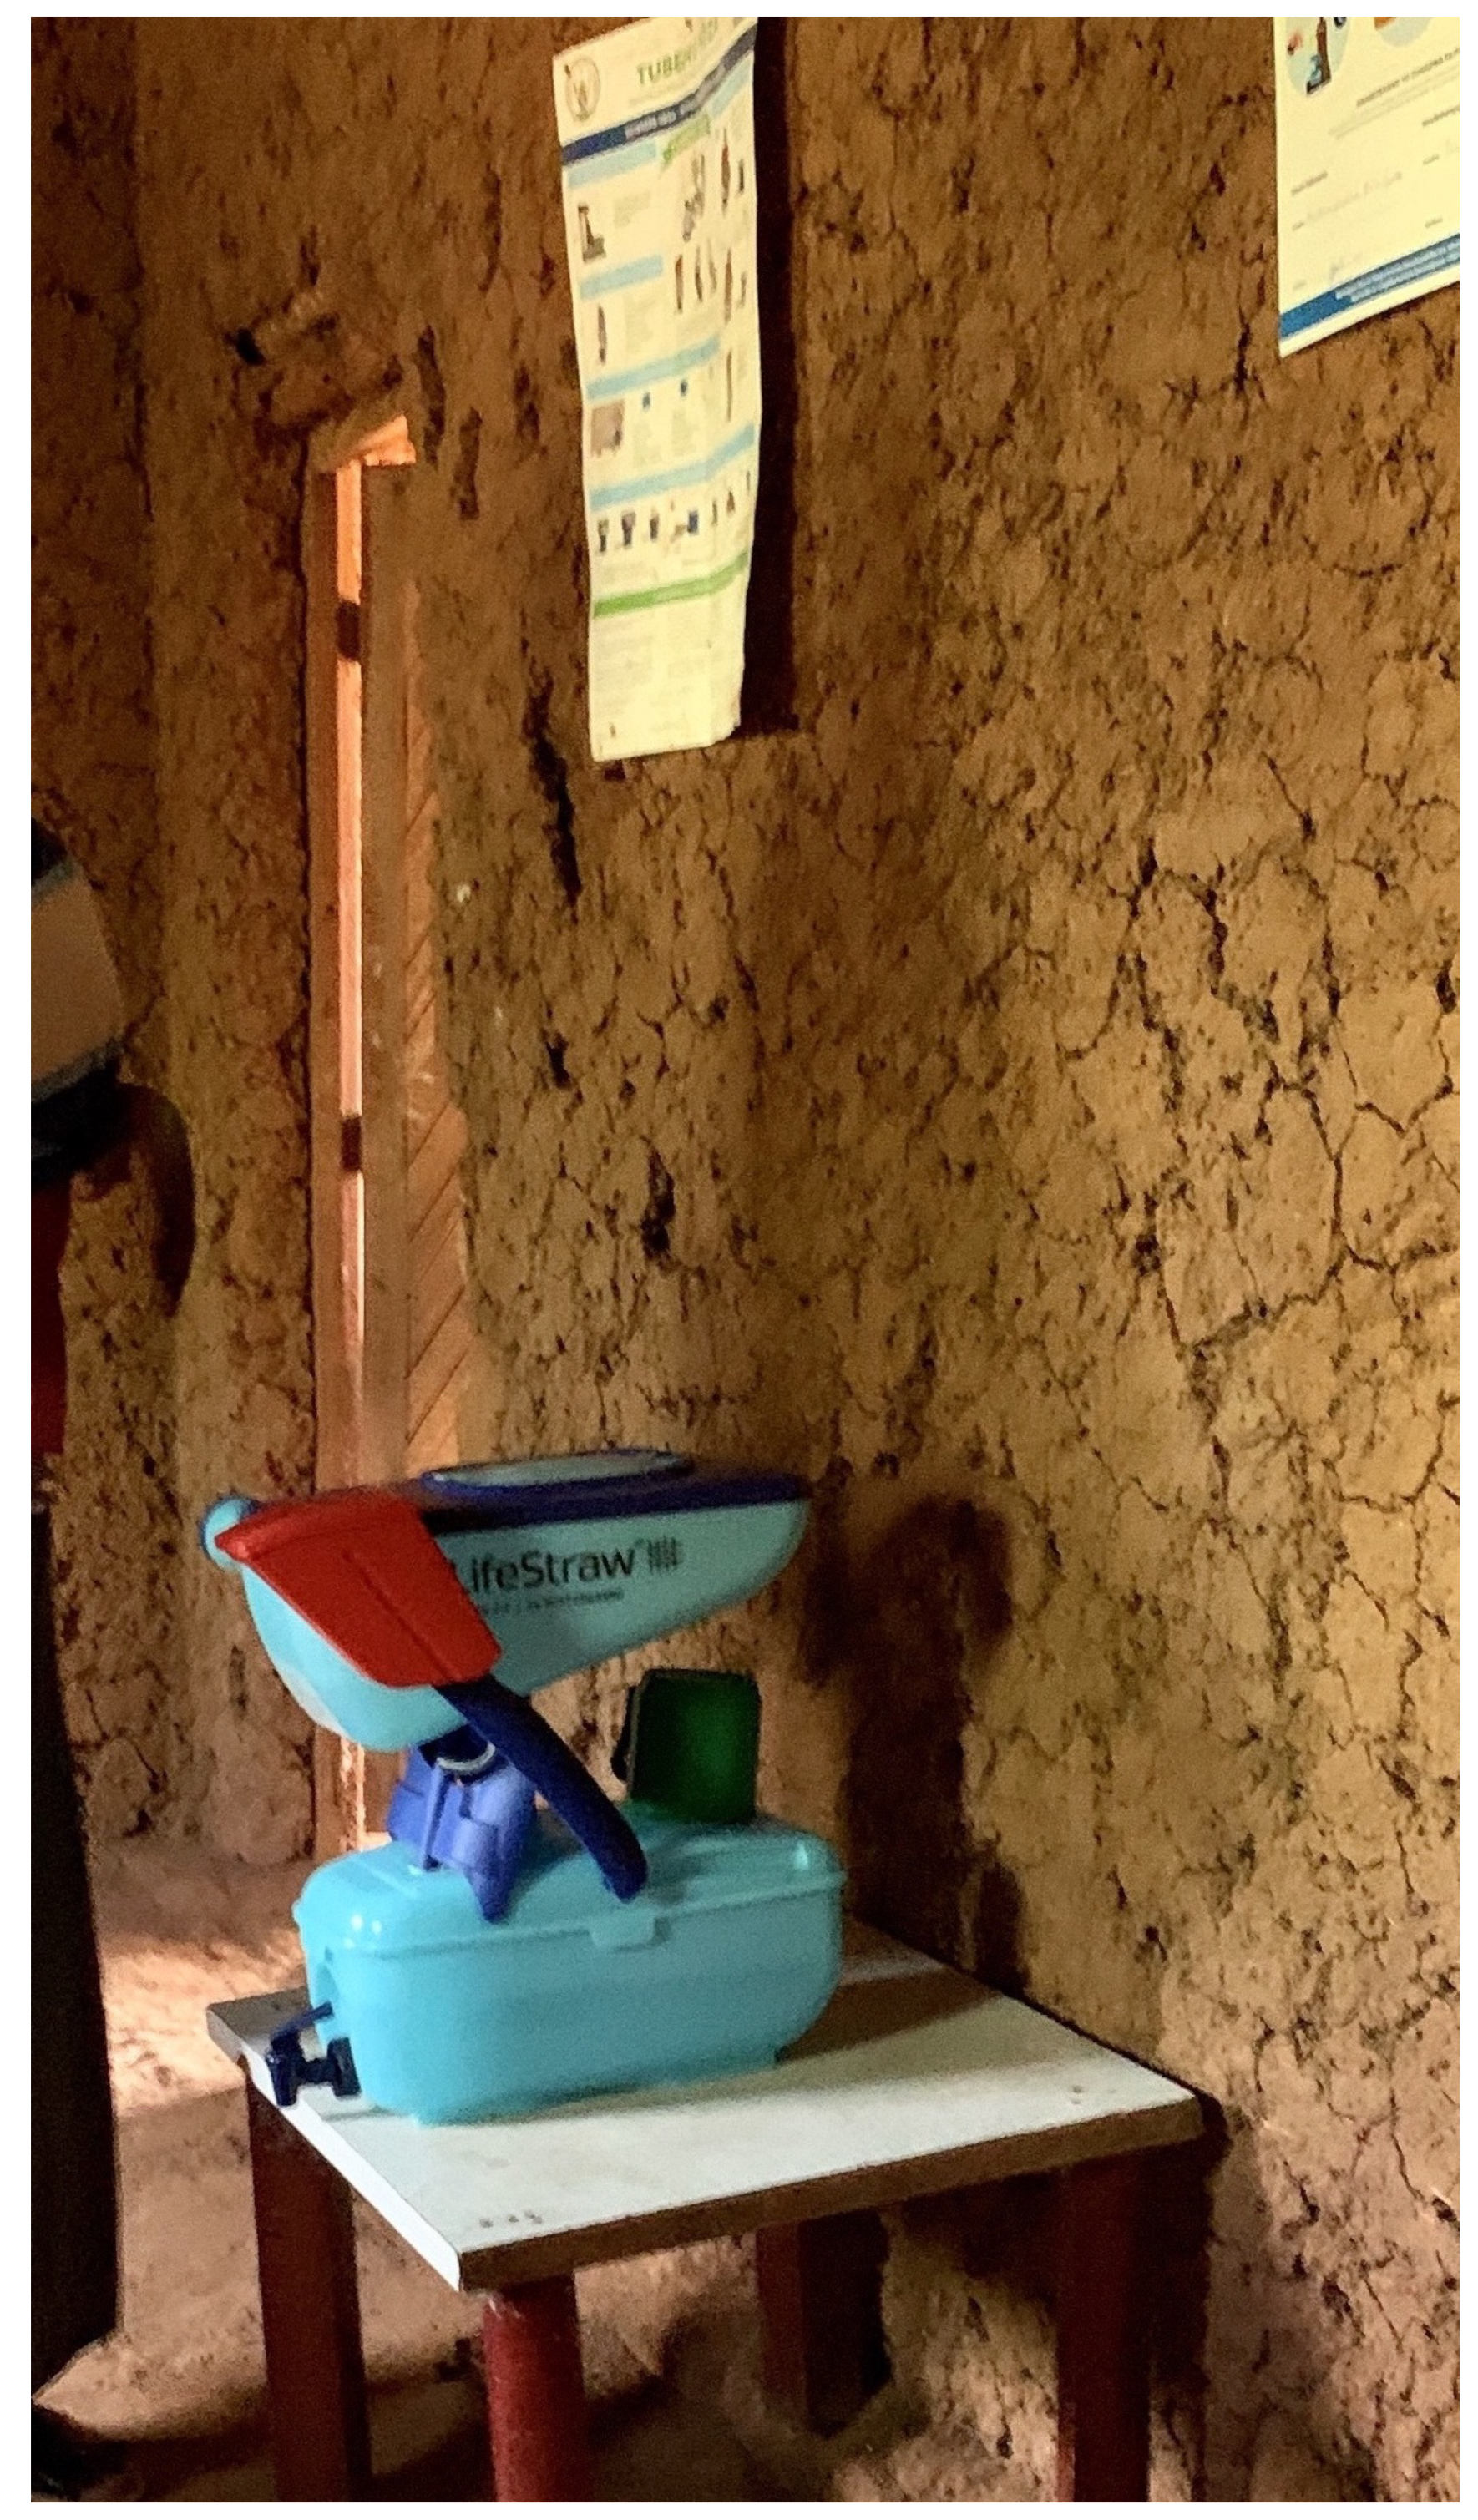
The intervention consisted of distribution of the Vestergaard Frandsen LifeStraw Family 2.0 household water filter, depicted in
Figure 3, and use of education and behavior change messaging materials developed to support households in the correct and consistent use of the filters.
The LifeStraw Family 2.0 is a gravity-fed membrane filter that removes microbiological contaminants via a 0.2-micron hollow-fiber membrane cartridge. This second-generation filter has been found to be effective in both lab and field studies. A laboratory evaluation of the filter cartridge found that it achieved 6-log reduction of bacteria, 5-log reduction of viruses and 4-log reduction of protozoa, achieving the USEPA standards for microbiological water purifiers [
20]. Additional testing under the WHO household water treatment evaluation guidelines found that the filter meets the “highly protective” rating [
21]. As noted previously, a cluster-randomized controlled trial of Tubeho Neza found that the filter intervention led to a 38% reduction in the prevalence of households with detectable fecal contamination in drinking water samples [
7].
With a treatment capacity of 18,000 L, the filter can provide safe water to a family of five for an average of 3–5 years. This provision of safe drinking water, however, is reliant upon the correct, consistent use of the filter. Toward this end, the intervention included interactive education and behavior change messaging materials for use by CHC facilitators at CHC meetings and during household visits.
Behavior change messaging materials were developed by the promoters, adapting the Gikuriro module on household water treatment and safe storage to include information on the LifeStraw Family 2.0. Prior to this adaptation, the module provided information on boiling and chlorination as means of treatment. The updated module included 45 min dedicated to the filter, which was intended for delivery specifically to CHC member households that had received a filter. This interactive, hands-on session would introduce participants to the filter parts and their functions, walk them through filter use and maintenance and then support them in carrying out all of these steps themselves. CHC member households in intervention villages that did not receive a filter were to still be trained on boiling and chlorination as treatment options.
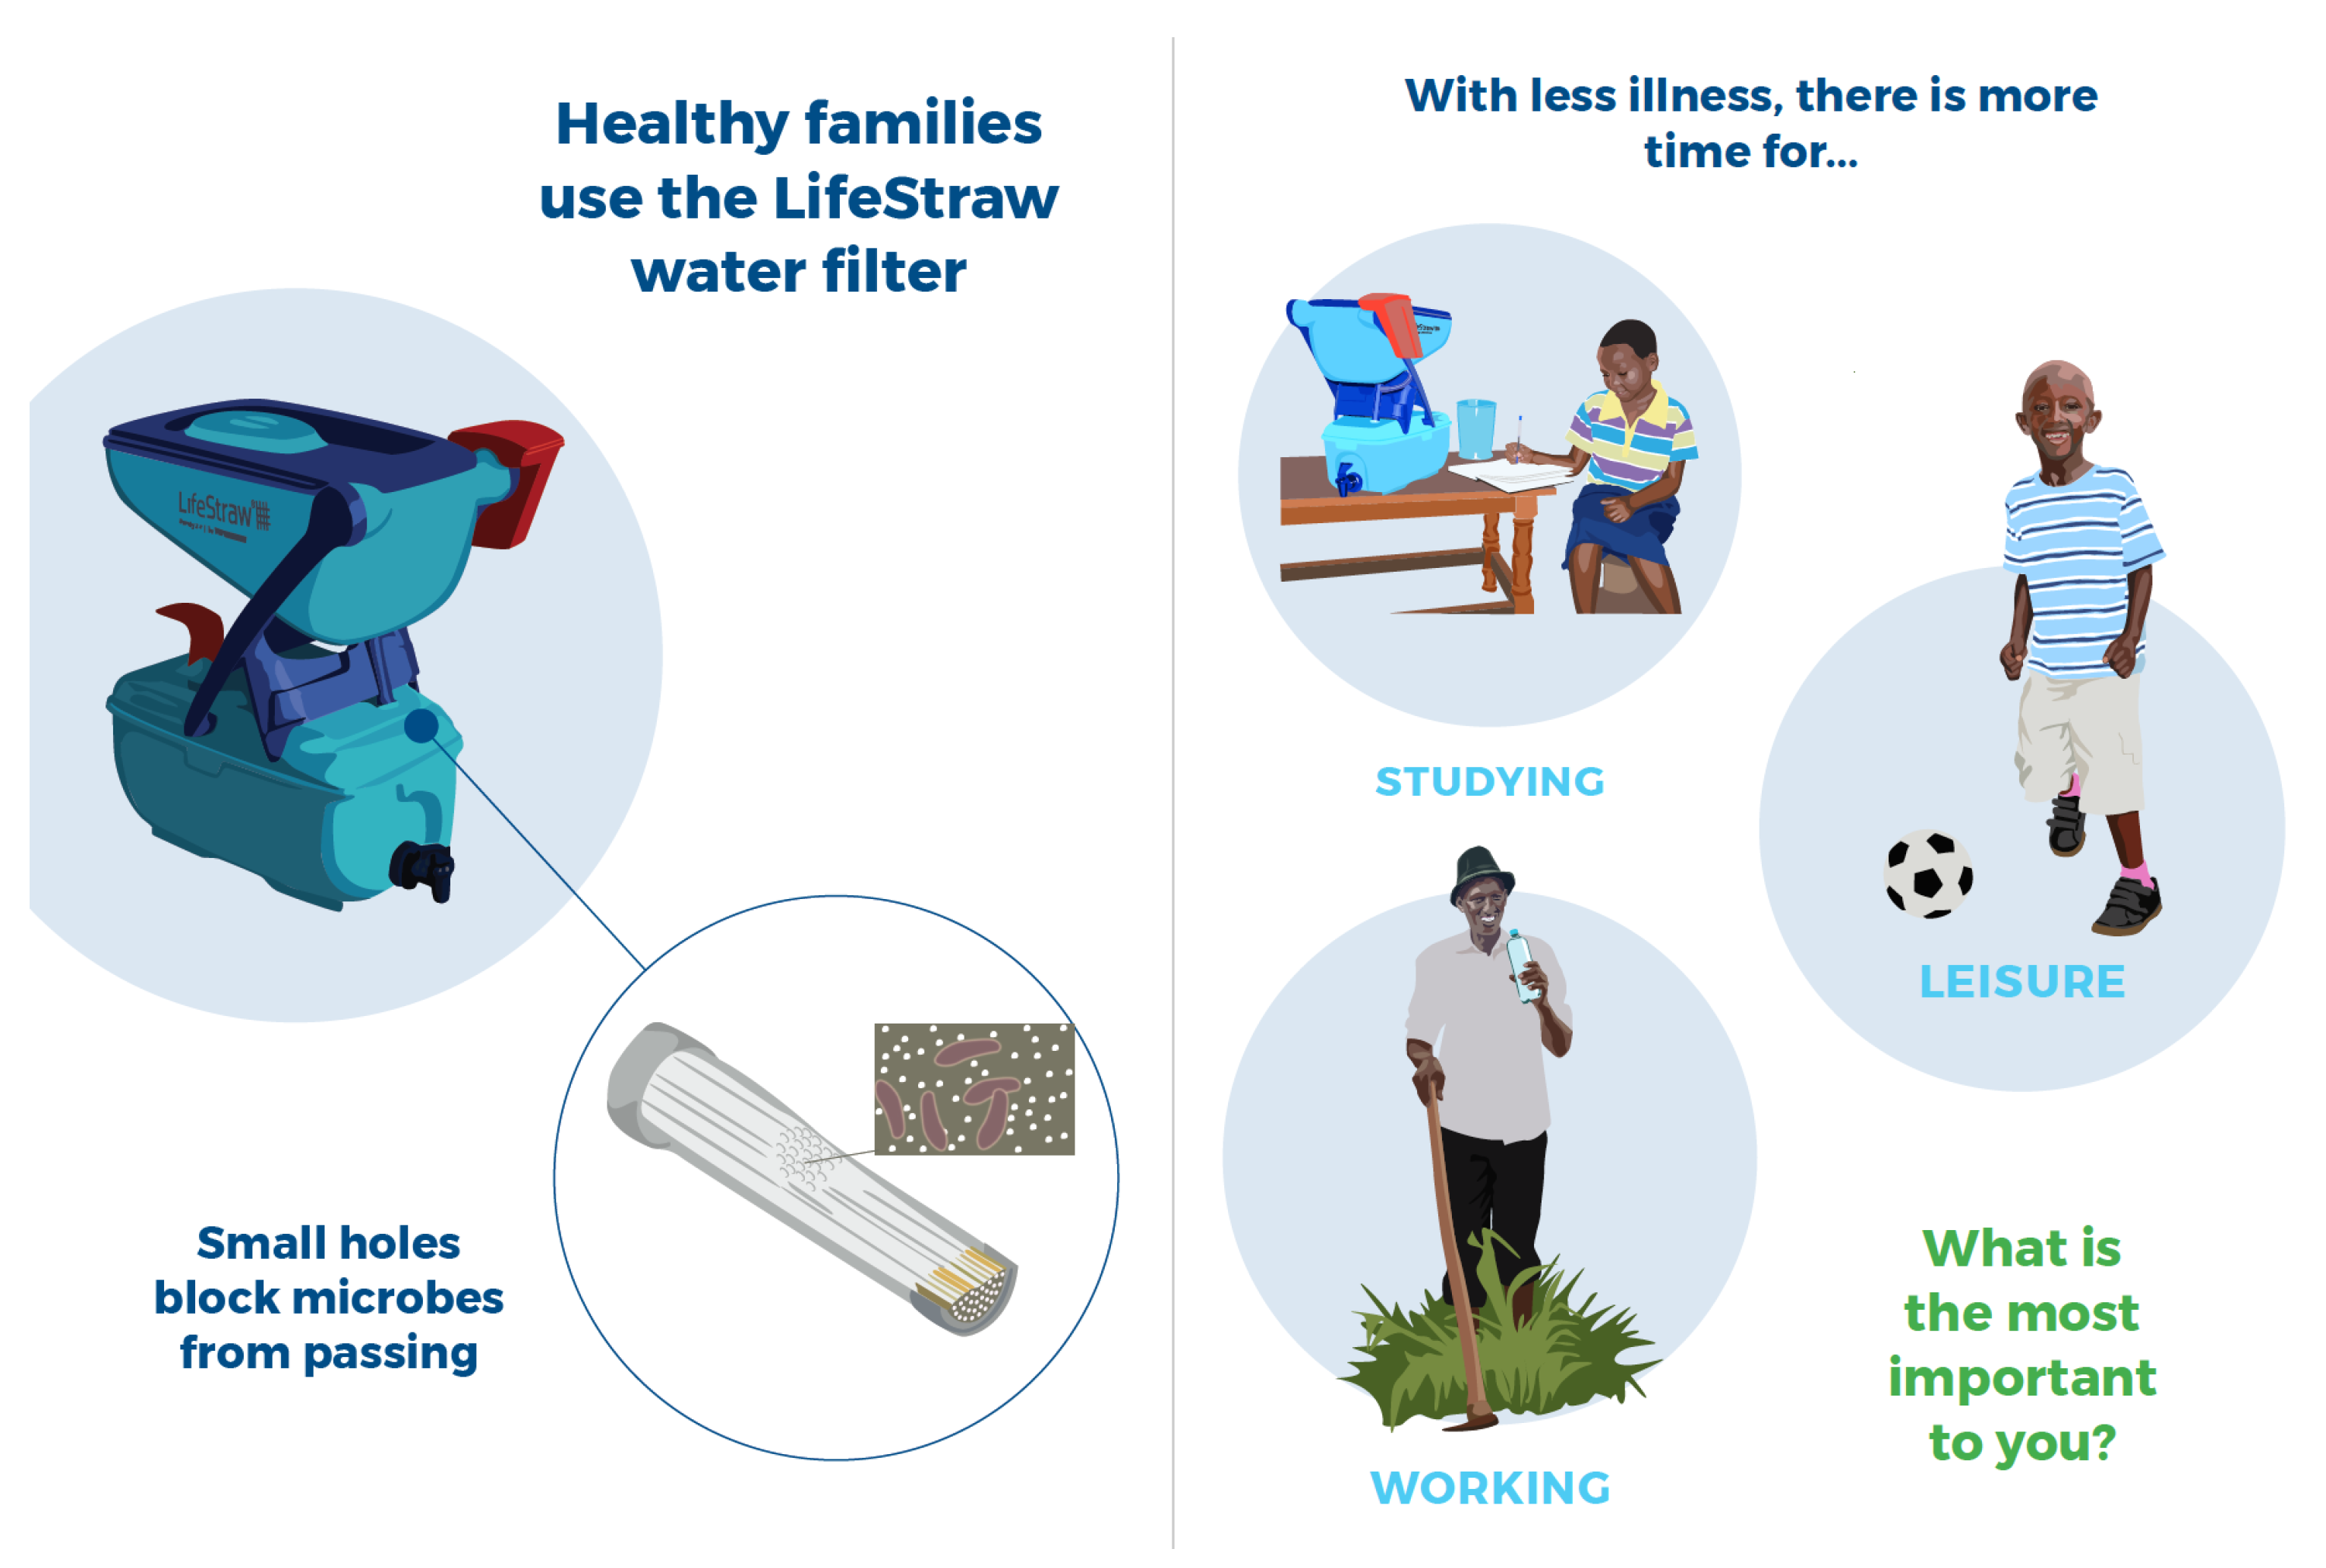
To support household visits, an illustration-based flipbook for facilitators and a customizable poster for households were adapted by the promoters from those developed for Tubeho Neza. The flipbook relied upon visually appealing and culturally appropriate images to support instructions on filter use and maintenance and to communicate key behavior change messages. The instructions were laid out step-by-step, prompting the CHC facilitator to carry each step out during the household visit and to have household members demonstrate these steps, as well. Example pages from this flipbook are shown in
Figure 4.
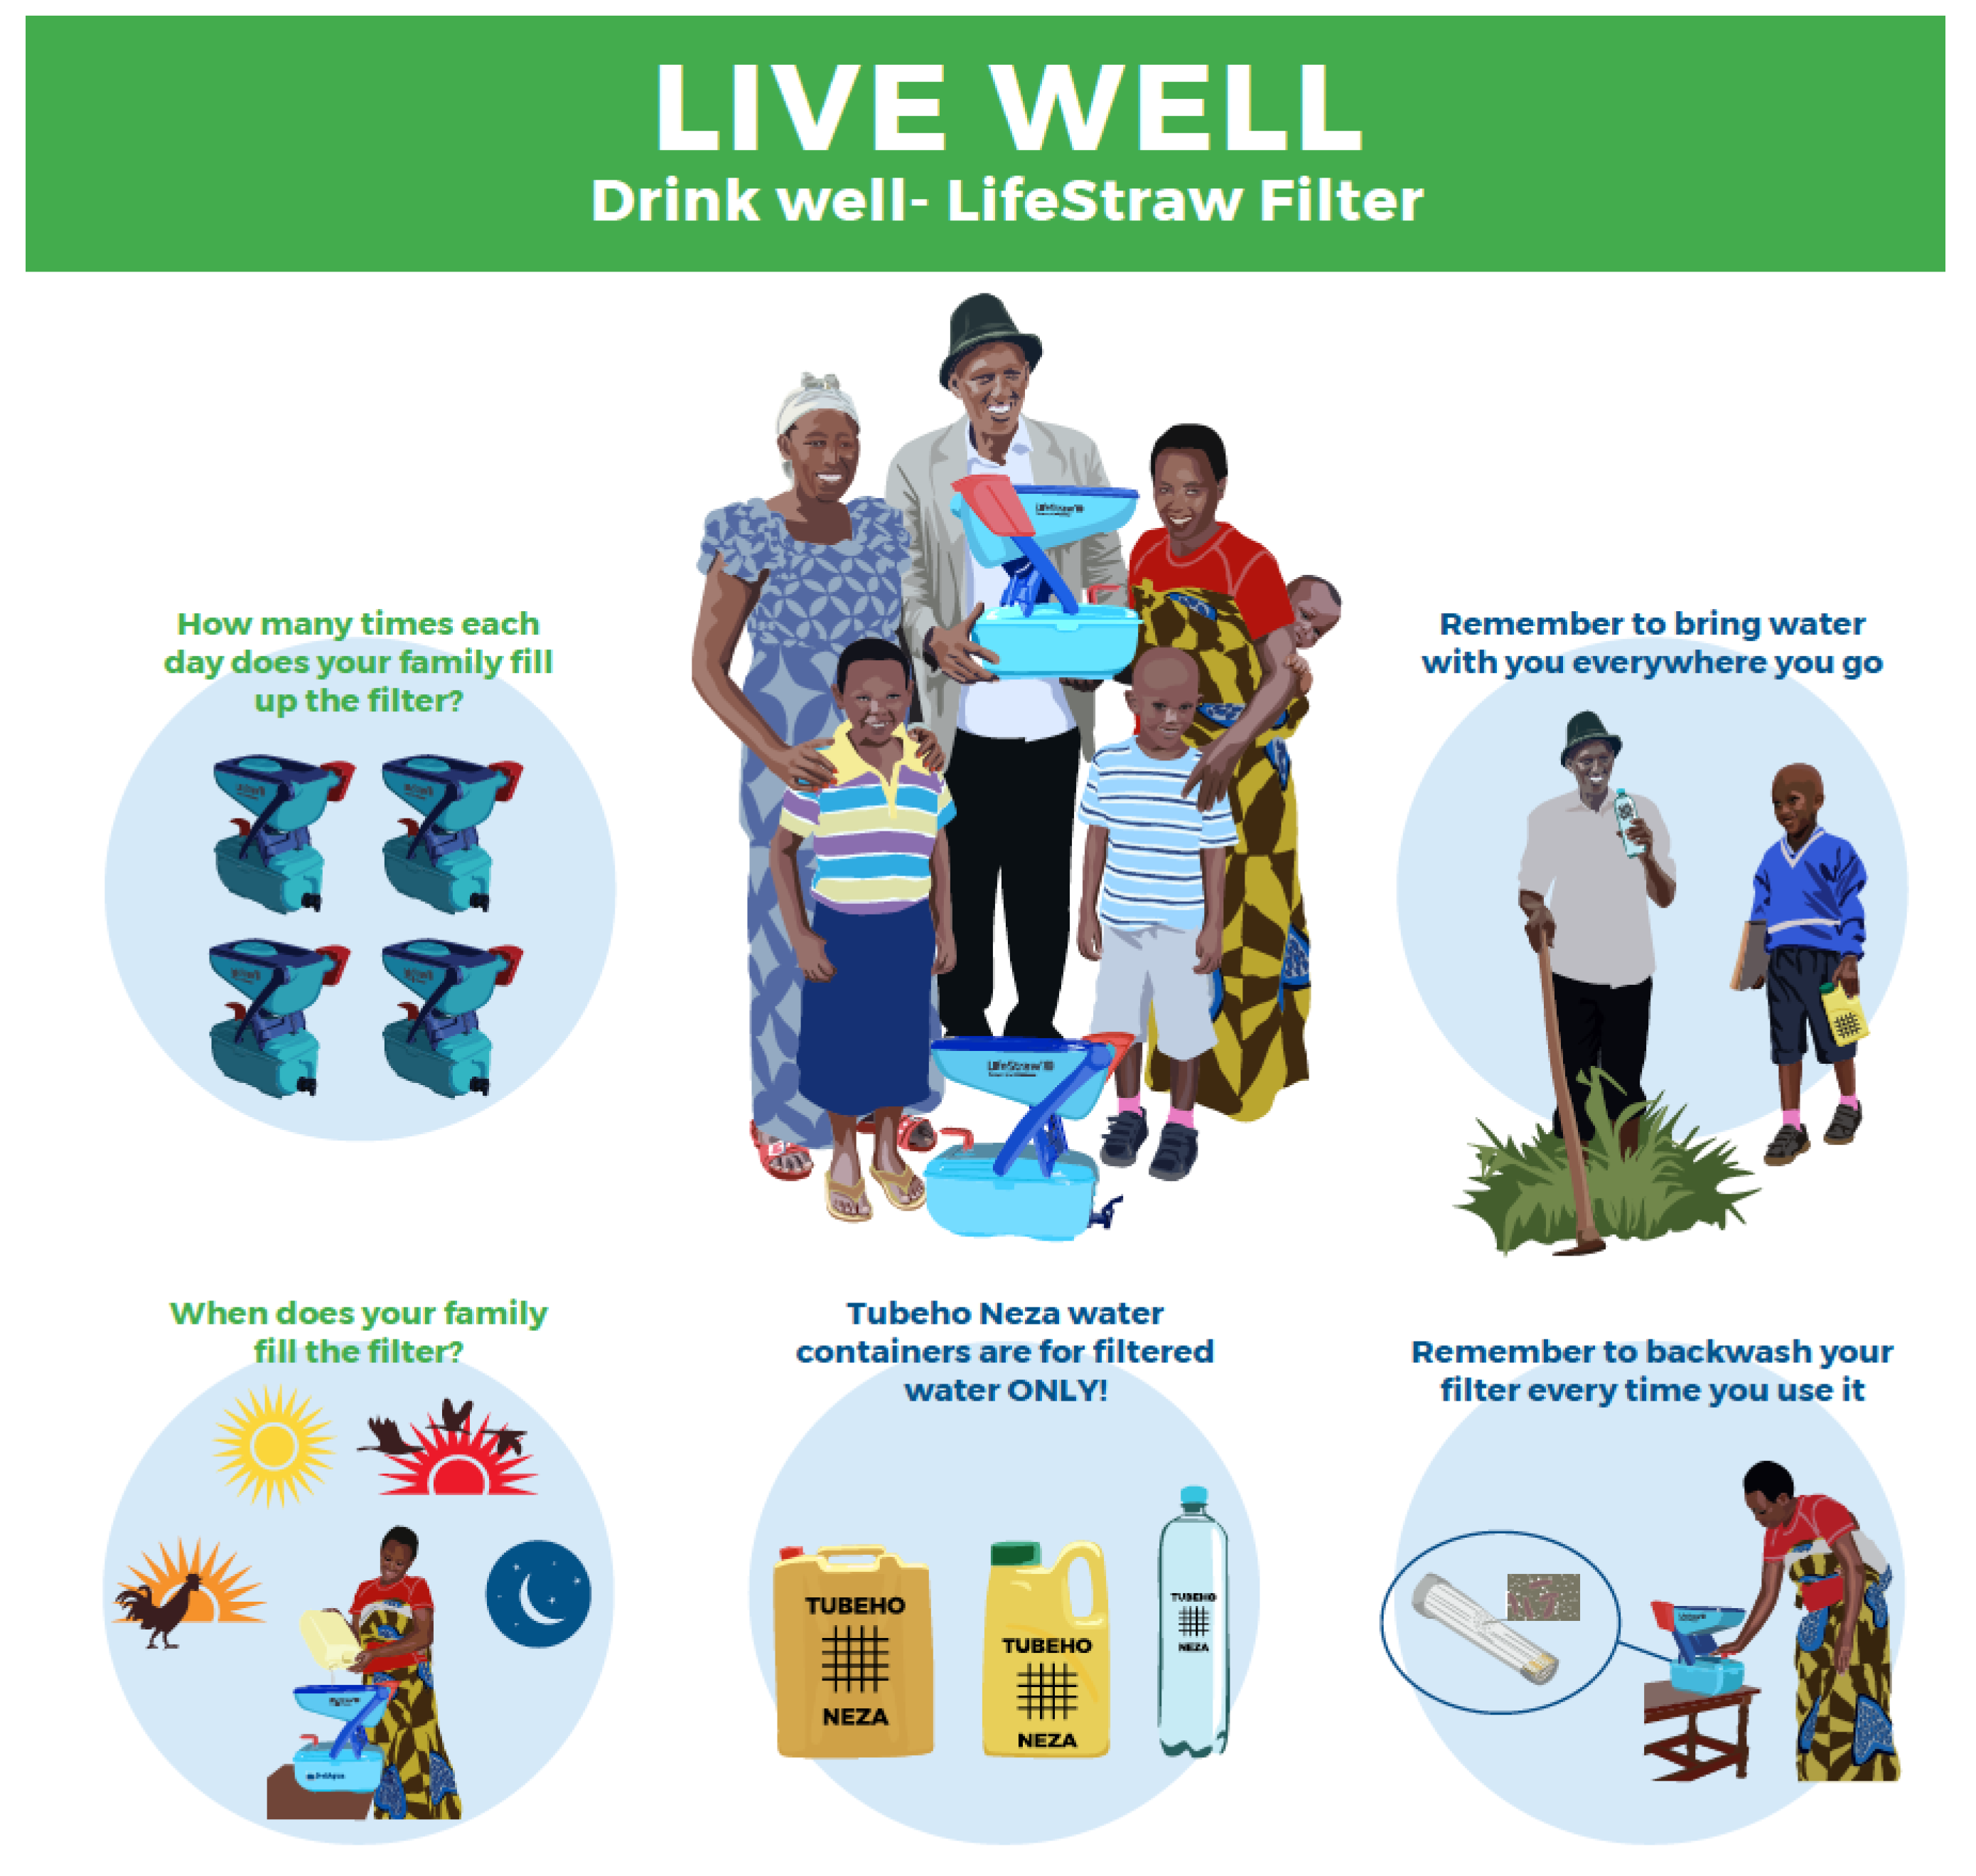
A poster was designed by the promoters for the facilitator to complete with the family during the household visit. The poster included several activities that would customize the poster to support the family in filter use and maintenance. For example, the CHC facilitator would use the family size and the recommended water consumption (2 L per person per day (LPPD)) to determine how many times the family should fill the filter each day, with the support of a calculation table. The facilitator would then circle the number of times on the poster to serve as a reminder to the family.
The poster also included an agreement for a household representative and the CHC facilitator to sign, committing to the care of the filter and not selling it. The AEE employee contact information was included at the bottom in the event that a household had issues with the filter that could not be resolved by the CHC facilitator. The poster, excluding the contract and contact information for the implementers is show in
Figure 5.
4.3. Distribution
Prior to filter distribution, the promoters held a one-day training for those who would be supervising the program and a three-day training for CHC facilitators. The supervisor training focused on filter assembly, use and maintenance as well as the flipbook and poster. The intention was to ensure that supervisors were familiar with the filter and the behavior change materials so that they could provide support to CHC facilitators not only during distribution events but throughout the program, including at the CHC meeting on household water treatment and safe storage and during subsequent household visits. Supervisors were identified by the implementers as well as selected from local government employees.
The CHC facilitator training brought together all thirty facilitators for three days of training. Facilitators would be responsible not only for training and support to families on filter use and maintenance but also for data collection during household visits. They had been assigned to the role of CHC facilitator prior to the intervention, based on their role in the community and not on a specific set of skills. For this reason, the trainers and training materials had to take into account a range of abilities including reading, familiarity with computer tablets and surveying skills.
The training was led by the promoters. The objective of the training was for CHC facilitators to master the use of the filter, familiarize themselves with the flipbook and poster for use in household education and behavior change, and become proficient with the survey application, survey questions and tablets for data collection.
For filter distribution and follow-up activities, the villages were divided into two clusters of fifteen villages each. Within each cluster, villages were grouped at the sector level, with seven sectors in each cluster, and a distribution point was identified for each sector. The majority of these distribution points were health centers or posts, with the remainder being cell-level government offices. The implementers provided the beneficiary list for each distribution point, based on the program’s inclusion criteria. Depending on the number of villages assigned to a distribution point and the number of CHC participants in each village; these lists ranged from 22 to 143 households.
Distribution events were scheduled to take place over the course of three to four days for each cluster. Two distribution facilitators were assigned to each distribution point, drawing from the promoters as well as the implementer supervisors that had been previously identified and trained. Each distribution event started with an introduction from the promoters, including an overview of the filter and instructions to wait to use the filter until after the CHC meeting on household water treatment and safe storage.
After the introduction, household representatives were asked to line up to receive the filters and provide basic information. This information was collected by CHC facilitators and supervisors using a distribution form on the tablets. At this time, the barcode for each filter was scanned to allow for matching of the household by the filter during follow-up household visits.
4.4. Community Health Club Meeting
The CHC meeting on household water treatment and safe storage was scheduled to occur within the first few days after the distribution of the filters. A promoter and/or implementer supervisor was assigned to each village to attend the CHC meeting and provide support to the CHC facilitator as needed. As noted above, households were instructed at distribution to wait to use the filters until after the meeting. In this way, the CHC facilitators could make sure that the households were familiar with the filter before use and that they discarded the first batch of filtered water, as recommended by the filter manufacturer.
During the meeting, households first learned about the safe water chain and the importance of safe water handling and storage from the point of collection to the point of consumption. Then, households were introduced to the basics of the filter and how it worked. The CHC facilitator demonstrated filter use and maintenance, relying on the flipbook for support and visual cues. After these demonstrations, households worked in pairs to practice these steps, with CHC facilitators and supervisors circulating to provide help as needed. The meeting ended with each household demonstrating how to correctly backwash the filter, the primary filter maintenance task.
4.5. Initial Household Visit
In the weeks following the distribution events and CHC meetings, CHC facilitators were assigned to visit each beneficiary household. The time needed to complete these visits ranged from one to three weeks, depending on the number of beneficiary households in each village. When visiting a household, the CHC facilitator would use the flipbook to review filter use and maintenance and reinforce key behavior change messages from the CHC meeting. At this time, the facilitator would also complete the poster with the household, and a household representative would countersign the commitment to filter care and possession.
4.6. Second Household Visit and Household Survey
Based on feedback and experience from the first round of household visits, the promoters perceived that the household education and training quality was lower than desired, attributable in part to limited availability of the supervisors originally identified by the implementers to provide oversight and support CHC facilitators in household visits. The promoters identified that Environmental Health Officers (EHOs) from the Rwamagana District would be well suited to provide the needed supervision, relieving the previously identified supervisors from these duties.
EHOs are assigned to sector-level health facilities and are familiar with the villages in their geographical area as well as skilled in regard to environmental and public health. Based on the location of the intervention villages and the support level needed by each CHC facilitator, thirteen EHOs and their assigned areas were identified as being best suited to supporting the CHC facilitators. To improve morale, the promoters decided that facilitators—and supporting EHOs—would receive a per-diem for each day of training and household visits.
The thirteen EHOs and the CHC facilitators they were assigned to support were broken into two clusters for training and household visits. For each cluster, a two-day training was held to ensure that EHOs had the necessary knowledge and skills to support CHC facilitators and to strengthen the knowledge and skills of facilitators. Only the EHOs attended the first day, which was a shortened version of the original three-day training. This training covered the tablets, the survey application and survey questions, filter use and maintenance, use of the flipbook and poster, and how to support CHC facilitators during household visits and survey data collection. CHC facilitators then joined for the second day, which focused on each EHO working with their assigned CHC facilitators to support them in reviewing and practicing filter use and maintenance as well as use of the flipbook and poster.
This second round of household visits took place in the weeks immediately following the training, with time to complete visits ranging from four days to fifteen days. During these visits, households were asked to provide the same basic information collected during distribution as well as to answer questions about water collection and treatment practices. This information was recorded in the mWater surveyor application on a tablet provided to each CHC facilitator. After this round of visits, CHC facilitators visited households on an as-needed basis to provide support. These later visits did not include data collection for the process evaluation.
4.7. Final Household Visit and Verification Survey
Prior to the final round of household visits and the verification survey, the promoters hosted a five-day training that reviewed the topics covered in the previous training and dedicated a majority of the time introducing and practicing the verification survey and providing hands-on training and experience in filter repair. CHC facilitators and EHOs were also taught how to clean the filter using a diluted bleach mixture. EHOs were first introduced to these topics over the course of the first day before CHC facilitators were brought in for four days of training. EHOs were strategically brought into this training on the second and fourth days to support CHC facilitators in applying the acquired knowledge and skills and to strengthen the working relationships between EHOs and CHC facilitators.
Household visits followed the training and were scheduled for completion within one to three weeks, with the time required to complete all visits again varying depending on the number of households each CHC facilitator was assigned and the extent of support provided by their respective EHO. During these visits, CHC facilitators were to complete the verification survey with a household representative and collect information on needed filter repair or replacement. The verification survey was anticipated to take 1 to 1.5 h and collected the following information: household characteristics, including poverty scorecard measures; water collection and treatment practices; reported and observed filter use; filter knowledge; and programmatic participation and support. This information was recorded in the mWater surveyor application on a tablet provided to each CHC facilitator.
4.8. Survey Methods
Data were collected at three points in the process evaluation: filter distribution, second household visits, and final household visits. The surveys corresponding to these points in time were the distribution form, the household survey, and the verification survey, respectively. For each survey round, the objective was to collect information from all intervention households as designated in the RCT being conducted by the evaluators. No such data was collected from control households for the purpose of the process evaluation.
For the most part, these surveys were completed by CHC facilitators. In instances when a CHC facilitator had physical or other limitations that affected their ability to conduct the survey and/or use the tablet for data collection, an EHO was either present to support the facilitator or to conduct the survey themselves.
All survey data were collected using the mWater Surveyor Application (
www.mwater.co) and stored on the online mWater Data Portal. Data were accessed and cleaned within the Data Portal before being analyzed using RStudio, an open source statistical software.
The verification survey included a poverty likelihood score. The poverty likelihood score, calculated using data collected in the verification survey, uses consumption as a stand-in for poverty likelihood. The poverty scorecard was formulated from the 2010/2011 EICVs and the questions were designed to be inexpensive to collect, strongly correlated with poverty, and applicable across Rwanda. The poverty scorecard is used to estimate the probability that the household has per-capita consumption below the Rwanda national poverty line. The national poverty line is calculated as “the average total consumption for households whose actual food consumption is within
of the food line” [
22]. The poverty scorecard includes questions about household composition, occupations, assets, and agricultural practices. Answers to each question are given point values (totaling between 0 and 100) which correlate to indirect conditions of poverty in a household and are calibrated with a poverty likelihood.
4.9. Ethics Approval
The Rwanda National Ethics Committee (No.224/RNEC/2020) and the University of Colorado Institutional Review Board (Protocol No. 20-0087) approved the protocol for the process evaluation by the promoters, including all survey questions and the consent procedure. Approval for the RCT by the evaluators was obtained separately. Data collected during the process evaluation was available only to the promoters.
Before the household survey, the respondent was given details on the purpose of the study and then asked if they consented to participate in the survey. It was made clear that consent was not required to be able to retain the filter and to receive training and support on filter use and maintenance. Respondents had to be 18 years of age or older to be able to consent to participate. Consent was written, so if the respondent could not read or write, a witness had to be present to review the consent form and sign on their behalf.
During the verification survey, CHC facilitators endeavored to survey the original consenting adult. If this was not possible, they completed the consent process with another adult member of the household who then responded to the survey questions. Completed consent forms were collected regularly by the supervising EHOs and then by the promoters for storage in a locked cabinet.
5. Results
5.1. Product Delivery
A total of 1023 LifeStraw filters were distributed across the 30 intervention villages in the initial distribution events. These households included 5248 people with an average household size of 5.24 people and 1.1 children under five years old (
Table 1). Some households missed the community distribution events and thus were not included in the distribution survey. These households received the LifeStraw filter before the household survey and were included in the study.
The household survey was conducted during the second household visit. An EHO was present at or independently conducted 739 (72%) of the household surveys. On average, the household survey took 9.29 min to complete. This did not include time spent going through the education materials.
The verification survey was conducted at the final household visit and reached 976 (95.4%) of original households. 971 (94.9%) filters were still visible in the household. Five filters, just over 0.5% of filters originally distributed, were not visible in the house and were reported either to be at the neighbor’s house, at a relative’s house, in the locked room, stolen, or taken by a CHC. The verification survey took an average of 33.9 min to complete.
5.2. Household Characteristics
From the household survey, for the primary drinking water source, the majority of households reported using a public tap or standpipe (66.8%) followed by a protected spring (20.1%) and piped water into dwelling, plot, or yard (6.65%) (
Table 2). In the verification survey, the majority of households reported using a public tap/standpipe (68.1%) followed by a protected spring (15.0%) and piped water into dwelling, plot, or yard (11.8%) (
Table 2). In the verification survey, piped water into dwelling, plot, or yard was separated into two categories with four households reporting piped water inside the home and the remaining 112 reporting piped water into the yard/plot.
There was a notable change in primary drinking water source between the household survey and the verification survey, although there were 47 fewer responses due to loss to follow-up. Specifically, the number of households that reported primarily using piped water into the dwelling, plot, or yard increased from 68 to 115 (6.66% to 11.8%, respectively). Commensurately, the number of households that reported primarily relying on a protected spring decreased from 206 to 146 (20.1% to 15%, respectively). There were no other significant increases or decreases in primary sources, which implies that a notable proportion of households may have changed from protected springs to piped water into dwelling, plot or yard over the study period.
It is possible that this shift is explained, in part, by an investment by the Rwamangana District in rehabilitation and extension of piped water supply. The Rwamagana District Development Strategy (DDS) cites investment in 176 km of rehabilitation and extension of piped water from 2018 to 2024 [
14]. Therefore, it is possible that some of the intervention households gained access to piped water in their dwelling, plot or yard during the study period, or their neighbors gained access and they reported this as their primary source. It was unclear, however, the extent to which this planned piped water expansion project had been completed.
In comparison to this study, the 2016/17 EICVs reported that only 11% of households in Rwamagana District primarily used piped water into the dwelling, plot or yard. The majority (49%) relied on protected springs, followed by public tap stand (29%) [
18]. Given the difference in this study’s findings and the significant shift in water source over the study period, it is also possible that the CHC facilitators’ understanding of the different water sources when asking survey questions and recording responses changed over the course of the study.
Poverty likelihood was calculated as described in the survey methods section. The scorecard used the definition of the national poverty line as 402 Rwandan Francs (RWF) per adult equivalent per day, on average, which correlated to an all-Rwanda poverty rate of 40.2% at the household level. The 2016/2017 EICVs reported the national poverty line in the Eastern Province as 37.4% at the household level [
17]. The analysis presented here uses household-level poverty rates (the household serves as the analysis unit).
Responses to the poverty scorecard questions were used to calculate a poverty score for each household. The average poverty score across the sample was 42.04 (score range 0–100), which correlated to a 27.7% probability (95% CI: 24.06, 31.34) that the household had per-capita consumption below the national poverty line. 95% CI ranges for the poverty likelihood value was provided with the poverty scorecard and interpolated for this study using sample size [
22]. In comparing the average poverty score of intervention households to that of the Eastern Province overall, it appears that, on average, intervention households were better off than the average household in the province.
Compared to the overall Rwamagana District poverty rate of 18.9% [
17], there was a 27.7% likelihood that the per-capita consumption for intervention households was below the national poverty line, on average. A number of factors may have contributed to the low poverty levels in Rwamagana District, including proximity to the capitol city and less treacherous terrain. The DDS cites high employment opportunities in Rwamagana District due to industrial development, which may reduce unemployment and thus poverty levels. Additionally, 84% of the Rwamagana population surveyed for the EICVs lived in Imidugudus, or clustered settlements [
14]. These physical conditions may simplify the provision of government services like piped water or electricity.
5.3. Water Filter Adoption
From the household survey, 76% of respondents reported treating their water before receiving the LifeStraw filter, with the majority treating by boiling (98.3%) (
Table 3). In the verification survey, 98.1% of respondents reported treating the last water they consumed, and 97.7% of those reported using the LifeStraw filter as the treatment method. Enumerators observed water present in 94.6% of filters at the time of the final household visit (
Table 4). These visits were not announced beforehand.
The volume of water treated in a household was calculated by multiplying the reported times per day filling the filter by the volume of the untreated water tank (5 L). This was divided by the reported number of people (adults and children) living in the household the majority of the year to yield the liters per person per day (LPPD). In the verification survey, the average volume of filtered water was 1.67 LPPD (SD: 0.92) (
Table 4). This calculation does not account for potential sharing of filtered water with non-household members.
In the verification survey, respondents also reported the average liters of water consumed for drinking by all members of the household before receiving the filter and the average liters of filtered water consumed for drinking by all members of the household after receiving the filter. These values were divided by the reported number of people (adults and children) living in the household the majority of the year to yield liters of water consumed per person per day. We observed a statistically significant difference (p < 0.05) in mean self-reported LPPD before and after receiving the LifeStraw filter ( = +0.655, 95% CI: 0.625, 0.684, p < 0.001).
An additional finding was that many respondents (81.9%) reported sharing LifeStraw filtered water with people outside of their house. Of respondents who reported sharing filtered water, 21.7% reported sharing daily, 74.0% reported sharing every other day, 4.19% reported sharing 1–2 times per week, and less than 1% reported sharing every two weeks.
Only 18 (1.84%) respondents reported not treating the last water they drank. Reported reasons for not treating the water were: working away from home (38.9%), being at school (11.1%), being at another household (16.7%), filter was not accessible (16.7%), no filtered water at home (5.56%), damaged filter (22.2%), and habit (5.56%). Respondents who reported that family members drank untreated water away from home (472, 48.4%) said they did so while traveling (39.7%), at school (34.3%) and at work (23.9%) (
Table 4).
Respondents who reported filtering water using LifeStraw were asked whether they used a separate safe storage container to store filtered water. Of the LifeStraw users, 840 households (87.3%) reported using a separate safe storage container. When enumerators visually confirmed the presence of a separate safe storage container, this number dropped to 812 (84.4%). Enumerators observed characteristics of the safe storage containers, selecting whether they had a wide mouth, a narrow mouth, a spigot, and/or a lid or other cover. Out of the 812 observed containers, 755 (93.0%) included a lid or other cover and 381 (47.0%) included a narrow mouth. These two values are not mutually exclusive. Only 42 (5.17%) met the program criteria for a “safe storage container”: having a lid or other cover, a narrow mouth, and a spigot. Of the visually confirmed safe storage containers, 648 (79.8%) had water in them (
Table 4).
In the household survey, 68 respondents (6.65%) reported having problems with their filter. Respondents were asked to identify all problems they experienced, which included filter leaking (33), filter not assembled properly (22), bottom container damaged (14), difficult to backwash (14), other (6), tap damaged (3), and doesn’t filter water (3) (
Table 5).
From the verification survey, 49 respondents (5.02%) reported having problems with their filter. They were asked to identify all problems experienced, including filter leaking (15), filter not assembled properly (12), difficult to backwash (8), does not filter water (6), bottom container damaged (5), tap damaged (4), and other (7) (
Table 5). 276 households (28.3%) reported requiring help to solve an issue with the filter, and 272 of those households (98.6%) reported that assistance was available when needed. These households were asked to select all groups who helped them in solving a filter issue. 245 respondents (90.1%) reported getting help from their CHC facilitator, 56 respondents (20.6%) reported getting help from their EHO, 40 respondents (14.7%) reported getting help from Gikuriro staff, and one respondent reported getting help from another source. Out of the 276 respondents who reported needing assistance, 264 respondents (95.7%) reported that the problem was resolved. If filters could not be repaired, they were replaced by program staff. Five filters were replaced in August 2019 and 21 filters were replaced in January 2020.
6. Discussion
In this section, we discuss the program implementation and characteristics that may have contributed to the observed adoption rates of the water filter. Throughout, we compare the program implementation and results to the promotors’ experience with the prior Tubeho Neza program.
6.1. Product Delivery
In January 2019, 1023 LifeStraw Family 2.0 household water filters were distributed in 30 villages of the Rwamagana District. Approximately a year after distribution, 99.5% of filters were present in the household, and water was observed in 94.6% of filters. The initial distribution of filters was difficult, though, with many being cracked or otherwise damaged during transport, leading to malfunction. A delay between distribution and education also led to some families improperly cleaning or operating the filters. This delay is further discussed in the section on program implementation below.
The promoters observed CHC facilitators failing to use the flipbook and poster for household education and training during the first household visit; this was addressed in subsequent training to improve use of supporting materials in the second round of household visits. This element of household education and behavior change communication was viewed as central to the innovation-decision process [
23], ensuring that households received sufficient information to make a decision about adopting the filter.
6.2. Technology Adoption
In the Tubeho Neza program, 80.7% of the baseline sample reported treating their water by boiling before receiving the LifeStraw filter. In this study, for those who treated water before receiving the LifeStraw filter, there was even higher reported adherence to boiling as a treatment method (98.3%), as seen in
Table 3. Prior to filter distribution, intervention households attended a CHC meeting that covered the original safe drinking water and storage module, which taught boiling and chlorination as the primary methods for household water treatment. This prior instruction may account for the higher self-reported adherence to boiling as a treatment method, as compared to Tubeho Neza. Contrarily, previous studies have shown that self-reporting of boiling behaviors can be unreliable [
24]. It is also important to note that, although boiling can be an effective treatment method, self-reported adherence to boiling does not include the length of time water was boiled, the temperature at which water was boiled, or the level of disinfection achieved [
21].
By the time of the verification survey (1 year after distribution), no filters were reported to be sold, and only one filter was reported as stolen. In the Tubeho Neza program, the signed agreement on the household educational poster included a requirement that if the filter was stolen or sold, the family would be responsible for the cost. Although this language was removed for the study, reported incidents of missing filters did not increase. Community proximity of CHC facilitators to households may have contributed to this phenomenon.
After the distribution of the LifeStraw filter in the Tubeho Neza program, 95.4% and 91.4% of households in the first and second follow-up surveys, respectively, reported treating drinking water with the LifeStraw filter, compared to 97.7% in this study as reported during the verification survey, as seen in
Table 6. Although the study used the recommended question format from the WHO HWTS Toolkit [
25], previous research has found significant discrepancies between self-reported and directly observed data in surveys [
26]. Self-reported adoption may be over-reported, as enumerators could not verify the most recent treatment method.
With potential reporting bias in mind, the reported quantity of stored filtered water (1.67 LPPD) was very similar to quantities found in Tubeho Neza (1.64 and 1.63 LPPD, for the 1st and 2nd follow-up, respectively). Additionally, self-reported filtered water consumption increased by 0.66 LPPD after the distribution of the water filters. This may be attributed to behavior change messaging and education around the importance of hydration. This messaging included reminders on the household poster about times and places to drink filtered water, as well as household-specific directives for the amount of water to filter daily to meeting hydration requirements. During household visits, CHC facilitators used the interactive poster to help households calculate the amount of water that needed to be filtered per day to provide sufficient treated water for healthy drinking water consumption by each household member. Additionally, all families in the study were CHC members; the safe drinking water module of the CHC program taught participants that all household members should drink at least 2 LPPD of filtered water. At monthly monitoring visits, some households demonstrated an understanding of the hydration requirements but reported that it was too much work to fill the filter many times per day. The average round-trip travel time to an improved water source in Rwamagana District was 12.2 min [
14] which may have been a barrier to consistent filter use.
A high percentage of households were confirmed to have storage containers for filtered water (84.4%) but only 5.17% of those with confirmed storage containers were using safe storage containers which include a lid or other cover, narrow mouth, and spigot. The Gikuriro program midterm report found that, while 95.9% of storage containers were properly covered, only 45.94% of households overall and 37.2% of households in Rwamagana District prevented dipping instruments or hands from contacting water. In this study, 93% of containers were properly covered but only 47% of containers prevented dipping instruments or hands from contacting water. Participation in CBEHPP included a safe drinking water storage module. This module had participants identify characteristics of safe storage containers and the ways that water can be contaminated after being put in a storage container.
In Tubeho Neza, families selected cups and safe storage containers to use exclusively for filtered water. These containers were marked with the Tubeho Neza logo and families were trained to clean them at least once a week [
27]. Although safe storage containers were not provided in this intervention, the implementers distributed water storage containers with taps to households in all eight districts in the Gikuriro Program, including Rwamagana, in 2019. Because a separate safe storage container was not provided as a part of the intervention being evaluated, it is unclear whether participants lacked understanding of a fully safe storage container, no longer had the safe storage container previously distributed, or had never received such a container.
Nearly half of respondents (48.4%) reported drinking untreated water away from home, primarily while traveling. In Tubeho Neza, this value was lower (31.0% and 20.3% for the 1st and 2nd follow-up, respectively), as seen in
Table 6. The educational materials (poster and flipbook) emphasized carrying clean water while away from home. Although the LifeStraw filter facilitates access to treated water, the intervention did not provide safe storage containers for travel, like a reusable water bottle. This higher reported level of drinking untreated water is of concern because consistent and correct use of a water treatment technology is essential, as even occasional consumption of unfiltered water can significantly reduce the health benefits of a water quality intervention [
28]; households that correctly and consistently use a water treatment technology and do not consume untreated water at any time have a lower risk of diarrheal disease [
25]. Again, household education on a topic without access to the necessary support materials or supplies was not sufficient to achieve uptake of the desired behavior. In future interventions, implementing agencies should consider providing free or subsidized containers for use away from the home.
Over the course of the process evaluation, filter problems were either resolved through troubleshooting or the filter was replaced entirely. Reported incidences of most types of repairs decreased from the household survey to the verification survey. CHC facilitators were reported to most commonly support in the troubleshooting for these or other unreported issues. This signals that households respected the CHC facilitators and their ability to provide support, while also likely influenced by their familiarity, proximity and availability.
Sustained use of the filters would depend on the ability of CHC facilitators to perform repairs and on access to a continued supply chain for spare parts beyond those provided as part of the program, which are discussed in the following section. Given that the Gikuriro program ended in 2020, continued CHC facilitator engagement and support, as well as supply chain access, are unlikely. Continued access to the supply chain is a persistent challenge in interventions such as this. Full integration into Ministry of Health programming that is not tied to external funding cycles is needed to ensure the long term sustainability of such programs.
The Gikuriro Fiscal Year 2019 (1 July 2018 to 30 June 2019) Performance Report [
29] found that many beneficiaries of the LifeStraw distribution knew basics of filter use and maintenance, like backwashing, but that some beneficiaries struggled with even basic skills around filter use. Additionally, the report found uneven training of households wherein some family members would not know how to use and care for the filter. To address this problem, the Gikuriro Program encouraged “peer-coaching” where trained family members would support training and learning of other family members and neighbors who were less educated on the filter. In future studies, it would be prudent to collect more observed and demonstrated consistent use indicators, such as asking for a demonstration of safe water extraction and recording whether hands touch the water [
25]. These measures may allow for more accurate comparison between self-reported knowledge and demonstrable knowledge.
6.3. Program Implementation
The implementers faced budget constraints and other programmatic priorities, which affected the availability of their staff for scheduled activities. The supervisors identified by the implementers and trained by the promoters were largely unavailable due to their job responsibilities and scheduling conflicts. It is for this reason that EHOs were brought on before the follow-up household visits to fulfill this supervisory role and support the CHC facilitators during household visits and surveying. Additionally, there were times when CHC facilitators and EHOs were also not available due to other responsibilities and activities. These limitations led to schedule changes that negatively affected program objectives.
Specifically, the CHC meetings on household water treatment and safe storage and initial household visits were scheduled to immediately follow filter distribution in order to ensure that families knew how to use and maintain the filter and that the key behavior change messages would be reinforced several times over a short period of time. Due to scheduling conflicts and limited availability, CHC meetings instead took place one to one and a half weeks after filter distribution, with household visits starting after the meeting was held in a given village.
The other significant deviation from the program plan happened with respect to the distribution of repair kits, containing a variety of replacement parts needed for typical repairs and bleach for cleaning filters. The original intent was for repair kits to be distributed to CHC facilitators on the last day of training before starting the final round of household visits. This would make it possible for them to identify and address filter issues during household visits, performing simple repairs while in the household or collecting filters for the full replacement when necessary. Doing so would also reinforce the knowledge and skills on filter repair that they received in training, to increase the likelihood that they would retain this knowledge and skills. However, COVID-19 led to a significant delay in the delivery of replacement parts for filter repair. Instead of being distributed on the final day of training, 14 February 2020, the kits were distributed to CHC facilitators on 26 June 2020. The promoters have not received any reports on the use of these kits nor on the number of filters repaired or replaced since that time.
6.4. Program Costs
This program was based on the hypothesis that the integration of the filter into CBEHPP could achieve the desired water quality and health impacts in a less resource- and time-intensive manner than Tubeho Neza. The RCT analysis has not been completed, and results are not presented in this paper. It is possible, however, to explore the latter half of the hypothesis by comparing the cost of implementing filters into CBEHPP to the cost of doing so in Tubeho Neza.
The total amount contracted to the implementers and the promoters was approximately USD 160,000. In total, filters were distributed to 1023 households in intervention villages and approximately 1000 filters in control villages. This yields a cost estimate per household of approximately USD 80, before accounting for the cost of the filters. Although the filters and spare parts were donated and shipped for free by Vestergaard Frandsen, here, we will use a cost per filter of USD 30, which was the amount reported for Tubeho Neza [
27]. This brings the total cost per household to USD 110. For intervention households, this covered a two year period of support, while for control households, this calculation only covers the distribution of the filters, as the Gikuriro program ended in 2020.
In comparison, in their cost-benefit analysis of Tubeho Neza, Barstow et al., 2019 estimated a cost per filter of USD 40 and recurring costs of USD 7 per household year in order to fully cover the overhead costs of implementers for filter distribution and programmatic support [
30]. Using these numbers, the Tubeho Neza cost per household for a two year period would be USD 54. We conclude, therefore, that the cost of implementation through Gikuriro was approximately twice that of Tubeho Neza, even with a lower filter price.
8. Conclusions
The study’s objective was to determine whether the membrane-based household water filter supported by the promoters could be integrated successfully into the implementers CBEHPP initiatives, with targets including coverage, use and drinking water quality. Outside of these indicators, the study also aimed to determine if distributing and promoting use of the household filter could lead to higher uptake of household water treatment practices than the promotion of water treatment (boiling) and safe handling practices alone. Finally, the evaluators hypothesized that the integration of the filter into CBEHPP could achieve the desired water quality and health impacts in a less resource- and time-intensive manner than Tubeho Neza.
Although this program provided access to both household water treatment technology and WASH education, results and comparisons with previous programs show continued barriers to effective and consistent education and implementation. Compared to another recent water filter program, a lighter-touch engagement with households and supervision of data collection was observed, while also costing approximately twice per household compared to the predecessor program.
Due to the duration of the process evaluation, it is not possible to comment on the viability of the intervention in the long term. As noted previously, there are concerns around the ability of CHC facilitators to continue to provide the needed educational and material support for sustained filter use and maintenance. Therefore, the provision of household water filters for water treatment in combination with behavior change messaging is likely an interim solution, with a long-term solution to lack of access to clean drinking water still needed. Significantly, with the cost twice that of implementation through the Tubeho Neza program, the intervention did not achieve the objective of being less resource-intensive. Although the planned distribution was completed, the small sample size and relatively low poverty rates in the study sample may make results less applicable to other, more impoverished areas of Rwanda. Results of this study stand in agreement with previous work showing a need to strive for safe and reliable piped water as a long-term solution [
28] due to the high resource and time costs.


 ,
, 


