Article

The Environmental Impact of Ecological Intensification in Soybean Cropping Systems in the U.S. Upper Midwest

1
Department of Plant Sciences, North Dakota State University, Fargo, ND 58108, USA
2
Department of Coatings and Polymeric Materials, North Dakota State University, Fargo, ND 58108, USA
3
USDA-ARS-NCSCRL, Morris, MN 56267, USA
4
Department of Agronomy, Iowa State University, Ames, IA 50011, USA
*
Author to whom correspondence should be addressed.
Sustainability 2021, 13(4), 1696; https://0-doi-org.brum.beds.ac.uk/10.3390/su13041696
Submission received: 23 December 2020 / Revised: 29 January 2021 / Accepted: 1 February 2021 / Published: 4 February 2021

Abstract

:
Introducing cover crops is a form of ecological intensification that can potentially reduce local, regional and global environmental impacts of soybean cropping systems. An assessment of multiple environmental impacts (global warming potential, eutrophication, soil erosion and soil organic carbon variation) was performed on a continuous soybean system in the U.S. upper Midwest. Four sequences were assessed and compared: a soybean cropping system with winter camelina, field pennycress, or winter rye as cover crop, plus a control (sole soybean). Cover crops were interseeded into standing soybean in Year 1, while in Year 2 soybean was relay-cropped into standing camelina or pennycress. Rye was terminated before sowing soybean. When compared with the control, sequences with cover crops showed lower eutrophication potential (4–9% reduction) and soil erosion (5–32% reduction) per ha year−1, in addition to a lower global warming potential (3–8% reduction) when the cover crop was not fertilized. However, when the economic component was included in the assessment, and the results expressed per USD net margin, the sequences with cover crops significantly reduced their performance in all categories of impact considered. A further optimization of field management for camelina and pennycress is recommended to make the cropping system more sustainable.

1. Introduction

The intensification of agriculture, which started in the mid to late 1960s, allowed the development of cropping systems with high yield per unit of land and time. High input agriculture, new varieties and hybrids with a higher harvest index and shorter life cycle, and irrigation are some of the key elements that allowed a drastic increase in productivity in agriculture [1]. However, such a process has also widened the ecological footprint of agricultural production by accelerating natural resource depletion (e.g., soil organic carbon and soil erosion), increasing environmental pollution (e.g., water contamination and eutrophication processes) and reducing biodiversity of agroecosystems. The magnitude of the environmental impact associated with the agricultural intensification has become a threat to sustain the crop productivity itself [2].
Monocultural cropping systems, such as continuous soybean (Glycine max (L.) Merr.), are particularly critical in terms of sustainability. A recent review by Pervaiz et al. [3] suggests that monocultural systems may negatively affect soil health, by impacting both biotic and abiotic components. Other studies on continuous soybean systems showed a reduction in soil aggregation and organic carbon content due to a low residue input, and a change in soil organic carbon (SOC) quality [4,5]. More sustainable agricultural practices can potentially reduce the current negative environmental impacts of soybean production [6].
To address, at least to some extent, these issues, the concept of ecological intensification has been proposed. Adopting an ecological approach in agricultural intensification entails modifying land management strategies and practices to ensure high yield while enhancing ecosystem services provided by agroecosystems, reducing anthropogenic inputs and minimizing the overall environmental burden of food production [1,2,7,8]. Organic farming, reduced tillage or no-till, mixed cropping and diversified crop rotation are examples of ecological intensification strategies [2]. Integrating cover crops into conventional cropping systems is also a form of ecological temporal intensification that can contribute to making agricultural crop production more sustainable [7,9]. Cover crops are often used by farmers to improve nutrient management, minimize soil erosion and control weeds [10,11,12,13,14]. Enhanced rotation with cover crops may be used as a strategy to increase SOC and maintain or improve soil structure and fertility [15,16,17,18]. Cover crops can also foster functional biodiversity of agroecosystems, including provision for pollinators [19,20]. Some crops such as winter camelina (Camelina sativa (L.) Crantz) and field pennycress (Thlaspi arvense L.), when used as a winter cover crop, can also provide an additional source of income for farmers as alternative oilseed feedstock for biofuel production [21,22,23,24]. Camelina has other potential industrial uses, such as in chemical compounds, non-food-based products, animal feed, and food supplements [25,26], and research on field pennycress is moving in a similar direction [27].
Therefore, cover crops can bring new economic opportunities to the farmer and help achieve a long-term sustainability of agricultural systems [28]. However, cover crops can also present a challenge for profitability and field management, especially in the short–term [19,29,30]. Increase in production costs and potential yield reduction for the following main cash crop are particularly critical challenges [31].
In the U.S. upper Midwest, winter cereal rye (Secale cereale L.) is the most common winter-hardy cover crop, but camelina and pennycress have shown potential as winter cover crops as well [10,32,33,34]. Camelina and pennycress have been identified as promising crops for double- and relay-cropping systems in the U.S. upper Midwest [25,32,33,35]. However, their recent introduction in the region presents further challenges. There is still limited knowledge about agronomic practices and cropping system management for pennycress and camelina, although a few studies on the latter have been published [25,32,33,34].
The objective of this research was to assess and compare the environmental trade-offs of a relay cropping system in a 2-year continuous soybean (where three winter cover crops—camelina, pennycress, and cereal rye—were interseeded into the main crop in Year 1) by using a life cycle assessment framework. Relay-cropping is a form of temporal and spatial intensification where one crop is sown into another crop previously established, and their life cycles partially overlap [36]. The study is designed to assess the hypothesis that cover crops can reduce the environmental burden associated with the continuous soybean cropping system, by limiting nutrient and soil losses and preserving soil fertility. The findings of such assessment can contribute to developing a more comprehensive view on the sustainability of introducing new cover crops in conventional cropping systems, from both environmental and economic perspectives. This study also provides useful insights for researchers who are working on improving agricultural management of camelina and pennycress as winter cover crops, and for local and regional decision makers, such as farmers and policymakers, in the U.S. upper Midwest.

2. Materials and Methods

2.1. Cropping Sequences, Site Characteristics and Field Management

Three winter-hardy cover crops—winter camelina, field pennycress, and winter rye—were interseeded into a 2-year continuous soybean system at three locations in the U.S. upper Midwest during the period 2016–2017. Cover crops were sown into standing soybean in the late summer of Year 1, while soybean in Year 2 was sown into standing camelina and pennycress in the spring. Winter rye was terminated with glyphosate (n-phosphonomethyl glycine) in Year 2, two weeks before sowing soybean. A control treatment (winter fallow, with no cover crop) was also included in the study. The four sequences are briefly described in Table 1. The experiments were carried out in Ames (Iowa), Morris (Minnesota) and Prosper (North Dakota). A detailed description of the study sites can be found in Mohammed et al. [34]. The soil types at each site were: Clarion loam (fine-loamy, mixed, superactive, mesic Typic Hapludolls) and Webster clay loam (fine-loamy, mixed, super-active, mesic Typic Endoaquolls) in Ames; Hokans (fine-loamy, mixed, superactive, frigid Calcic Hapludolls)-Svea (fine-loamy, mixed, superactive, frigid Pachic Hapludolls) complex in Morris; Kindred silt loam (fine-silty, mixed, superactive, frigid Typic Endoaquolls) and Bearden silt loam (fine-silty, mixed, superactive, frigid Aeric Calciuaquolls) in Prosper. Slope values for the Ames, Morris and Prosper sites were 2%, 3.5% and <0.1%, respectively. Monthly mean air temperature and monthly total precipitation in 2016–2017 are presented in Table 2. A further discussion on the impact of soil characteristics and weather conditions on the cropping systems at the three sites is reported in Mohammed et al. [34,37] and Patel et al. [38].
The three sites followed three different field management strategies. In Morris and Prosper, no fertilizer was used for the main cash crop (soybean) over the two-year experiment, while in Ames a N-P-K fertilization of 43-123-112 kg ha−1 was applied in Year 1 at sowing. In Prosper, no cover crop received any type of fertilization, while in Ames and Morris camelina and pennycress were fertilized with N-P-K at a rate of 78-34-34 kg ha−1 in early spring (at bolting stage) of Year 2. Soybean and cover crop residues were not removed, except for the soybean residues in Year 1 in Prosper, which were collected at harvest to facilitate cover crop establishment. A summary of the site characteristics and field management protocols for the three locations included in this study are provided in Table 3. Photos of the field experiments are shown in Figure 1. Further details on the experimental design and agronomic management practices can be found in Mohammed et al. [34].

2.2. Life Cycle Assessment

The environmental impact of introducing three different winter cover crops within a 2-year continuous soybean system was assessed through a life cycle assessment (LCA) methodology according to the ISO 14041 methodology [39].
In this study, a cradle to farm gate system boundary was chosen, in order to take into account all agricultural inputs, field operations, crop outputs, and field emissions. The results of the environmental assessment were expressed according to two functional units: (1) an area-based unit (1 ha year−1) and an economic-based unit (USD 1 net margin). The use of multiple functional units is recommended in agricultural LCA due to the high sensitivity of LCA results to the unit chosen to measure them [40]. Multiple units help give a better understanding of the environmental impacts and improve the quality of the interpretation phase of the LCA [41]. The first functional unit—which is strongly dependent on the systems inputs such as fertilizers, pesticides, and machinery use—provides a spatial and temporal evaluation of the impacts of agricultural practices. The second unit introduces the economic component in the assessment process, giving a broader perspective on the overall sustainability of the cropping systems.
SimaPro 9.0.0.35 software was used to build the LCA model. The life cycle inventory (LCI) included field experiment data and the Ecoinvent v3 database [42] (which were the primary sources for inputs), emission models (main source for outputs), literature review, and expert opinion.
The direct field emissions included in the LCA were mainly estimated with empirical and processed-based models. Emissions to air, water and soil were considered, including nitrous oxide, nitric oxide, ammonia, carbon dioxide, methane, pesticides, nitrates, phosphates, and eroded soil particles. A summary of the models employed in this study is presented in the following sections, while a more detailed discussion of such models can be found in Cecchin et al. [43].
Annual field emissions of nitrous oxide (N2O) and nitric oxide (NO) were estimated through a model by Bouwman et al. [44], while a further model developed by Bouwman and colleagues [45] was used to calculate the release of ammonia (NH3) in the atmosphere. Carbon dioxide (CO2) emissions due to urea fertilization were estimated according to the Tier-1 IPCC [46] emission factor. The emissions of greenhouse gases (GHGs) due to fossil fuels consumption for field operations such as tillage, sowing, fertilization, spraying, and harvesting were calculated in accordance with the emission factors reported in the US-EPA emission factor guidelines for GHGs inventories [47].
A number of factors can significantly affect the pesticide’s environmental fate after application, including chemical–physical properties of the substance, type and time of application, local weather conditions, and crop growth stage [48,49]. Given that such a level of detail is not possible in this study, emissions to soil due to the pesticide application were estimated to be 90% of the applied product, 9% to air and 1% to water according to the European Commission [50], which are assumed to be reasonable temporal estimations “based on expert judgement due to current limitations” ([50] p. 72).
Water contamination due to nitrogen and phosphorus losses from agricultural soils was estimated using the SQCB-NO3 model, for nitrates leaching, and Salca-P, for phosphate leaching and runoff and water erosion of phosphorous in soil particles [51,52].
Multiple environmental impacts were evaluated in the assessment phase, including (1) 100-year global warming potential (GWP) according to IPCC 2013 [53]; (2) eutrophication impact according to the TRACI 2.1 methodology [54]; (3) soil erosion and (4) soil organic carbon variation, in order to investigate the impact of cover crops on soil quality. Water erosion of agricultural soils was estimated using the USDA-developed RUSLE2 model [55,56], while the results of the wind erosion simulation with the WEPS model [57] were not included in the paper due to the limitation of the model in assessing relay-cropping systems. In this study, soil organic carbon (SOC) variation was used as a proxy indicator of soil quality [58,59,60]. The methodology of the minimum residue return rate developed by Johnson and colleagues [61,62,63,64] was used to estimate the sustainability of the residue management for each sequence considered in the study. The minimum residue return rate is the minimum amount of aboveground residues required to maintain organic carbon levels in agricultural soils.

2.3. Uncertainty Assessment

The uncertainty associated with the LCA results was assessed by using a Monte Carlo Analysis (10,000 runs, 95% confidence interval). Unless variations in field data or modelled estimates were specifically reported, inputs and farm-level emissions were assumed to have a lognormal distribution and the standard deviation was determined by using the Pedigree matrix [65] or basic uncertainty values in SimaPro [66]. When an error range was provided for outputs estimated through models (e.g., N2O field emission model), a triangular distribution was selected.
The uncertainty for the results of modelling water erosion was determined according to the model’s accuracy values presented in USDA [67]. Finally, the results of the SOC change are reported including the potential variation in the annual carbon input necessary to maintain SOC levels (±1.7 Mg C ha−1) according to Johnson et al. [62].

3. Results and Discussion

3.1. Land-Based Functional Unit (FU1)

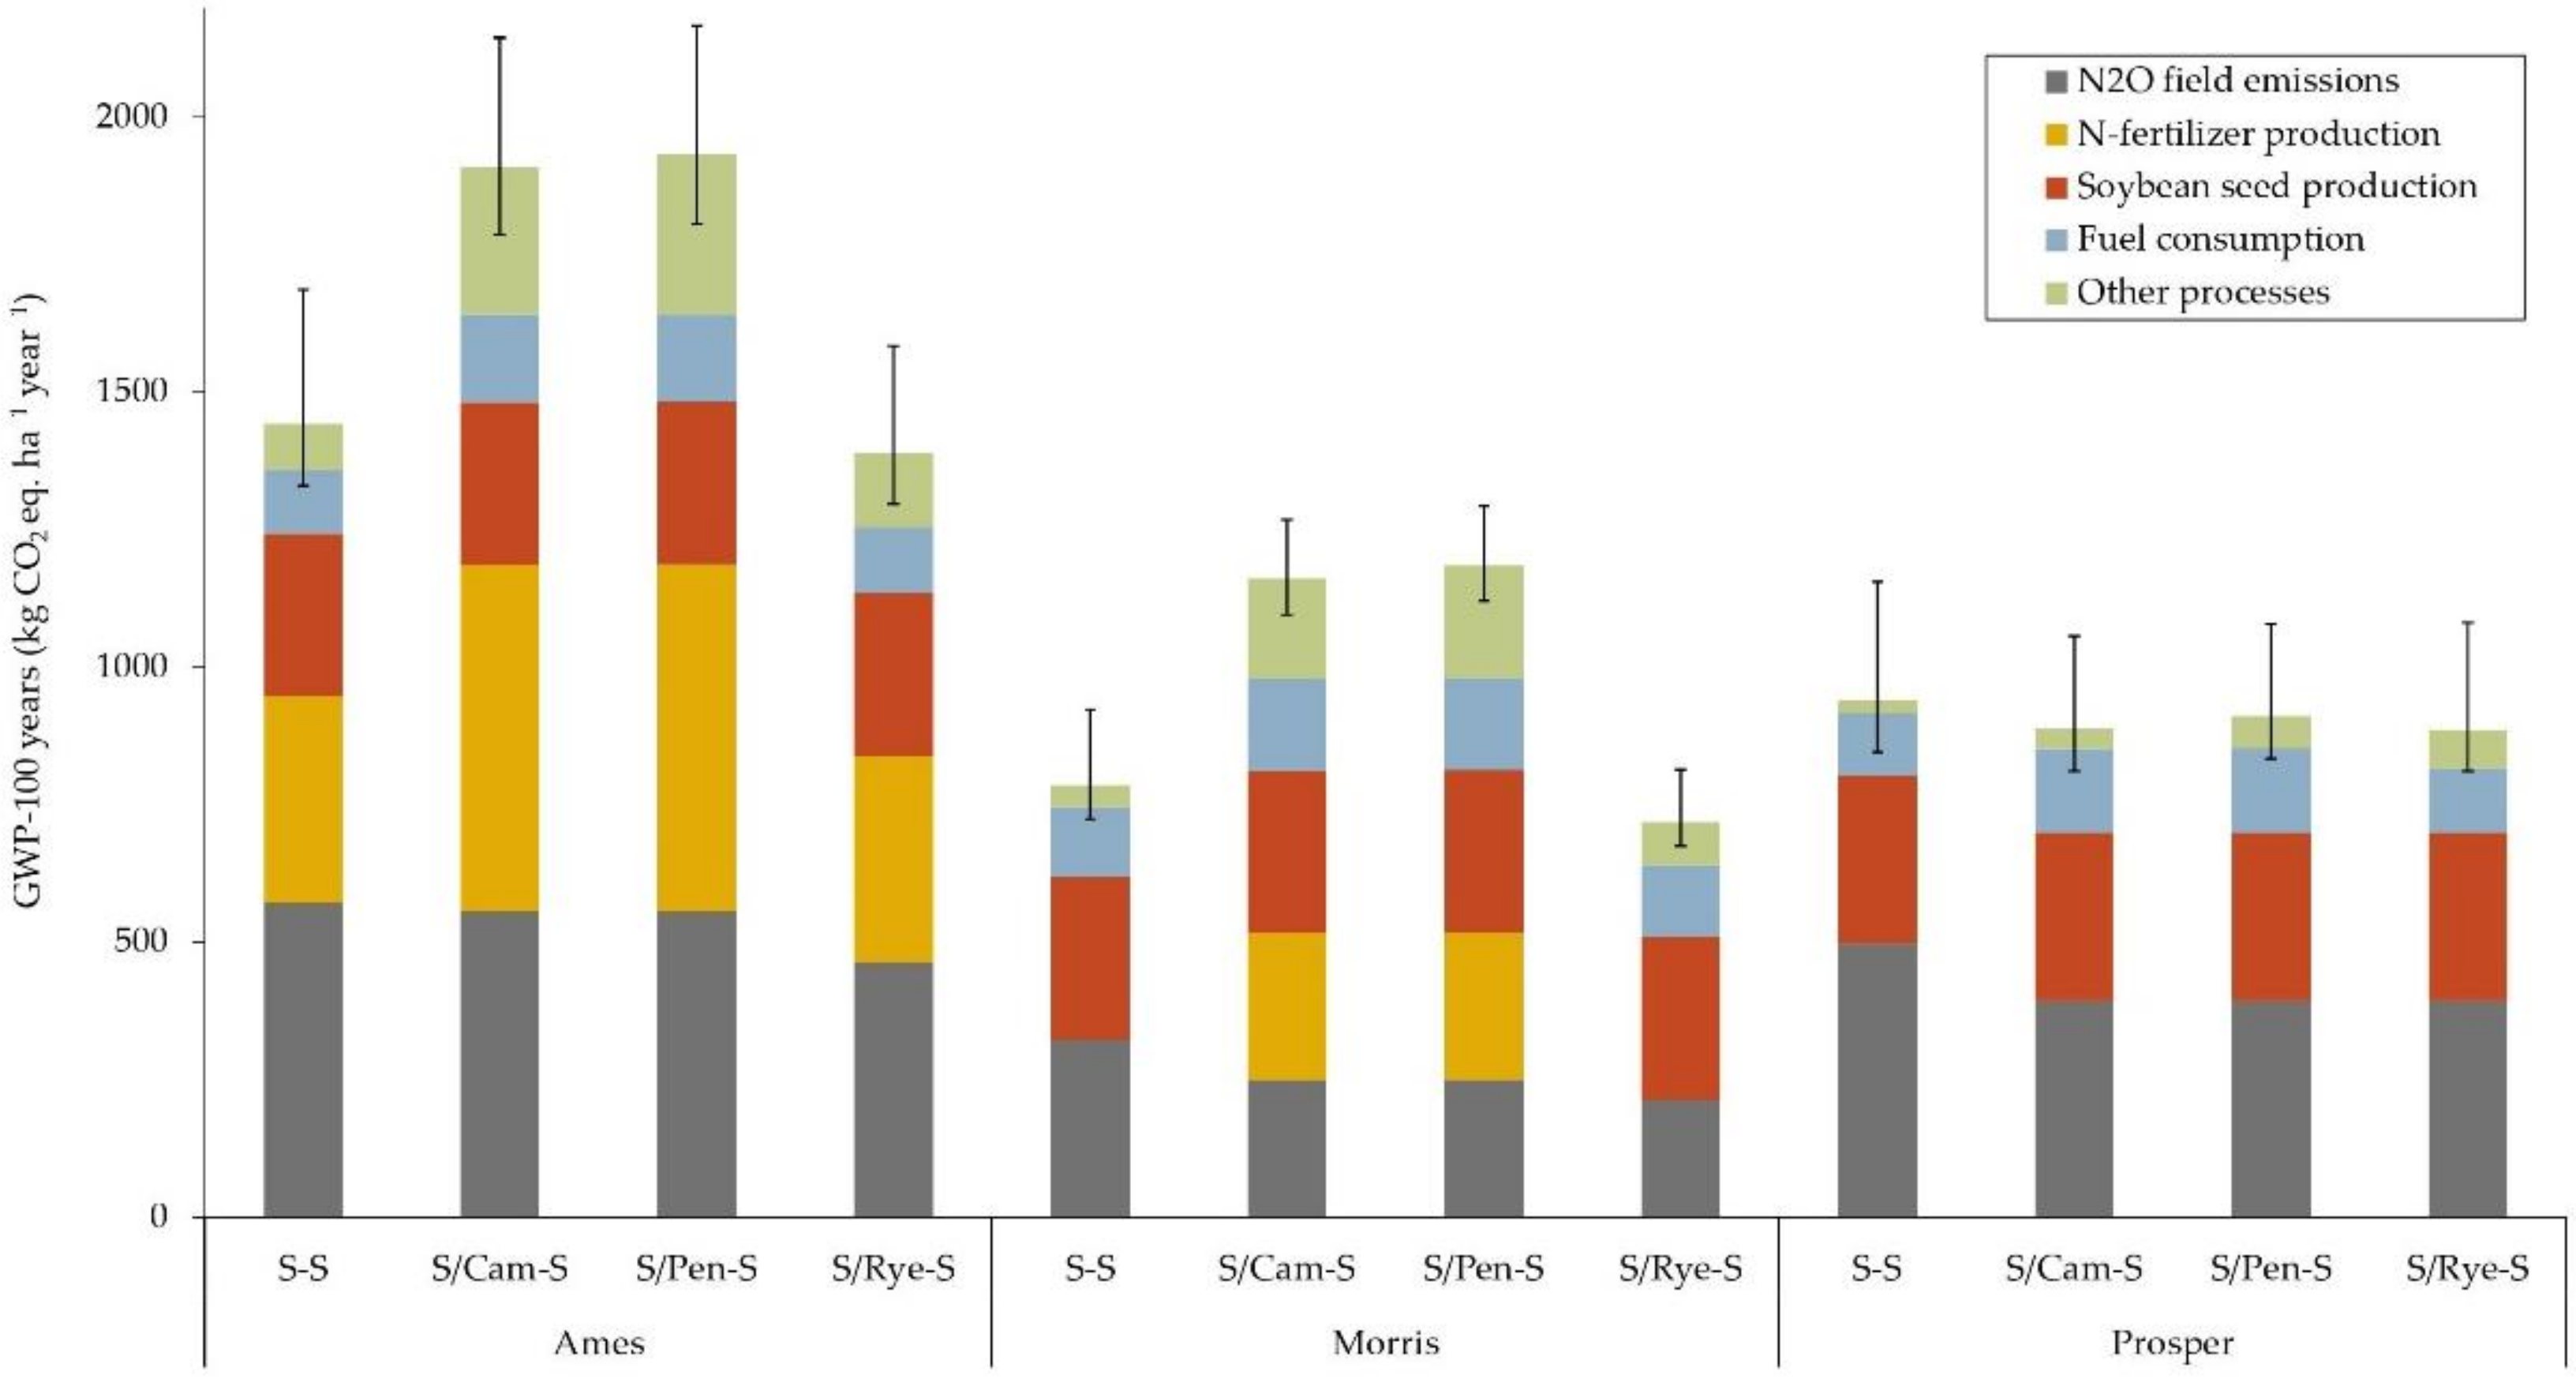
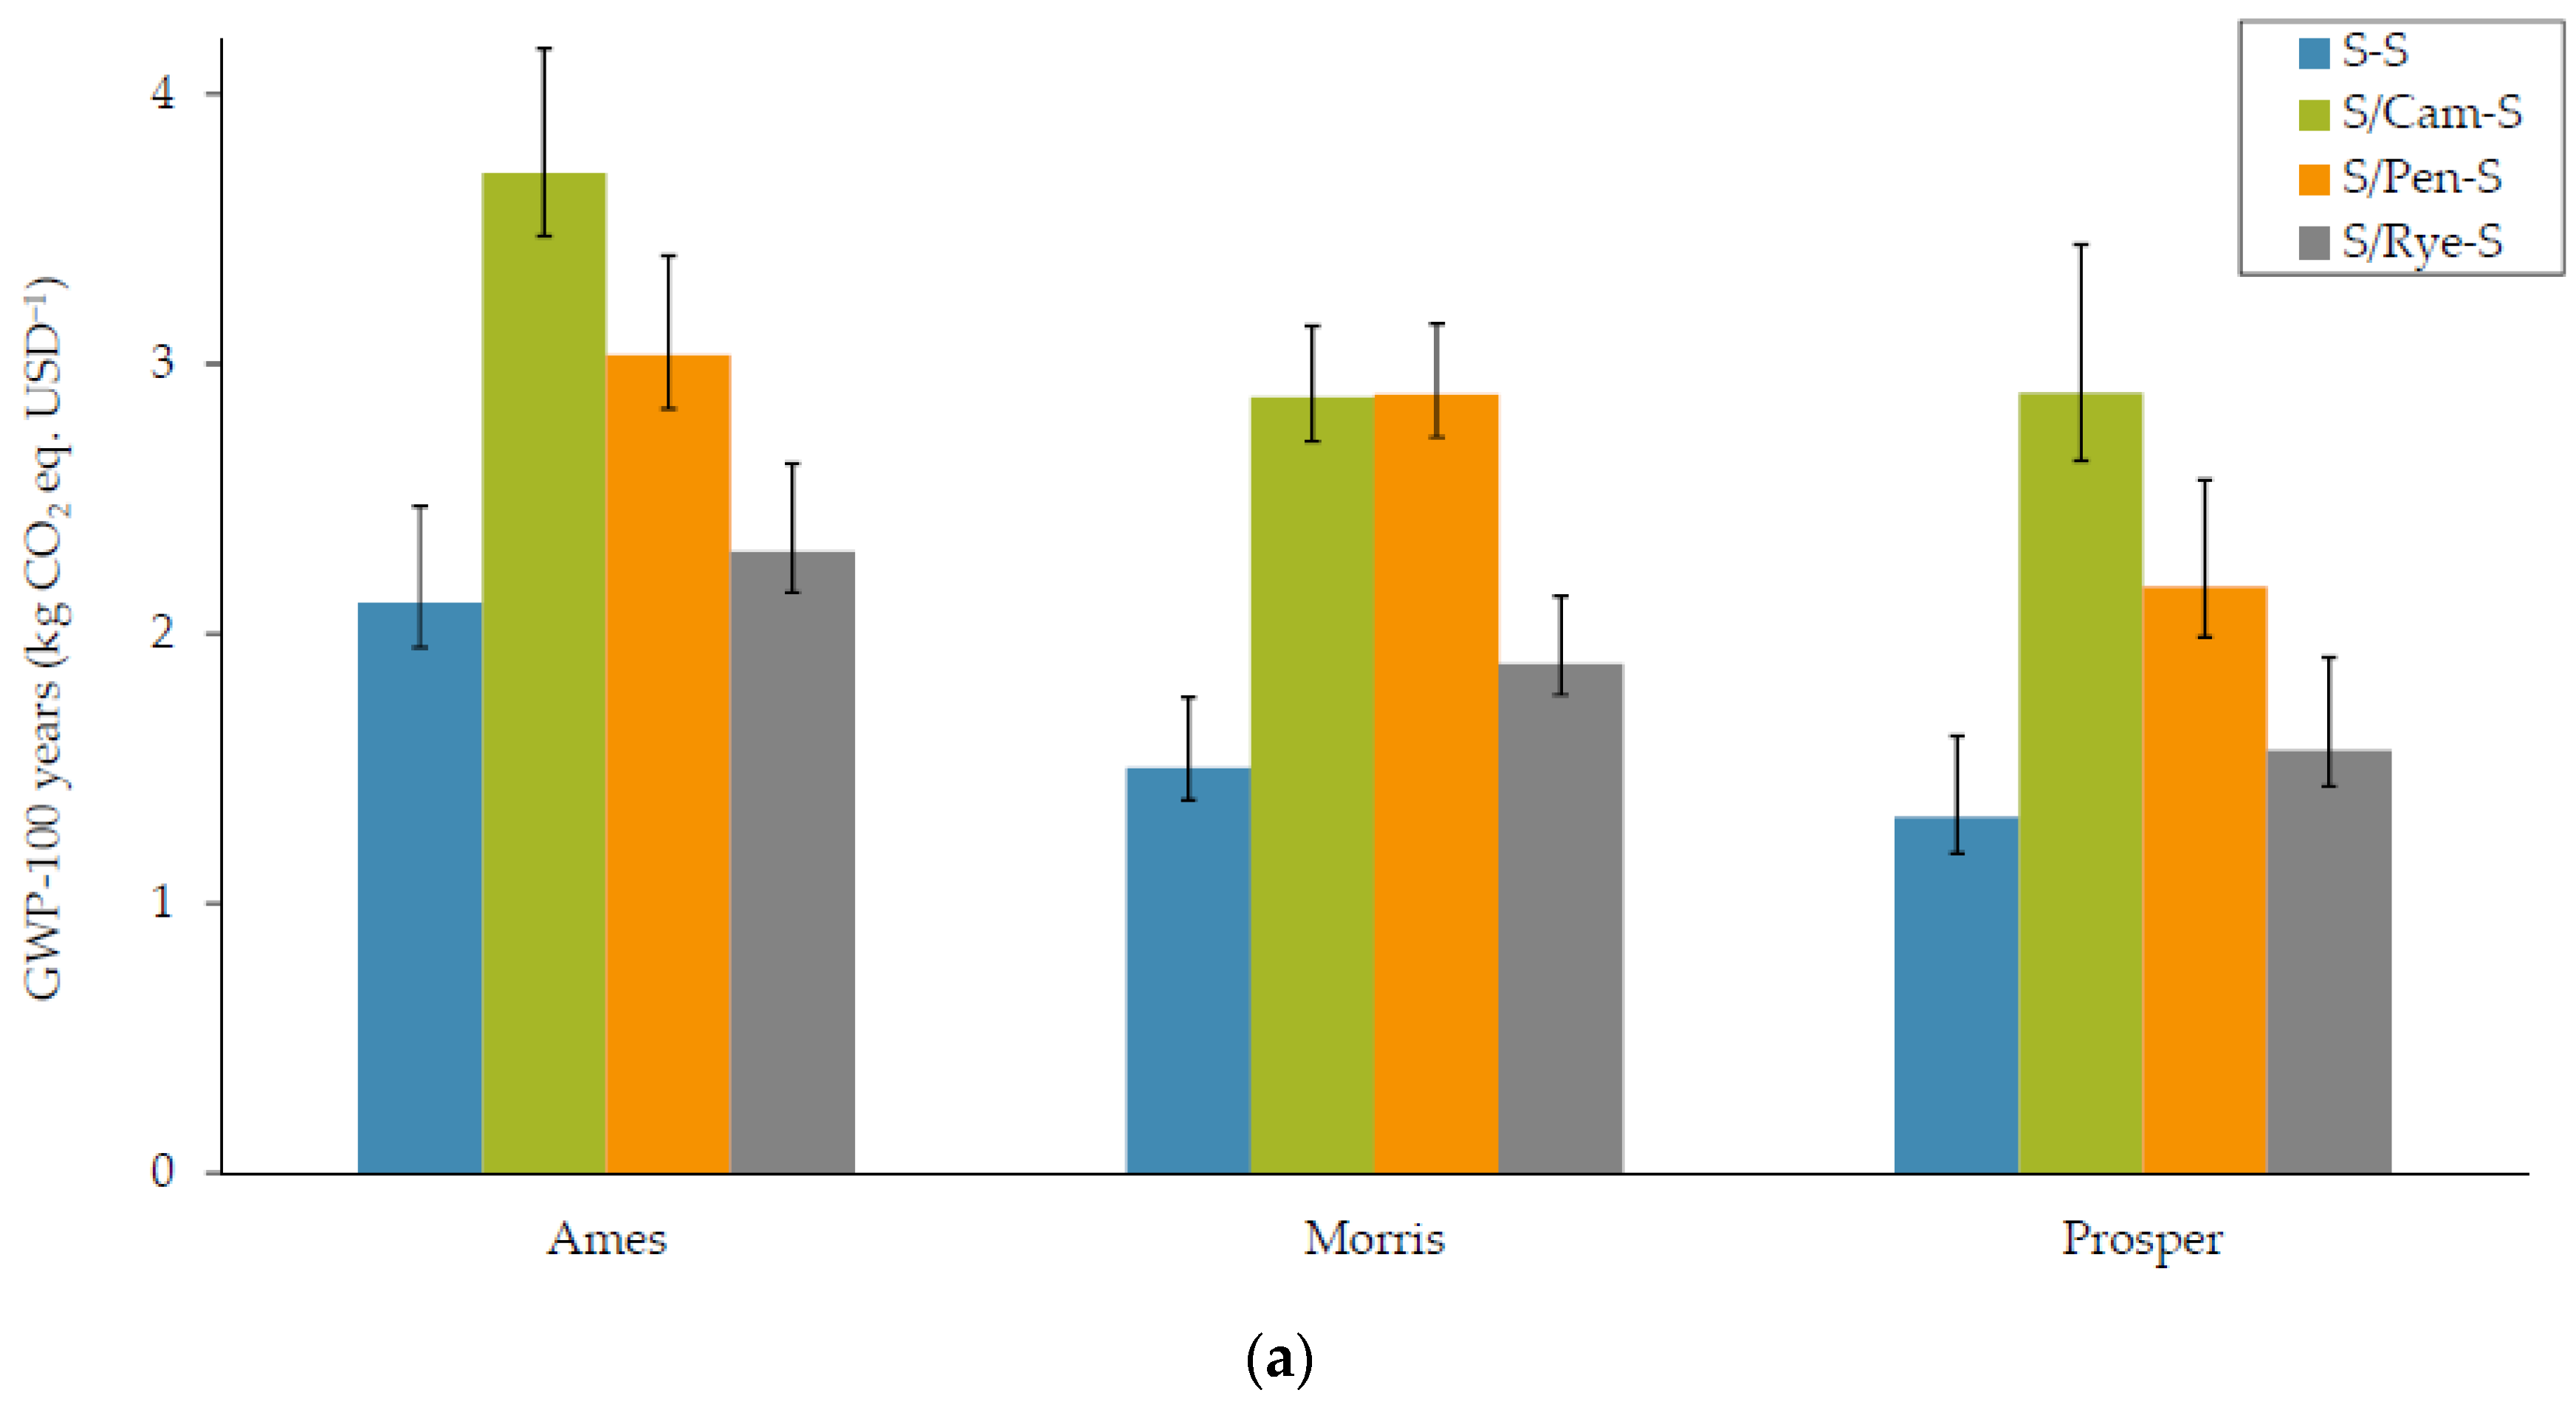
3.1.1. Global Warming Potential (GWP)

The GWP assessment results showed higher values per ha year−1 for sites and sequences that received nitrogen fertilization (Figure 2). All sequences at Ames were fertilized in Year 1 at the time soybean was sown, while soybean/camelina-soybean (S/Cam-S) and soybean/pennycress-soybean (S/Pen-S) received a further N-fertilization in the spring of Year 2. At the Morris location, experiments were not fertilized in Year 1, but camelina and pennycress received the same N-P-K fertilization rate (78-34-34 kg ha−1) in Year 2 as at Ames. Higher values of GHGs in fertilized sequences can partially be ascribed to higher values of field N2O emissions generated by the conversion of available soil ammonium (NH4+) by nitrification and denitrification processes carried out by microorganisms in soil [68,69]. Such processes are site-dependent and strongly affected by soil characteristics (e.g., pH, SOC, temperature, and soil water levels), climatic conditions, cropping system and crop uptake of available nitrogen from the soil [70]. Indeed, Weyers et al. [71] have shown that N fertilizer applied to camelina and pennycress early in the spring at a similar rate as used in the present study, was mostly taken up by these crops. However, in Weyers et al.’s study, camelina and pennycress were sown after spring wheat (Triticum aestivum L.) and relayed with soybean the following year [71]. In all three sites, sequences with cover crops had lower N-related field emissions than the control with an average reduction of 8% at Ames, 26% at Morris, and 21% at Prosper. The soybean/rye-soybean (S/Rye-S) was the best sequence to reduce GWP at Ames and Morris, given that winter rye was the only cover crop that did not receive any fertilization in Year 2. In Prosper, where no sequence was fertilized over the 2-year period of the experiments, it was not possible to see a difference between the field emissions of the three sequences with cover crops. This result can be attributed to the model employed to estimate the N2O field emissions, which has a higher sensitivity to the fertilizer type and rate than to the type of crop [44]. Interestingly, the GHG field emissions in camelina and pennycress sequences at Prosper (393 kg CO2 eq. ha−1 year−1) were higher than the same sequences at Morris (250 kg CO2 eq. ha−1 year−1), even if the former received an extra N-fertilization. This can be attributed to different characteristics of the two sites, as mentioned above, in particular regarding the soil conditions: for instance, the lower drainage in Prosper compared with Morris created more favorable conditions for higher fluxes of N2O to the atmosphere [72].
It must be stressed that some fertilized sequences such as S/Cam-S and S/Pen-S at Morris site had higher total GWP than the control (continuous soybean (S-S) sequence) while having lower N2O field emissions. This because, in an LCA, the other important contributor to the overall GWP in agricultural soils is the GHG emissions associated with the production phase of fertilizers, in particular N-fertilizers, whose production is energy-demanding [73]. As shown in Figure 1, the contribution of N-fertilizer production to the total GWP was the first source of GHG emissions for the sequences with the higher fertilization rate (S/Cam-S and S/Pen-S at Ames, where 126 kg ha−1 of N-fertilizer were applied over a 2-year period). In addition, in sequences with cover crops, fuel consumption is higher than conventional systems (due to a higher number of field operations such as sowing and harvesting or terminating the cover crop) and producing cover crop seeds for sowing has an associated environmental impact as well.
The GWP associated with soybean seed production—which is the same for each sequence in the study, 296 kg CO2 eq. ha−1 year−1—was among the first three sources of GHGs in all cropping sequences, along with N2O field emissions and N-fertilizer production. Its relative contribution to the total GWP was higher in sequences with lower or no N-fertilization; it was the first source of GHGs in Morris (for the sequences with cover crops) and the second in Prosper, after N2O field emissions.
Overall, based on the information available from this dataset, it seems that if the sequences with cover crops do not receive any extra N-fertilization compared with the control, the GWP per hectare over the whole 2-year cropping system can be reduced by the presence of cover crops. In all sites, winter rye was the best cover crop to reduce GWP compared with the control. However, when no fertilization to the cover crops was provided (i.e., Prosper site), the difference between the GHG emissions of the sequences with cover crops was minimal (within a 3% range).

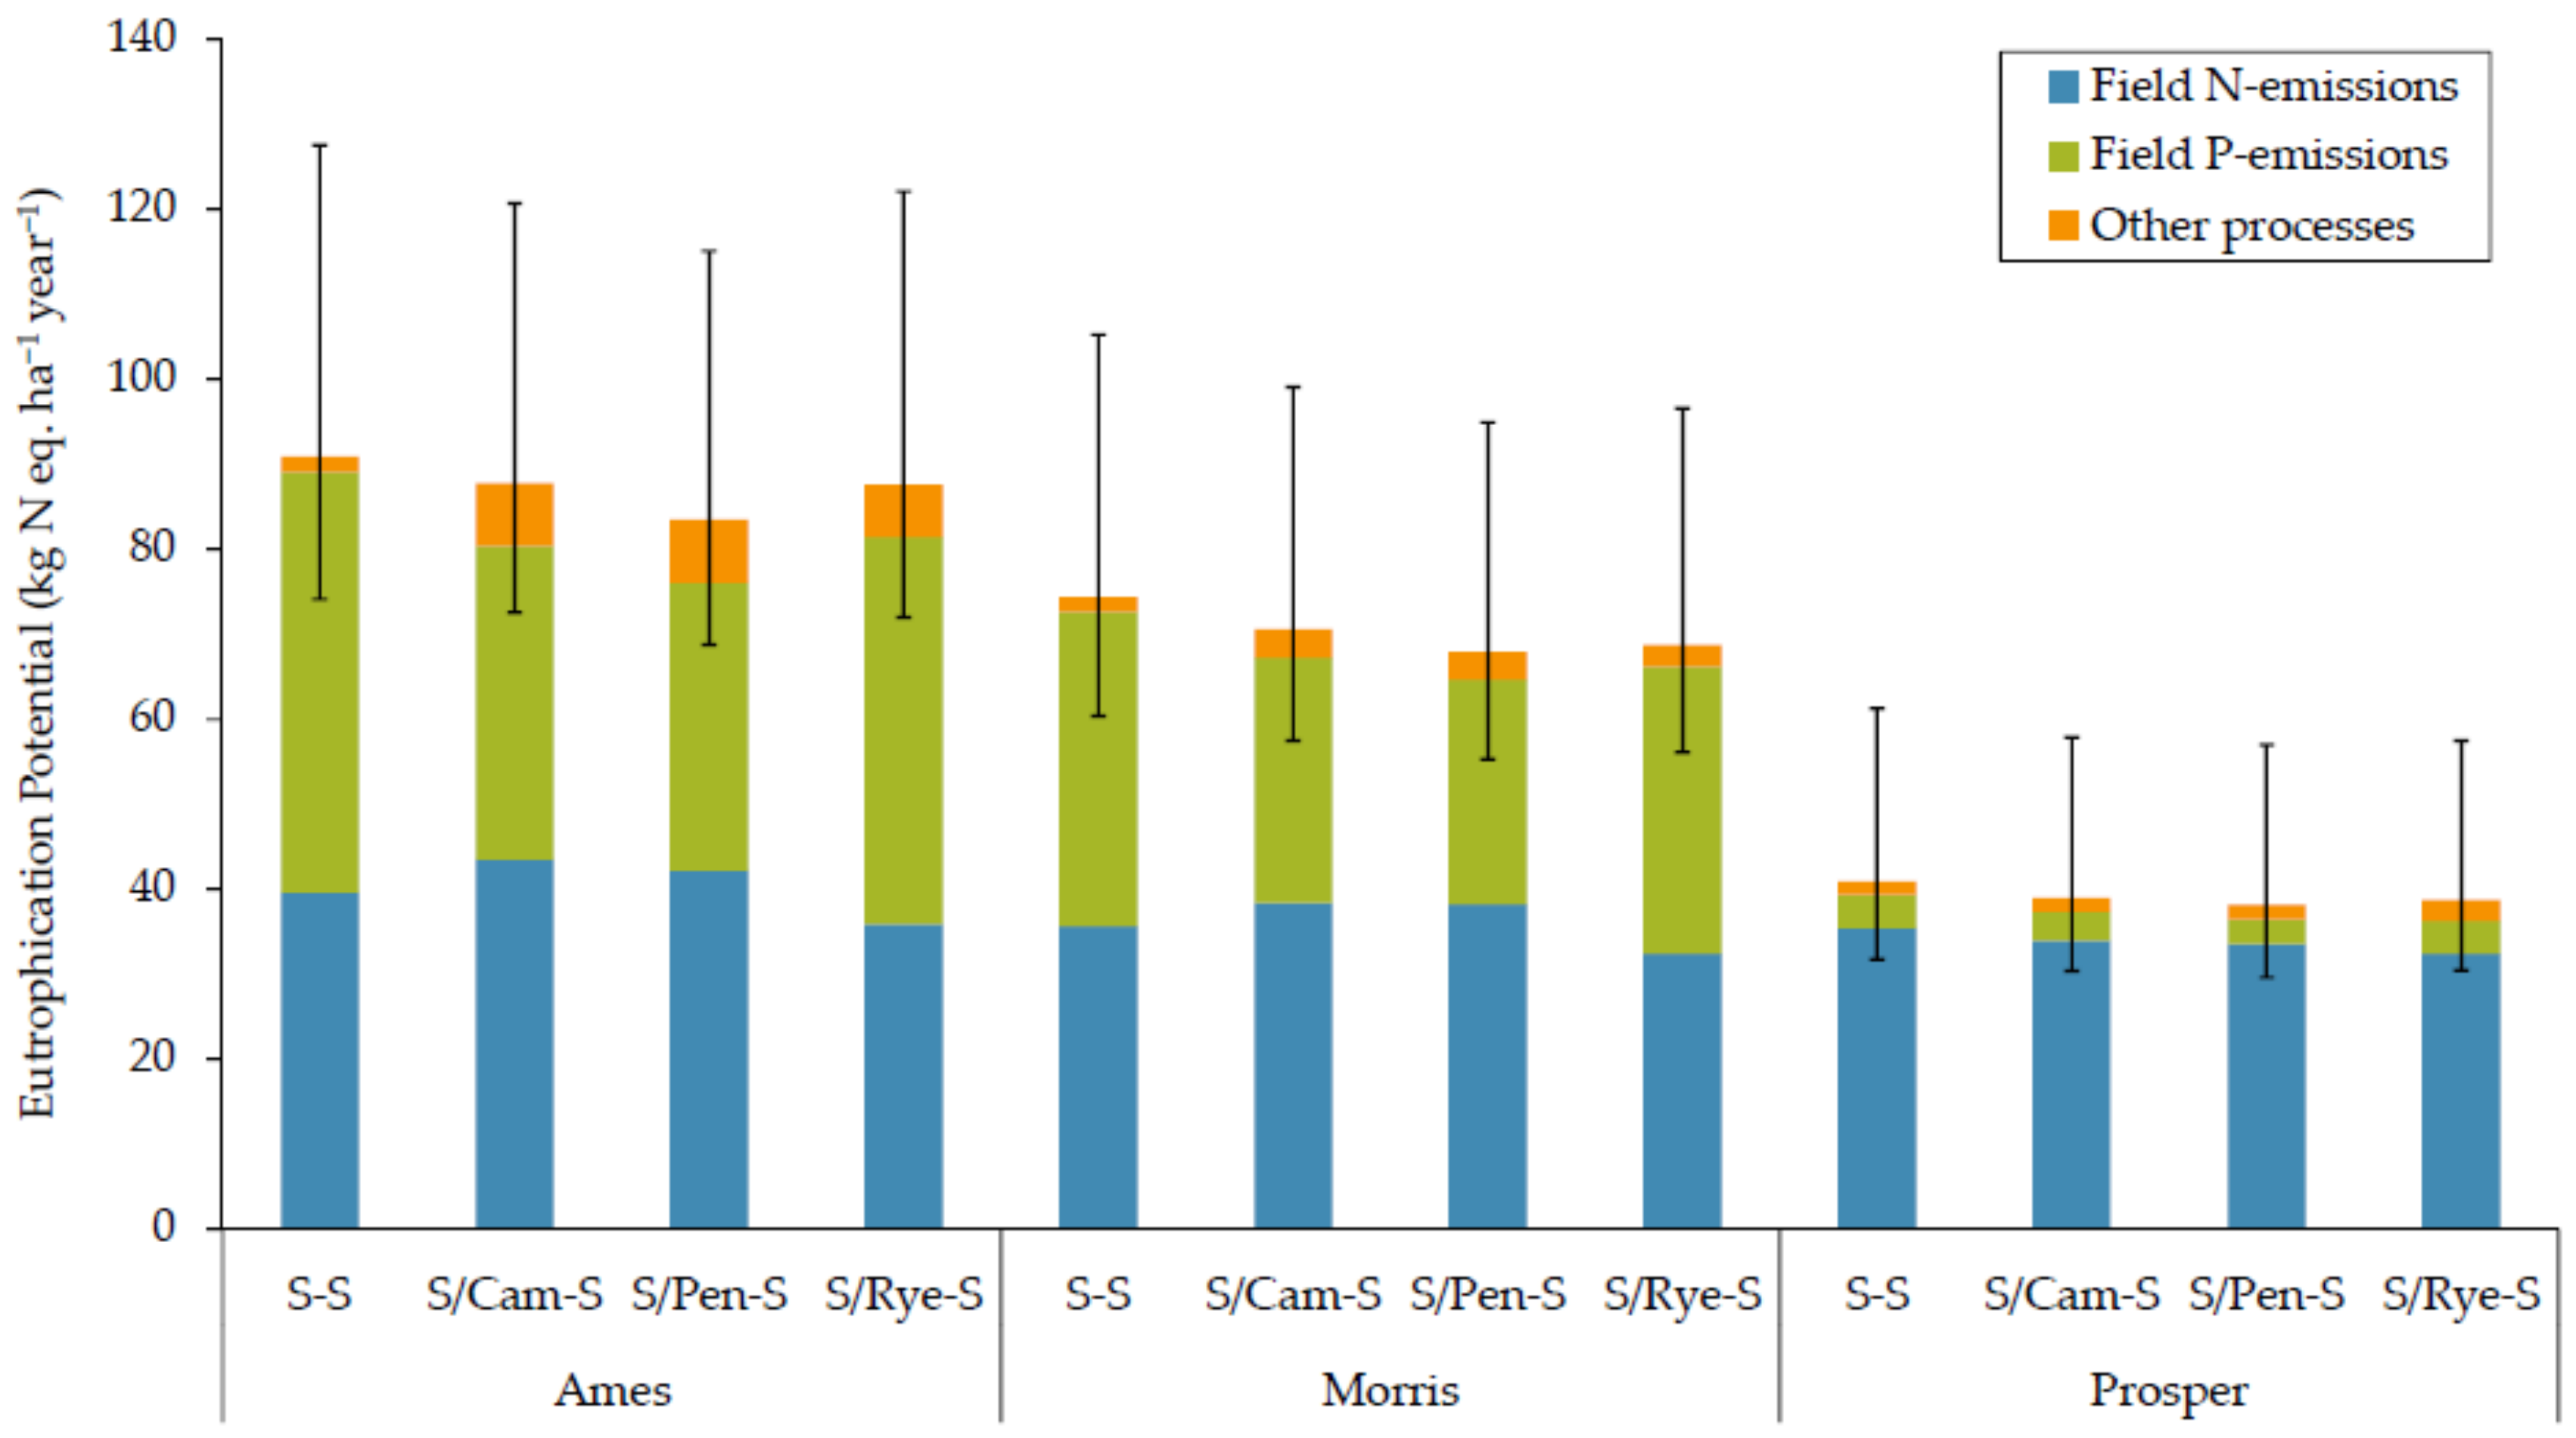
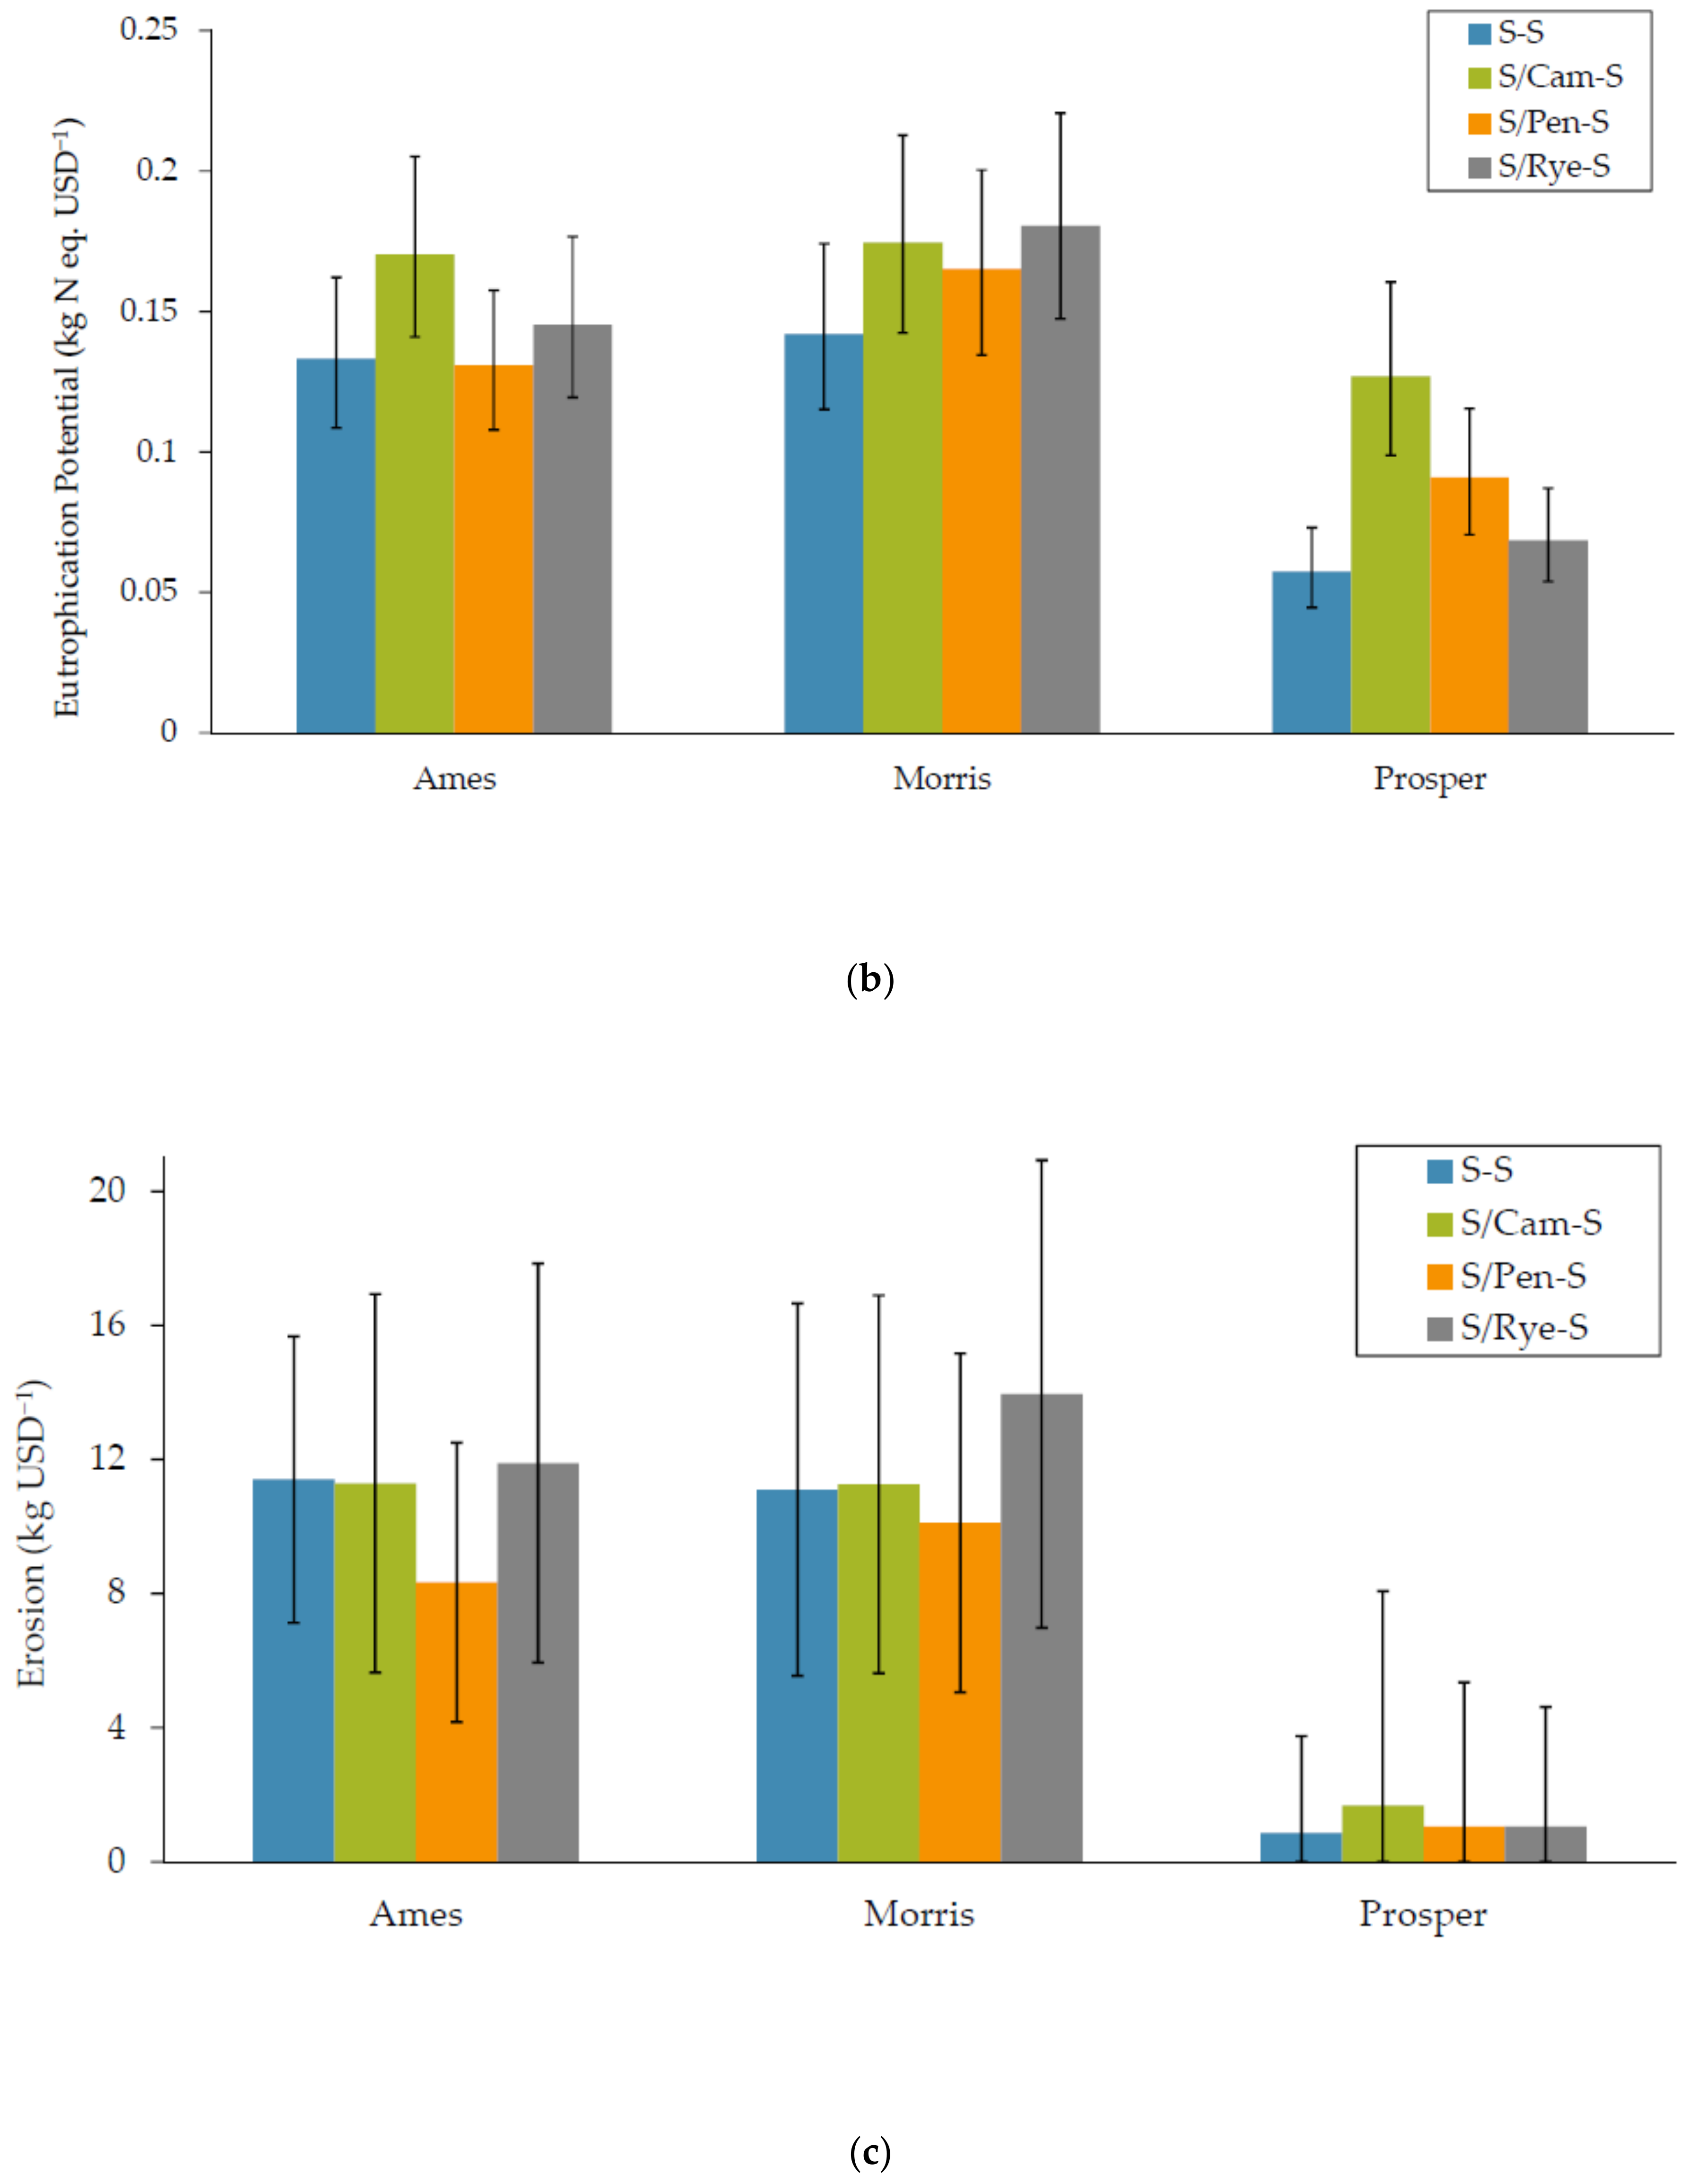
3.1.2. Eutrophication

At all three locations, the sequences with cover crops showed a lower eutrophication potential than the control (Figure 3), even if the reduction was only in a 4 to 9% range (annual average of a 2-year period). The most effective cover crop to limit eutrophication was field pennycress, followed by winter rye and winter camelina. The limited effect of cover crops on nutrient leaching and runoff can be explained by a low cover crop coverage in both fall of Year 1 and spring of Year 2 [34], which might have limited the nutrient uptake. A closer look at the contribution of different sources of eutrophication in the LCA can provide a better understanding of the results shown in Figure 2. Field N- and P-losses, combined, were responsible for 93–98% of the total eutrophication potential. The remaining sources were primarily associated with the production phase of fertilizers, seeds, and pesticides.
Overall, cover crops reduced nitrate leaching processes at all locations. Similar results are reported in Mohammed et al. [37] on the same experiment but analyzing a larger dataset. Nitrogen uptake in soybean is very limited during the first month after planting [74]. This means that the N mineralized from the decomposition of the previous year residues, along with residual N from fertilization (if any), can be partially lost in form of nitrate leaching or N2O emissions, from soil thawing to early-mid June in the upper Midwest. Therefore, this is a critical time-window in a continuous soybean system with potentially high N environmental losses, and cover crops can provide a N scavenging function to the cropping system. At Prosper, cover crops lowered nitrate leaching, although the reduction was very limited (1.5–3 kg NO3-N ha−1 in Year 2, with an annual average of <2 kg NO3-N ha−1 year−1). At Ames and Morris, camelina- and pennycress-containing sequences had higher nitrate losses than the control (an increase in NO3-N leaching of 5.4–7.6 kg ha−1 in Year 2, while the annual average over the two-year period was 2.4–3.7 kg NO3-N ha−1), but such sequences received an additional fertilization of 78 kg N ha−1 in Year 2. Therefore, the results of the nitrate leaching model suggest that the sequences with camelina and pennycress used a large part of the N-fertilization received in Year 2, reducing the potential increase in nitrate losses due to the additional fertilization. This result is in line with the findings from other studies where camelina and pennycress were relay-cropped with soybean [71,75,76,77].
The positive effect of the cover crop on lowering the eutrophication potential becomes more evident when looking at P-related losses. The phosphorus component of the eutrophication is mainly dependent on the runoff of soil particles rich in P due to water erosion [78]. One of the primary purposes of using cover crops is to protect the soil by reducing erosion and nutrient losses [79]. At all locations, cover crops reduced P losses by erosion. When compared with the control, pennycress was the most effective cover crop to lower P losses, followed by camelina and rye.

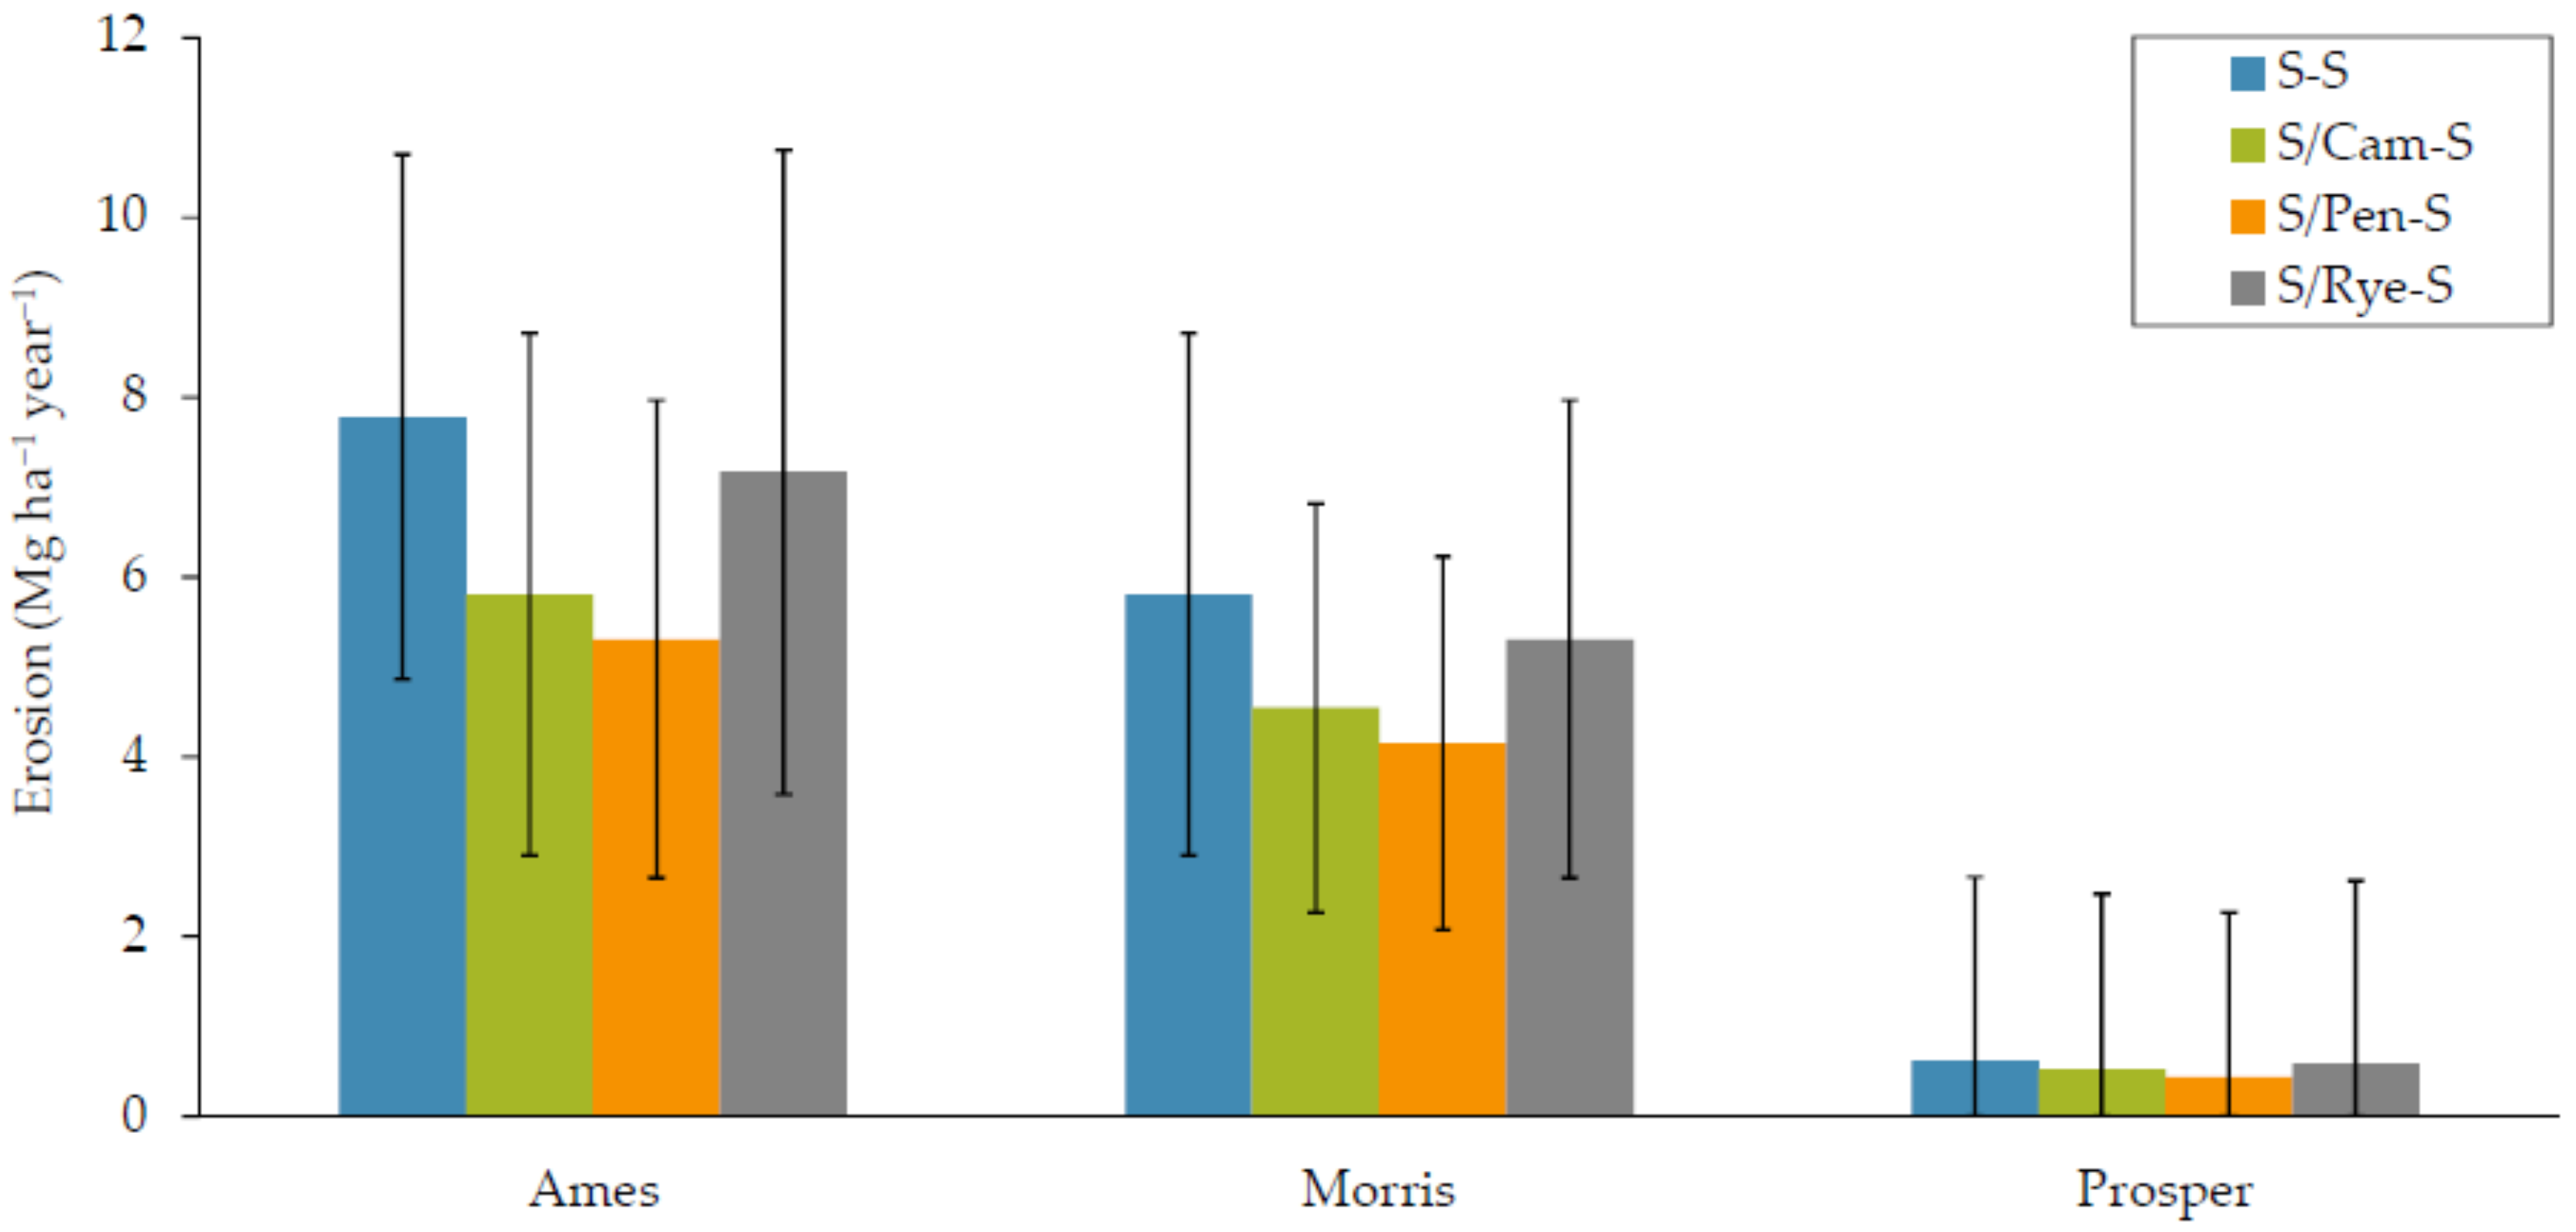
3.1.3. Soil Water Erosion

The living cover of winter-hardy cover crops during the first part of the fall and early spring, in conjunction with the cover crop residue left on the soil during the winter period, can significantly reduce the impact of water erosion on agricultural soils [79]. The simulations with RUSLE2 confirmed the ability of cover crops in limiting water erosion in the sequences assessed in this study. In all locations, on average, sequences with cover crops had lower erosion rates than the control (Figure 4). Pennycress had the best performance (a 30% lower erosion rate than the control), followed by camelina (21%) and rye (7%). Pennycress had a better result than camelina due to the higher biomass production in the spring of Year 2. Both brassicas outperformed rye likely due to a longer permanence on the field in Year 2. Rye was terminated between the end of April (Morris) and the beginning of May (Ames and Prosper), while camelina and pennycress were harvested between mid-June (Ames) and the end of July (Morris and Prosper). The overall lower erosion for all sequences in Prosper depended on the geomorphological characteristics of the site, which has almost no slope and therefore was subject to limited runoff phenomena.
A 7–30% erosion reduction in the sequences with cover crops across all locations was achieved despite a low cover crop biomass production both in the fall of Year 1 and spring of Year 2 [34]. This means that optimizing the cover crop field management (e.g., using short-season soybean cultivars that allow a longer establishment window for cover crops in a double or relay cropping system, or developing cover crop cultivars with an improved performance in relay-cropped systems) could lead to a higher cover crop biomass production [77], particularly in fall of Year 1, likely further decreasing erosion rates.

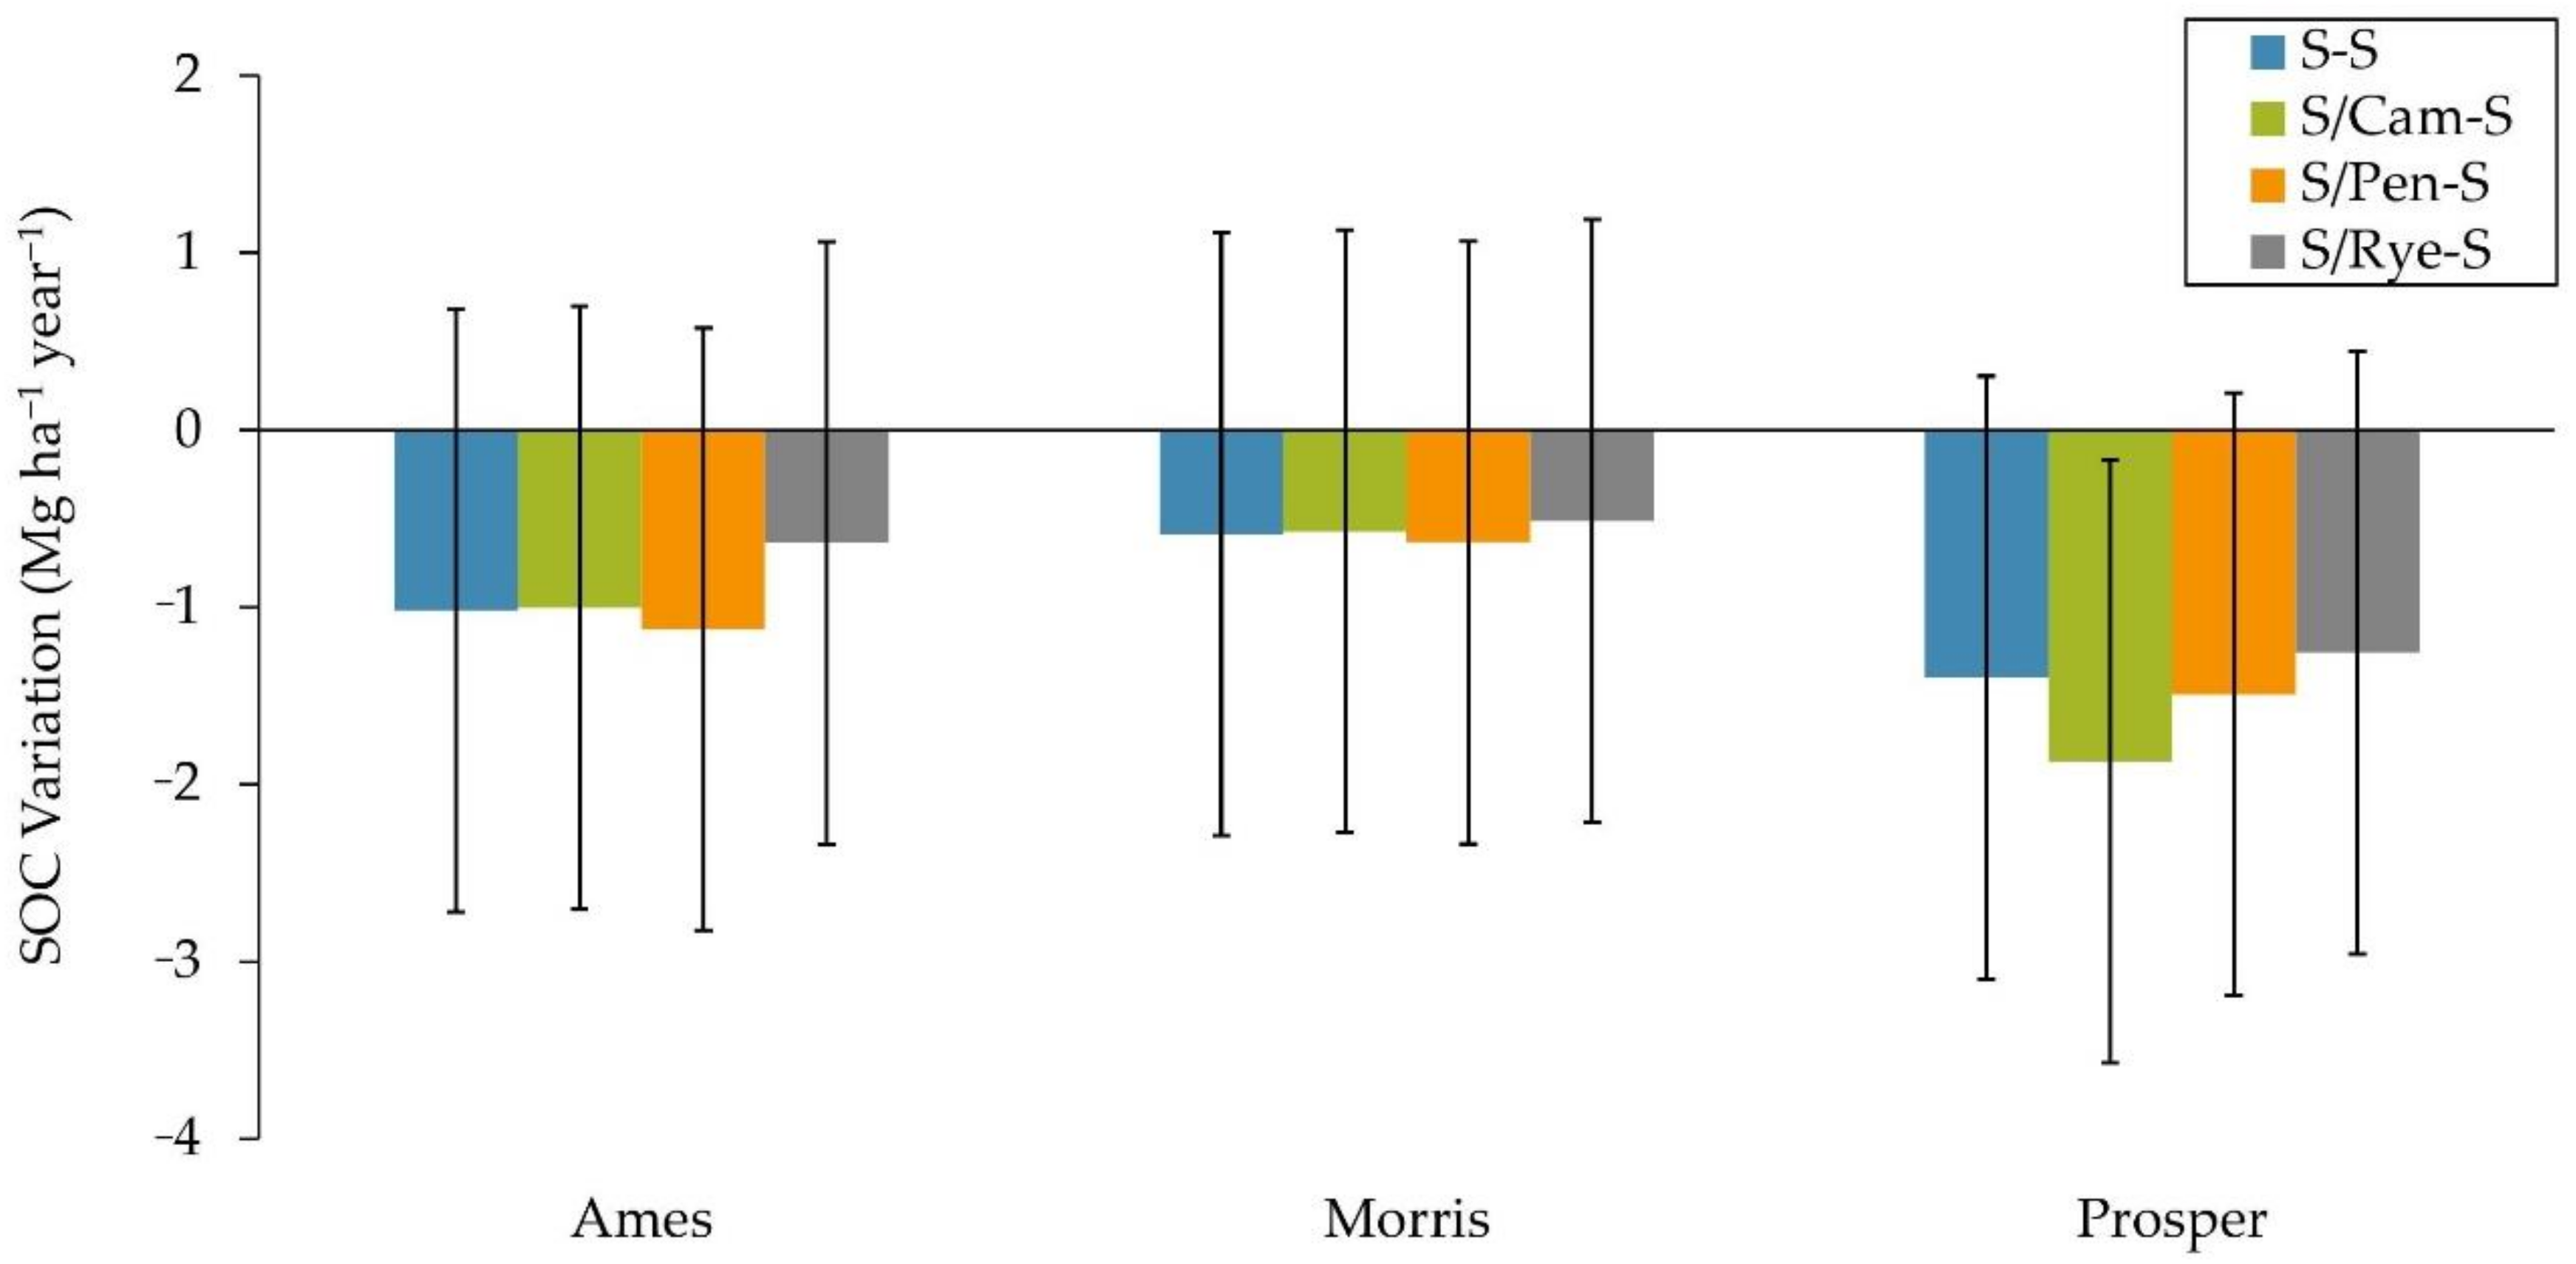
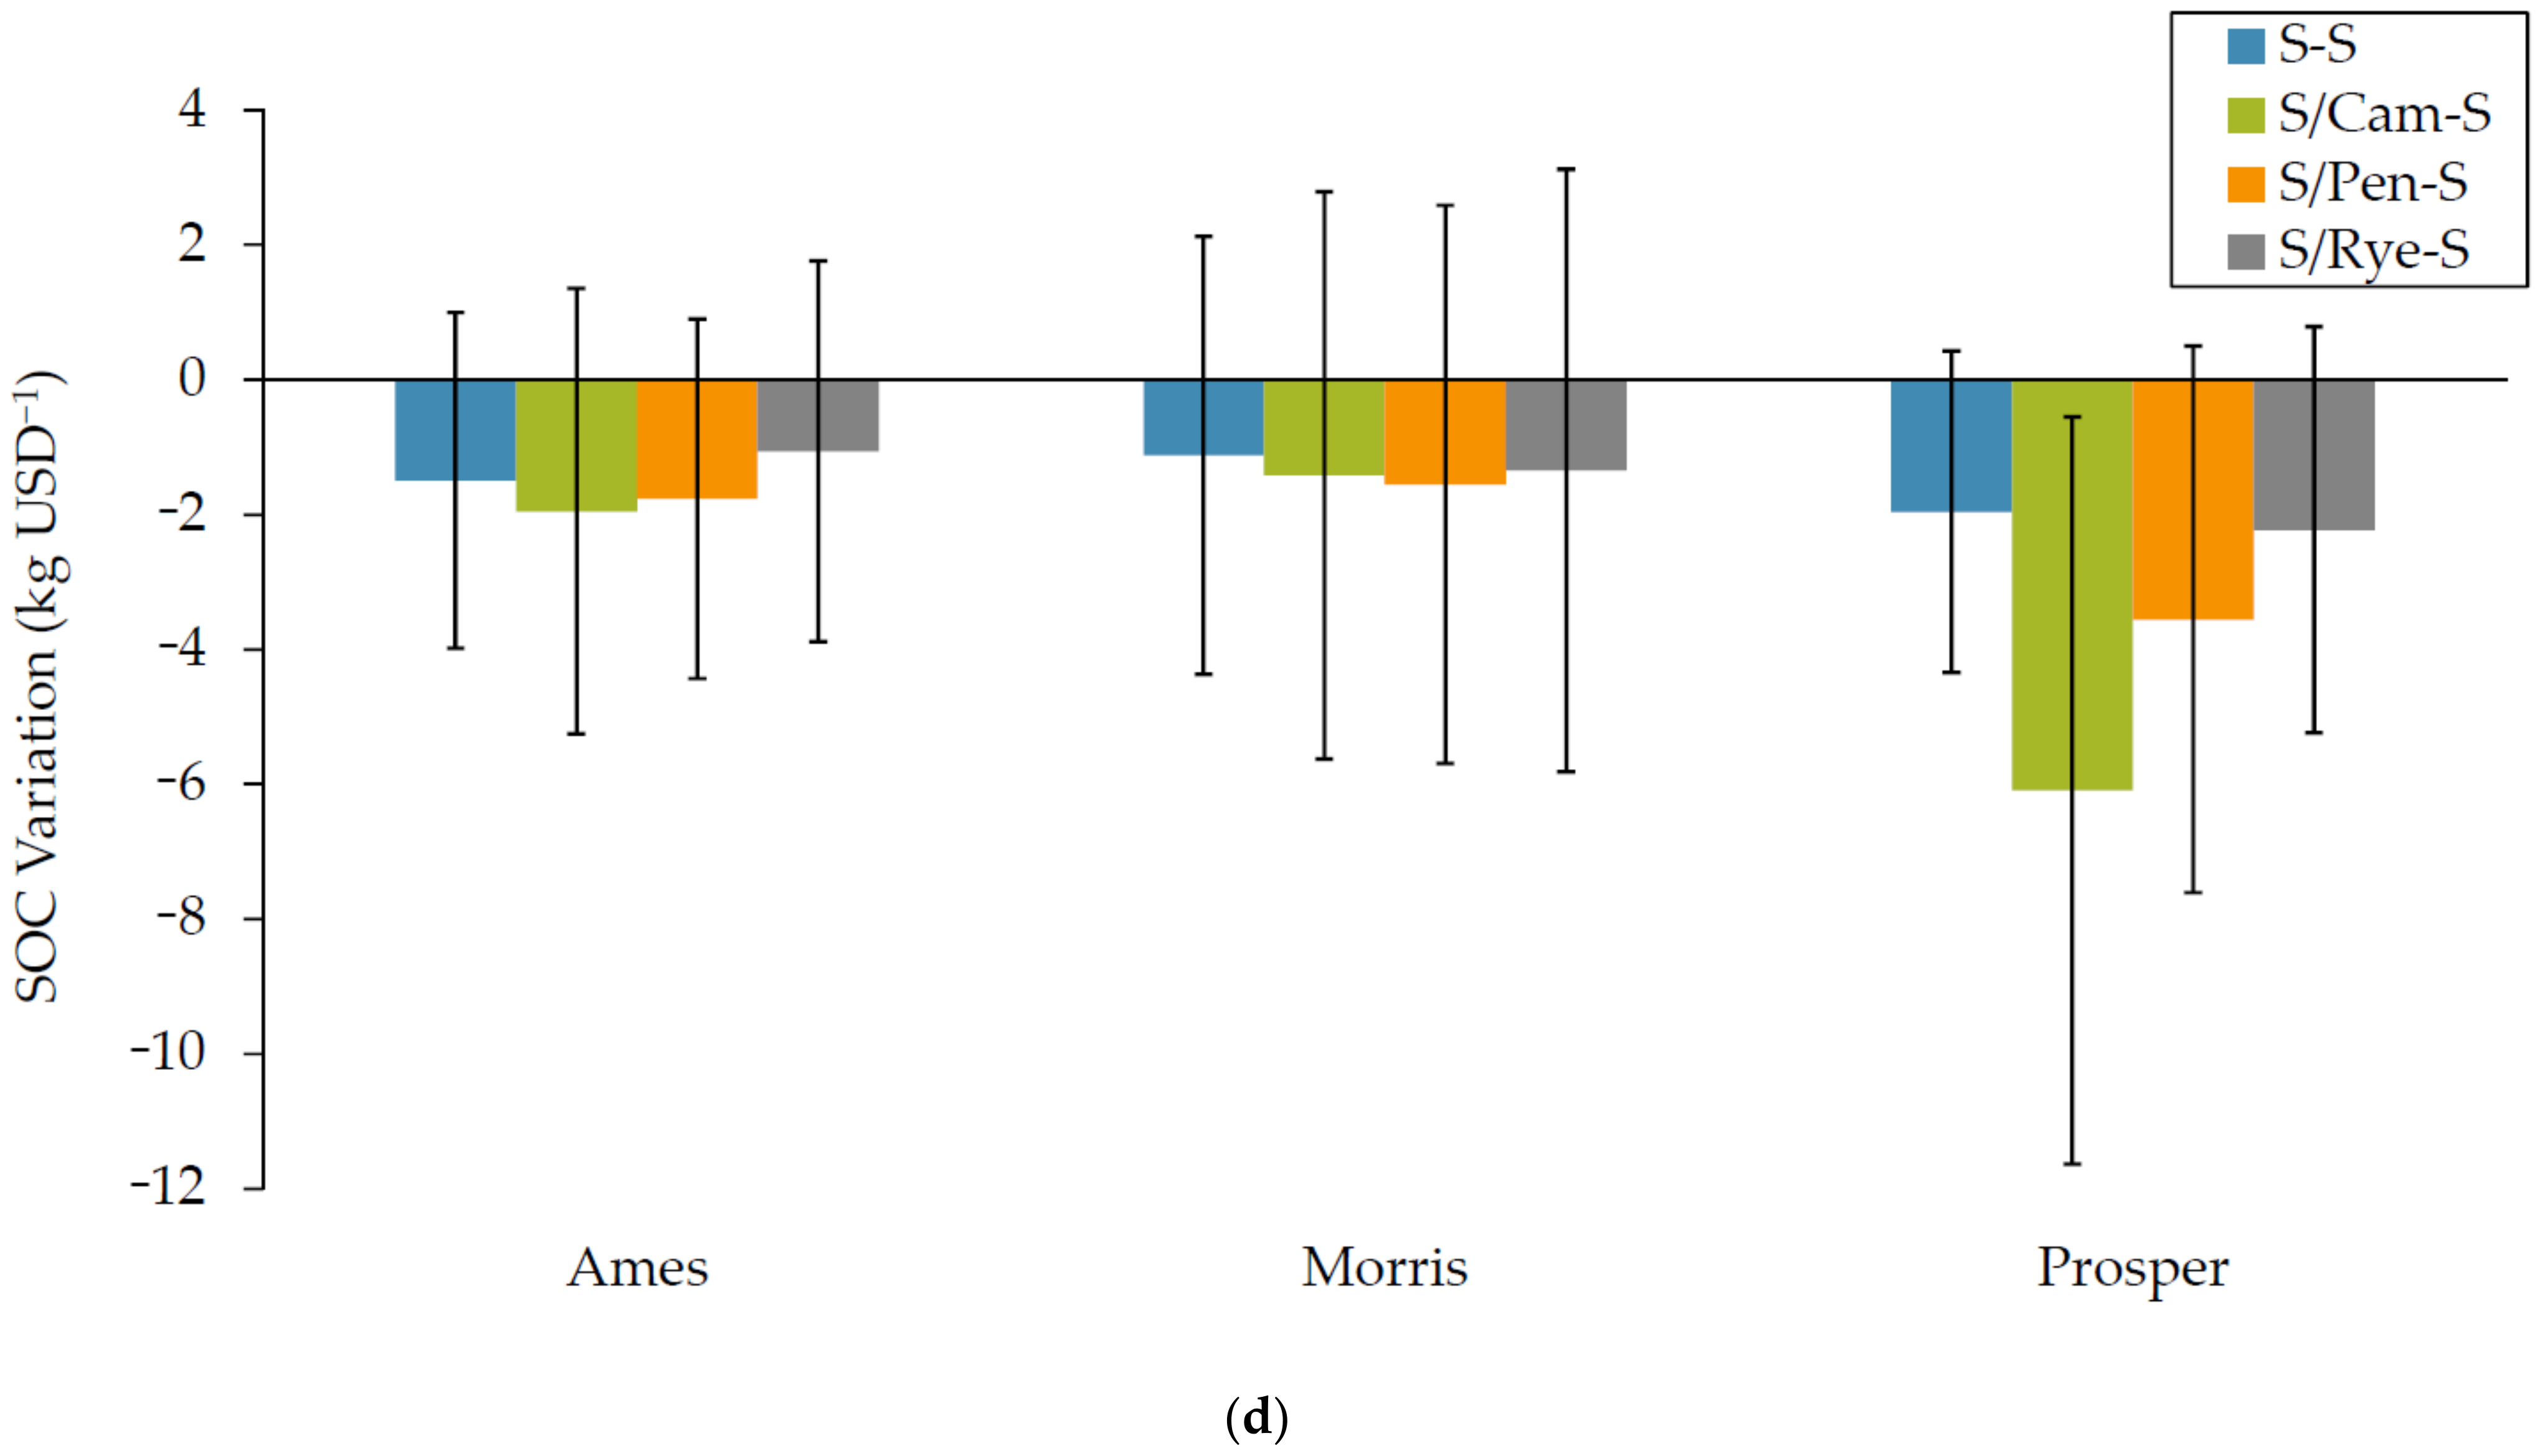
3.1.4. Soil Organic Carbon (SOC) Variation

The two-year continuous soybean—with or without cover crops—was not able to provide enough aboveground residues to compensate for the SOC loss of the cropping system, and in all sequences presented in this study a SOC depletion was estimated (Figure 5).
Soybean alone does not produce enough biomass to maintain the levels of SOC in agricultural soils, leading to a net loss of SOC in the long term [61,80,81]. In addition, C mineralization of residues is faster in soybean compared with maize (Zea mays L.) and wheat due to the presence of higher soluble C and a lower C/N ratio in the residues [82,83]. Winter cover crops can be employed to provide an additional source of C to the soil [17,84] and reduce the SOC depletion by monocultural soybean in the long-term [16,85]. In all locations, S/Rye-S was the sequence with the lowest SOC debt, while the other sequences with cover crops had mixed results across the three sites of the study. In Ames and Morris, S/Cam-S was the second-best treatment after the S/Rye-S sequence and before the control and S/Pen-S, but the values of these three sequences were very similar. In Prosper, S/Cam-S was the sequence with the highest SOC depletion, followed by S/Pen-S and the control. This performance of the sequences with brassicas is mainly due to the effect of these cover crops on the soybean biomass production in Year 2. Relay-cropping soybean into standing camelina and pennycress in Year 2 caused an average reduction in soybean residues between 7% and 25% in Ames and Morris and even higher in Prosper (54% and 40% reduction in S/Cam-S and S/Pen-S sequences, respectively). Significant reductions (28%) in main crop biomass were found in previous experiments in Prosper when soybean was relay-cropped with camelina [22]. Such reduction in C input to the soil from soybean residues was only partially offset by the cover crop biomass at all locations, leading to a worse performance of camelina than rye and in most cases than the control. However, the data refer only to a 2-year experiment, and more research is needed to confirm such dynamic in continuous soybean cropping systems with camelina and pennycress as winter cover crops.

3.2. Economic Functional Unit (FU2)

When considering revenues and costs associated with each sequence in the impact assessment, there are significant changes in the performance of the cropping systems studied. The results expressed with the FU2 (economic functional unit) are shown in Figure 6a–d, where each environmental impact considered is attributed to a USD 1 net margin for the farmer. The economic functional unit shows the cost-effectiveness of each sequence in reducing the environmental impacts considered in this study. Therefore, for GWP, eutrophication and soil erosion impact categories, higher values mean higher impact per USD net margin generated by the sequence, while for the SOC variation, more negative values mean higher impact. The higher impact per USD net margin can be due to higher production costs (e.g., additional field operation associated to cover crop management) or lower income (e.g., lower cumulative yields).
At Ames, when compared with the control, the sequence with camelina significantly reduced its performance for all impacts considered while changing from FU1 to FU2. The sequence S/Cam-S was the sequence with the highest GWP USD−1 (FU2), while the sequence with pennycress had the highest GWP ha−1 yr−1 when expressed with the land-based functional unit (FU1). In addition, the sequence with camelina presented higher eutrophication potential and SOC depletion per USD than the control, while it was the opposite for FU1. In the erosion category, S/Cam-S and the control were very close to each other for FU2 (1% difference), while camelina outperformed sole soybean with a 25% higher erosion reduction for FU1. These results for the camelina sequence for FU2 were mainly caused by a 15% reduction in soybean seed yield compared with sole soybean in Year 2. Camelina additional seed yield (138 kg ha−1) did not compensate for the yield reduction in soybean. The S/Pen-S sequence was the most effective system to curb eutrophication and soil erosion for both FUs, despite an overall lower performance (an average 7% across all impact categories) for FU2 than FU1. The S/Rye-S sequence also reduced its performance in all categories (by an average 11.5%) between FU1 and FU2, which led to higher levels of GWP, eutrophication, and erosion per USD net margin than the control; however, S/Rye-S was the most effective sequence to reduce SOC depletion.
At Morris, all sequences with cover crops had a higher level of impact than the control in three out of four categories when comparing FU1 with FU2. The sequence with camelina reduced its performance by 31%, S/Pen-S by 29%, and S/Rye-S by 35%. While using the FU2, sole soybean became the best sequence for the categories GWP (S/Rye-S was the best sequence for FU1), eutrophication (S/Pen-S for FU1), and SOC variation (S/Rye-S for FU1). The S/Pen-S sequence was still the best sequence to reduce soil erosion in FU2, but the difference with the control decreased from 29% with FU1 to 9% with FU2.
At Prosper, the introduction of the economic component in the assessment led to a major variation of the results across the three sites. When expressed with the FU1, all sequences with cover crops had lower GHG emissions than the control for the GWP impact category (Figure 1), while with the FU2 the control had the best performance (lowest GWP) and S/Cam-S turned out to be the sequence with the highest GWP USD−1 (Figure 6a). Sequences with camelina and pennycress were the most effective sequences to curb the eutrophication per ha year−1 (FU1), followed by the sequence with rye (Figure 2). Using the economic FU, sole soybean became the best system, while the sequences with camelina and pennycress had the highest eutrophication USD−1 (Figure 6b). The S/Pen-S sequence was the most effective to control erosion per ha year−1, followed by S/Cam-S, S/Rye-S, and the control (Figure 3). With the FU2, no sequence with cover crops performed better than the control (Figure 6c). Similar results were obtained for the SOC variation category as well, where the control became the best system for FU2.
The overall negative performance for the sequences with cover crop mainly depended on the reduction in the revenues from the soybean yield. In Prosper, where the sequences with brassicas had the worst performance among all three locations, soybean seed yield in Year 2 was reduced by 54% in S/Cam-S, 39% in S/Pen-S, and 15% in S/Rye-S. These particularly negative results for camelina and pennycress at Prosper seem to suggest that the complete lack of fertilization over the two-year period can affect the economic sustainability of these sequences by considerably reducing soybean yield and its revenue. At Ames and Morris, where only the sequences with camelina and pennycress were fertilized with N in Year 2, soybean seed yield reduction occurred in all sequences with cover crop [38]. A soybean yield reduction in Year 2 was expected given that soybean was relay-cropped with camelina or pennycress (while rye was terminated two weeks before sowing soybean). Ott et al. [75] reported a 22–30% yield penalty on soybean relay-cropped with camelina and pennycress in Minnesota, and similar values were reported in Johnson et al. [86] and Gesch et al. [32]. Even higher soybean seed yield reductions were reported in Berti et al. [33] in Morris (47%) and Prosper (71%) for a soybean relay-cropped system with camelina when compared with soybean monoculture at normal seeding rate. However, in studies where soybean was relay cropped into camelina or pennycress, the soybean yield losses were generally offset by the oilseeds yield [32,75,86,87]. In our study, the total oilseed yield (soybean plus camelina or pennycress) for the S/Cam-S and S/Pen-S sequences was lower than the sole soybean yield at all locations, leading to a reduction in the performance for the sequences with camelina and pennycress when the results of the assessment were expressed per USD net margin. In economic terms, the sequences with pennycress as winter cover crops performed better than sequences with camelina in all locations. Although the sole soybean had a higher net margin than the sequences with cover crops in all locations, the findings of the economic assessment seem to indicate that fertilizing camelina and pennycress with N led to better economic results than a field management that did not include cover crop N-fertilization.
These results suggest that introducing camelina and pennycress as winter cover crops in soybean monoculture can generate multiple environmental benefits. From an economic perspective, the profitability of the cropping system used in the present study (i.e., broadcast interseeding covers into standing soybean followed by relay cropping soybean) seems to be a critical barrier to make such a cover crop system a sustainable option for the farmer [28,35]. Cropping systems were camelina and pennycress were interseeded with a no-till drill after harvesting a short season crop (i.e., spring wheat), and soybean was relay-cropped into the cover crop the following year, showed more promising results in economic terms [32,75]. Therefore, improvement of field management of winter oilseed cover crop relay systems is needed to optimize both winter oilseed and soybean yields so that the system is economically comparable or higher than a sole full-season soybean crop.

3.3. The Environmental Impact of the “Soybean N-Credit”

In the maize–soybean cropping system, fertilizer recommendations in the USA often attribute an “N-credit” for maize following soybean, which is the amount of fertilizer that can be subtracted from the total N-fertilization recommended for maize. The estimated credit can vary, but an average 45 kg N ha−1 is often reported in the literature [88,89]. Such soybean N-credit to the following crop is not likely a net contribution from the N2 fixation process, but rather is caused by an enhancement of the N mineralization in the soil due to the low C/N ratio of the soybean residues [90]. Soybean, like other legumes, enhances N mineralization in soil, which also increases nitrate leaching [91,92]. However, even if residues with a low C/N ratio have generally higher N mineralization rates than residue with a higher C/N ratio, studies show that such a parameter is insufficient to predict the levels of mineral N in soil [82]. Green and Blackmer [89] suggest that it might depend on the N immobilization–mineralization dynamics in the soil during residue decomposition rather than by the mineralization of the atmospheric N2 fixed by soybean. Over the last decades, multiple factors have been identified as significant in explaining the soybean N credit. Quality (e.g., C/N ratio), quantity, and timing of residue incorporation are considered key elements to regulate the N mineralization processes in the soil [88,89], as well as the cropping sequence [93] and other local conditions such as drainage [94]. Ciampitti et al. [95] suggested that the N mineralization and immobilization of the soybean residues only partially explain the soybean rotation effect. Further studies are needed to look at the whole N cycle, including GHG emission, N leaching, root N excretion, and atmospheric N deposition.
In our study, a simulation with a soybean N-credit from Year 1 to Year 2 was run to evaluate its impact on GHG emissions and nitrate leaching. An extra fertilization of 45 kg N ha−1 in Year 2 for each cropping system studied was added to the cropping system. The results of the assessment showed a slightly better performance for sequences with cover crops in reducing nitrate leaching from the extra N input compared with the control (3–7% reduction) for all sites. The increase in N2O emissions due to the N credit was between 48% and 74% lower in sequences with cover crops than the control in Morris and Prosper, while only the S/Rye-S sequence had lower N2O emissions than the control in Ames.
Given that the level of uncertainty of these results is very high, no clear conclusion can be drawn about the effect on cover crops in reducing the N losses due to the “soybean N-credit”. The difficulty of properly assessing the contribution of the N-credit in this study can be ascribed to three main factors.
First of all, the “soybean N-credit” is not a real N-credit for the 2-year cropping system. In the simulation, it was assumed that an extra credit of N was entering the system in Year 2, which actually alters the N mass balance in the system. It is important to stress that such mineralized N after soybean is not a net credit coming from the soybean cropping system in Year 1. Several studies pointed out that the soybean N budget is negative due to a higher N removal from seed production than N2 fixation [96,97]. In their review of studies on the N cycle for soybean based on six hundred and thirty-seven datasets, Salvagiotti et al. [90] estimated that the average soybean N balance was negative even if close to neutrality (−4 kg N ha−1). Therefore, the soybean N-credit is not a N gain for the system, which is a matter of concern in continuous soybean cropping systems where there is a depletion of soil N, particularly in high-yielding soybean cultivars [90].
Secondly, the models employed to estimate nitrate leaching and N2O emissions are not able to describe the complete N cycle in soil, making it difficult to model the complexity of the nitrification–denitrification process. Studies show that sources of N coming from residues have a different dynamic in soil than N from fertilizer [98], and fertilization can negatively affect the N mineralization process, modifying the N availability in soil [92]. Martinez-Feria et al. [99] pointed out an asynchrony between N soil mineralization and crop uptake is responsible for a part of the environmental losses of N. In addition, soil mineral N content and N2O soil emissions might not be closely related; therefore, the levels of mineral N cannot be used as a proxy indicator for N2O soil emissions [98]. These studies show that soil N losses have complex spatial and temporal dynamics, which are only partially known to date.
Finally, there is still a limited knowledge of the N cycle for soybean and how such crop interacts with other crops. Legumes seem to increase N2O emissions compared with non-leguminous crops due to N2-fixation and mineralization processes, but such emissions may not be as high as those coming from N-fertilization [98]. Conservation agriculture practices such as the use of cover crops and residue return have both demonstrated the ability to reduce N2O fluxes in soybean [100]. Winter rye cover crop following soybean under conservation tillage can reduce spring residual soil nitrate between 18% and 33% before planting maize [101]. However, a mixture of crop residues (e.g., soybean plus cover crops) might influence the soil nitrogen cycle differently than a monoculture, making the comparison between cropping systems harder to assess [102].
Based on the results of the assessment and the abovementioned literature, it can be inferred that the residues from the sequences with cover crops may affect the soil N cycles differently than sole soybean. However, further studies should be conducted to confirm such a hypothesis and quantify the impact of cover crops and relay cropping systems.

4. Conclusions

Relay-cropping new winter cover crops such as winter camelina and field pennycress with soybean in the U.S. upper Midwest is a new practice of temporal and spatial ecological intensification that can have multiple potential benefits for the agricultural sector, including an improvement of the ecosystem services provided by the cropping system. The results of this study, to some extent, support such an assumption, showing better field emissions related to nitrogen and phosphorus cycles in the sequences with camelina and pennycress in comparison with sole soybean. Overall, decreased eutrophication potential and soil erosion rate than the control per ha year−1 were estimated in camelina and pennycress at all locations, in addition to a lower global warming potential when the cover crop did not receive additional N-fertilization. However, when the economic component was included in the assessment, and the results were expressed per USD net margin, the sequences with cover crops significantly reduced their performance in all categories of impact. This divergence between the results for the two functional units used in the assessment (ha year−1 and USD net margin) is evident in all locations and can be attributed to the negative effect of the winter crops on soybean yield in Year 2, when soybean was relay-cropped into standing camelina or pennycress. The significant soybean yield reduction in the sequences with winter crops (particularly at Prosper) was not offset by the winter crop seed yield, leading to a lower net margin for the farmer and therefore a higher environmental burden per USD net margin generated.
Using multiple functional units to express the results of the assessment had enabled a better understanding of the overall sustainability of the cropping systems examined. The findings of this study suggest that a further optimization of field management for winter camelina and pennycress is needed to make the whole cropping system more sustainable and contribute to successful ecological intensification of conventional cropping systems. Finally, more research is also needed to overcome the limited availability of models able to accurately estimate the field emissions of relay-cropping systems and therefore contribute to improve the overall results of the LCA process.

Author Contributions

Conceptualization, A.C. and M.T.B.; methodology, A.C. and G.P.; software, A.C.; validation, A.C. and G.P.; formal analysis, A.C.; investigation, A.C.; resources, M.T.B.; data curation, A.C., Y.A.M. and S.P.; writing—original draft preparation, A.C.; writing—review and editing, A.C., G.P., R.W.G., Y.A.M., S.P., A.W.L. and M.T.B.; visualization, A.C.; supervision, A.C. and M.T.B.; project administration, M.T.B.; funding acquisition, M.T.B. All authors have read and agreed to the published version of the manuscript.

Funding

This research was funded by USDA-National Institute of Food and Agriculture-Coordinated Agricultural Program, Grant/Award Number: 2016-69004-24784 and North Dakota State University Agricultural Experiment Station hatch project ND01586.

Institutional Review Board Statement

Not applicable.

Informed Consent Statement

Not applicable.

Data Availability Statement

Not applicable.

Acknowledgments

The first author thanks John F. Nowatzki, Burton L. Johnson and David W. Franzen for their expertise and useful discussions.

Conflicts of Interest

The authors declare no conflict of interest. The funders had no role in the design of the study; in the collection, analyses, or interpretation of data; in the writing of the manuscript, or in the decision to publish the results.

References

  1. Cassman, K.G. Ecological intensification of cereal production systems: Yield potential, soil quality, and precision agriculture. Proc. Natl. Acad. Sci. USA 1999, 96, 5952–5959. [Google Scholar] [CrossRef] [Green Version]
  2. Bommarco, R.; Kleijn, D.; Potts, S.G. Ecological intensification: Harnessing ecosystem services for food security. Trends Ecol. Evol. 2013, 28, 230–238. [Google Scholar] [CrossRef]
  3. Pervaiz, Z.H.; Iqbal, J.; Zhang, Q.; Chen, D.; Wei, H.; Saleem, M. Continuous cropping alters multiple biotic and abiotic indicators of soil health. Soil Syst. 2020, 4, 59. [Google Scholar] [CrossRef]
  4. Karlen, D.L.; Hurley, E.G.; Andrews, S.S.; Cambardella, C.A.; Meek, D.W.; Duffy, M.D.; Mallarino, A.P. Crop rotation effects on soil quality at three northern corn/soybean belt locations. Agron. J. 2006, 98, 484–495. [Google Scholar] [CrossRef] [Green Version]
  5. Qiao, Y.; Miao, S.; Li, Y.; Zhong, X. Chemical composition of soil organic carbon changed by long-term monoculture cropping system in Chinese black soil. Plant Soil Environ. 2018, 64, 557–563. [Google Scholar] [CrossRef] [Green Version]
  6. Greer, K.; Martins, C.; White, M.; Pittelkow, C.M. Assessment of high-input soybean management in the US Midwest: Balancing crop production with environmental performance. Agric. Ecosyst. Environ. 2020, 292, 106811. [Google Scholar] [CrossRef]
  7. Wittwer, R.A.; Dorn, B.; Jossi, W.; Van Der Heijden, M.G.A. Cover crops support ecological intensification of arable cropping systems. Sci. Rep. 2017, 7, 1–12. [Google Scholar] [CrossRef] [Green Version]
  8. Bender, S.F.; Wagg, C.; van der Heijden, M.G.A. An underground revolution: Biodiversity and soil ecological engineering for agricultural sustainability. Trends Ecol. Evol. 2016, 31, 440–452. [Google Scholar] [CrossRef]
  9. Kleijn, D.; Bommarco, R.; Fijen, T.P.M.; Garibaldi, L.A.; Potts, S.G.; van der Putten, W.H. Ecological intensification: Bridging the gap between science and practice. Trends Ecol. Evol. 2019, 34, 154–166. [Google Scholar] [CrossRef] [Green Version]
  10. Snapp, S.S.; Swinton, S.M.; Labarta, R.; Mutch, D.; Black, J.R.; Leep, R.; Nyiraneza, J.; O’Neil, K. Evaluating cover crops for benefits, costs and performance within cropping system niches. Agron. J. 2005, 97, 322–332. [Google Scholar] [CrossRef]
  11. Blanco-Canqui, H.; Shaver, T.M.; Lindquist, J.L.; Shapiro, C.A.; Elmore, R.W.; Francis, C.A.; Hergert, G.W. Cover crops and ecosystem services: Insights from studies in temperate soils. Agron. J. 2015, 107, 2449–2474. [Google Scholar] [CrossRef] [Green Version]
  12. De Baets, S.; Poesen, J.; Meersmans, J.; Serlet, L. Cover crops and their erosion-reducing effects during concentrated flow erosion. Catena 2011, 85, 237–244. [Google Scholar] [CrossRef]
  13. Marques, M.J.; Ruiz-Colmenero, M.; Bienes, R.; García-Díaz, A.; Sastre, B. Effects of a permanent soil cover on water dynamics and wine characteristics in a steep vineyard in the central Spain. Air Soil Water Res. 2020, 13. [Google Scholar] [CrossRef]
  14. Rodrigo-Comino, J.; Terol, E.; Mora, G.; Giménez-Morera, A.; Cerdà, A. Vicia sativa Roth. can reduce soil and water losses in recently planted vineyards (Vitis vinifera L.). Earth Syst. Environ. 2020, 4, 827–842. [Google Scholar] [CrossRef]
  15. Matson, P.A.; Parton, W.J.; Power, A.G.; Swift, M.J. Agricultural intensification and ecosystem properties. Science 1997, 277, 504–509. [Google Scholar] [CrossRef] [Green Version]
  16. West, T.O.; Post, W.M. Soil organic carbon sequestration rates by tillage and crop rotation. Soil Sci. Soc. Am. J. 2002, 66, 1930–1946. [Google Scholar] [CrossRef] [Green Version]
  17. McDaniel, M.D.; Tiemann, L.K.; Grandy, A.S. Does agricultural crop diversity enhance soil microbial biomass and organic matter dynamics? A meta-analysis. Ecol. Appl. 2014, 24, 560–570. [Google Scholar] [CrossRef] [Green Version]
  18. Saleem, M.; Pervaiz, Z.H.; Contreras, J.; Lindenberger, J.H.; Hupp, B.M.; Chen, D.; Zhang, Q.; Wang, C.; Iqbal, J.; Twigg, P. Cover crop diversity improves multiple soil properties via altering root architectural traits. Rhizosphere 2020, 16, 100248. [Google Scholar] [CrossRef]
  19. Schipanski, M.E.; Barbercheck, M.; Douglas, M.R.; Finney, D.M.; Haider, K.; Kaye, J.P.; Kemanian, A.R.; Mortensen, D.A.; Ryan, M.R.; Tooker, J.; et al. A framework for evaluating ecosystem services provided by cover crops in agroecosystems. Agric. Syst. 2014, 125, 12–22. [Google Scholar] [CrossRef]
  20. Eberle, C.A.; Thom, M.D.; Nemec, K.T.; Forcella, F.; Lundgren, J.G.; Gesch, R.W.; Riedell, W.E.; Papiernik, S.K.; Wagner, A.; Peterson, D.H.; et al. Using pennycress, camelina, and canola cash cover crops to provision pollinators. Ind. Crop. Prod. 2015, 75, 20–25. [Google Scholar] [CrossRef]
  21. Moser, B.R. Biodiesel from alternative oilseed feedstocks: Camelina and field pennycress. Biofuels 2012, 3, 193–209. [Google Scholar] [CrossRef] [Green Version]
  22. Miller, P.; Kumar, A. Development of emission parameters and net energy ratio for renewable diesel from Canola and Camelina. Energy 2013, 58, 426–437. [Google Scholar] [CrossRef]
  23. Krohn, B.J.; Fripp, M. A life cycle assessment of biodiesel derived from the “niche filling” energy crop camelina in the USA. Appl. Energy 2012, 92, 92–98. [Google Scholar] [CrossRef]
  24. Fan, J.; Shonnard, D.R.; Kalnes, T.N.; Johnsen, P.B.; Rao, S. A life cycle assessment of pennycress (Thlaspi arvense L.) -derived jet fuel and diesel. Biomass Bioenergy 2013, 55, 87–100. [Google Scholar] [CrossRef]
  25. Berti, M.; Gesch, R.; Eynck, C.; Anderson, J.; Cermak, S. Camelina uses, genetics, genomics, production, and management. Ind. Crop. Prod. 2016, 94, 690–710. [Google Scholar] [CrossRef]
  26. Obour, A.K. Oilseed Camelina (Camelina sativa L Crantz): Production systems, prospects and challenges in the USA Great Plains. Adv. Plants Agric. Res. 2015, 2. [Google Scholar] [CrossRef] [Green Version]
  27. McGinn, M.; Phippen, W.B.; Chopra, R.; Bansal, S.; Jarvis, B.A.; Phippen, M.E.; Dorn, K.M.; Esfahanian, M.; Nazarenus, T.J.; Cahoon, E.B.; et al. Molecular tools enabling pennycress (Thlaspi arvense) as a model plant and oilseed cash cover crop. Plant Biotechnol. J. 2019, 17, 776–788. [Google Scholar] [CrossRef] [Green Version]
  28. Bergtold, J.S.; Ramsey, S.; Maddy, L.; Williams, J.R. A review of economic considerations for cover crops as a conservation practice. Renew. Agric. Food Syst. 2019, 34, 62–76. [Google Scholar] [CrossRef]
  29. Dunn, M.; Ulrich-Schad, J.D.; Prokopy, L.S.; Myers, R.L.; Watts, C.R.; Scanlon, K. Perceptions and use of cover crops among early adopters: Findings from a national survey. J. Soil Water Conserv. 2016, 71, 29–40. [Google Scholar] [CrossRef]
  30. Roesch-Mcnally, G.E.; Basche, A.D.; Arbuckle, J.G.; Tyndall, J.C.; Miguez, F.E.; Bowman, T.; Clay, R. The trouble with cover crops: Farmers’ experiences with overcoming barriers to adoption. Renew. Agric. Food Syst. 2018, 33, 322–333. [Google Scholar] [CrossRef] [Green Version]
  31. Smith, R.G.; Gross, K.L.; Robertson, G.P. Effects of crop diversity on agroecosystem function: Crop yield response. Ecosystems 2008, 11, 355–366. [Google Scholar] [CrossRef]
  32. Gesch, R.W.; Archer, D.W.; Berti, M.T. Dual cropping winter camelina with soybean in the northern corn belt. Agron. J. 2014, 106, 1735–1745. [Google Scholar] [CrossRef]
  33. Berti, M.; Gesch, R.; Johnson, B.; Ji, Y.; Seames, W.; Aponte, A. Double- and relay-cropping of energy crops in the northern Great Plains, USA. Ind. Crop. Prod. 2015, 75, 26–34. [Google Scholar] [CrossRef]
  34. Mohammed, Y.A.; Matthees, H.L.; Gesch, R.W.; Patel, S.; Forcella, F.; Aasand, K.; Steffl, N.; Johnson, B.L.; Wells, M.S.; Lenssen, A.W. Establishing winter annual cover crops by interseeding into Maize and Soybean. Agron. J. 2020, 112, 719–732. [Google Scholar] [CrossRef] [Green Version]
  35. Cubins, J.A.; Wells, M.S.; Frels, K.; Ott, M.A.; Forcella, F.; Johnson, G.A.; Walia, M.K.; Becker, R.L.; Gesch, R.W. Management of pennycress as a winter annual cash cover crop. A review. Agron. Sustain. Dev. 2019, 39. [Google Scholar] [CrossRef] [Green Version]
  36. Heaton, E.A.; Schulte, L.A.; Berti, M.; Langeveld, H.; Zegada-Lizarazu, W.; Parrish, D.; Monti, A. Managing a second-generation crop portfolio through sustainable intensifi cation: Examples from the USA and the EU. Biofuels Bioprod. Biorefin. 2013, 7, 702–714. [Google Scholar] [CrossRef]
  37. Mohammed, Y.A.; Patel, S.; Matthees, H.L.; Lenssen, A.W.; Johnson, B.L.; Scott Wells, M.; Forcella, F.; Berti, M.T.; Gesch, R.W. Soil nitrogen in response to interseeded cover crops in maize-soybean production systems. Agronomy 2020, 10, 1439. [Google Scholar] [CrossRef]
  38. Patel, S.; Lenssen, A.W.; Moore, K.J.; Mohammed, Y.A.; Gesch, R.W.; Wells, M.S.; Johnson, B.L.; Berti, M.T.; Matthees, H.L. Interseeded pennycress and camelina yield and their influence on row crops. Agron. J. 2021, in press. [Google Scholar]
  39. ISO. Environmental Management—Life Cycle Assessment—Principles and Framework; ISO 14040:2006; International Organization for Standardization (ISO): Geneva, Switzerland, 2006. [Google Scholar]
  40. Caffrey, K.R.; Veal, M.W. Conducting an agricultural life cycle assessment: Challenges and perspectives. Sci. World J. 2013, 2013. [Google Scholar] [CrossRef] [Green Version]
  41. Nemecek, T.; Dubois, D.; Huguenin-Elie, O.; Gaillard, G. Life cycle assessment of Swiss farming systems: I. Integrated and organic farming. Agric. Syst. 2011, 104, 217–232. [Google Scholar] [CrossRef]
  42. Wernet, G.; Bauer, C.; Steubing, B.; Reinhard, J.; Moreno-Ruiz, E.; Weidema, B. The ecoinvent database version 3 (part I): Overview and methodology. Int. J. Life Cycle Assess. 2016, 21, 1218–1230. [Google Scholar] [CrossRef]
  43. Cecchin, A.; Pourhashem, G.; Gesch, R.W.; Lenssen, A.W.; Mohammed, Y.A.; Patel, S.; Berti, M.T. Environmental trade-offs of relay-cropping winter cover crops with soybean in a maize-soybean cropping system. Agric. Syst. 2021, 189, 103062. [Google Scholar] [CrossRef]
  44. Bouwman, A.F.; Boumans, L.J.M.; Batjes, N.H. Modeling global annual N2O and NO emissions from fertilized fields. Glob. Biogeochem. Cycles 2002, 16, 28-1–28-9. [Google Scholar] [CrossRef]
  45. Bouwman, A.F.; Boumans, L.J.M.; Batjes, N.H. Estimation of global NH3 volatilization loss from synthetic fertilizers and animal manure applied to arable lands and grasslands. Glob. Biogeochem. Cycles 2002, 16, 8-1–8-14. [Google Scholar] [CrossRef]
  46. IPCC Agriculture Forestry and Other Land Use. Chapter 11: N2O emissions from managed soils, and CO2 emissions from lime and urea application. In 2006 IPCC Guidelines for National Greenhouse Gas Inventories; Intergovernmental Panel on Climate Change (IPCC): Geneva, Switzerland, 2006; Volume 4, pp. 1–54. [Google Scholar]
  47. United States Environmental Protection Agency. Emission Factors for Greenhouse Gas Inventories; US-EPA: Washington, DC, USA, 2018.
  48. Rosenbaum, R.K.; Anton, A.; Bengoa, X.; Bjørn, A.; Brain, R.; Bulle, C.; Cosme, N.; Dijkman, T.J.; Fantke, P.; Felix, M.; et al. The Glasgow consensus on the delineation between pesticide emission inventory and impact assessment for LCA. Int. J. Life Cycle Assess. 2015, 20, 765–776. [Google Scholar] [CrossRef] [Green Version]
  49. Xue, X.; Hawkins, T.R.; Ingwersen, W.W.; Smith, R.L. Demonstrating an approach for including pesticide use in life-cycle assessment: Estimating human and ecosystem toxicity of pesticide use in Midwest corn farming. Int. J. Life Cycle Assess. 2015, 20, 1117–1126. [Google Scholar] [CrossRef]
  50. European Commission. Product Environmental Footprint Category Rules Guidance; European Commission: Brussels, Belgium, 2018. [Google Scholar]
  51. Nemecek, T.; Schnetzer, J. Methods of Assessment of Direct Field Emissions for LCIS of Agricultural Production Systems; Agroscope Reckenholz-Tänikon Research Station ART: Zurich, Switzerland, 2011. [Google Scholar]
  52. Nemecek, T.; Schnetzer, J.; Reinhard, J. Updated and harmonised greenhouse gas emissions for crop inventories. Int. J. Life Cycle Assess. 2016, 21, 1361–1378. [Google Scholar] [CrossRef]
  53. Myhre, G.; Shindell, D.; Bréon, F.-M.; Collins, W.; Fuglestvedt, J.; Huang, J.; Koch, D. Anthropogenic and natural radiative forcing. In Climate Change 2013 the Physical Science Basis: Working Group I Contribution to the Fifth Assessment Report of the Intergovernmental Panel on Climate Change; Stocker, T.F., Qin, D., Plattner, G.-K., Tignor, M., Allen, S.K., Boschung, J., Nauels, A., Xia, Y., Bex, V., Midgley, P.M., Eds.; Cambridge University Press: New York, NY, USA, 2013; pp. 659–740. ISBN 9781107415324. [Google Scholar]
  54. Bare, J. TRACI 2.0: The tool for the reduction and assessment of chemical and other environmental impacts 2.0. Clean Technol. Environ. Policy 2011, 13, 687–696. [Google Scholar] [CrossRef]
  55. Foster, G.R.; Toy, T.E.; Renard, K.G. Comparison of the USLE, RUSLE1.06c, and RUSLE2 for application to highly disturbed lands. First Interag. Conf. Res. Watersheds 2003, 27, 154–160. [Google Scholar]
  56. Foster, G.R.; Yoder, D.C.; Weesies, G.A.; McCool, D.K.; McGregor, K.C.; Bingner, R.L. RUSLE2 User’s Guide; USDA—Agricultural research service: Washington, DC, USA, 2003.
  57. United States Department of Agriculture (USDA). The Wind Erosion Prediction System. WEPS 1.5 User Manual; USDA-ARS Agricultural Systems Research Unit: Fort Collins, CO, USA, 2016.
  58. i Canals, L.M.; Romanyà, J.; Cowell, S.J. Method for assessing impacts on life support functions (LSF) related to the use of “fertile land” in Life Cycle Assessment (LCA). J. Clean. Prod. 2007, 15, 1426–1440. [Google Scholar] [CrossRef]
  59. Brandão, M.; Milà i Canals, L.; Clift, R. Soil organic carbon changes in the cultivation of energy crops: Implications for GHG balances and soil quality for use in LCA. Biomass Bioenergy 2011, 35, 2323–2336. [Google Scholar] [CrossRef]
  60. Goglio, P.; Smith, W.N.; Grant, B.B.; Desjardins, R.L.; McConkey, B.G.; Campbell, C.A.; Nemecek, T. Accounting for soil carbon changes in agricultural life cycle assessment (LCA): A review. J. Clean. Prod. 2015, 104, 23–39. [Google Scholar] [CrossRef]
  61. Johnson, J.M.F.; Allmaras, R.R.; Reicosky, D.C. Estimating source carbon from crop residues, roots and rhizodeposits using the national grain-yield database. Agron. J. 2006, 98, 622–636. [Google Scholar] [CrossRef] [Green Version]
  62. Johnson, J.M.F.; Papiernik, S.K.; Mikha, M.M.; Spokas, K.A.; Tomer, M.D.; Weyers, S.L. Soil processes and residue harvest management. In Soil Quality Biofuel Production; Taylor & Francis: New York, NY, USA, 2009; pp. 1–44. [Google Scholar]
  63. Johnson, J.M.F.; Acosta-Martinez, V.; Cambardella, C.A.; Barbour, N.W. Crop and soil responses to using corn stover as a bioenergy feedstock: Observations from the northern us corn belt. Agriculture 2013, 3, 72–89. [Google Scholar] [CrossRef] [Green Version]
  64. Johnson, J.M.F.; Novak, J.M.; Varvel, G.E.; Stott, D.E.; Osborne, S.L.; Karlen, D.L.; Lamb, J.A.; Baker, J.; Adler, P.R. Crop residue mass needed to maintain soil organic carbon levels: Can it be determined? (Special Issue: Crop residue considerations for sustainable bioenergy feedstock supplies.). Bioenergy Res. 2014, 7, 481–490. [Google Scholar] [CrossRef]
  65. Weidema, B.P.; Wesnæs, M.S. Data quality management for life cycle inventories-an example of using data quality indicators. J. Clean. Prod. 1996, 4, 167–174. [Google Scholar] [CrossRef]
  66. Goedkoop, M.; Oele, M.; Leijting, J.; Ponsioen, T.; Meijer, E. Introduction to LCA with SimaPro; SimaPro: Amersfoort, The Netherlands, 2016. [Google Scholar]
  67. United States Department of Agriculture (USDA). Revised Universal Soil Loss Equation version 2 (RUSLE2)—Handbook; United States Department of Agriculture (USDA): Washington, DC, USA, 2001; Volume 2.
  68. Smith, K.A. Changing views of nitrous oxide emissions from agricultural soil: Key controlling processes and assessment at different spatial scales. Eur. J. Soil Sci. 2017, 68, 137–155. [Google Scholar] [CrossRef]
  69. Hayatsu, M.; Tago, K.; Saito, M. Various players in the nitrogen cycle: Diversity and functions of the microorganisms involved in nitrification and denitrification. Soil Sci. Plant Nutr. 2008, 54, 33–45. [Google Scholar] [CrossRef]
  70. Venterea, R.T.; Halvorson, A.D.; Kitchen, N.; Liebig, M.A.; Cavigelli, M.A.; Del Grosso, S.J.; Motavalli, P.P.; Nelson, K.A.; Spokas, K.A.; Singh, B.P.; et al. Challenges and opportunities for mitigating nitrous oxide emissions from fertilized cropping systems. Front. Ecol. Environ. 2012, 10, 562–570. [Google Scholar] [CrossRef]
  71. Weyers, S.; Thom, M.; Forcella, F.; Eberle, C.; Matthees, H.; Gesch, R.; Ott, M.; Feyereisen, G.; Strock, J.; Wyse, D. Reduced potential for nitrogen loss in cover crop-soybean relay systems in a cold climate. J. Environ. Qual. 2019, 48, 660–669. [Google Scholar] [CrossRef]
  72. Grossel, A.; Nicoullaud, B.; Bourennane, H.; Lacoste, M.; Guimbaud, C.; Robert, C.; Hénault, C. The effect of tile-drainage on nitrous oxide emissions from soils and drainage streams in a cropped landscape in Central France. Agric. Ecosyst. Environ. 2016, 230, 251–260. [Google Scholar] [CrossRef]
  73. Gellings, C.; Parmenter, K. Energy efficiency in fertilizer production and use. In Encyclopedia of Life Support Systems (EOLSS); Eolss Publishers: Oxford, UK, 2004; pp. 123–136. [Google Scholar]
  74. Gaspar, A.P.; Laboski, C.A.M.; Naeve, S.L.; Conley, S.P. Dry matter and nitrogen uptake, partitioning, and removal across a wide range of soybean seed yield levels. Crop. Sci. 2017, 57, 2170–2182. [Google Scholar] [CrossRef] [Green Version]
  75. Ott, M.A.; Eberle, C.A.; Thom, M.D.; Archer, D.W.; Forcella, F.; Gesch, R.W.; Wyse, D.L. Economics and agronomics of relay-cropping pennycress and Camelina with Soybean in Minnesota. Agron. J. 2019, 111, 1281–1292. [Google Scholar] [CrossRef]
  76. Berti, M.; Samarappuli, D.; Johnson, B.L.; Gesch, R.W. Integrating winter camelina into maize and soybean cropping systems. Ind. Crop. Prod. 2017, 107, 595–601. [Google Scholar] [CrossRef]
  77. Peterson, A.T.; Berti, M.T.; Samarappuli, D. Intersowing cover crops into standing soybean in the US upper midwest. Agronomy 2019, 9, 264. [Google Scholar] [CrossRef] [Green Version]
  78. Bennett, E.M.; Carpenter, S.R.; Caraco, N.F. Human impact on erodable phosphorus and eutrophication: A global perspective. Bioscience 2001, 51, 227–234. [Google Scholar] [CrossRef]
  79. Kaspar, T.C.; Singer, J.W. The use of cover crops to manage soil. In Soil Management: Building a Stable Base for Agriculture; Hatfield, J., Sauer, T., Eds.; American Society of Agronomy and Soil Science Society of America: Madison, WI, USA, 2011; pp. 321–337. [Google Scholar]
  80. Adviento-Borbe, M.A.A.; Haddix, M.L.; Binder, D.L.; Walters, D.T.; Dobermann, A. Soil greenhouse gas fluxes and global warming potential in four high-yielding maize systems. Glob. Chang. Biol. 2007, 13, 1972–1988. [Google Scholar] [CrossRef]
  81. Russell, A.E.; Cambardella, C.A.; Laird, D.A.; Jaynes, D.B.; Meek, D.W. Nitrogen fertilizer effects on soil carbon balances in Midwestern, U.S. agricultural systems. Ecol. Appl. 2009, 19, 1102–1113. [Google Scholar] [CrossRef] [Green Version]
  82. Trinsoutrot, I.; Recous, S.; Bentz, B.; Linères, M.; Chèneby, D.; Nicolardot, B. Biochemical quality of crop residues and carbon and nitrogen mineralization kinetics under nonlimiting nitrogen conditions. Soil Sci. Soc. Am. J. 2000, 64, 918–926. [Google Scholar] [CrossRef]
  83. Kaboneka, S.; Sabbe, W.E.; Mauromoustakos, A. Carbon decomposition kinetics and nitrogen mineralization from corn, soybean, and wheat residues. Commun. Soil Sci. Plant Anal. 1997, 28, 1359–1373. [Google Scholar] [CrossRef]
  84. Dabney, S.M.; Delgado, J.A.; Reeves, D.W. Using winter cover crops to improve soil and water quality. Commun. Soil Sci. Plant Anal. 2001, 32, 1221–1250. [Google Scholar] [CrossRef]
  85. Olson, K.; Ebelhar, S.A.; Lang, J.M. Long-term effects of cover crops on crop yields, soil organic carbon stocks and sequestration. Open J. Soil Sci. 2014, 4, 284–292. [Google Scholar] [CrossRef] [Green Version]
  86. Johnson, G.A.; Wells, M.S.; Anderson, K.; Gesch, R.W.; Forcella, F.; Wyse, D.L. Yield tradeoffs and nitrogen between pennycress, camelina, and soybean in relay- and double-crop systems. Agron. J. 2017, 109, 2128–2135. [Google Scholar] [CrossRef]
  87. Johnson, G.A.; Kantar, M.B.; Betts, K.J.; Wyse, D.L. Field pennycress production and weed control in a double crop system with soybean in Minnesota. Agron. J. 2015, 107, 532–540. [Google Scholar] [CrossRef] [Green Version]
  88. Gentry, L.E.; Below, F.E.; David, M.B.; Bergerou, J.A. Role of N2 fixation in the soybean N credit in maize production. Plant Soil 2001, 263, 175–184. [Google Scholar] [CrossRef]
  89. Green, C.J.; Blackmer, A.M. Residue Decomposition Effects on Nitrogen Availability to Corn following Corn or Soybean. Soil Sci. Soc. Am. J. 1995, 59, 1065–1070. [Google Scholar] [CrossRef]
  90. Salvagiotti, F.; Cassman, K.G.; Specht, J.E.; Walters, D.T.; Weiss, A.; Dobermann, A. Nitrogen uptake, fixation and response to fertilizer N in soybeans: A review. F. Crop. Res. 2008, 108, 1–13. [Google Scholar] [CrossRef] [Green Version]
  91. Aulakh, M.S.; Doran, J.W.; Walters, D.T.; Mosier, A.R.; Francis, D.D. Crop residue type and placement effects on denitrification and mineralization. Soil Sci. Soc. Am. J. 1991, 55, 1020–1025. [Google Scholar] [CrossRef] [Green Version]
  92. Carpenter-Boggs, L.; Pikul, J.L.; Vigil, M.F.; Riedell, W.E. Soil nitrogen mineralization influenced by crop rotation and nitrogen fertilization. Soil Sci. Soc. Am. J. 2000, 64, 2038–2045. [Google Scholar] [CrossRef] [Green Version]
  93. Hall, S.J.; Russell, A.E.; Moore, A.R. Do corn-soybean rotations enhance decomposition of soil organic matter? Plant Soil 2019, 444, 427–442. [Google Scholar] [CrossRef]
  94. Fernández, F.G.; Fabrizzi, K.P.; Naeve, S.L. Corn and soybean’s season-long in-situ nitrogen mineralization in drained and undrained soils. Nutr. Cycl. Agroecosyst. 2017, 107, 33–47. [Google Scholar] [CrossRef]
  95. Ciampitti, I.A.; Salvagiotti, F. New insights into soybean biological nitrogen fixation. Agron. J. 2018, 110, 1185–1196. [Google Scholar] [CrossRef] [Green Version]
  96. Vanotti, M.B.; Bundy, L.G. Soybean effects on soil nitrogen availability in crop rotations. Agron. J. 1995, 87, 676–680. [Google Scholar] [CrossRef]
  97. Deng, S.P.; Tabatabai, M.A. Effect of cropping systems on nitrogen mineralization in soils. Biol. Fertil. Soils 2000, 31, 211–218. [Google Scholar] [CrossRef]
  98. Rochette, P.; Angers, D.A.; Bélanger, G.; Chantigny, M.H.; Prévost, D.; Lévesque, G. Emissions of N2O from alfalfa and soybean crops in eastern Canada. Soil Sci. Soc. Am. J. 2004, 68, 493–506. [Google Scholar] [CrossRef]
  99. Martinez-Feria, R.A.; Castellano, M.J.; Dietzel, R.N.; Helmers, M.J.; Liebman, M.; Huber, I.; Archontoulis, S.V. Linking crop- and soil-based approaches to evaluate system nitrogen-use efficiency and tradeoffs. Agric. Ecosyst. Environ. 2018, 256, 131–143. [Google Scholar] [CrossRef]
  100. Wegner, B.R.; Chalise, K.S.; Singh, S.; Lai, L.; Abagandura, G.O.; Kumar, S.; Osborne, S.L.; Lehman, R.M.; Jagadamma, S. Response of soil surface greenhouse gas fluxes to crop residue removal and cover crops under a corn–soybean rotation. J. Environ. Qual. 2018, 47, 1146–1154. [Google Scholar] [CrossRef]
  101. Kessavalou, A.; Walters, D.T. Winter rye cover crop following soybean under conservation tillage: Residual soil nitrate. Agron. J. 1999, 91, 643–649. [Google Scholar] [CrossRef]
  102. Regehr, A.; Oelbermann, M.; Videla, C.; Echarte, L. Gross nitrogen mineralization and immobilization in temperate maize-soybean intercrops. Plant Soil 2015, 391, 353–365. [Google Scholar] [CrossRef]
Figure 1. Photos showing interseeding of winter camelina and pennycress in standing soybean with a high clearance tractor in Year 1 (a), growth performance of interseeded winter rye (b) and winter camelina (c) under soybean canopy in year 1, and relayed soybean performance (d) under winter camelina (bottom left) and terminated winter rye (bottom right) in spring of the following year.
Sustainability 13 01696 g001
Figure 2. Global warming potential (GWP-100-year) for four sequences in three locations expressed with the land-based functional unit ha year−1. Different colors show the relative contribution of process inputs and outputs to the total GWP. Continuous soybean = S-S, soybean/camelina-soybean = S/Cam-S, soybean/pennycress-soybean = S/Pen-S, and soybean/rye-soybean = S/Rye-S.
Sustainability 13 01696 g002
Figure 3. Eutrophication potential for four sequences in three locations expressed with the land-based functional unit ha year−1. Different colors show the relative contribution of process inputs and outputs to the total eutrophication potential. Continuous soybean = S-S, soybean/camelina-soybean = S/Cam-S, soybean/pennycress-soybean = S/Pen-S, and soybean/rye-soybean = S/Rye-S.
Sustainability 13 01696 g003
Figure 4. Soil erosion for four sequences in three locations expressed with the land-based functional unit ha year−1. Continuous soybean = S-S, soybean/camelina-soybean = S/Cam-S, soybean/pennycress-soybean = S/Pen-S, and soybean/rye-soybean = S/Rye-S.
Sustainability 13 01696 g004
Figure 5. Soil organic carbon (SOC) variation for four sequences in three locations expressed with the land-based functional unit ha year−1. The value “0” (which means no SOC variation over a year period) represents the critical C return rate from aboveground biomass of 2.5 Mg ha−1 as proposed by Johnson et al. [62]. Negative SOC values means an annual input of C lower than the 2.5 Mg C ha−1 year−1. Continuous soybean = S-S, soybean/camelina-soybean = S/Cam-S, soybean/pennycress-soybean = S/Pen-S, and soybean/rye-soybean = S/Rye-S.
Sustainability 13 01696 g005
Figure 6. Global warming potential (a), eutrophication (b), soil erosion (c) and SOC variation (d) for four sequences in three locations expressed with the economic functional unit USD net margin. Continuous soybean=S-S, soybean/camelina-soybean = S/Cam-S, soybean/pennycress-soybean = S/Pen-S, and soybean/rye-soybean = S/Rye-S.
Sustainability 13 01696 g006aSustainability 13 01696 g006bSustainability 13 01696 g006c
Table 1. Crop sequences assessed in the study.
ID CodeSequence
(Year 1 → Year 2)
Description
Continuous Soybean
S-SSoybean → SoybeanConventional sequence. Soybean was sown and harvested in Year 1 and in Year 2. No cover crop.
S/Cam-SSoybean + Camelina → SoybeanSoybean was sown in Year 1 and camelina was interseeded into standing soybean in Year 1 (late summer). Soybean was harvested in fall of Year 1.
(Soybean was relayed into standing camelina in the spring of Year 2. Camelina was harvested in early summer in Year 2, while soybean in the fall of the same year.
S/Pen-SSoybean + Pennycress → SoybeanSoybean was sown in Year 1 and pennycress was interseeded into standing soybean in Year 1 (late summer). Soybean was harvested in fall of Year 1.
(Soybean was relayed into standing pennycress in the spring of Year 2. Pennycress was harvested in early summer in Year 2, while soybean in the fall of the same year.
S/Rye-SSoybean + Rye → SoybeanSoybean was sown in Year 1 and rye was interseeded into standing soybean in Year 1 (late summer). Soybean was harvested in fall of Year 1.
(Rye was terminated before seeding soybean (spring of Year 2). Soybean was sown and harvested in Year 2.
Table 2. Monthly mean air temperature (T; °C) and monthly total precipitation (P; mm) in 2016–2017 and long-term average at the three locations.
MonthAmesMorrisProsper
20162017LTA 20162017LTA20162017LTA
TPTPTPTPTPTPTPTPTP
Jan.−6.615−4.147−6.317−9.77−9.113−12.019−11.1M −11.1M−13.5M
Feb.−1.6172.730−4.022−5.222−3.111−9.818−5.6M−5.0M−10.7M
Mar.7.3383.8793.3503.121−0.912−2.6352.8M−2.2M−3.1M
Apr.11.310411.67810.51006.9527.5656.4615.6436.7176.026
May16.610916.615616.712415.34313.49213.97715.08213.31713.472
June24.22523.24422.012220.35420.010119.210819.53818.98818.998
July23.914924.92523.711721.518422.12321.49621.18821.15020.776
Aug.23.120921.28522.612220.79418.417520.08320.62618.35319.754
Sep.21.020120.84618.78316.44316.610515.27116.16015.615215.069
Oct.14.91513.015411.9619.5878.5697.6608.3497.877.350
Nov.8.2443.773.5464.342−1.412−1.4244.4M−3.3M−1.9M
Dec.−4.230−3.84−4.129−8.933−9.07−9.118−10.0M−11.1M−9.9M
LTA = Long term average, number of years varied by locations and M = missing data.
Table 3. Site characteristics, field management and inputs for the three locations analyzed in this study.
SITE CHARACTERISTICS
City, stateAmes, IowaMorris, MinnesotaProsper, North Dakota
Geographical location42.00, −93.7345.67, −95.8046.97, −97.05
Soil textureLoamLoamSilt loam
Soil organic carbon (% SOC)1.83.42.4
DrainageGoodGoodPoor
FIELD MANAGEMENT
Management typeConventional fertilization, no residue removalReduced fertilization (only cover crop), no residue removalNo fertilization, soybean residue removal in Year 1
TillageConventional tillage: disk plow and spring field cultivation in Year 1, no-till in Year 2Conventional tillage: disk and chisel plow and spring field cultivation in Year 1, no-till in Year 2Reduced tillage: chisel plow and spring field cultivation in Year 1, no-till in Year 2
Residue management No soybean and rye residue removal. 100% camelina and pennycress residue removalNo soybean and cover crop residue removal.100% soybean residue removal in Year 1, no soybean and cover crop residue removal in Year 2.
AGRICULTURAL INPUTS
Fertilization rate: N-P-K (kg ha−1)Soybean: 48-123-112 (in Year 1 only)Soybean: 0-0-0 Soybean: 0-0-0
Camelina and pennycress: 78-34-34 (in Year 2)Camelina and pennycress: 78-34-34 (in Year 2)Camelina and pennycress: 0-0-0
Winter rye: 0-0-0Winter rye: 0-0-0Winter rye: 0-0-0
Fertilizer’s typeDiammonium phosphate, sulfur-coated urea, muriate of potashDiammonium phosphate, urea, muriate of potashN/A
Herbicide/pesticide (kg a.i. ha−1)Soybean (in Year 1): glyphosate (2.24), pendimenthalin (1.594)Soybean (in Year 1): glyphosate (1.1)Soybean: glyphosate (1.1)
Soybean (in Year 2): lactofen (0.56)Soybean (in Year 2): glyphosate (1.1), lambdacyhalothrin (0.01)Soybean: N/A
Rye (to terminate): glyphosate (2.24)Rye (to terminate): glyphosate (2.13)Rye (to terminate): glyphosate (2.24)
Seeding rate, pure live seed (kg ha−1)Soybean: 77.0Soybean: 77.0Soybean: 79.6
Camelina: 11.2Camelina: 11.2Camelina: 11.2
Pennycress: 16.8Pennycress: 16.8Pennycress: 16.8
Rye: 84.1Rye: 84.1Rye: 84.1
MACHINERY
Machinery use: (a) = fuel (kg ha−1); (b) = electricity (kWh ha−1)
S-S(a) 68.8; (b) 0(a) 76.0; (b) 0(a) 68.0; (b) 0
S/Cam-S(a) 94.7; (b) 1.5(a) 99.7; (b) 2.7(a) 91.5; (b) 0.7
S/Pen-S(a) 95.0; (b) 4.7(a) 100.0; (b) 6.4(a) 91.7; (b) 3.2
S/Rye-S(a) 71.7; (b) 0(a) 78.0; (b) 0(a) 70.0; (b) 0
Publisher’s Note: MDPI stays neutral with regard to jurisdictional claims in published maps and institutional affiliations.

