Article

Tourism, Transport and Climate Change: The Carbon Footprint of International Air Traffic on Islands

by
Pedro Dorta Antequera
*,
Jaime Díaz Pacheco
,
Abel López Díez
and
Celia Bethencourt Herrera
Disaster Risk Reduction and Resilient Cities Group, University of La Laguna (ULL), 38200 San Cristóbal de La Laguna, Tenerife, Spain
*
Author to whom correspondence should be addressed.
Sustainability 2021, 13(4), 1795; https://0-doi-org.brum.beds.ac.uk/10.3390/su13041795
Submission received: 16 January 2021 / Revised: 2 February 2021 / Accepted: 3 February 2021 / Published: 7 February 2021
(This article belongs to the Special Issue Sustainable Island Tourism)

Abstract

:
Many small islands base their economy on tourism. This activity, based to a large extent on the movement of millions of people by air transport, depends on the use of fossil fuels and, therefore, generates a large amount of greenhouse gas (GHG) emissions. In this work, these emissions are evaluated by means of various carbon calculators, taking the Canary Islands as an example, which is one of the most highly developed tourist archipelagos in the world. The result is that more than 6.4 million tonnes (Mt) of CO2 are produced per year exclusively due to the massive transport of tourists over an average distance of more than 3000 km. The relative weight of these emissions is of such magnitude that they are equivalent to more than 50% of the total amount produced by the socioeconomic activity of the archipelago. Although, individually, it is travelers from Russia and Nordic countries who generate the highest carbon footprint due to their greater traveling distance, the British and German tourists account for the greatest weight in the total, with two-thirds of emissions.

1. Introduction

Tourism is considered one of the most important economic activities on a global scale, with a total of 1.4 billion international tourists in 2018 [1] (during the writing of this article, the planet is mired in the COVID-19 pandemic that has led to a drastic reduction in the number of tourist trips in 2020) and an estimated 1.8 billion by 2030 [2]. The carbon footprint of tourism on a global scale is equivalent to approximately 8% of total greenhouse gas (GHG) emissions, reaching 4.5 GtCO2eq in 2013 [3]. Furthermore, while other sectors have begun to develop a carbon mitigation program, the response of the tourism industry to climate change has been ineffective [4]. A substantial part of these emissions is due exclusively to air traffic, which, in Europe, for example, in 2017, was 3.8% of its total emissions [5]. In 2017, on a planetary scale, 3.7 billion passengers traveled by plane [6]. It is not difficult to imagine their impact on the amount of GHG emitted into the atmosphere since oil was the primary source of energy used in their means of transport, accounting for 3% of the world consumption of fossil fuels in recent years and 12% of the emissions related to transport [7], rising in the European case to 13.4% [8]. There is no doubt that this enormous development has been due to population growth and urbanization, better levels of education or higher economic income, among others, as well as the general decrease in the price of fares. This facilitates an increase in flights and the shortenings of stays [9]. Consequently, socioeconomic factors are the key to explaining the increase in the use of this transport, as well as investment in the tourism sector [6]. On a continental scale, Asia is the continent that has grown the most in air connections and, therefore, in polluting emissions [10].
In this context, flight demand is expected to continue to increase by between 3.7% and 5.5% annually in the coming decades [11,12,13,14,15], which would mean that in the next 20 years, between 2019 and 2039, the number of passengers transported could multiply by 2.1, to over 8 billion annually [16], and this tendency will not be affected by the COVID-19 pandemic [11]. A total of 280 million air trips/passengers were recorded in 2017 [16] and all air travel will triple by 2050 [17]. With regard to this, although research and investment continue to improve fuel efficiency because, in addition, this is one of the highest operating costs for airlines, improvement in the energy efficiency of aircrafts has only been 1.5% annually (2009–2020) [16]. Although airlines are concerned about climate-friendly ethics [18], it seems that the energy used for the propulsion of aircrafts will not change in the medium term [19,20]. Consequently, although airline fleets are constantly being modernized and are supposedly cleaner from an environmental perspective, the number of flights has increased much more notably, with the result that approximately 160 million tonnes (Mt) of fuel were consumed in 2015 [21], leading to increasingly higher emissions. Furthermore, in Europe, the international aviation sector grew by 128.9% between 1990 and 2017, with more than 1.1 billion passengers in 2018, becoming the fastest growing sector responsible for the main sources of emissions on a continental scale [5].
This huge number of journeys generates massive GHG emissions. It is estimated that around 665 Mt were released into the atmosphere by commercial aviation in 2018, compared to, for example, the slightly more than 21 Mt generated by cruise ships in 2017. The mean average annual increase has been almost 8% since 2015 [22] and CO2 emissions are predicted to have increased by at least 21% in 2040 compared to 2017 [8]. It is no exaggeration to say that the compatibility between environmental sustainability and the expectations of continued growth in the coming decades is extremely difficult [23].
Small islands have a series of common features and difficulties that differentiate them from continental territories [24], such as the generation or supply of energy, water, and food, transport in general, waste treatment, etc. In the case of those with Mediterranean, tropical, or subtropical climates, most of them are highly dependent on tourism and their insular condition means that their connectivity is based on aviation. In general, island territories are considered highly vulnerable to the impacts of climate change [25,26].
In Spain, for example, both in the case of the Balearic Islands and the Canary Islands, as they are archipelagos, the main route of arrival is by plane, which is more pronounced for the Canary Islands due to its distance from the countries that send the tourists. It could be said that, with the exception of the cruise ships that visit the ports of the islands but do not spend the night there, practically 100% of foreign tourists—and also domestic tourists—who arrive in the Canary Islands do so by air.
This mass tourism, generally located on the coast, generates a high environmental cost, which is reflected, above all, in territorial impacts and in the landscape, which have been widely studied in the Canary Islands [27,28]. In addition, other specific impacts have been addressed such as the generation of waste, the exploitation of water, or other aspects related to the ecological footprint of tourism on the islands [29,30]. However, in the current context of climate change, although a framework has been proposed to quantify the general carbon footprint of tourism on islands [31], there is still an important knowledge gap in terms of studies that allow a specific assessment of international aviation concerning the contribution of the current tourism model of small island territories to global warming. In this respect, the main aim of this work is the quantification of the carbon footprint generated by the movement of millions of international tourists who travel from the European continent to island destinations, using the Canary Islands as a laboratory and axis of the discussion.
The present study seeks to identify which tourists generate the largest carbon footprints in their journeys, and at the same time, perform an analysis of the origin of these tourists, taking into account the number of journeys and the distance traveled and comparing the impact of each tourist with respect to their emissions in their countries of origin. In addition, there is an evaluation of the total emissions produced by international aviation in the Canary Islands. On the other hand, several aspects are compared between the two Spanish archipelagos and other tourist islands and, finally, the contribution of tourist air transport to the islands’ carbon footprint is compared with the amount produced by other economic activities.

2. Context of the Study Case (Study Area)

Over time, the tourism sector in the Canary archipelago has been increasing its potential and development, currently and prominently as the main engine of its economy. In this sense, the Canary Islands are one of the first European destinations to have focused on sun and beach tourism and it is the Spanish region that generates the most employment from tourism, accounting for 40% of the regional total (2017) as well as 35% of the Canary GDP [32]. The Canary Islands have led the rankings as a European destination in recent years in terms of the number of overnight stays in tourist establishments, surpassing destinations such as Paris, Catalonia, the Balearic Islands, and London [33].
The Canaries are a consolidated historical destination that have attracted many travelers since the 18th and 19th centuries, initially for medical and therapeutic reasons [34] and recently for coastal leisure, but with the climate always being the biggest attraction. However, it was not until the arrival of commercial aviation and, above all, with the generalization of the jet engine that visitor numbers began to have a real and noticeable impact on the economy.
The main advantage of these islands with respect to other European and even Asian or American destinations specialized in sun and beaches is that they do not have a climatic seasonality that determines the inflows. The fact that the Canary Islands are one of the few destinations less than 4–5 h by plane from the heart of Europe means that the accommodation on the coast is open all year round. This feature is especially visible when compared with the other big Spanish island destination, the Balearic Islands, or other Mediterranean islands, which are marked by seasonal changes in climate. In other words, winter climatic features are the main economic resource of the Canary Islands from a tourist perspective, meaning it has hardly any competitors in the European market.
In Spain, the second largest tourist power in the world in 2018, only behind France [35], its two archipelagos accounted for more than a third of the almost 83 million international tourists who arrived in the country in 2018. These two island territories have recorded similar numbers of tourists in recent years, with an annual average of just over 13.5 million tourists each between 2015 and 2019 [36]. The sum of both would place them as the fifteenth largest power in the world for international tourism based on data from 2018 [35].
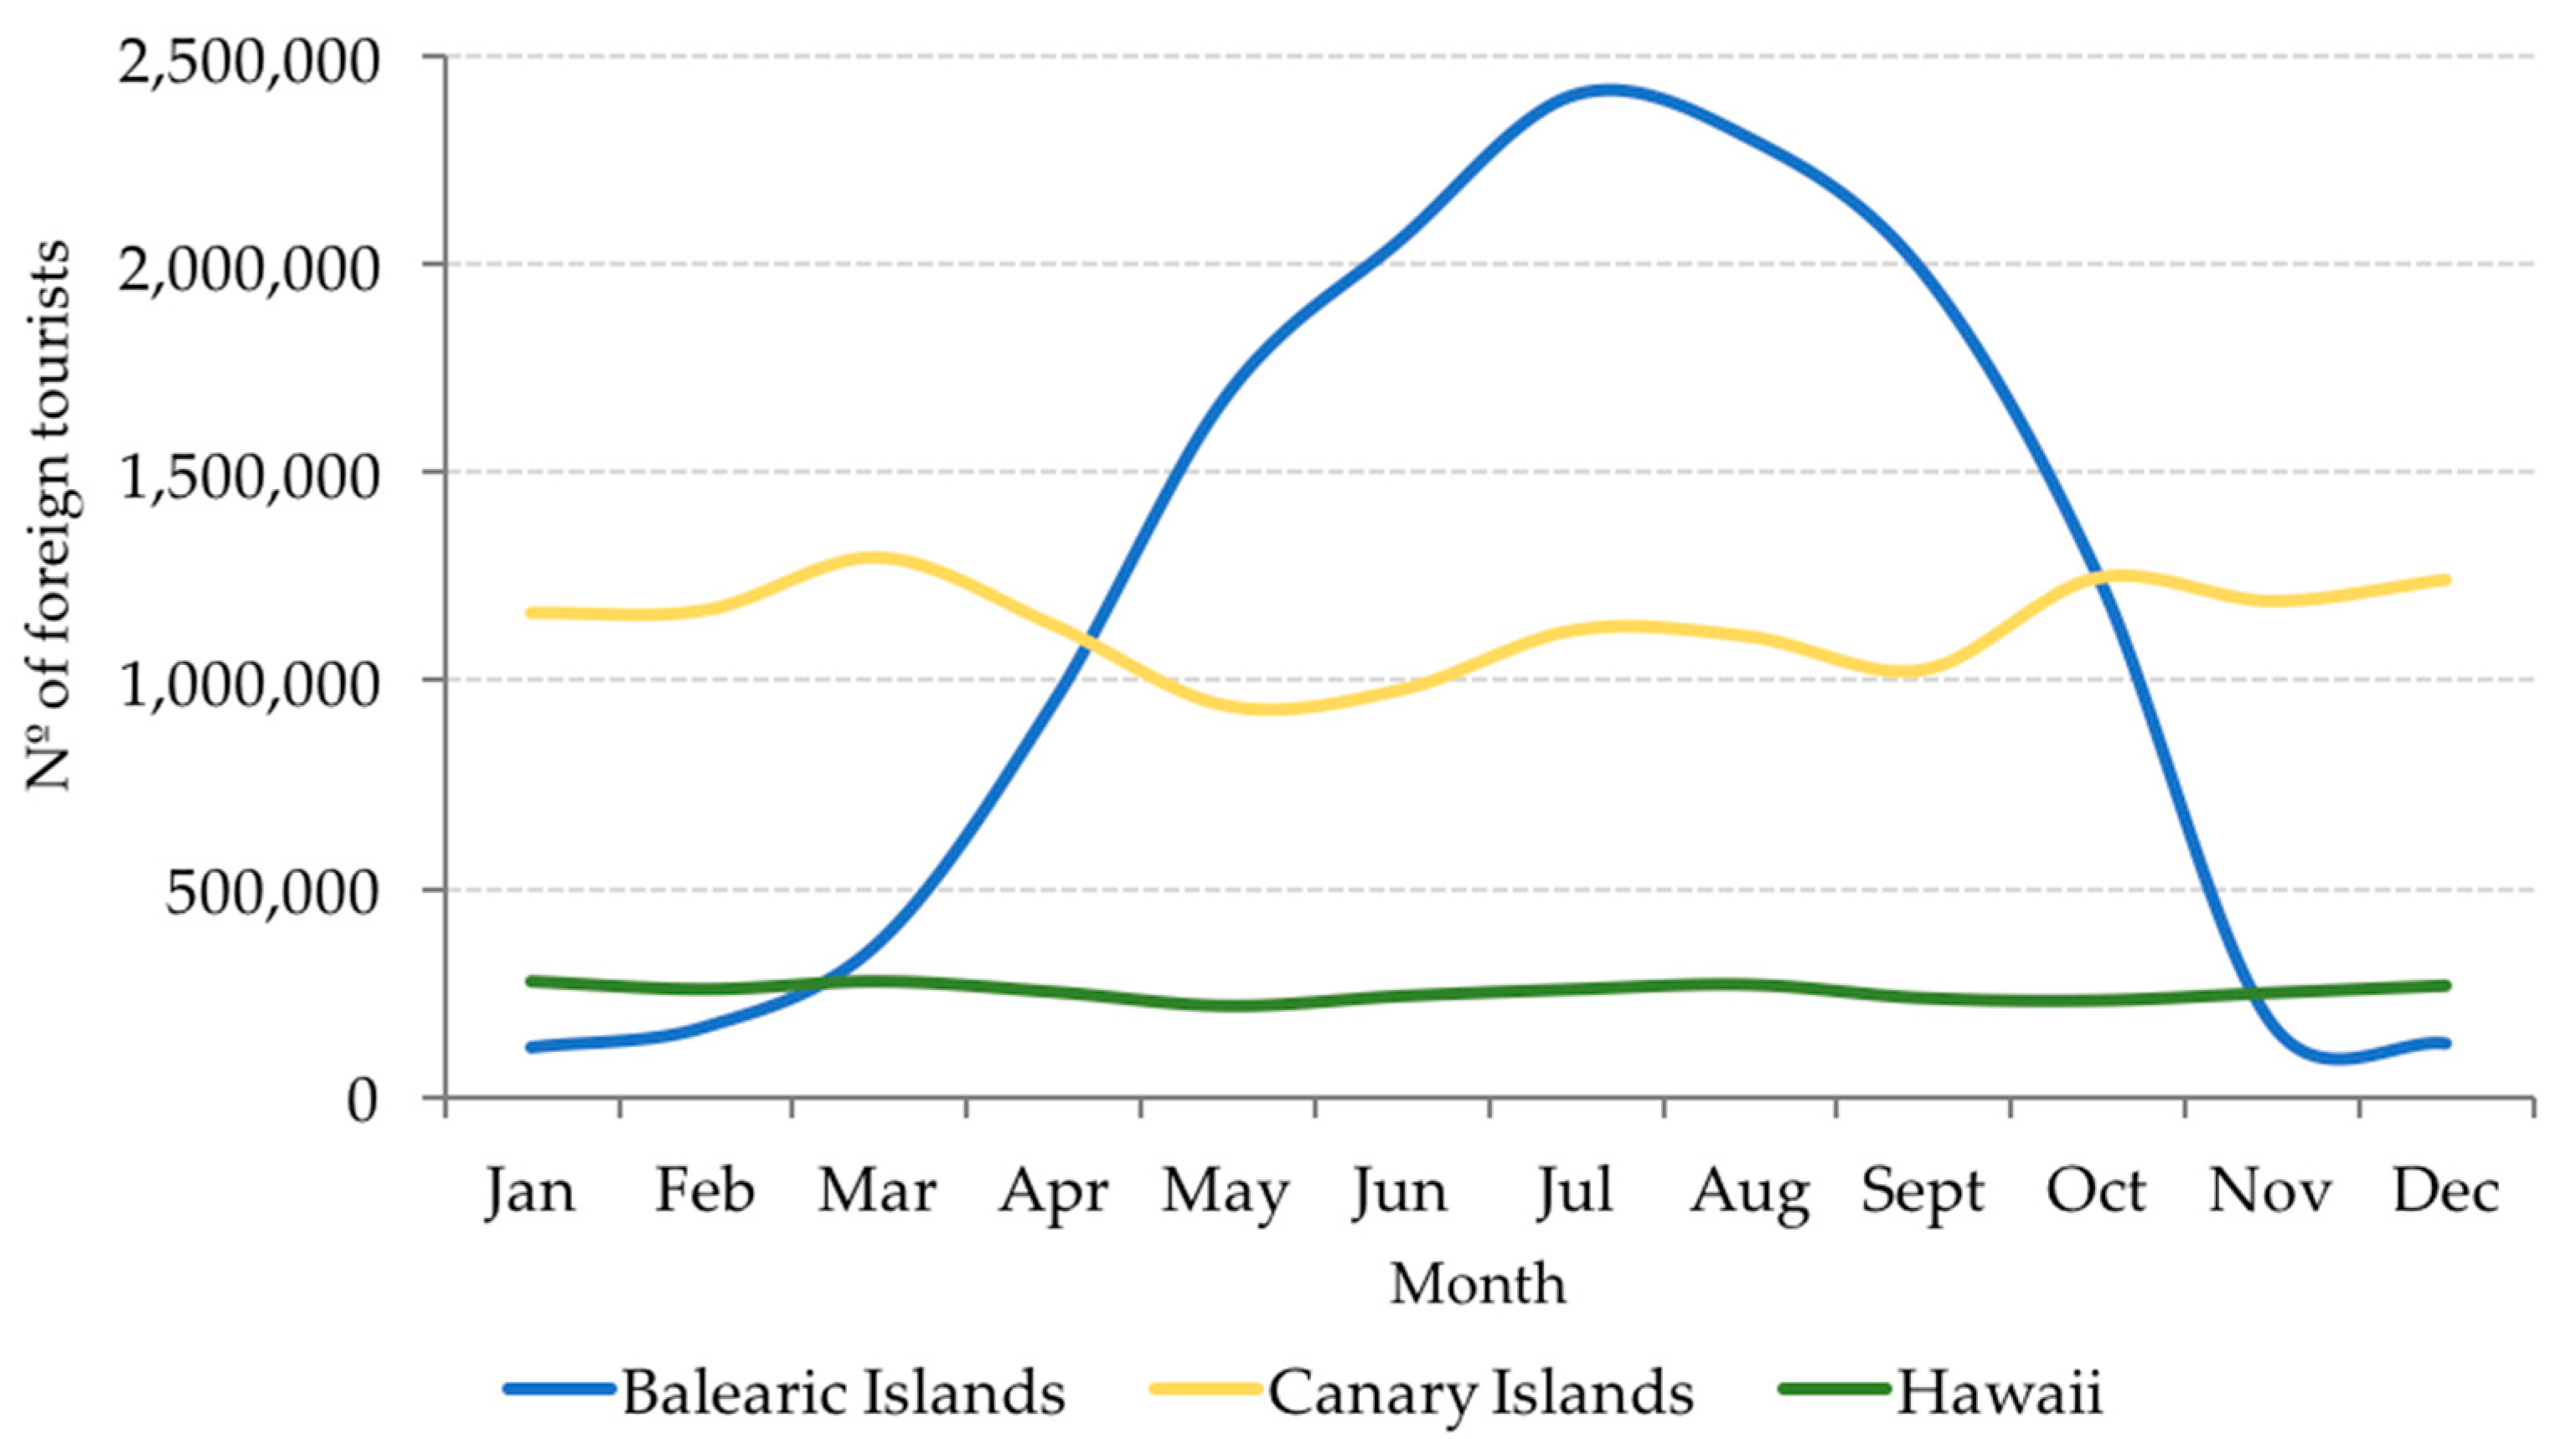
However, the annual distribution is markedly different (Figure 1). There is a clear summer maximum in the Balearic Islands. There are only a few other archipelagos on the planet which are not affected by seasonality, the case of Hawaii being a good example although, unlike the Canary Islands, most of its visitors are domestic tourists [37].
The number of aircrafts of European origin arriving in the Canary Islands has multiplied by 345 in recent decades. The number of tourists who arrived in the islands in 1955 was 39,500 [38] and the average number who arrived in the last five years was 13,500,000; in other words, an increase of 34,000%, only taking into account international visitors.
Figure 1. Distribution of the number of foreign tourists in the Balearic Islands, the Canary Islands, and Hawaii. Average 2016–2019 (Canary Islands and Balearic Islands) and 2018–2019 (Hawaii). Source: INE [36], DBEDT [37], and AETIB [39].
Sustainability 13 01795 g001
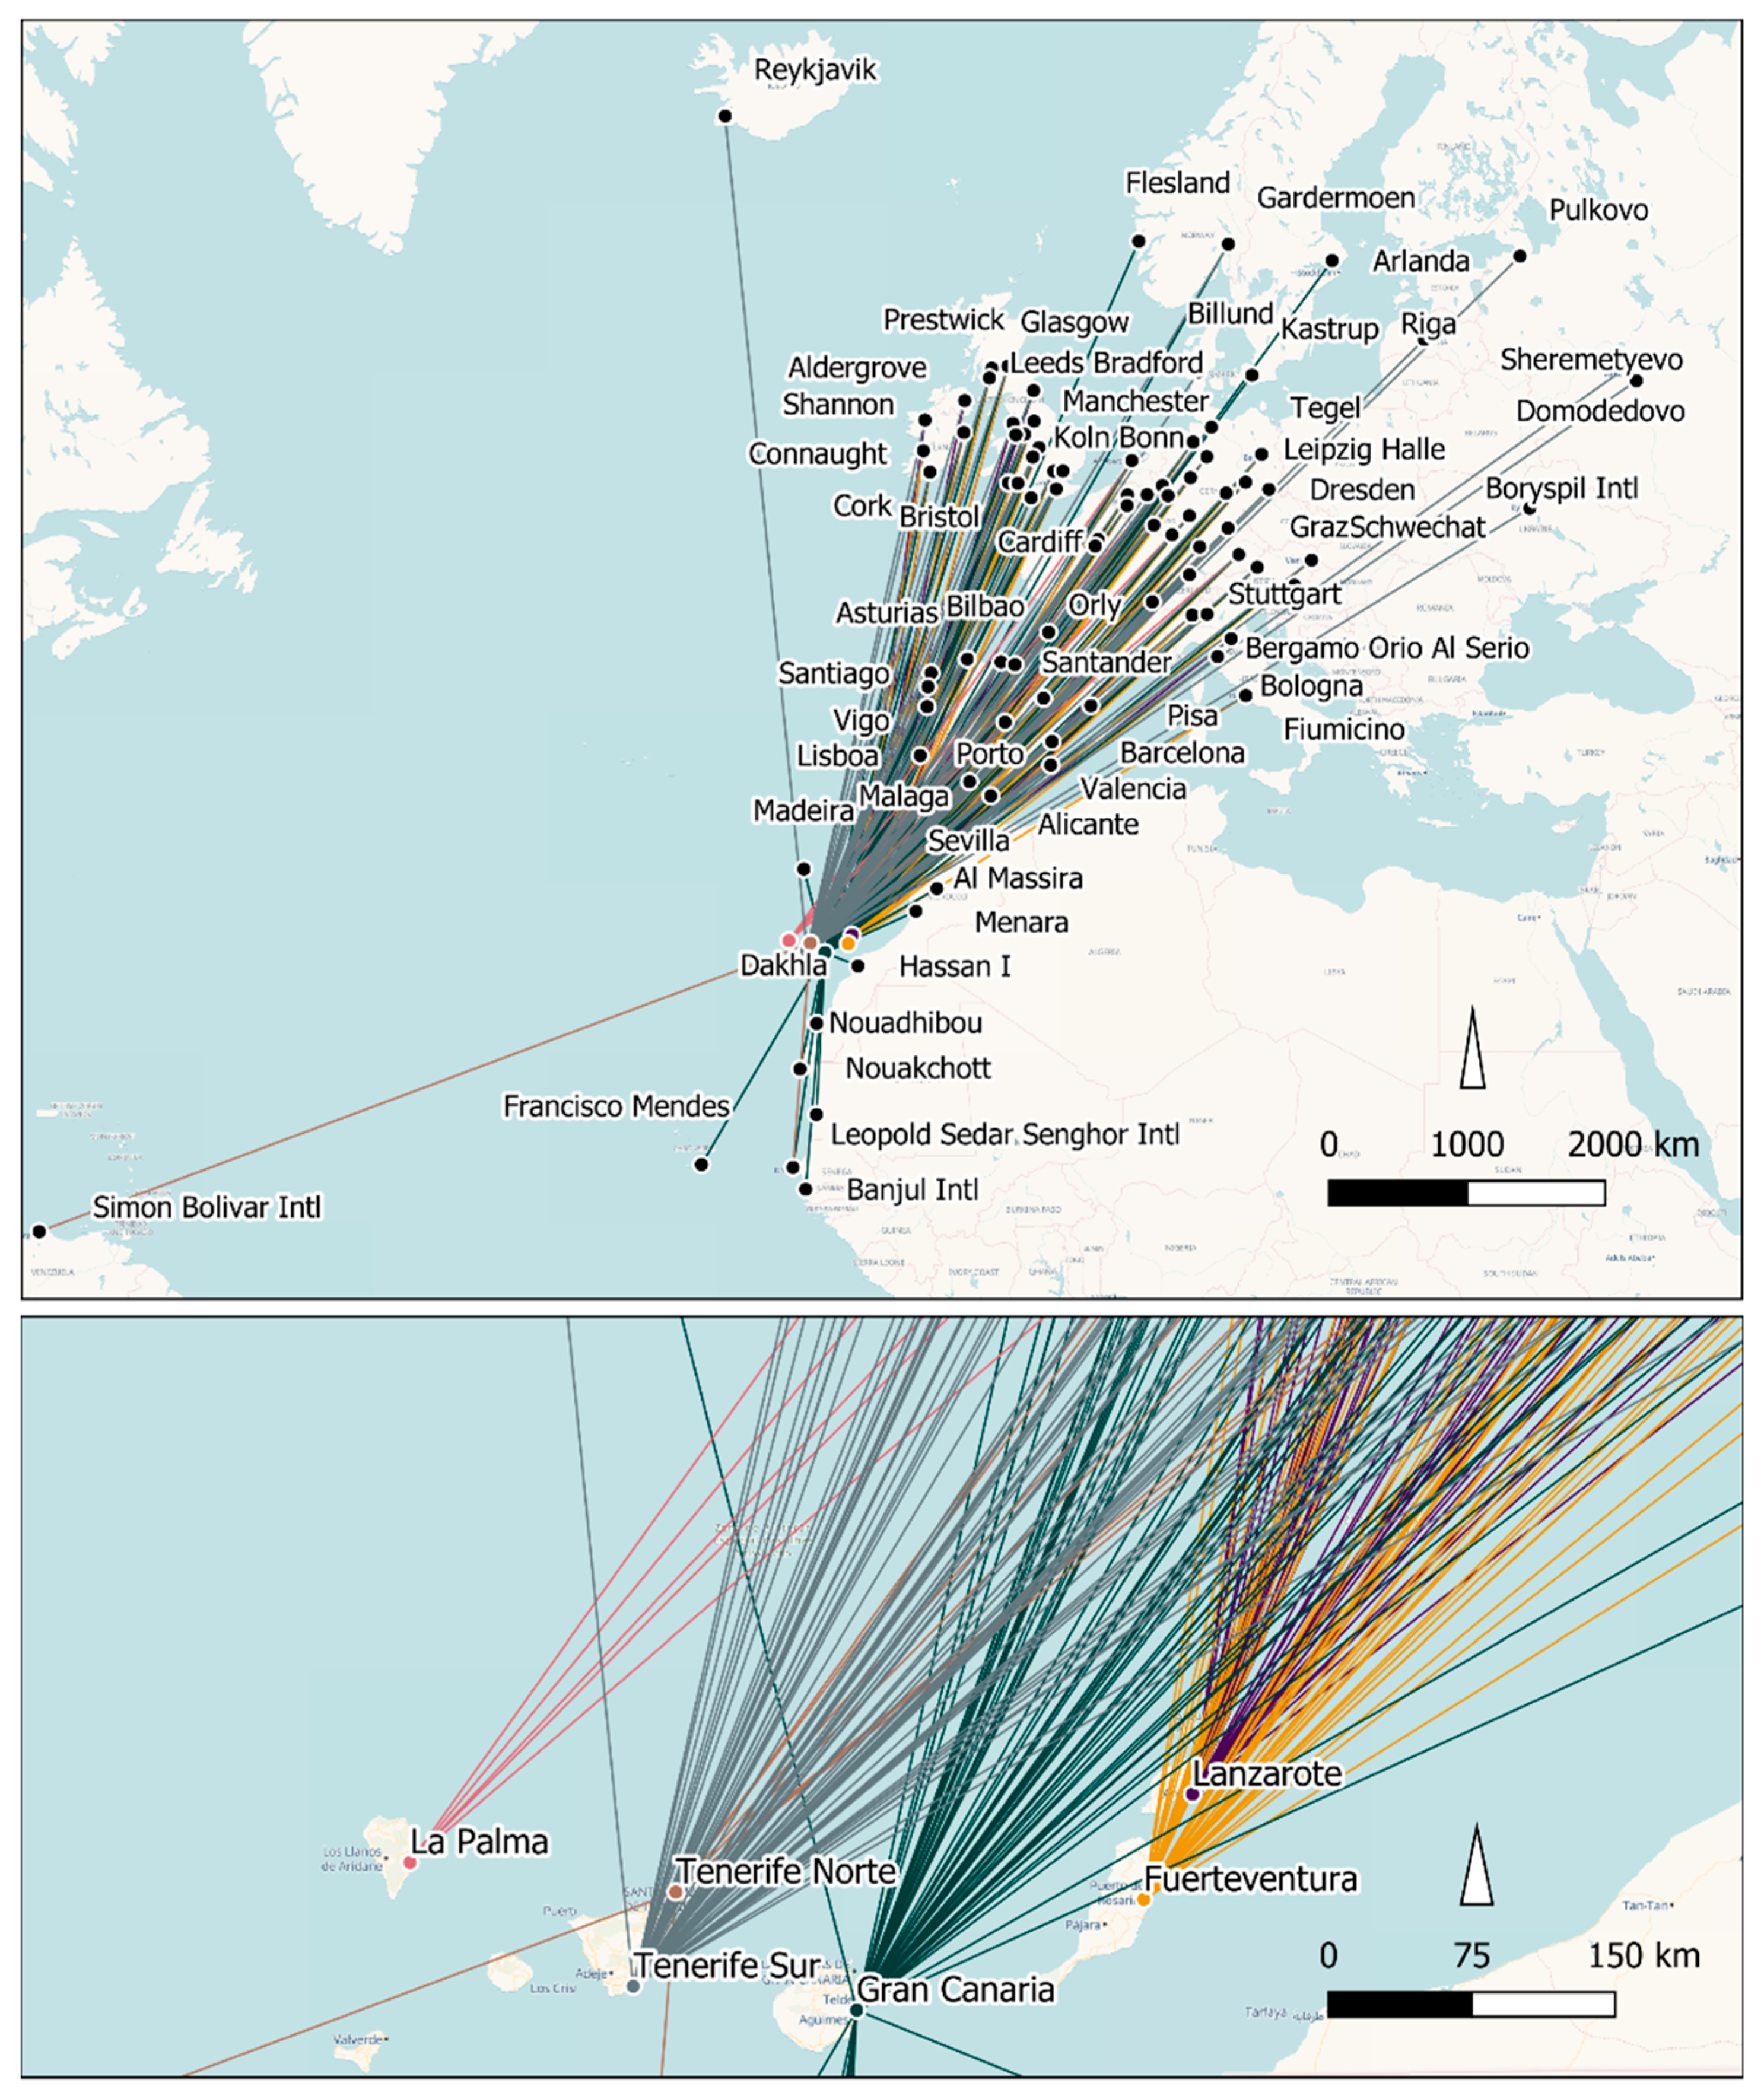
It is also important to note that the growth of low-cost airline companies and the significant reduction in fares has, in turn, generated greater demand, facilitating a greater frequency of flights. According to data from the Spanish Airports and Air Navigation [40], more than 50 different airlines fly to the main Canary airports from many different domestic and international origins, especially from Europe; there are about 80 destinations from Tenerife South and Gran Canaria and around 55 from Lanzarote and Fuerteventura [41] (Figure 2). This has led to the possibility of creating a large number of second homes for European citizens on Canary soil, to the point that international connections with many different cities, especially British and German, with several daily flights, exceed or equal those of domestic connections with Madrid and Barcelona. The five main Canary airports (Gran Canaria, Tenerife South, Tenerife North, Lanzarote, and Fuerteventura), handled in the region of 400,000 operations in 2019, accounting for 17% of all operations in Spain for the same year [40]. Therefore, more than 1 out of every 6 flights in Spain originates or ends at a Canary airport, although the archipelago only represents 4.5% of the population [36].
In short, the plane as a means of transport in recent decades has enabled the mass movement of European citizens to the archipelagos. The prices mean that it is affordable for many people to travel the 6400 km or the 8600 km round trip from Berlin or Stockholm, respectively, for example, to the Canary Islands several times a year. Connectivity due to air transport is a key link in the tourist value chain of all the archipelagos dependent on such activity. Thus, it is clear that aviation needs to become more climatically sustainable [42].
The undoubted economic benefit of the entire aforementioned process has resulted in a marked increase in income on the islands, even attracting a large number of immigrants to fill the number of jobs connected in one way or another to tourism. However, the environmental impact has also been considerable, with a notable deterioration of the coastlines and a depletion of the archipelago’s natural resources, which can be referred to as unsustainable development.
In this regard, the wealth created by mass air transport should also be considered not only in terms of the high GHG emissions responsible for climate change on the planet, but also in terms of large-scale air pollution [10,15]. It should not be forgotten that, despite the relative proximity of the Canary Islands to the European continent, the distances, with respect to the emitting countries, are notably greater than those of the other European archipelagos or islands such as the Greek Islands, Malta, Sardinia, or the Balearic Islands. In general terms, the distance between the countries sending the tourists and the Canary Islands is double that of the Balearic Islands or Malta (Table 1). In any case, it is undeniable that island tourist destinations have the largest carbon footprint, due to a large extent to the imperative need for air transport to fill their tourist places.
The large-scale arrival of international tourism, with an average of more than one million monthly visitors in the Canary Islands and over 2 million in the Balearic Islands in the high season, has a great impact. This tourism model, based on quantity rather than quality, endangers the conservation of the natural resources of most of the islands offering sun and beach tourism and as it depends on aviation is, therefore, a generator of large amounts of GHG.

3. Materials and Methods

3.1. Data

In order to comply with the proposed objectives, in addition to scientific publications, a series of official statistical sources, national or regional observatories of tourism activity, as well as various reports issued by different institutions and related to the matter have been used. A wealth of information has been collected from official documents of the European Commission and the European Parliament, as well as from websites specializing in air transport and the environment.
The collection of data on tourists and trips to the Canary Islands used information provided by the Spanish National Institute of Statistics (INE) [36], the Canary Institute of Statistics (in Spanish, ISTAC) [43] and, indirectly, information from the public company National Airports and Spanish Air Navigation (in Spanish, AENA) [40], in charge of all Spanish airports, through ISTAC. For data from other islands, official sources were used to collect information on tourism activity, such as data from the Balearic Islands Tourism Strategy Agency (AETIB) [39], the National Statistics Office of Malta (NSOM) [44], and the Department of Business, Economic Development and Tourism (DBEDT) [37] of the state of Hawaii in the USA.
CO2 emissions calculations were performed with what are known as carbon emission calculators, implemented in dynamic and interactive web pages. Those used in this work are the ones provided by:
Carbon Footprint Ltd. (CFL), which is a company dedicated to research, consulting, and services related to quality, the environment, and energy. Among its many products, it offers a free application that allows any user to compute their CO2 emissions at home or from the use of car [45], motorcycle, train, and air travel, the latter being the main topic of the analysis in the present work. To do this, the user needs to select the point of origin and destination, and they can also choose the type of flight class (economy, business, or first class).
CeroCO2 [46]: this is a Spanish website promoted in conjunction with the NGOs ECODES and Acciónatura, which only calculates emissions for air routes based on distance; it is not necessary to establish a specific path.
The International Civil Aviation Organization (ICAO) is a specialized agency belonging to the United Nations [21], whose information has been widely used in other scientific works [10,47]. Its design takes into consideration different factors such as the type of aircraft, the specific data of the route, the load factors of the passengers, and the cargo transported. In the same way as CFL, it is necessary to enter data such as the origin, destination, and type of ticket. It also has the particularity that it is based on real flights, so it is only possible to calculate the routes that are covered by an airline.
The first two dynamic and interactive websites for calculating emissions are of a more general nature; however, the one offered by ICAO is more specific and focuses on aviation, which was taken as the reference here.
The search for GHG emissions used the World Bank resources, which provides all the analyses and results on the CO2 emissions generated by each nation and per capita.
Finally, information related to GHG emissions from all types of activities in the Canary Islands came from the latest Canary Islands Energy Yearbook (in Spanish, AEC), published in 2018 [48].

3.2. Approach

Assigning international aviation emissions is complex and, in fact, studies calculating the carbon footprint of the tourism sector have only recently appeared [31], with very few studies exclusively evaluating the footprint of aerial traffic. Furthermore, highly varied data and sources are not always comparable [17]. Thus, the calculations in this work are approximate quantifications of the amounts of GHG produced by air mobility in relation to a specific spatial context. Therefore, the main methodological contribution consists of determining the carbon footprint generated by tourist trips to the Canary Islands from the main tourist-emitting countries. To do this, firstly, a procedure was developed to count the number of visitors, journeys, and kilometers traveled by them in the period of one year. Subsequently, with the use of the abovementioned emissions calculators, quantifying of the estimated emissions for the group of islands during the same period of time was performed.

3.2.1. Estimation of Tourist Trips to the Islands

The search for statistical information on international passengers arriving in the Canary Islands was conducted to calculate the tourist influx. This search identified the number of visitors per month, year, and nationality. The method followed for the calculations was based, first of all, on an exhaustive analysis of the data on the number of tourists arriving through the airports, taking into account nationalities, using tourist portals and official statistics to calculate distances and emissions per trip. In order to avoid fluctuations inherent to inter-annual changes associated with multiple causes, the mean number of visitors analyzed for a period of five years (2015–2019) was taken as a reference.

3.2.2. Calculation of CO2 Emissions

Once the tourist influx data were established, CO2 emissions were estimated. A methodological test was performed using the calculation of CO2 emissions per passenger based on the flight taken to know the carbon footprint generated on the journey from the country of origin to the destination. In order to do this, the three online calculators mentioned above were used to calibrate the differences between them and their reliability.
For all options, a standard, tourist, or economic flight class was computed, and the same reference airports, calculating the complete journey, that is, round trip. However, as it is not possible to know exactly all the departure airports of all the tourists who travel to the islands, the authors decided to locate the departure of the flights from the main airport of each emitting country, which usually coincided with the larger and/or centrally located cities. For example, Frankfurt am Main was used in the case of Germany. The only exception was the UK, where, due to the high number of flights from Wales, Scotland, and England, Manchester was used as the reference airport for the calculation. Manchester is the third busiest British airport in number of passengers and second in the ranking outside the London area [49], and is located in a more central geographical area than the different London airports, which are located in the southeast of the country.
It should be noted that some of the tourists who arrive in the Canary Islands may have made a previous domestic transfer. In reality, it is true to say that this is not so frequent by air and not particularly relevant in the global computation, except for very large countries such as Russia. Thus, only direct routes are used in this work. Therefore, the final calculation in this article may be a slight underestimate.
With regard to the destination, only one airport was selected to calculate the distance of the journeys, designating Gran Canaria as the point of arrival. The justification for this, instead of Tenerife South, the islands’ other major international airport, is because it is located in a more equidistant place with respect to the main tourist islands (Tenerife, Gran Canaria, Lanzarote, and Fuerteventura) (The difference regarding a flight between Frankfurt and Gran Canaria with respect to Frankfurt to Tenerife is only 55 km more, which is 1.7% shorter. If the destination is Fuerteventura or Lanzarote, the difference is 128 and 188 km less, respectively, 4% and 5.9%. Taking into account that there are many more flights to Tenerife than to Fuerteventura or Lanzarote, the difference is practically cancelled out). The distances traveled and the emissions hardly vary in relative terms, so it is possible to fulfill the objective set with a high level of accuracy.
In this way, the tonnes of CO2 produced on each journey are established along with the number of passengers arriving from each of the different emitting countries included in the study, thus obtaining the carbon footprint of each nationality and, at the end of the process, an approximation of the total emissions from international air traffic in the Canary Islands.
Finally, the study compares the carbon footprint generated by the international commercial transport of people with that generated by other economic activities and the implication of air travel for the islands is related to each of the nationalities of origin depending on the carbon footprint per capita.

4. Results

4.1. Quantification of Tourist Trips to the Islands

The Canary Islands receive tourists with many different nationalities throughout the year, due, as already mentioned, to the absence of seasonality. In the five years analyzed here (2015–2019), there are direct connections with at least 26 countries, with the possible addition of the arrival of people from other nations with a stopover in Madrid, Barcelona, or any of the large European airports (Table 2).
Although there is no seasonality in the general flow of tourists, there is a certain temporal variation according to nationality, presumably depending on economic situation, climate in the country of origin, holiday period, age, etc., as shown in the reports prepared by the Government of Canary Islands in order to know the characteristics and preferences of foreign visitors in depth [50]. Thus, the highest number of visitors, British and German, are distributed throughout the year, but the former arrive somewhat more in the warm months, while the latter arrive more between October and April. Scandinavians, Finns, and Austrians also clearly predominate in winter; French and Swiss are distributed more evenly. In the overall computation, as has been seen, a somewhat higher volume of tourists arrive on the islands in the cold months than in May and June, the time of least inflow (Table 2 and Figure 1).
As can be seen, these are exclusively European tourists (99.3% of the total). Among all the nationalities, the UK with an average of more than five million tourists and Germany with three million stand out, well above Dutch, Swedish, and Irish visitors who number over half a million (Figure 3). Italy, Belgium, Switzerland, France, Norway, Poland, Finland, and Denmark send between 100,000 and 500,000 visitors per year. Austria, Portugal, Russia, Luxembourg, and the Czech Republic emit less than 100,000 tourists with the remaining countries, including Hungary and Iceland, sending less than 50,000, [43].

4.2. Estimation of CO2 Emissions in the Canary Islands

The results regarding the quantification of CO2 emissions show that the countries that generate the most carbon footprint on their journey depending on the distance to the archipelago are Russia, Finland, and Sweden, each passenger emitting more than 0.60 Tn of CO2 according to ICAO, on a round trip. This amount rises to above 1.3 Tn with the other emission calculators, followed by Norway, Iceland, Denmark, Poland, Austria, the Czech Republic, and Hungary, with between 0.5 and 0.6 Tn according to ICAO. Flights from Belgium, Switzerland, Luxembourg, Italy, the UK, Germany, The Netherlands, Ireland, and France account for between 0.4 and 0.5 Tn. Finally, with less than 0.4 Tn, one finds the routes from Cape Verde, Portugal, Mauritania, Gambia, Senegal, and Morocco which, as mentioned above and with the exception of Portugal, hardly involve foreign visitors to the islands, as is the case of Venezuela, since they mainly transport Canary travelers to these destinations, although this is obviously international air traffic (Table 3). Although the ICAO calculator is the most precise because of its specialization, it is paradoxical that their results are considerably lower than those obtained with other carbon footprint calculators. The ICAO offers results that are approximately 50% below those obtained by the CFL and CeroCO2 calculators. The CFL method gives, on average, an 86% higher result and CeroCO2, 106%.
The final calculation shows how the tourist volume factor intervenes more in the total emission count than the distance factor between the country of origin and the local destination. In fact, the correlation (Pearson) between the number of tourists and CO2 emissions is 0.99. Therefore, the percentage of emissions by nationality and the percentage of number of tourists by nationality are practically the same. The UK and Germany also stand out in the volume of emissions, with almost two-thirds of total emissions (Table 4). In the case of the Canary Islands, although a tourist traveling from Russia or Finland pollutes more on an individual basis, approximately 50% more than a Briton, due to the length of their route to the archipelago, the latter, although with less pollution per capita, have a higher global incidence due to the large number of British tourists traveling to the islands.
When the distribution of emissions by month is observed, it can be clearly seen how the carbon footprint is higher in the cold months compared to the warm ones. Especially in July and August, emissions per traveler decrease compared to the winter season (Figure 4). It should be remembered that most of the visitors from the most distant countries (Sweden, Finland, etc.) and also Germany travel more in the cold months.
The annual mean average of total CO2 emissions for the Canary Islands in the analyzed period (2015–2019), as a result of international air transport, is close to 6.5 Mt of CO2 (Table 5). When analyzing this amount in its context, it is possible to observe the notable relative importance of this activity, both for the Canary Islands and for any island that depends on the plane as a means of transport for its visitors.

4.3. The Aerial Carbon Footprint of Tourism Compared to Other Activities and in the European Context

The result obtained for the Canary Islands is a considerable figure and the equivalent of a large percentage of the archipelago’s total emissions (Table 5). The data collected in the Canary Islands Energy Yearbook for 2018 [48], based on the GHG inventory of Spain, prepared by the Spanish System of Inventory and Projections of Atmospheric Pollutants Emissions and using a methodology approved by the Intergovernmental Panel on Climate Change (IPCC), present the air emissions in the context of the archipelago.
The total estimated GHG emissions in the community were 13,586,940 Tn of CO2-eq in 2017, which is 4% of national emissions. Of these, transportation contributed 5,270,800 Tn of CO2-eq including land, sea, and national air transport (Table 5). Almost all of this GHG volume, 99.03%, was CO2 [48].
Breaking down the types of transport shows that international tourist aviation exceeds, by far, the magnitude of the carbon footprint of the rest of the means of transport. Terrestrial transport has the greatest weight in GHG emissions, but far less than those generated by aviation. This difference is greater when the emissions appear in CO2-eq in the calculations of the Yearbook, whereas the estimates calculated in the present work only include CO2. In other words, international air traffic generates emissions that far exceed, by almost 23%, those produced by road, maritime, and national air transport together and is 10 times higher than national domestic air traffic. Furthermore, although power generation and industry is the sector with the highest emissions, with 6.6 Mt of CO2-eq, their CO2 emissions only slightly exceed those of international air traffic (Figure 5 and Table 6).
International aviation is, therefore, conspicuously configured as a sector with high CO2 emissions, reaching the equivalent of 54.3% of total emissions in the Canary Islands (Table 6). In any case, it should not be forgotten that, if the calculation is carried out with other applications such as Footprint or CeroCO2, it would show results that would duplicate the presented data, and would be well above all economic sectors in the archipelago.

4.4. Relationship between the Carbon Footprint of International Tourists to the Islands and Their National per Capita Footprint

Similarly, the per capita emissions of the countries involved have been related to those of the journey to the islands (Table 7). The highest percentages are found in Gambia, Mauritania, Cape Verde, and Senegal, thus accentuating the great inequality that exists between developing countries and tourist emitters. In other words, a flight between the Canary Islands and the Gambia emits more than what an inhabitant of that country emits in their daily activities for a year. On the contrary, a German citizen’s emissions from a flight to the Canary Islands are equivalent to 5.3% of their total annual emissions. The journey to the Canary Islands has the highest percentage contributions in the case of tourists who come from Sweden (13.6%), Switzerland (11.95%), and Hungary (11.3%), since an important part of the per capita emissions are generated by the flights to the islands. However, tourists traveling from Luxembourg (3.1%) or the Netherlands (4.6%) have the least impact on their national per capita carbon footprint when making the trip because their citizens generate high annual emissions, over 10 Tn per year (Table 7).

5. Discussion

The analyses carried out for quantification of tourist trips to the islands only focus on direct connections which make up the vast majority of connections. It is also worth mentioning that some of the destinations (Senegal, Cape Verde, Venezuela, Mauritania, Gambia, and Morocco) are not emitters of tourists but rather receivers of a diverse range of visitors mostly residing in the Canary Islands. However, their impact on the total is almost negligible, both in number of passengers and in emissions.
Regarding the European origins of tourists, it is, by far, the climate of the islands that is the primary motivator for the trip [51,52], with notably drier and warmer environmental conditions than in the countries of origin, especially in winter. It should not be forgotten that, although there is no seasonality, the Canary Islands attributes its low season to the warm months of the year due to competition from other destinations, especially Mediterranean ones, which offer products and services at lower prices compared to the winter season [33].
According to the ICAO, the emissions on the journeys are mainly due to the distance traveled, that is, their specific data, and to the load factors of the different aircraft. Therefore, Russia (Moscow) is the country that leads this ranking, since it is the place of origin with the greatest distance of all the nations studied with respect to the Canary Islands with almost 5200 km between Tenerife South (The ICAO only allows calculations for real flights, so since there are no routes from Gran Canaria to Moscow, the calculation has been made with Tenerife South, which has flights operated by the Russian airline Aeroflot) and Moscow (Table 3).
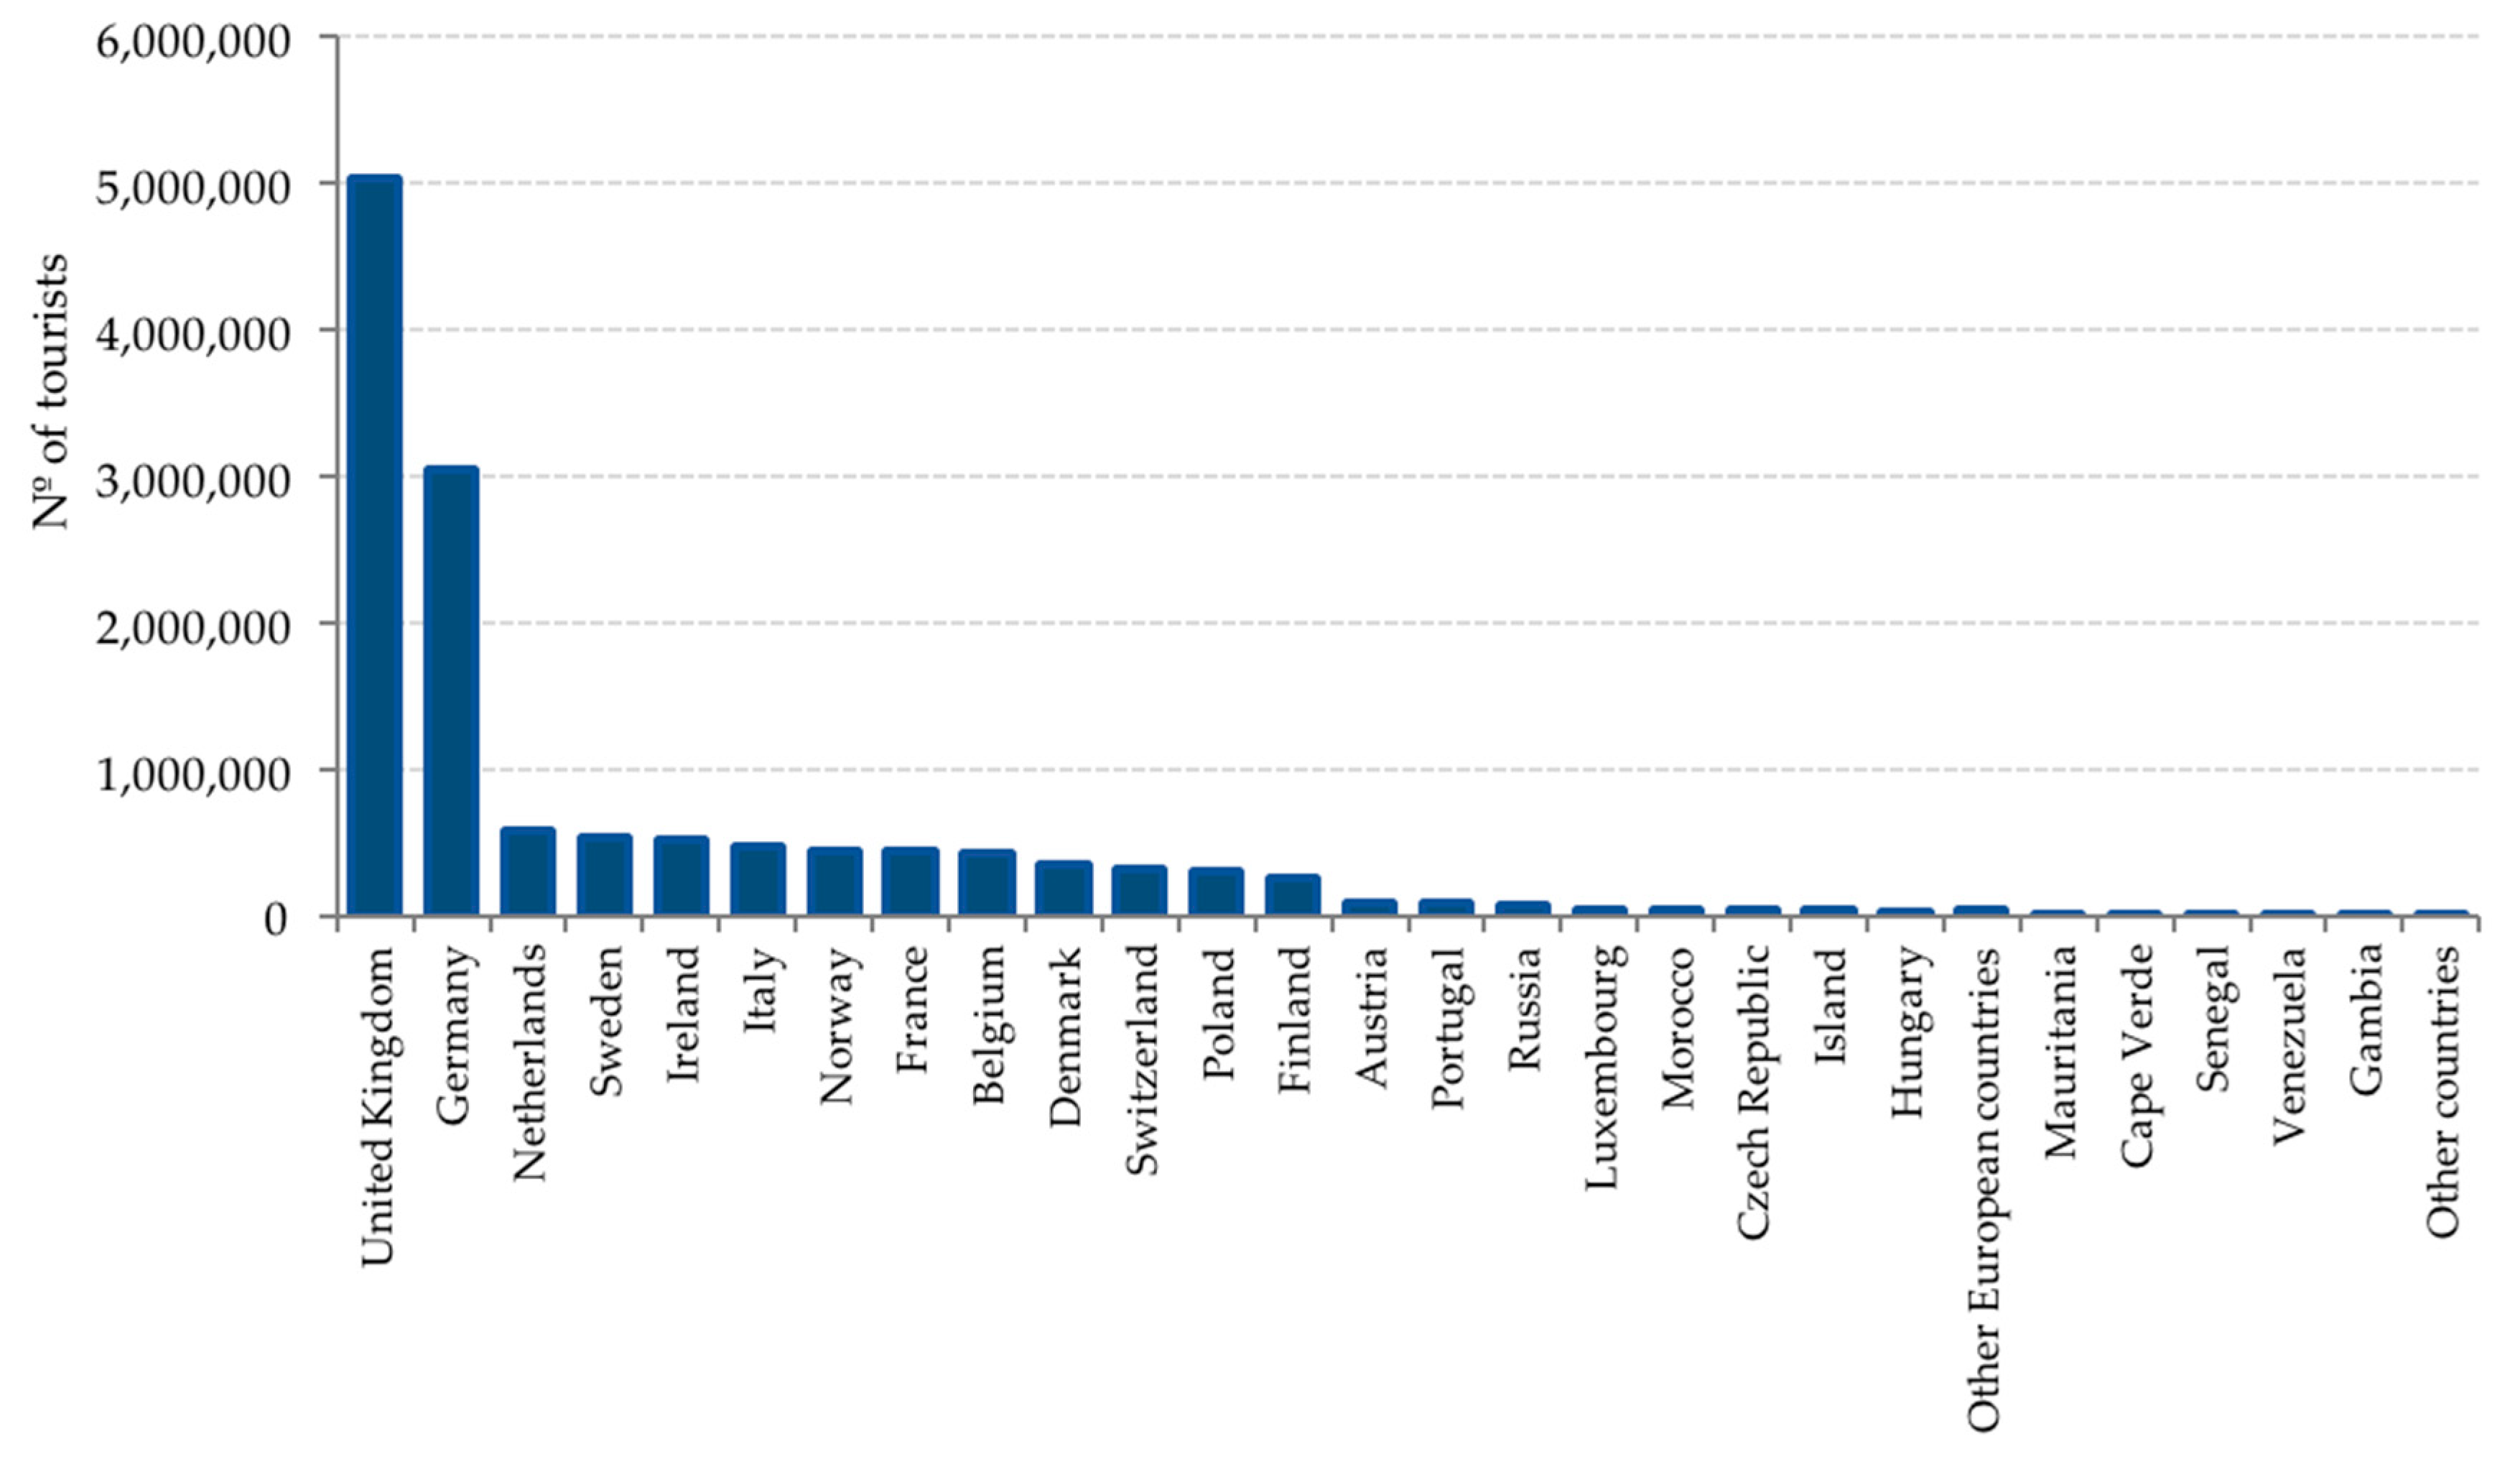
Nevertheless, all passengers need to be counted to arrive at the total emissions. When making this calculation, the total volume of CO2 is much more linked to the number of tourists than to the distance traveled. Therefore, in the case of nationalities, the tourists that generate the highest carbon footprint annually are the most numerous, those who arrive from the UK and Germany because, although their route generates per capita just over half of the emissions from flights from Russia, they are, by far, the countries with the most trips to the islands. The sum of British and German tourists accounts for two out of every three visitors (Figure 3).
The mean average emission per tourist in the Canary Islands on their way to the islands is 0.48 Tn, compared to only 0.26 Tn in the case of the Balearic Islands. This difference is fundamentally due to the greater distance of the countries of origin from the Canary Islands, since the number of travelers, as mentioned above, is similar. The data found on most of the European islands are similar to the data on the Balearic Islands. This is the case of Malta, for example, with 0.31 Tn. On the other hand, it should be mentioned that the emissions in the case of the Canary Islands are on average approximately two times higher than those emitted by a European citizen, 0.25 Tn, in their annual air travel [17].
On a worldwide basis, other archipelagos further away from their emitting airports, such as Hawaii, have figures much higher than those of the Canary Islands. In this case, the city of Los Angeles in California, the closest airport emitting tourists, is located more than 4100 km away, which means minimum emissions per passenger of 0.59 Tn, amounting to 1.03 in the case of a flight from New York to Honolulu. As regards international tourism, the Japanese market [37] stands out, so that a flight from Tokyo to Hilo, with a distance very similar to that of a flight from Los Angeles of 4100 km, emits 0.59 Tn per passenger. Other tourist islands far from the emitting countries such as Bali in Indonesia or the Maldives exceed 0.8 Tn. The most extreme cases would be the routes between Western Europe and the islands of the South Pacific: a flight between Paris and Papeete (Tahiti) via Los Angeles emits almost 1.7 Tn per passenger in economy class and 3.3 in first class. If the other calculators like ZeroCO2 are used, the data are 2.4 times higher.
With respect to the carbon footprint of tourism in the Canary Islands compared to other activities and in the European context, the high environmental impact of the movement of tourists to the islands is evident. In this regard, taking into account that air traffic emissions in Europe slightly exceeded 200 Mt in 2010 [14], it could be true to say that the air traffic with origin and destination in the Canary Islands could be between 2% and 3% of the total emissions of the continent and about 1% on a worldwide scale. At the national level, considering that 17% of all operations have their origin or destination in the Canary Islands and knowing that the majority of flights are from Europe, it is clear that a significant part of CO2 emissions in Spain are due to air traffic in the Canary Islands. In fact, according to the Global Sustainable Tourism Panel at the Griffith University, CO2 emissions from air traffic in Spain in 2018 were 20.71 Mt, making Spain the fifth biggest emitter of CO2 from air traffic in the world [22]. Consequently, international air traffic with the Canary Islands on its own could account for the equivalent of 31% of total emissions from Spain, provided that all the pollution was attributed to the archipelago and not to the countries of origin.
In this context, the studies published to date show that the carbon footprint of international traffic in the Canary Islands is much higher than that of various European countries with a much larger population than the archipelago, as is the case of Denmark, which produces 3.81 Mt of CO2 annually [53], 2.6 Mt less than the Canary Islands.
In the latter observation, the relationship between the carbon footprint of international tourist to the islands and their national per capita footprint was analyzed. The exploration shows that the transfer of tourists to the islands does not only have consequences on the carbon footprint originated in the destination, but it also affects the countries that emit tourists, creating a double impact if analyzed separately. In this regard, aviation emissions affecting climate change need to be regulated [54]. The interest of European Union policies in the impact of GHG emissions by airlines crystallized in 2012 when a regulation on traffic emissions was implemented with the aim of reducing the carbon footprint, supported by the International Air Transport Association (IATA) [47]. This last fact was consolidated in Directive (EU) 2018/410, of 14 March 2018, of the European Parliament and of the Council, which aims to intensify GHG reduction actions. A Directive that also adopts Regulation (EU) 2017/2392, of 13 December 2017, by which the reduced emissions trading scheme of the European Union for the aviation sector ends in 2023. However, despite efforts in Europe, on a worldwide scale, this type of regulatory framework is still lacking, meaning that there is no effective control of emissions.
On the other hand, the inequalities in air traffic emissions have been described by Gössling and Humpe (2020) [17]. Only between 2% and 4% of the planet’s population took an international flight in 2018. Of these, more than 13.5 million did so to the Canary Islands. The emissions of these few international tourists in relative terms affect the entire population of the planet. In this context, a new concept known as “flygskam” [55] appeared in 2018 in Sweden and which could be translated as “flight shame”, whose main exponent is Greta Thunberg. The results of this are diverse political or social proposals, still diffuse and dispersed, tending to aim to drastically reduce the use of airplanes as a means of transport. It seems clear that this trend could be highly detrimental for the aviation industry and also for various tourist destinations as is the case in Spain, where more than 80% of visitors arrive by air [56,57] and especially islands, such as those that make up the outermost territories of the European Union that can only be reached by plane. A clear example of this is the aforementioned Directive (EU) 2018/410 and Regulation (EU) 2017/2392 whose transposition in the new proposed Spanish law amending Law 1/2995, of March 9, in its third transitory provision, clearly states how flights with destination or origin in airports belonging to an outermost region of the European Union will have advantageous conditions regarding the restriction of emission rights until 31 December 2023, thereby aiming to safeguard the insular and remote condition of the said territories.
There are already some experiences showing that an increase in taxes on aviation fuels produces an indisputable decrease in the use of the airplane as a means of transport [15]. The truth is that in 2017, the peak in the arrival of tourists to the Canary Islands was reached and in the following years, the number has been decreasing, by 3.3% between 2017 and 2018 and 5.2% between 2018 and 2019 [43]. It is clear that there are multiple causes, but it could be hypothesized that some of the potential visitors change their choice of destination for environmental reasons, motivated by the increase in awareness of climate change. The Canary Islands Government and local administrations have extensive knowledge of why tourists travel to the archipelago based on large-scale and exhaustive surveys of travelers. Based on the aforementioned hypothesis, it could be useful to add questions related to climate change or the environmental awareness of those who visit the islands.
As the latest data of interest, it should be noted that some authors suggest that all tourism activity emissions are slightly more than twice those of emissions due to air traffic [53] or that international aviation accounts for approximately one-third of the carbon footprint generated by tourism activity [31]. It could be said, therefore, that the international tourist activity in the Canary Islands may generate up to 13 Mt of CO2 annually, an amount equivalent to all the emissions produced by the archipelago in all its socioeconomic activity each year. In short, the above confirms, as other authors point out, that the tourism sector is highly vulnerable to climate change [58]; the results presented here show the great environmental significance of the movement of millions of tourists between the more developed parts of Europe and the islands of its periphery, but also the great economic and social cost that mitigating the problem will entail.

6. Conclusions

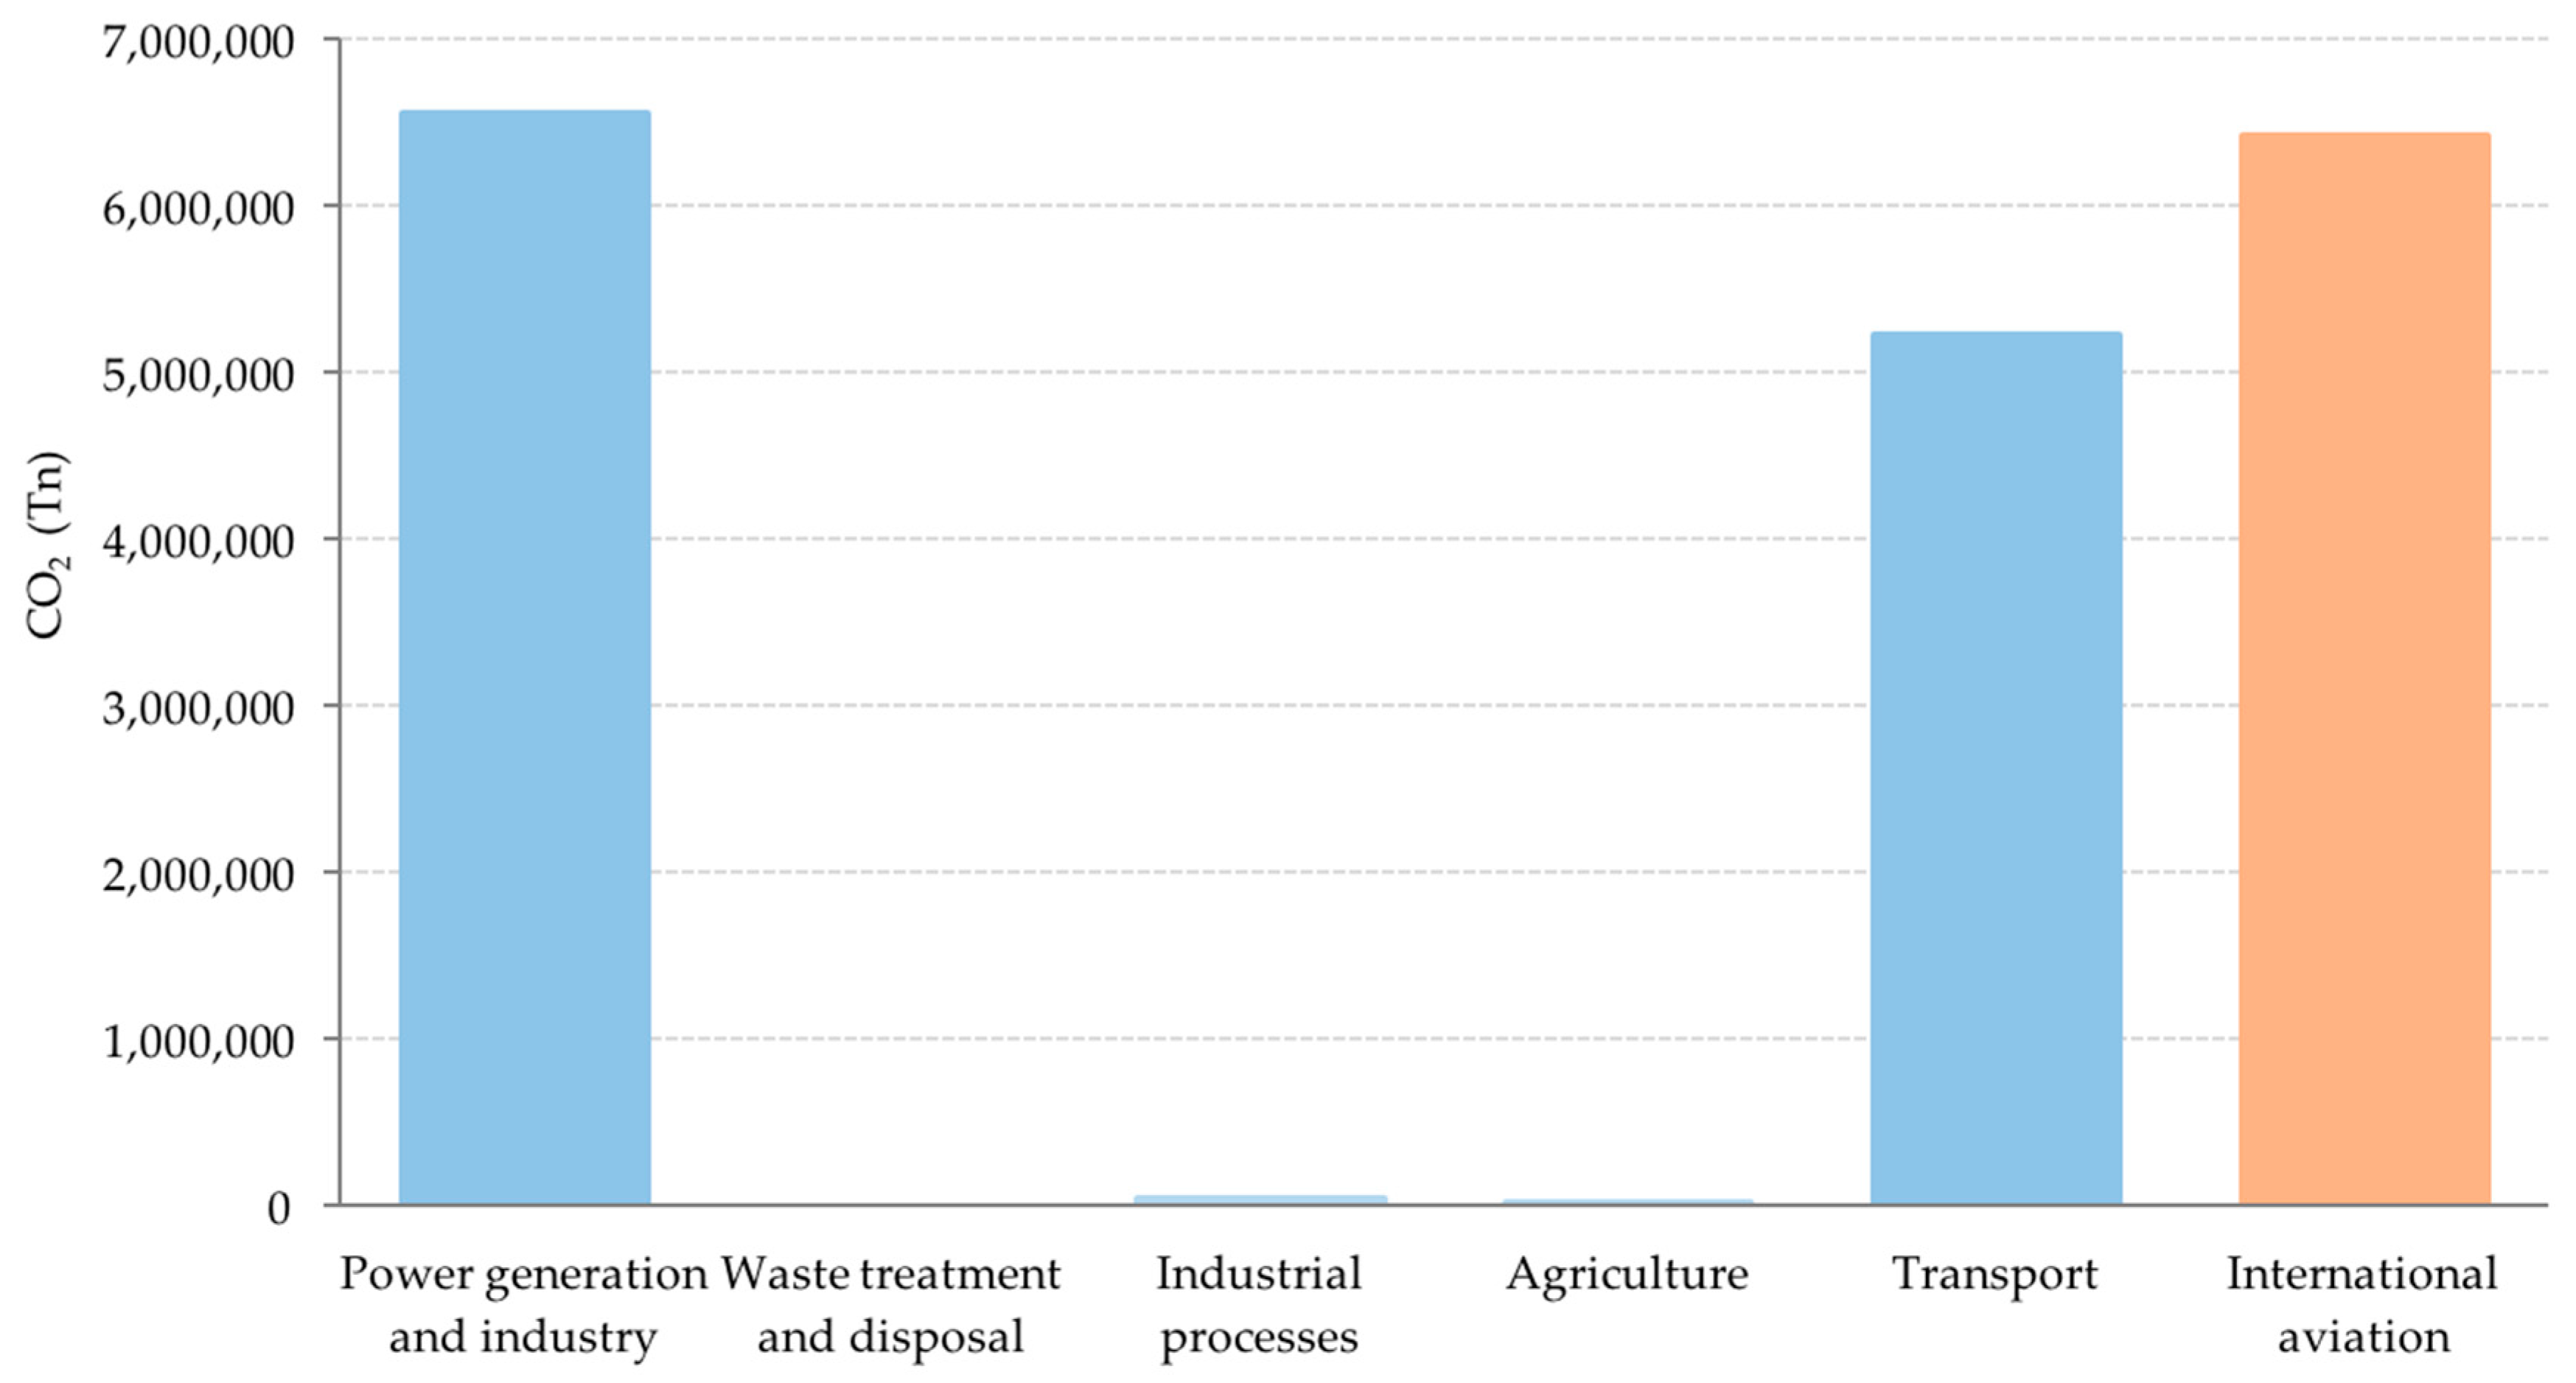
Tourist islands have enjoyed rapid development in recent decades. Air transport has facilitated the mass arrival of tens of millions of visitors. One of the main impacts of this touristic activity is the emission of large amounts of GHG, especially CO2, mainly due to air transport. The Canary archipelago is a good example of islands where the plane is the only means of passenger transport. Its distance from the tourist-emitting countries, most of them at an average distance of between 3000 and 3500 km, means that the consumption of aircraft fuel generates vast amounts of CO2. In order to evaluate the carbon footprint generated by tourist aviation, an accessible and useful methodological test has been proposed here, based on emissions per capita per air route, but which is effective thanks to the robustness and disaggregation of tourist data on arrivals to one of the most important island destinations in the world. In this regard, the total emissions from international tourist aviation in the Canary Islands account for the equivalent of 54% of all emissions produced in the archipelago, with more than 6 Mt, second only to electricity generation and industrial processes for all the islands.
As regards total emissions, it is the countries from where most tourists travel to the islands which account for most of the volume of emissions which, in the case of the Canary Islands, are the UK and Germany, making up two-thirds of the total, although Scandinavian and Russian tourists have the highest carbon footprint (around 0.65 Tn/passenger) when considering countries on an individual basis.
Calculation of the emissions of each of the routes was performed with three different calculators in order to calibrate the measurement methods and expose the differences that exist between them. It is supposed that the most reliable data should be those offered by the ICAO, as it is a UN agency specialized in civil aviation, which is why it has been taken as a reference for the analysis. However, the other calculators give a higher amount of emissions, around 100% more.
Quantifying emissions is the first step in establishing mitigation measures, which will have significant repercussions on small island territories specializing in tourism. Among the measures proposed by different bodies is the implementation of measures and specific taxes to help reduce the number of flights, especially in the European population groups who are more aware of climate change or to increase the price of the fares, which would affect the poorest sections of the population.
The aviation carbon footprint is in the spotlight due to its participation in global warming, not only because of environmental groups or climate scientists but even public institutions such as the European Union or numerous governments which have drawn attention to it. In this context, climate change mitigation measures aimed, above all, at reducing GHGs may not only have economic repercussions on the islands, but also on peripheral countries, especially the Mediterranean countries, with a significant weight of their economies based on tourism.
For the more remote islands, whose only possibility of connectivity is the plane, their strategies about promoting themselves as tourist destinations should, in all probability, demonstrate environmental sustainability and offer prospective visitors a product that is attractive enough to persuade tourists to extend the length of their stays instead of pushing to increase the number of visitors. However, in the case of the Canary Islands, this is difficult since the data show that the average stay is already long, nine days on average [52]. In any case, emission reduction measures should be sensitive to the existing situation in the case of islands and their extremely fragile economies which are highly dependent on aviation.

Author Contributions

Conceptualization, P.D.A., J.D.P. and A.L.D.; data analysis, P.D.A., A.L.D. and C.B.H.; methodology, J.D.P. and P.D.A.; visualization, A.L.D.; writing—original draft, P.D.A., J.D.P. and A.L.D.; writing—review and editing, A.L.D., P.D.A., J.D.P. and C.B.H. All authors have read and agreed to the published version of the manuscript.

Funding

This research received no external funding.

Institutional Review Board Statement

Not applicable.

Informed Consent Statement

Not applicable.

Conflicts of Interest

The authors declare no conflict of interest.

References

  1. World Tourism Organization, UNWTO. Panorama of International Tourism; OMT: Madrid, Spain, 2019. [Google Scholar] [CrossRef]
  2. World Tourism Organization, UNWTO. Transport-related CO2 Emissions of the Tourism Sector—Modelling Results; OMT: Madrid, Spain, 2020. [Google Scholar] [CrossRef]
  3. Lenzen, M.; Sun, Y.Y.; Faturay, F.; Ting, Y.P.; Geschke, A.; Malik, A. The carbon footprint of global tourism. Nat. Clim. Change 2018, 8, 522–528. [Google Scholar] [CrossRef]
  4. Gössling, S.; Higham, J. The low-carbon imperative: Destination management under urgent climate change. J. Trav. Res. 2020, 1–13. [Google Scholar] [CrossRef]
  5. European Parliament. Aircraft and Ship Emissions: Facts and Figures (Infographic); European Environment Agency, EEA: Copenhagen, Denmark, 2020. [Google Scholar]
  6. Becken, S.; Carmignani, F. Are the current expectations for growing air travel demand realistic? Ann. Tour. Res. 2020, 80, 102840. [Google Scholar] [CrossRef]
  7. Simone, N.W.; Stettler, M.E.; Barrett, S.R. Rapid estimation of global civil aviation emissions with uncertainty quantification. Trans. Res. Part D Trans. Environ. 2013, 25, 33–41. [Google Scholar] [CrossRef]
  8. European Union Aviation Safety Agency, EASA. European Aviation Environmental Report 2019; European Union Aviation Safety Agency: Cologne, Germany, 2019. [Google Scholar] [CrossRef]
  9. Gössling, S.; Scott, D.; Hall, C.M. Global trends in length of stay: Implications for destination management and climate change. J. Sustain. Tour. 2018, 26, 2087–2101. [Google Scholar] [CrossRef] [Green Version]
  10. Lee, D.S.; Fahey, D.W.; Skowron, A.; Allen, M.R.; Burkhardt, U.; Chen, Q.; Gettelman, A. The contribution of global aviation to anthropogenic climate forcing for 2000 to 2018. Atmos. Environ. 2020, 244, 117834. [Google Scholar] [CrossRef]
  11. Boeing. Commercial Market Outlook 2020–2039. Available online: https://www.boeing.com/resources/boeingdotcom/market/assets/downloads/2020_CMO_PDF_Download.pdf (accessed on 10 January 2021).
  12. Airbus. Global Market Forecast. Cities, Airports & Aircraft. 2019–2038. 2020. Available online: https://www.airbus.com/aircraft/market/global-market-forecast.html (accessed on 10 January 2021).
  13. Chèze, B.; Chevallier, J.; Gastineau, P. Will technological progress be sufficient to stabilize CO2 emissions from air transport in the mid-term? Trans. Res. Part D Trans. Environ. 2013, 18, 91–96. [Google Scholar] [CrossRef] [Green Version]
  14. Alonso, G.; Benito, A.; Lonza, L.; Kousoulidou, M. Investigations on the distribution of air transport traffic and CO2 emissions within the European Union. J. Air Trans. Manag. 2014, 36, 85–93. [Google Scholar] [CrossRef] [Green Version]
  15. González, R.; Hosoda, E.B. Environmental impact of aircraft emissions and aviation fuel tax in Japan. J. Air Trans. Manag. 2016, 57, 234–240. [Google Scholar] [CrossRef]
  16. The International Air Transport Association (IATA). Available online: https://www.iata.org/ (accessed on 26 January 2021).
  17. Gössling, S.; Humpe, A. The global scale, distribution and growth of aviation: Implications for climate change. Global. Environ. Chang. 2020, 65, 102194. [Google Scholar] [CrossRef]
  18. Ruban, D.A.; Yashalova, N.N. Climate-friendly ethics prescribed by top world airlines: Empirical evidence. Climate 2020, 8, 119. [Google Scholar] [CrossRef]
  19. Crisóstomo, A.J. Análisis de la sostenibilidad energética del transporte aéreo y su impacto en el turismo. Investig. Turísticas 2020, 20, 31–49. [Google Scholar] [CrossRef]
  20. Peeters, P.; Higham, J.; Kutzner, D.; Cohen, S.; Gössling, S. Are technology myths stalling aviation climate policy? Trans. Res. Part D Trans. Environ. 2016, 44, 30–42. [Google Scholar] [CrossRef] [Green Version]
  21. Carbon Emissions Calculator, ICAO. Available online: https://www.icao.int/environmental-protection/Carbonoffset/Pages/default.aspx (accessed on 10 January 2021).
  22. Global Sustainable Tourism Dashboard. Carbon Emissions, Griffit University. 2020. Available online: https://gugstdstg01.wpengine.com/carbon-emissions/ (accessed on 10 January 2021).
  23. Scott, D.; Gössling, S. What could the next 40 years hold for global tourism? Tour. Recreat. Res. 2015, 40, 269–285. [Google Scholar] [CrossRef]
  24. Garau, C.; Desogus, G.; Stratigea, A. Territorial cohesion in insular contexts: Assessing external attractiveness and internal strength of major Mediterranean islands. Eur. Plann. Stud. 2020, 1–20. [Google Scholar] [CrossRef]
  25. IPCC. Climate change 2013: The physical science basis. In Contribution of Working Group I to the Fifth Assessment Report of the Intergovernmental Panel on Climate Change; Cambridge University Press: Cambridge, UK; New York, NY, USA, 2013; 1535p. [Google Scholar]
  26. Petzold, J.; Ratter, B.M. Climate change adaptation under a social capital approach—An analytical framework for small islands. Ocean Coast. Manag. 2015, 112, 36–43. [Google Scholar] [CrossRef]
  27. Latorre, F.M.F.; Del Olmo, F.D. Huella ecológica y presión turística socio-ambiental: Aplicación en Canarias. BAGE: Boletín de la Asociación de Geógrafos Españoles 2011, 57, 147–174. [Google Scholar]
  28. Simancas Cruz, M.R.; García Cruz, J.I.; Dorta Rodríguez, A.; Falero González, R.A. El impacto territorial de la moratoria turística de Canarias. In XXII Congreso de Geógrafos Españoles, Universidad de Alicante; Vicente Gozálvez, P., Juan Antonio, M.M., Eds.; Asociación de Geógrafos Españoles: Madrid, Spain, 2011; pp. 715–726. [Google Scholar]
  29. Llorca Afonso, E.; Sosa Díaz-Saavedra, J.A. Procesos de reciclaje aplicados al turismo de masas en el Sur de Gran Canaria. Vector Plus 2009, 34, 65–76. [Google Scholar]
  30. Robaina, C.R.; de la Nuez, C.F.; López del Pino, F.; Escauriaza, M.J. Economía Circular y Turismo—Análisis de la Industria Hotelera: El Caso de las Islas Canarias. XX Congreso AECIT, Almería, España. 2018. Available online: https://aecit.org/files/congress/20/papers/382.pdf (accessed on 10 January 2021).
  31. Sun, Y.Y. A framework to account for the tourism carbon footprint at island destinations. Tour. Manag. 2014, 45, 16–27. [Google Scholar] [CrossRef]
  32. Exceltur. IMPACTUR Canary Islands 2018. In Study of the Economic Impact of Tourism on the Economy and Employment of the Canary Islands. Canary Islands Government; 2018; Available online: https://www.exceltur.org/wp-content/uploads/2019/12/IMPACTUR-Canarias-2018.pdf (accessed on 10 January 2021).
  33. Hernández-Martín, R. Impactos económicos del turismo. In ¿Existe un Modelo Turístico Canario? Promotur Turismo Canarias, Universidad de La Laguna: Santa Cruz de Tenerife, Spain, 2016; pp. 8–31. [Google Scholar]
  34. González-Lemus, N.; González, A.; Hernández, J.A. El Viaje y el Turismo en Canarias; Anroart Ediciones: Madrid, Spain, 2012. [Google Scholar]
  35. The World Bank (IBRD). Data Bank. 2019. Available online: https://data.worldbank.org/ (accessed on 10 January 2021).
  36. Spanish National Institute of Statistics (in Spanish INE). Global Service sector Surveys, Madrid. 2019. Available online: https://ine.es/ (accessed on 26 January 2021).
  37. Department of Business, Economic Development & Tourism (DBEDT). Visitor Statistics; DBEDT: Honolulu, HI, USA, 2019.
  38. Hernández, J.Á.; Armengol, M.; González, A.; Sobral, S. El hándicap del transporte aéreo para el desarrollo inicial del turismo de masas en las islas Canarias. Cuadernos de Turismo 2010, 28, 75–91. Available online: https://revistas.um.es/turismo/article/view/147221 (accessed on 10 January 2021).
  39. Balearic Islands Tourism Strategy Agency (in Spanish AETIB 2019). Tourist Agency of the Balearic Islands, Regional Ministry of the Economic Model, Tourism and Labor. Government of the Balearic Islands. Available online: http://www.caib.es/sites/estadistiquesdelturisme/f/325768 (accessed on 10 January 2021).
  40. AENA. Annual Statistical Report on Passenger Traffic, Operations and Cargo at Spanish Airports. 2019. Available online: http://www.aena.es/csee/ccurl/174/519/00.Definitivo_2019.pdf (accessed on 10 January 2021).
  41. OpenFlights. Available online: https://openflights.org/ (accessed on 26 January 2021).
  42. Gössling, S. Risks, resilience, and pathways to sustainable aviation: A COVID-19 perspective. J. Air Trans. Manag. 2020, 89, 101933. [Google Scholar] [CrossRef] [PubMed]
  43. Canary Statistics Institute (in Spanish ISTAC). Statistics of Tourist Movements on the Borders of the Canary Islands (FRONTUR-Canarias). Canary Islands Government. 2020. Available online: http://www.gobiernodecanarias.org/istac/temas_estadisticos/sectorservicios/hosteleriayturismo/demanda/E16028B.html (accessed on 10 January 2021).
  44. National Statistics Office of Malta, (NSOM). Report of Malta´s Tourism Performance in 2019; Malta Tourism Authority: Kalkara, Malta, 2019.
  45. Carbon Footprint Ltd. (CFL). Available online: https://www.carbonfootprint.com/ (accessed on 26 January 2021).
  46. CeroCO2. Available online: https://www.ceroco2.org/ (accessed on 26 January 2021).
  47. Heredia-Yzquierdo, F.J. El mercado de derechos de emisión de CO2 y otros gases de efecto invernadero: El sector de la navegación aérea y su impacto en el turismo. Derecho y Cambio Social 2015, 12, 7. Available online: https://dialnet.unirioja.es/descarga/articulo/5460324.pdf (accessed on 10 January 2021).
  48. Canary Islands Energy Yearbook (in Spanish AEC). Ecological Transition Area, Fight against Climate Change and Territorial Planning, Government of the Canary Islands. 2018. Available online: https://www.gobiernodecanarias.org/cmsweb/export/sites/energia/doc/Publicaciones/AnuarioEnergeticoCanarias/ANUARIO-2018-27012020.pdf (accessed on 10 January 2021).
  49. World Airport Codes. Available online: https://www.world-airport-codes.com/ (accessed on 26 January 2021).
  50. Canary Islands Tourism. Available online: https://turismodeislascanarias.com/ (accessed on 26 January 2021).
  51. Canary Islands Tourism. Profile of British Tourists Visiting the Canary Islands; Canary Islands Government: Canary Islands, Spain, 2015.
  52. Canary Islands Tourism. Main indicators according to destination island. In Tourist Expenditure Survey (2018); Canary Islands Government: Canary Islands, Spain, 2018. [Google Scholar]
  53. Christensen, L. Environmental impact of long distance travel. Trans. Res. Proc. 2016, 14, 850–859. [Google Scholar] [CrossRef] [Green Version]
  54. Efthymiou, M.; Papatheodorou, A. EU Emissions Trading scheme in aviation: Policy analysis and suggestions. J. Clean. Prod. 2019, 237, 117734. [Google Scholar] [CrossRef]
  55. Mkono, M. Eco-anxiety and the flight shaming movement: Implications for tourism. J. Tour. Future 2020, 6, 223–226. [Google Scholar] [CrossRef]
  56. Hosteltur. Ashamed to Fly. Can this Movement Change Tourism? 2019. Available online: https://www.hosteltur.com/130487_vergueenza-de-volar-puede-este-movimiento-cambiar-el-turismo.html (accessed on 10 January 2021).
  57. Statista Annual Number of International Tourists who Arrived in Spain by Plane from 2000 to 2019. 2020. Available online: https://es.statista.com/estadisticas/474883/llegadas-de-turistas-extranjeros-a-espana-en-avion/ (accessed on 10 January 2021).
  58. Scott, D.; Hall, C.M.; Gössling, S. Global tourism vulnerability to climate change. Ann. Tour. Res. 2019, 77, 49–61. [Google Scholar] [CrossRef]
Figure 2. Canary Islands international destinations. Source: OpenFlight [41].
Sustainability 13 01795 g002
Figure 3. Average annual arrival of tourists by nationality to the Canary Islands (2015–2019). Source: ISTAC [43].
Sustainability 13 01795 g003
Figure 4. Monthly evolution of CO2 emissions from international air traffic and tourists in the Canary Islands (2015–2019). Source: ISTAC [43].
Sustainability 13 01795 g004
Figure 5. CO2 emissions by sector and international aviation. Source: AEC [48].
Sustainability 13 01795 g005
Table 1. Distances (Km) between different island airports and some of the most common airports sending the tourists.
AirportGran CanariaMaltaMallorcaDifference: Gran Canaria and MaltaDifference: Gran Canaria and Mallorca
Paris27991754104910451750
Dublin2931253016834011248
Rome293268983722432095
Zurich2998137899316202005
Manchester3024234015796841445
Amsterdam31801981142411991756
Frankfurt318216451.24915371933
Stockholm43342655247416791860
Helsinki46942821277118731923
Moscow51812827312423542057
Mean Distance35262062171814641808
Source: ICAO [21].
Table 2. Monthly average (in thousands) of arrivals by air to the Canary Islands, 2015–2019.
TotalJanFebMarAprMayJunJulAugSeptOctNovDec
Total Countries13,353125511871215997107510989539171088127011501149
Europe13,253124611791207987106310889479111079126211421141
Germany3051289294269226226233210204252299269278
Austria9611117666558101011
Belgium434393638343842323237363434
Denmark35450443310101310923514953
Finland2594544251000114434144
France446342339344947333651363528
Hungary30333233222223
Ireland526383549484756554543413436
Iceland43434334323554
Italy476474039364641363536393742
Luxembourg52446454336444
Norway44763634313121913925616265
The Netherlands579494456445759384351484544
Poland312242325283233282421242326
Portugal86657101715855333
UK5042415385468435461460425412423438373347
Czech Republic48336556433332
Russia73557778866535
Sweden5358480451010109936807785
Switzerland318282933272325212530282623
Other European countries49665344215545
Cape Verde14111111002222
USA *0000000000000
Gambia3000000000000
Morocco49434675334333
Mauritania19211222111111
Senegal7100111011111
Venezuela4100000000000
Other countries4001000000000
* Only 76 passengers have arrived per year. Source: ISTAC [43].
Table 3. CO2 emissions (Tn) per passenger from their country of origin to the Canary Islands on a round trip flight.
CountryCityIATA CodeKmsICAOCeroCO2CFL
RussiaMoscowSVO51810.721.551.44
FinlandHelsinkiHEL46940.651.411.3
VenezuelaCaracasCCS56800.601.701.58
SwedenStockholmARN43340.601.301.2
NorwayOsloOSL41020.561.231.14
IcelandReykjavikKEF40410.551.211.12
PolandWarsawWAW38030.531.141.05
AustriaViennaVIE40280.551.211.12
DenmarkCopenhagenCPH35420.551.110.98
Czech RepublicPraguePRG35100.521.100.97
HungaryBudapestBUD36900.521.151.02
BelgiumBrusselsBRU30500.490.950.85
SwitzerlandZurichZRH29980.490.960.83
LuxembourgLuxembourgLUX30290.480.950.84
ItalyRomeFCO29320.470.910.81
UKManchesterMAN30240.470.940.9
GermanyFrankfurtFRA31820.470.990.88
NetherlandsAmsterdamAMS31800.460.990.88
IrelandDublinDUB29310.450.910.81
FranceParisCDG27990.440.870.78
Cape VerdeEspargosSID14630.380.460.41
PortugalLisbonLIS13360.310.420.37
MauritaniaNouakchottNKC10930.310.340.3
GambiaBanjulBJL16250.250.5070.45
SenegalDakarDKR14860.210.460.41
MoroccoCasablancaCMN9590.150.300.27
Source: ICAO [21], CFL [45] and CeroCO2 [46].
Table 4. Average annual carbon footprint of European air tourism to the Canary Islands by country of origin (2015–2019).
CountryPercentageTotal (Tn)
Germany22.31,430,417.1
Austria0.852,817.0
Belgium3.3213,063.1
Denmark2.9188,799.6
Finland2.6168,985.8
France3.1196,319.6
Hungary0.215,268.0
Ireland3.7238,474.6
Iceland0.423,785.9
Italy3.5224,540.0
Luxembourg0.424,885.2
Norway3.9252,142.9
Netherlands4.2267,007.9
Poland2.7172,541.6
Portugal0.426,409.1
UK36.72,354,409.3
Czech Republic0.424,712.9
Russia0.852,403.1
Sweden5.0319,805.6
Switzerland2.4152,419.8
Source: ICAO [21].
Table 5. Tn GHG (CO2-eq) of the different means of transport.
Type of TransportTonnes of GHC
Terrestrial3,485,200
Maritime1,159,500
Domestic air634,200
Total transport5,270,800
International air6,414,352 *
* Calculation in the present work of CO2 emissions. Source: AEC [48].
Table 6. Tonnes of GHG and CO2 from the different economic sectors (2017) and international aviation (2015–2019).
Economic SectorsGHGPercentageTonnes CO2Percentage
Power generation and industry6,574,34048.396,548,67055.5
Waste treatment and disposal1,160,6008.5400
Industrial processes391,0002.8834,8500.3
Agriculture190,2001.421000.02
Transport5,270,80038.795,219,84044.22
Total13,586,94010011,805,470100
International aviation 6,414,35254.33
Source: AEC [48].
Table 7. Percentage of the contribution of the journey to the Canary Islands to the per capita carbon footprint (2016).
CountryEmissions per Capita (Tn)Emissions per Journey (Tn)Involvement of the Journey (%)
Gambia0.20.25125.00
Mauritania0.70.3144.29
Cape Verde1.00.3838.00
Senegal0.70.2130.00
Sweden4.40.6013.64
Switzerland4.10.4911.95
Hungary4.60.5211.30
Venezuela5.50.6010.91
Denmark5.50.5510.00
France *4.60.449.57
Iceland6.20.558.87
Italy *5.30.478.87
Morocco1.70.158.82
UK5.80.478.10
Austria7.00.557.86
Finland8.30.657.83
Norway7.80.567.18
Poland7.90.536.71
Portugal4.70.316.60
Russia12.00.726.00
Belgium8.60.495.70
Ireland7.90.455.70
Czech Republic9.70.525.36
Germany8.80.475.34
Netherlands10.00.464.60
Luxembourg15.40.483.12
* Data from 2014. Source: ICAO [21] and IBRD [35].
Publisher’s Note: MDPI stays neutral with regard to jurisdictional claims in published maps and institutional affiliations.

