Article

LCA and Exergo-Environmental Evaluation of a Combined Heat and Power Double-Flash Geothermal Power Plant

1
Department of Industrial Engineering, University of Florence, 50134 Firenze FI, Italy
2
Department of Economics, Engineering, Society and Business Organization, University of Tuscia, 01100 Viterbo, Italy
*
Author to whom correspondence should be addressed.
Sustainability 2021, 13(4), 1935; https://0-doi-org.brum.beds.ac.uk/10.3390/su13041935
Submission received: 2 December 2020 / Revised: 5 February 2021 / Accepted: 5 February 2021 / Published: 11 February 2021
(This article belongs to the Special Issue Sustainability of Geothermal Energy Conversion—Life Cycle Analysis)

Abstract

:
This study deals with the life cycle assessment (LCA) and an exergo-environmental analysis (EEvA) of the geothermal Power Plant of Hellisheiði (Iceland), a combined heat and power double flash plant, with an installed power of 303.3 MW for electricity and 133 MW for hot water. LCA approach is used to evaluate and analyse the environmental performance at the power plant global level. A more in-depth study is developed, at the power plant components level, through EEvA. The analysis employs existing published data with a realignment of the inventory to the latest data resource and compares the life cycle impacts of three methods (ILCD 2011 Midpoint, ReCiPe 2016 Midpoint-Endpoint, and CML-IA Baseline) for two different scenarios. In scenario 1, any emission abatement system is considered. In scenario 2, re-injection of CO2 and H2S is accounted for. The analysis identifies some major hot spots for the environmental power plant impacts, like acidification, particulate matter formation, ecosystem, and human toxicity, mainly caused by some specific sources. Finally, an exergo-environmental analysis allows indicating the wells as significant contributors of the environmental impact rate associated with the construction, Operation & Maintenance, and end of life stages and the HP condenser as the component with the highest environmental cost rate.

1. Introduction

One of the most critical issues of renewable energy sources (RES) is the environmental impact of the construction and end-of-life of a power plant. RES usually involves a much higher relevance of these lifecycle phases concerning the use of fossil fuels, while the impact during operation is smaller because of reduced consumption of natural resources. In the case of geothermal energy, the environmental effects of the operational phase may play a significant role and depend strongly on the conditions of the geothermal field. The current efforts are directed to implement solutions for issues such as emissions of carbon dioxide, hydrogen sulphide, and other contaminants. The current analyses typically examine a broad spectrum of environmental effects [1] with a particular focus on global warming potential [2].
A quantitative evaluation of the environmental costs through Life Cycle Analysis (LCA) allows renewable energy technologies to be compared among themselves and with traditional forms of power generation [3,4]. LCA is gaining attention also for the evaluation of geothermal power plants [5,6], with a specific focus on organic Rankine cycle (ORC) [7] or enhanced geothermal systems (EGS) [8,9]. Currently, methodological guidelines for geothermal LCA studies are being developed in the frame of the GEOENVI EU H2020 Project [10,11]. At present, the guidelines are referring to the midpoint LCA level of assessment, which is the minimum required by the LCA standards [12,13]. Normalization and weighting [14,15], in some methods passing through an endpoint (or damage) evaluation, allow eventually to evaluate a single score sustainability index (commonly referred to in terms of eco-points, EP). This step is not included in the mandatory part of an LCA is highly appreciated at the level of general evaluation, decision-making, and social perception of sustainability.
For a more comprehensive evaluation, the global results of an LCA can be extended to the exergo-environmental analysis (EEvA), which combines exergy and environmental analysis employing the principles of exergo-economic analysis [16]. The EEvA allow showing the impact of the environmental variables on the efficiency of the considered system through the thermodynamic concepts and consist of three steps: detailed exergy analysis of the considered system, allocation of the environmental impact of all powerplant components and analysis of the progressive build-up of the environmental costs along with the processes and final assignment of the environmental score of each system component to the product exergy stream of the component. Using this methodology it is possible to highlight both the contribution of the use of resources (materials, production, service) as well as the effects of irreversibility/inefficiencies of the components allowing to pave the way to selective improvement [17]. In several cases [18,19] the EEvA is applied to take for granted the reliability of the LCA model, without a preliminary benchmarking of the different impact assessment (IA) methodologies. Such an approach may be misleading when analysing RES powered energy systems as in these cases, the environmental cost of input fuel is 0 and the investment cost (LCA impact) is present. Therefore, a sensitivity analysis employing benchmarking of the different LCIA methods may be of great importance.
This study aims to analyse the life cycle environmental impact produced by the Hellisheiði geothermal power plant. Firstly, the study compares the impacts of the Hellisheiði power plant with two scenarios of air emission abatement system and using three methods of the life cycle impacts, that is, ILCD 2011 Midpoint, ReCiPe 2016 Midpoint-Endpoint and CML-IA baseline using updated inventory data. Finally, the process of energy production in the Hellisheiði geothermal power plan is also comprehensively analysed through EEvA concept to understand which mechanical component of the power plant has the most considerable impact and which can be improved to increase the environmental performance of the entire powerplant.

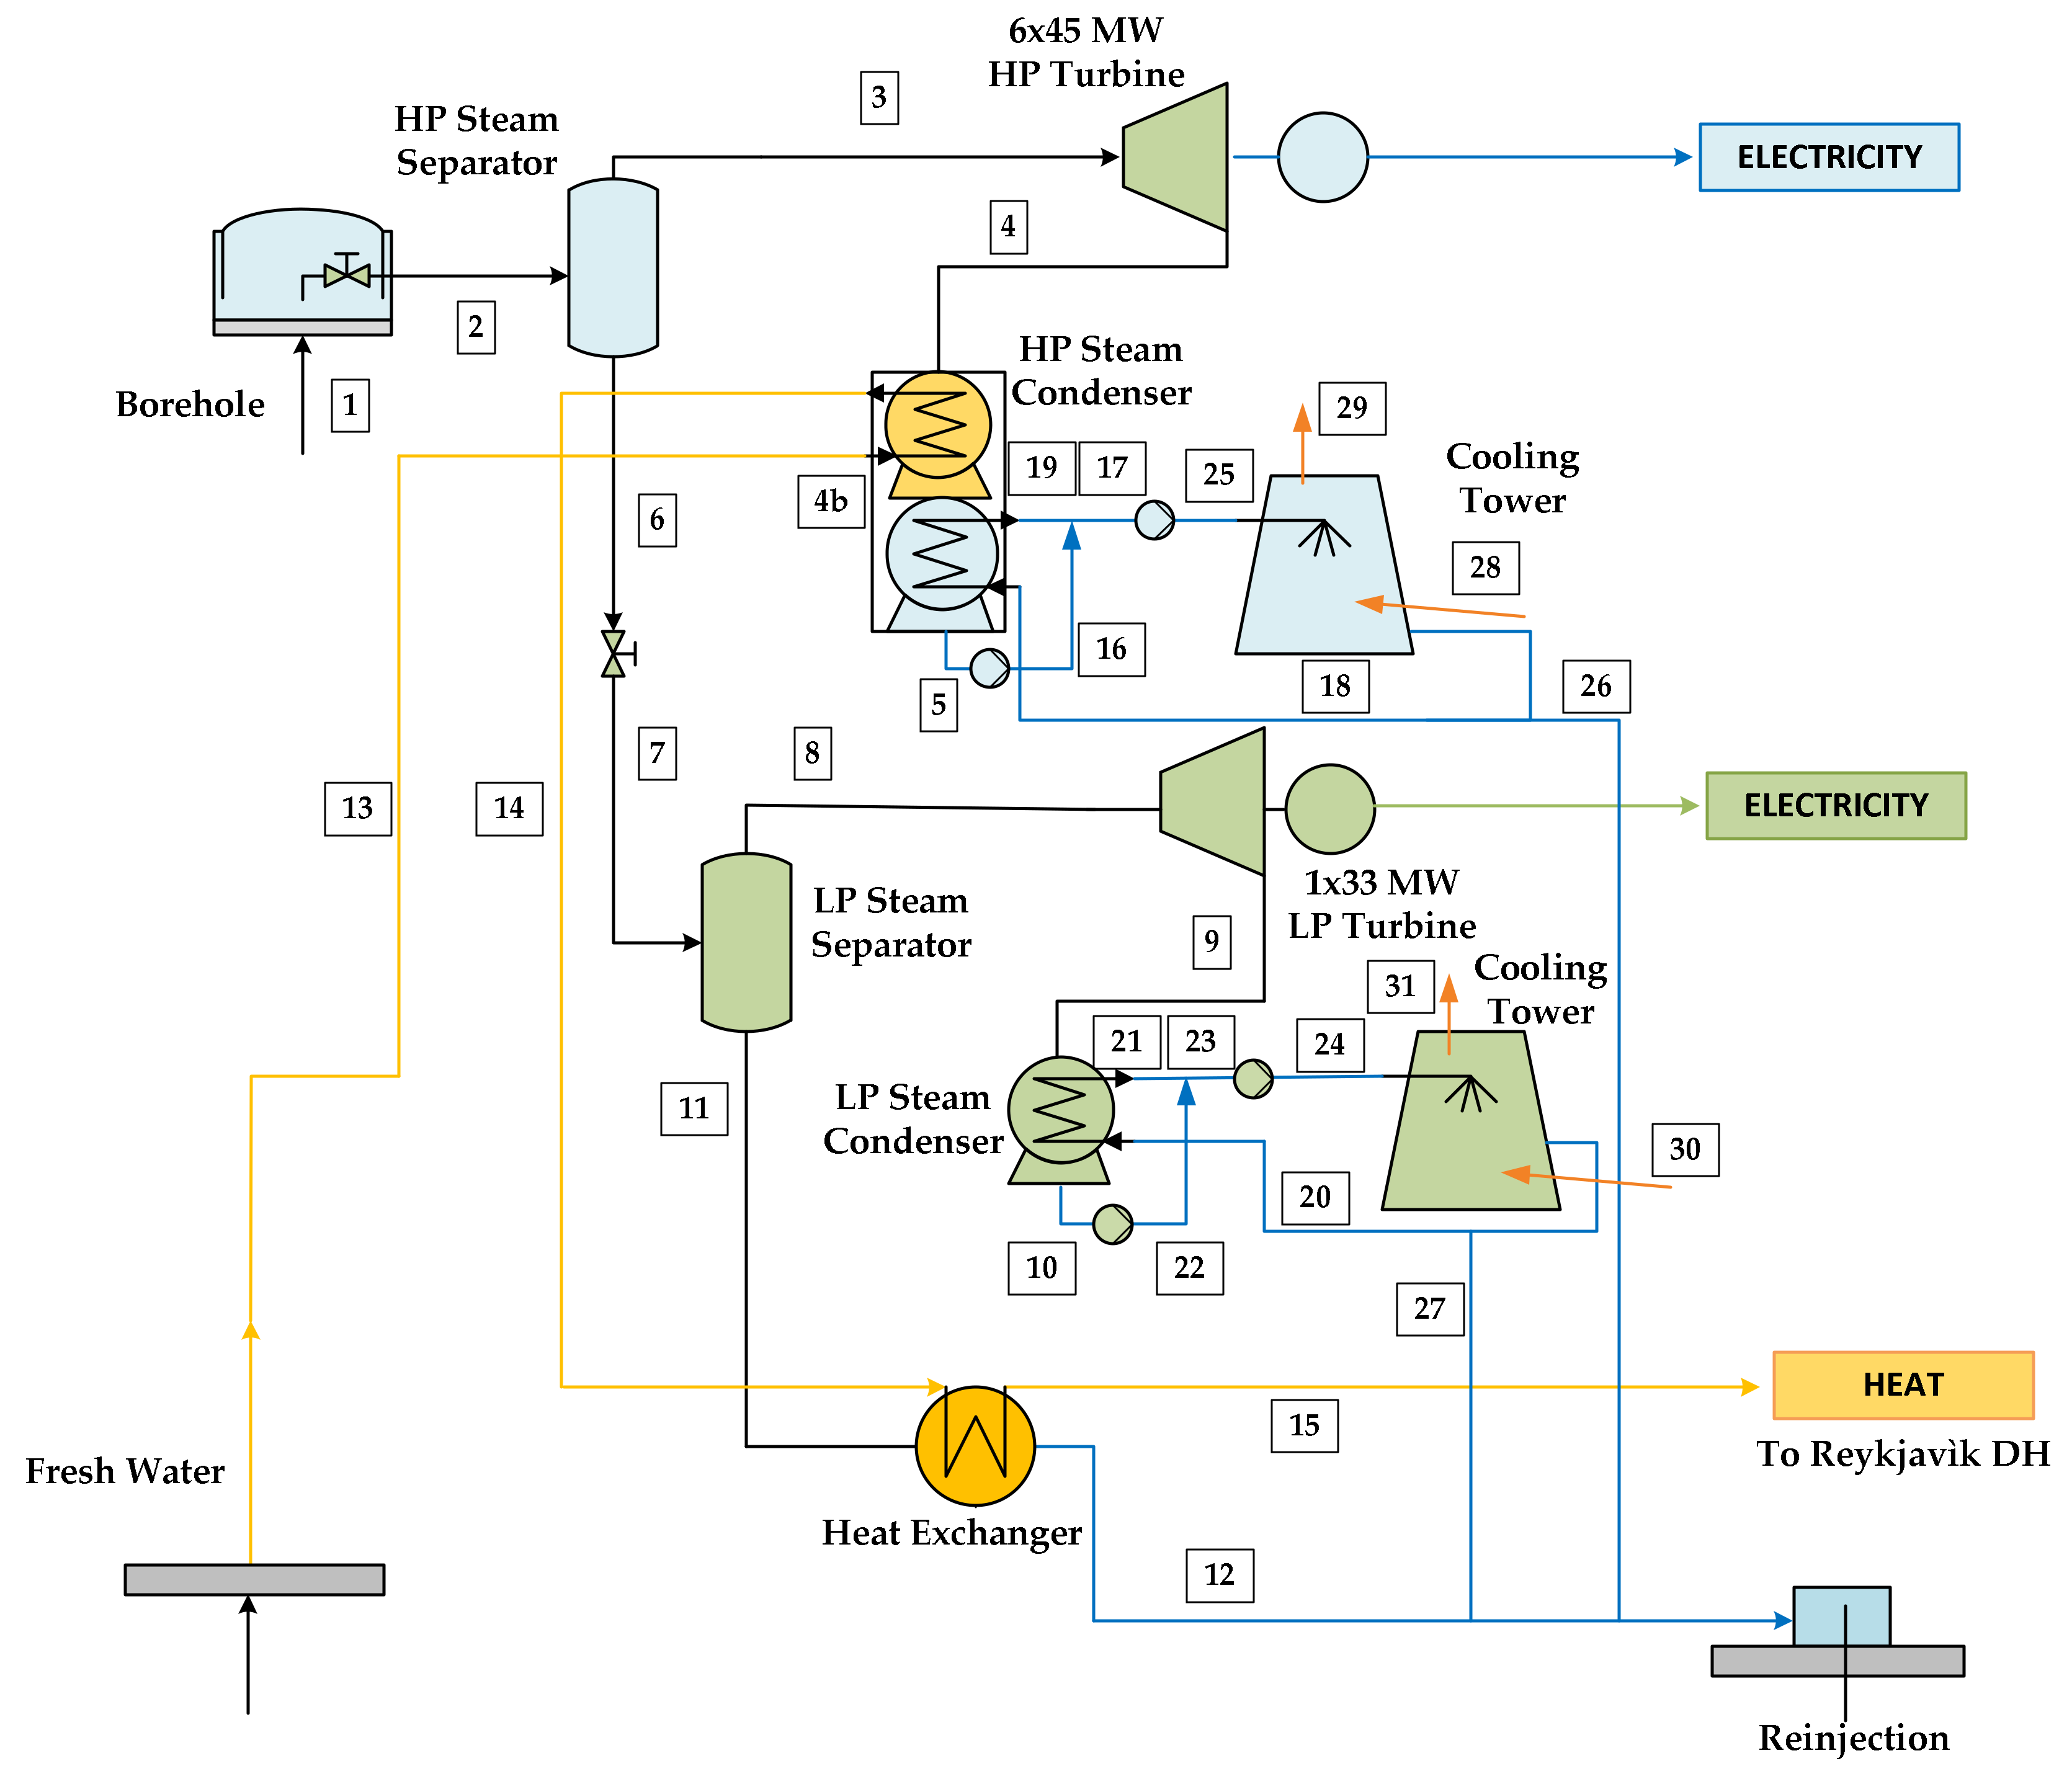
2. Description of the Reference Case

The reference LCA case study is the Hellisheiði plant in Iceland, based on previously published LCI data [5,6]. The inventories were updated to the Ecoinvent 3.6 database [20].
The geothermal plant of Hellisheiði is a double-flash unit [21,22] that allows the production of electricity (303 MWe) and hot water (133 MWt). One of the main issues of geothermal power plants is the emissions of both carbon dioxide (CO2) and hydrogen sulphide (H2S). The present study takes into account two scenarios: a baseline (scenario 1) [5] and an upgraded (scenario 2) [23], which includes carbon sequestration and acid gas removal (CARBFIX Project).
Furthermore, a relevant activity that plays a significant contribution to the environmental sustainability of a geothermal energy system is the wells drilling process. In the case of Hellisheiði, the reference layout (scenario 1) is based on a set of 64 wells for the operation of the plant with depths in the range of 2000–3000 m; both vertical and directional wells have been realized.
About every two years, the drilling of a new well is necessary to maintain the production of electrical/thermal energy constant. In 2016 it was decided that electrical drill rigs should be used for the realization of maintenance wells, so in scenario 1 all maintenance wells were evaluated considering diesel consumption while in scenario 2 a progressive substitution of the diesel to the electrical drilling is taken into account. Figure 1 presents a simplified schematic of the assessed geothermal power plant. The two-phase flow from the geothermal wells is separated into steam and water at 10 bar pressure in the primary separator. Steam is directed to steam turbines and then to the condenser, which further exploits the remaining heat for pre-heating the freshwater for heat generation. The separated water is flashed again and separated in steam (for the low-pressure power circuit) and water.
The brine separated by the low-pressure steam separator heats the pre-heated water in high-pressure side condenser to the temperature required for the district heating system—typically about 90 °C.
The following steps define the energy production process (Figure 1):
  • Withdrawal of the geothermal fluid through the wells;
  • Separation of the vapour phase and the liquid phase;
  • Transport and heating of cold water (heat transfer fluid for cogeneration);
  • Production of electricity;
  • Connection to the national electricity grid and the Reykjavík district for heating.

3. Life Cycle Analysis

3.1. Life Cycle Assessment
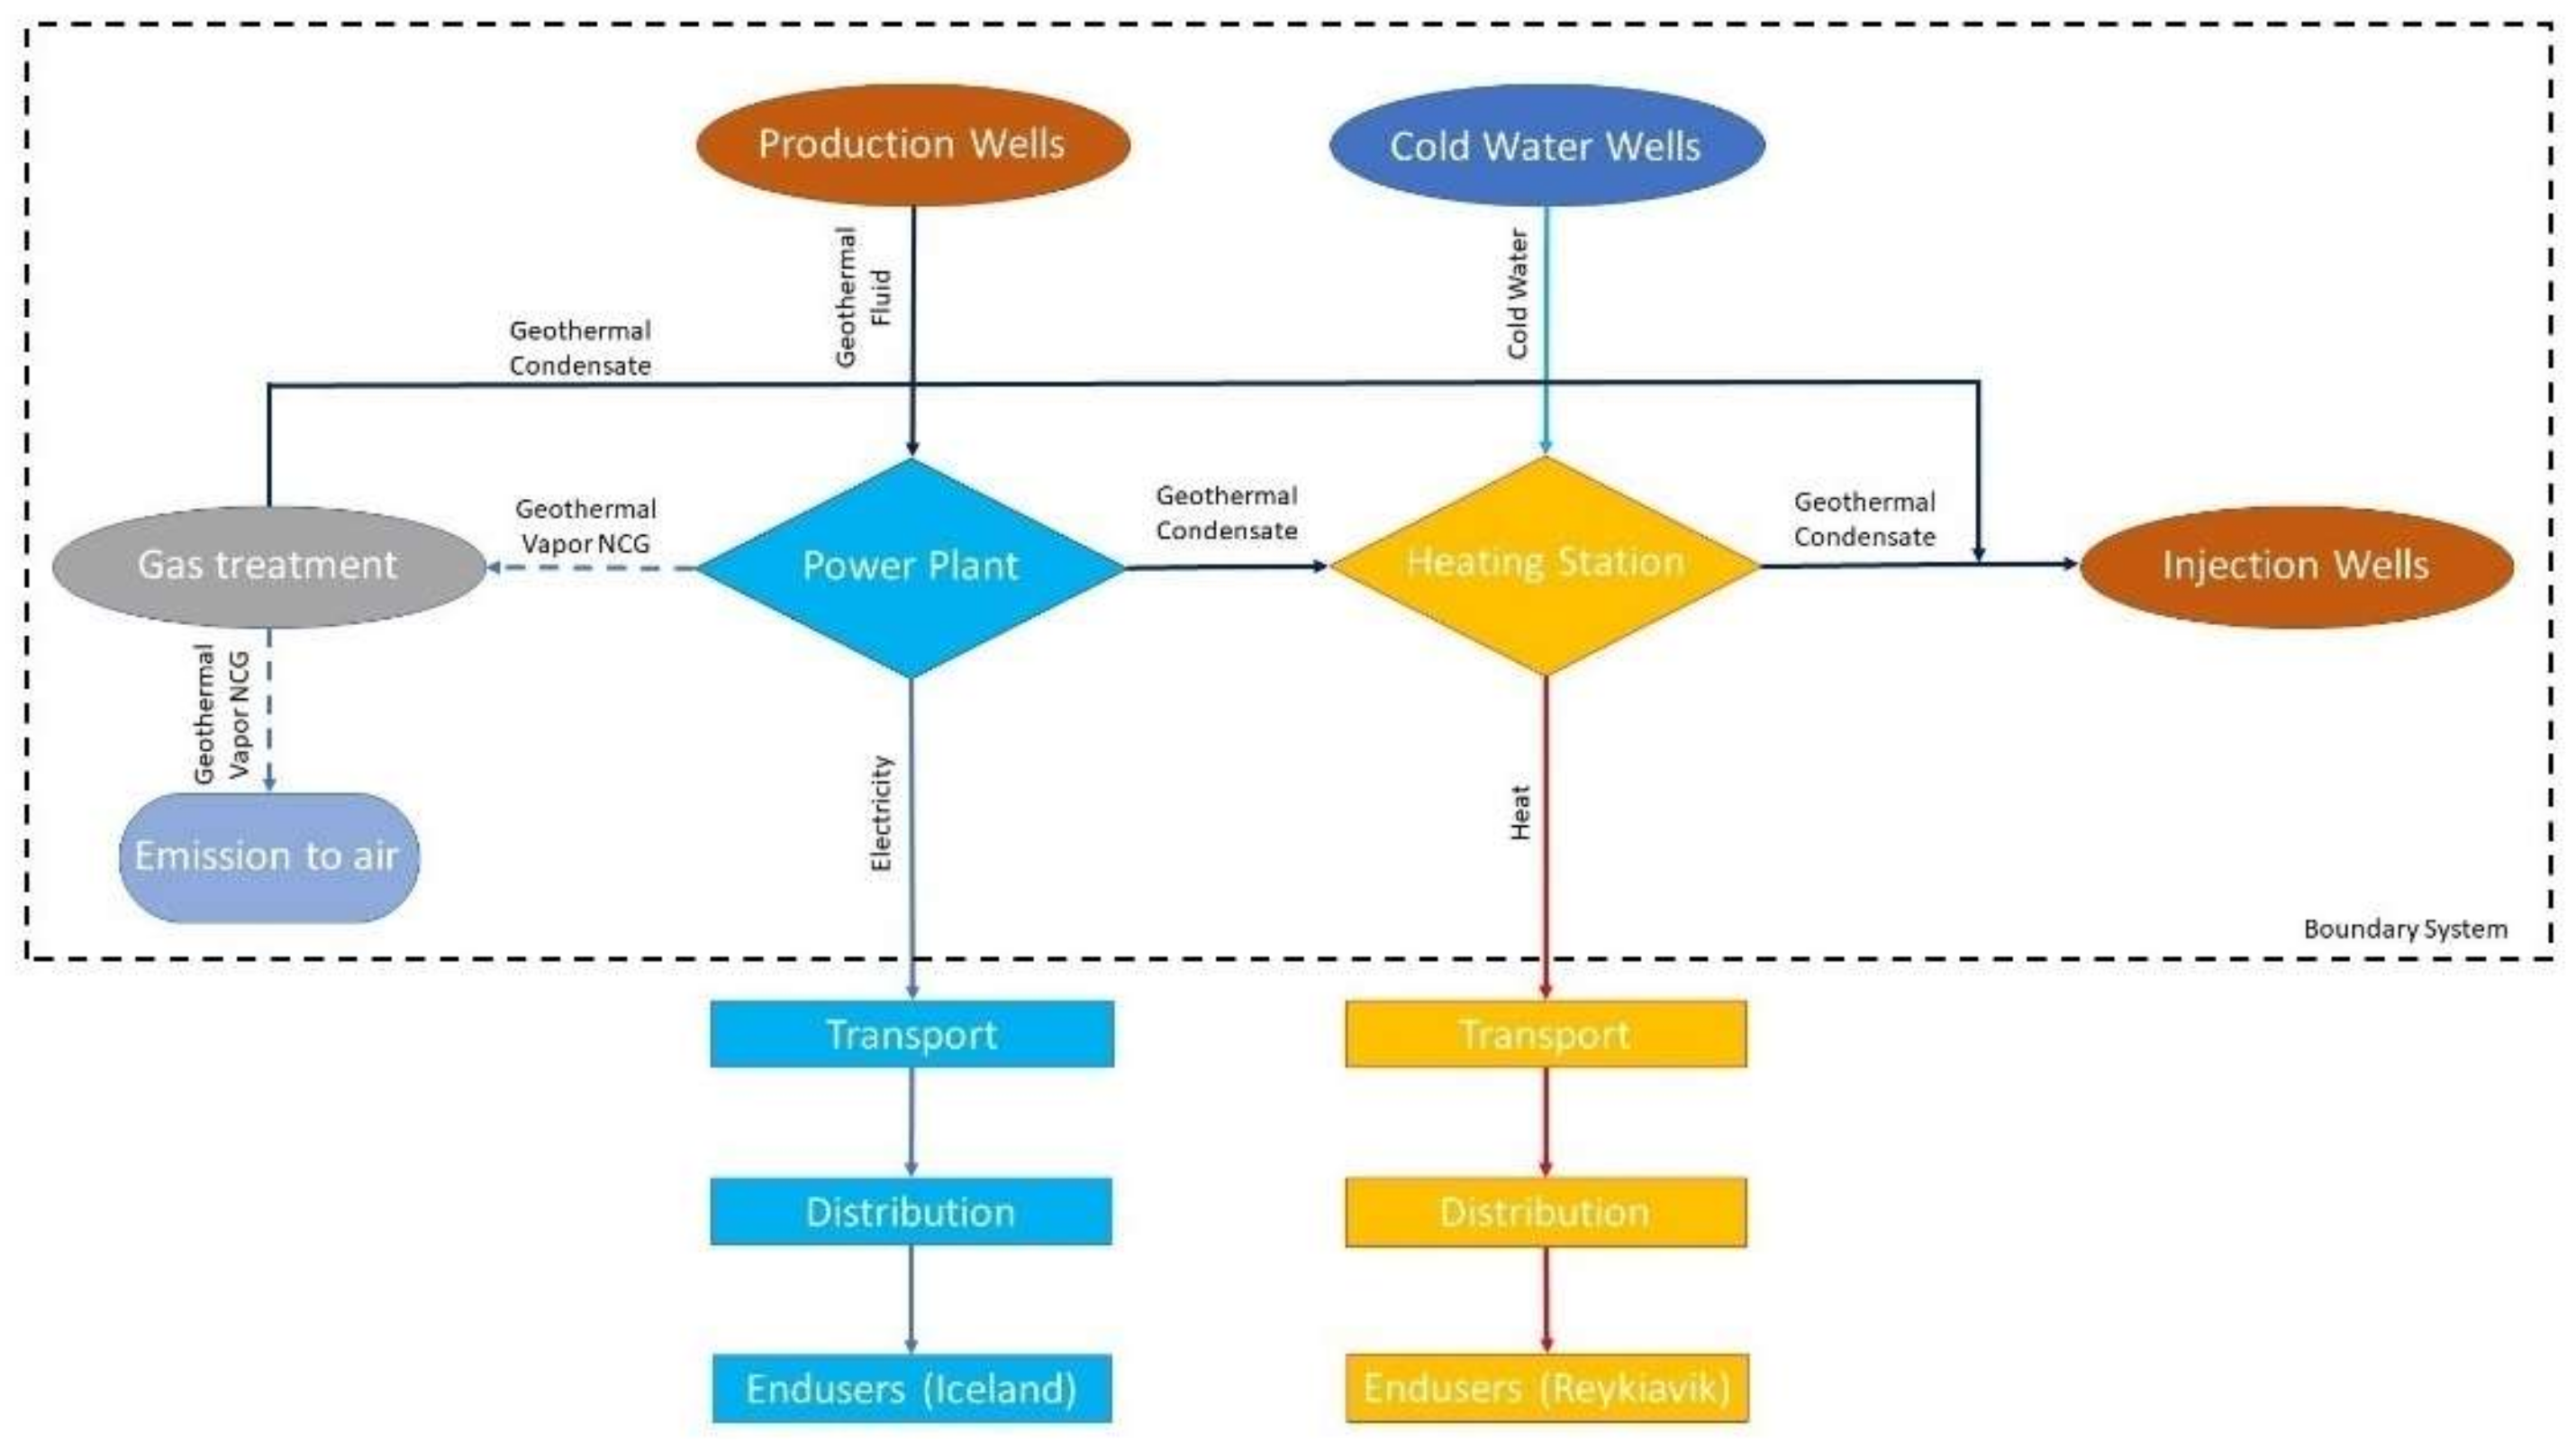
The present LCA study follows the framework, principles, requirements, and guidelines given by the International Organization for Standardization as described in ISO 14040:2006 and ISO 14044:2006 [12,13]. The following subsections discuss the four phases of, namely the definition of goal and scope, choice of functional units, description of the system, life cycle inventory (LCI) analysis for the scenario n.1 and n.2.

3.2. Goal and Scope

The objective of the present LCA is to study the environmental impacts of Hellisheiði double flash cogeneration geothermal power plant comparing two scenarios that use technologies for the removal of pollutants formed to produce energy from a high-temperature geothermal resource. From the results of the LCA, it is possible to investigate the contribution of irreversibility to the different phases of the life cycle, highlighting the environmental impacts of the technologies used and underlining the critical points of the plant. The study investigates the effects of operational improvements built on the Hellisheiði cogeneration plant from the year of construction to 2020 through three LCA methodologies. The study examines two series of LCI: (1) Scenario 1: The baseline case inventory representing 2012 operational conditions as published in [5,6] and (2) Scenario 2: an updated inventory representing the operational conditions of 2020 including operational improvements implemented through the reduction of CO2 and H2S emissions into the atmosphere [23]. The whole LCA was developed as a component-based approach, considering the final goal to perform an exergo–environmental analysis which highlights the importance of the irreversibility or inefficiencies of the components.

3.3. Functional Unit and General Setup of the LCA

A flowchart of the Hellisheiði geothermal system is presented in Figure 2. The Hellisheiði geothermal plant has two separate products: electricity and hot water. In this work, the exergy approach was chosen and all processes were allocated to exergy, instead of considering electricity and heat separately. The functional unit is thus 1 MWh of exergy; the lifetime of the plant was set to 30 years of operation (this time is chosen for comparability with other datasets and it is a typical lifetime applied for geothermal plants). The total exergy produced in the powerplant is composed of work and heat exergy contributions. The work output corresponds to the electricity produced by the turbines (a capacity factor = 0.87 was assumed [5]). The heat exergy was calculated taking into account both the quantity of heat produced (the average heat production is 91.44 MWt [5]) and its quality, which depends on the temperature at which it is available. Specifically, the heat exergy was evaluated applying a Carnot factor conversion, based on the log-mean temperature of the primary district heating loop (40–90 °C) and the average annual ambient temperature for Iceland (5 °C).
Heat-exergy is here identified with ExQ and can be expressed as follows:
Ex Q = θ · Q   and   θ = 1 T o T Q ,
where θ (Carnot factor or exergetic temperature, accounting for the value of heat) and TQ and T0 denote the thermal product and reference environment temperatures (considered here as the average yearly ambient temperature for Reijkjavik 5 °C), respectively. TQ is the entropy-average temperature of the heat produced by the CHP unit, calculated as:
T Q = Q Δ S   and   T Q = T D T R log T D T R ,
where Δ S is the overall entropy variation of the heat interaction (from delivery to return in the case of a district heating system). In the specific case of distributing a single-phase heat transfer fluid, TQ can be evaluated as a log-mean temperature.
The boundaries of the two case studies are defined following the detailed description of the system and the construction of the flow diagram of the production cycle. All the relevant flows were considered from a typical LCA “cradle to grave” perspective [24]. Both upstream (raw material extraction, manufacturing, wells, and geothermal power plant construction), operation (power generation, operation, and maintenance), and downstream (decommissioning and end of life scenarios) processes were considered. The exploration phase, before construction, was not included because of a lack of data (most of these activities were at the origins of geothermal energy exploration in Iceland). Transport of materials (or mechanical components) to the site and energy supply systems were not taken into account.
The Life Cycle Inventory (LCI) was developed using both primary and secondary data. Primary data (input and output flows) for the main processes in the foreground system referring to the power plant construction and operation, that is, input materials flow at the construction of the wells, structures, machinery, and pipelines as well as those used in operation and maintenance phases and transportation stages were gathered from the various scientific publications relating to this plant [5,6,23,25,26]. Similarly, data regarding the energy consumption that is: consumption of diesel for wells drilling, internal use of electricity at the site and for drilling wells, and the composition of geothermal fluid represent primary data. Secondary data such as inventory for electricity or construction material production were retrieved from the Ecoinvent database version 3.6. For consistency, average EU mixes regarding materials and other resources were considered. In Figure 3 the considered life cycle phases are specified. The construction process considers heating station building, power plant building, geothermal wells, collection pipelines, and machinery. The maintenance process considers the need for an additional structure such as wells and pipelines to sustain production during the plant’s lifetime. Also, the mass flow of elements used in the cooling tower maintenance is considered. The operation process considers the use of geothermal fluid, gas emission to air, and the additional use of electricity used for the cold water pump in the heating station building.

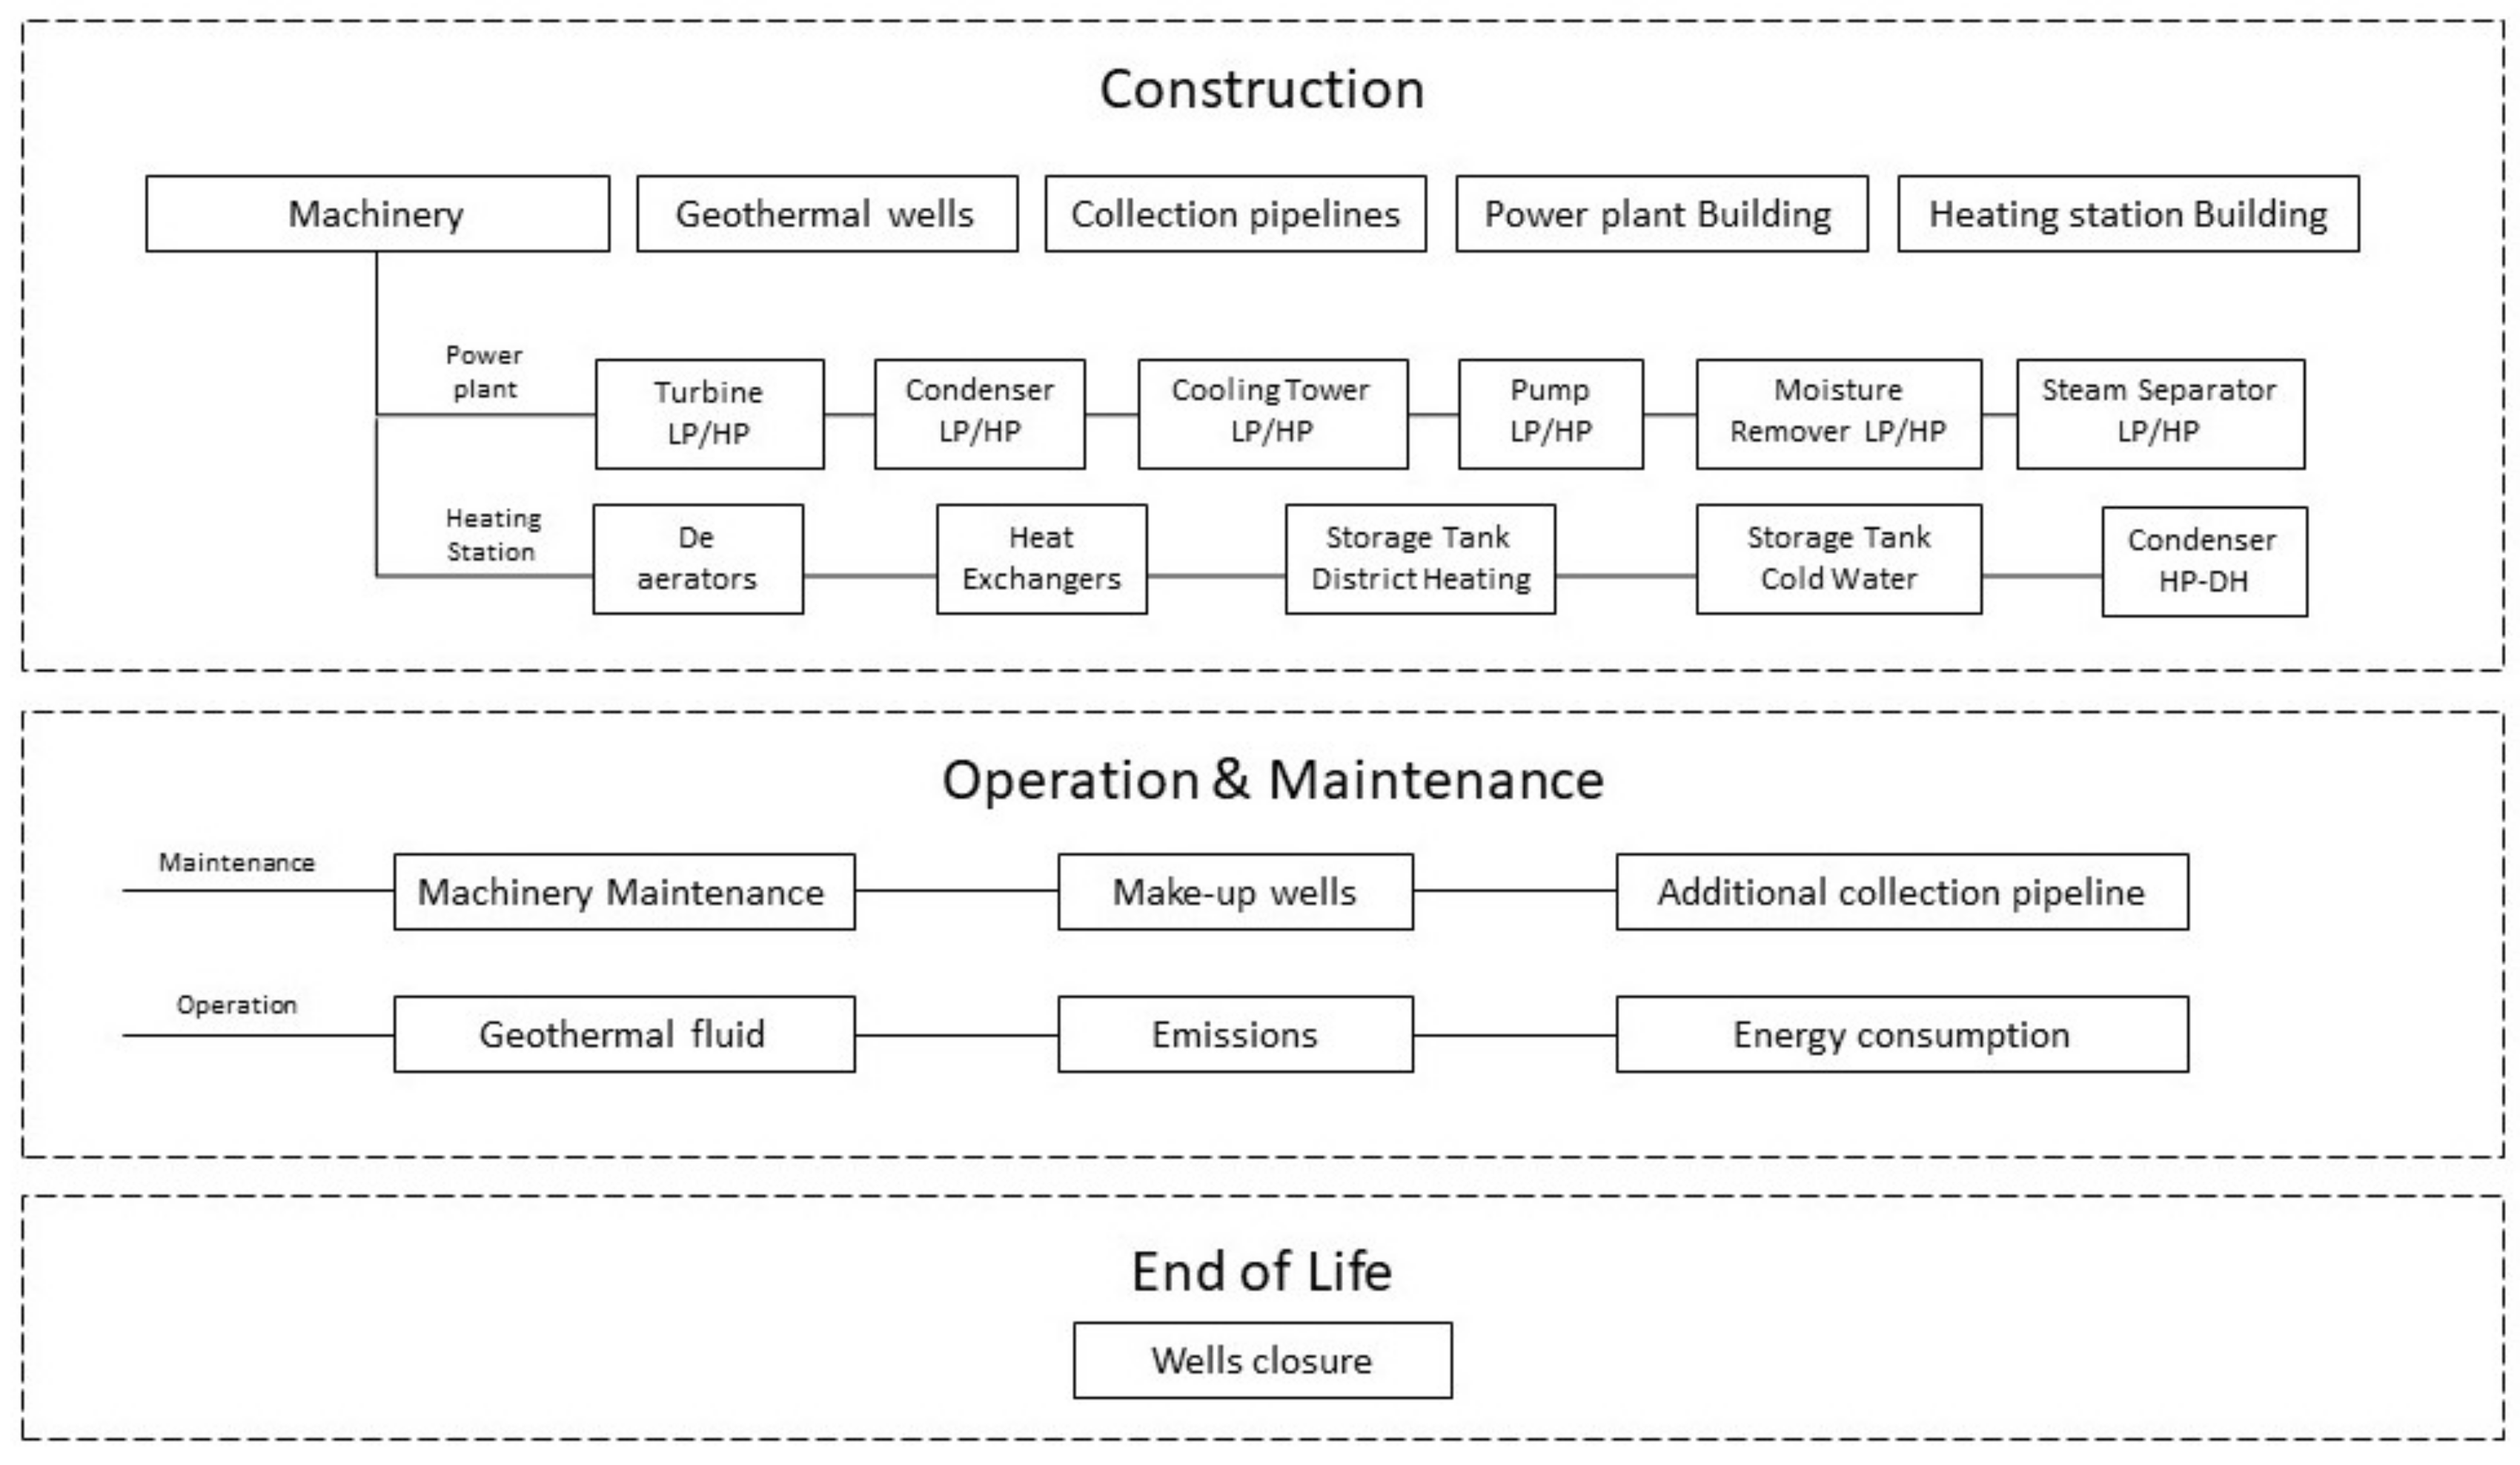
3.4. Life Cycle Inventory

The first step of the LCA is the inventory analysis. This involves not only data gathering but also the construction of a model able to represent as faithfully as possible the actual production process.
The compilation of the inventory was based on previously published works [5,6,23]. To perform an EEvA, the LCI of the entire power plant must be available at a detailed component level. The original LCI [5] reports the total materials for the whole plant: it is then necessary to disaggregate the entire power plant inventory into the specific components, identifying which materials belong to one or another and their respective quantities. In this study, this was carried out through the utilization of data gathered from detailed LCIs of Italian geothermal power plants of similar (flash) technology [4,24], applying suitable scaling factors. As an example, the disaggregated inventory for the construction phase of the Low- and High-Pressure Cooling Towers is reported in Table 1.

3.4.1. Life Cycle Inventory—Scenario 1

For this scenario, all data were taken from [5], imported in OpenLCA 1.10.2 [27], and upgraded to the Ecoinvent 3.6 database.
In 2012, 64 geothermal wells were drilled for the construction of the plant. Of these, 47 are designed for extraction of the geothermal fluid, and 17 are operated for its re-injection. Every two years the drilling of a new well is necessary to keep the production of electrical/thermal energy constant and for reasons of the plant maintenance. All wells for scenario 1 are drilled using diesel generators.

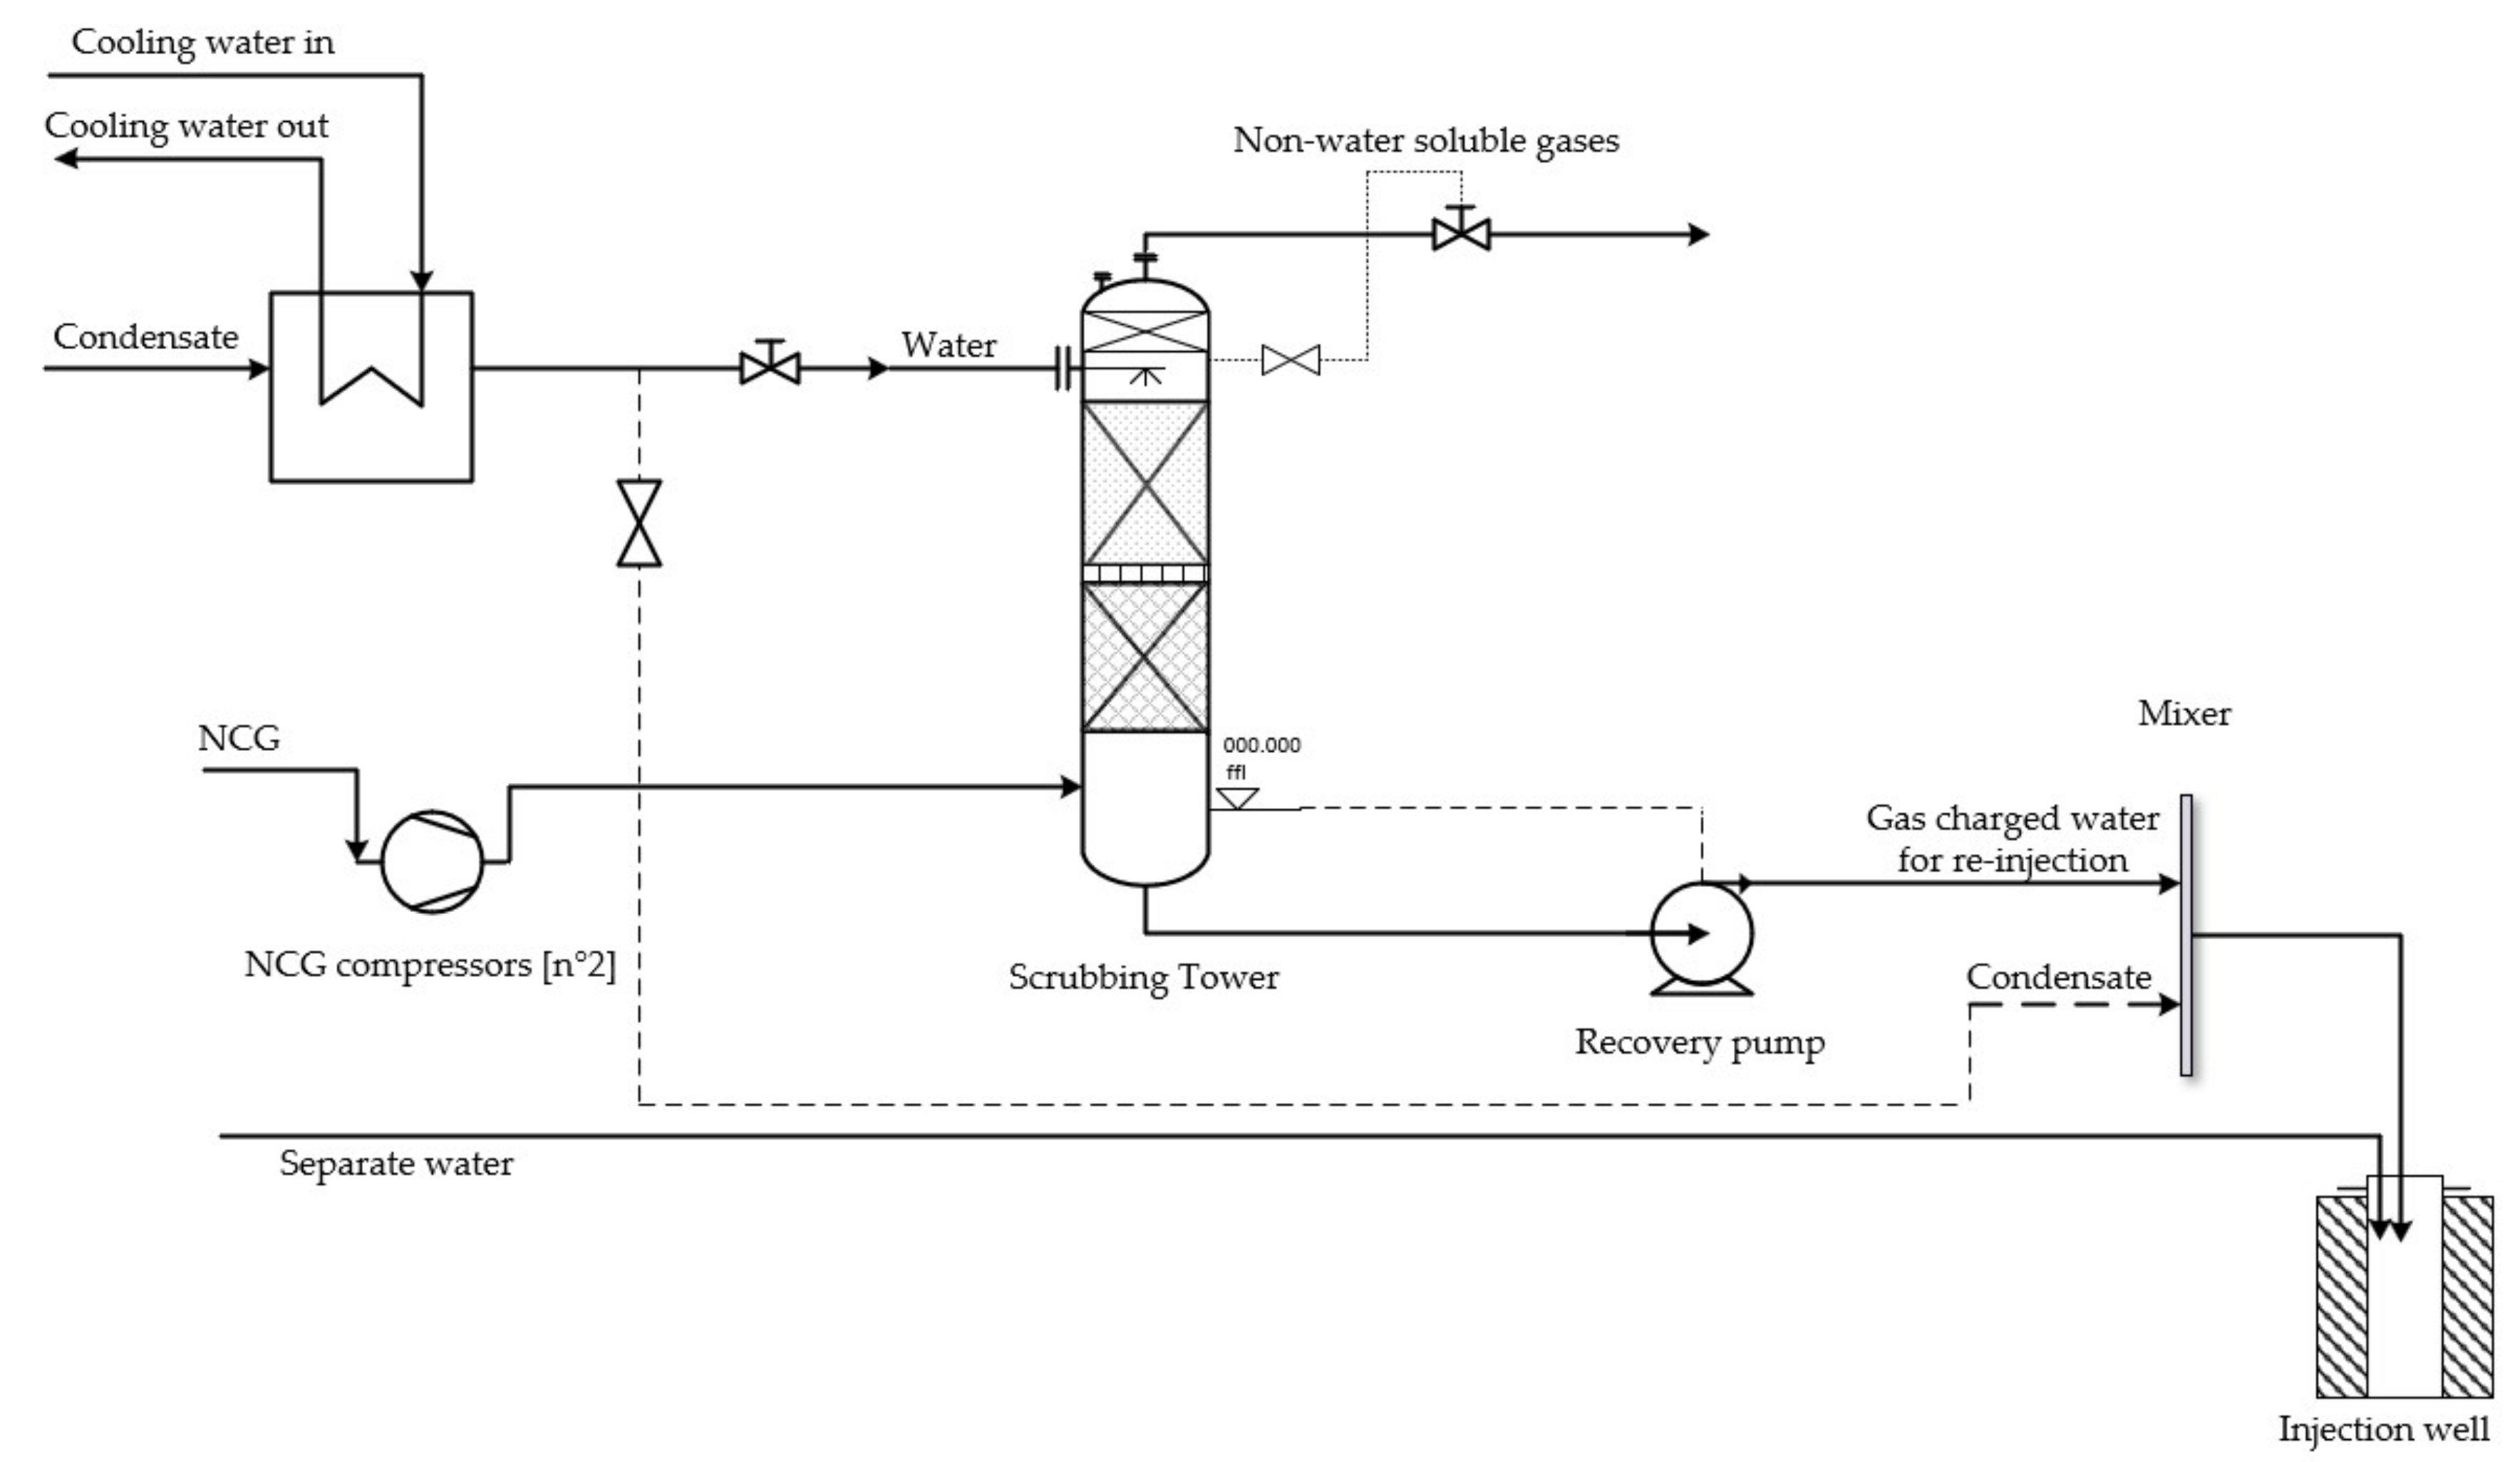
3.4.2. Life Cycle Inventory—Scenario 2

This scenario represents the more recent inventory published in [23], also in this case updated to Ecoinvent 3.6. The main changes with respect to Scenario 1 concern:
  • The introduction of the CarbFix and SulFix gaseous effluent treatment system;
  • The use of electric drilling machines instead of machines that consume diesel for the construction of geothermal wells.
The CarbFix and SulFix gaseous effluent treatment system is based on a vertical cylindrical scrubber that washes the gaseous effluents before releasing them to the atmosphere. Table 2 resumes the equipment utilized in the Carbfix pilot plant.
The atmospheric pressure gas stream (0.336 m3/s) is washed by a flow rate of 36 kg/s of freshwater, taken from the bottom of the column, and sprayed at 6 bar and 20 °C. A relevant fraction of the gases is dissolved in the output water stream directed to reinjection, while the non-water-soluble gases are vented to the atmosphere. Non-Condensable Gases (NCG) gas compressor and Pump recovery data design are reported in Table 3.
A model of the CarbFix process was developed in UniSim Design [28] process software (Figure 4), in order to simulate the capture of emissions.
The simulation aims to represent the CarbFix process in the context of a simplified approach to LCA of this which is important although a minor section of the whole power plant. The main purpose is to simulate how the two gases CO2 and H2S are dissolved in water to be injected back into the well and to evaluate the size and power rating of the main equipment for acid gas processing. The model includes the dependency of solubilities of CO2 and H2S on pressure and temperature. The geothermal gas is pressurized at about 5 bar and the soluble gases are separated from the rest in a water absorption tower. To improve absorption it was necessary to divide the packaging section into two stages. Stage 1 and Stage 2 are the column sections. The full height of the two sections is 12.50 m. The internal packing materials are metal spheres with a diameter between 38 mm (Section 1) and a maximum of 90 mm (Section 2). The total pressure drop is 161.4 mbar. In Section 1 (Stage 1), the temperature inlet is 27.41 °C, while in Section 2 (Stage 2), the temperature outlet is 20.29 °C. The two sections are needed to improve the process’s efficiency and maintain a column capacity factor of 88.50 %. The two stages are simulated with a Sour SRK thermodynamic package for acid gases in water and ASME Steam for pure water.
Table 4 summarizes the results of the process calculation determining the amount of gases in both streams (reinjection and vent) in the operation phase.
The scrubbing tower contains 4.7 m3 of filling material [26]. The gas-charged water is pressurized to 9 bar after absorption and transported through a high-density polyethene pipe (1.5 km length, 279 mm inner diameter) to the injection wells.
It was assumed that, from 2016 to the end of life of the power plant, all new wells in scenario 2 are drilled using electric drilling machines instead of traditional diesel drilling platforms [29]. In the present scenario, the consumption of diesel is thus considered until 2016 and then the use of electricity coming from the Electricity National Mix (Icelandic national grid) is applied for new wells.

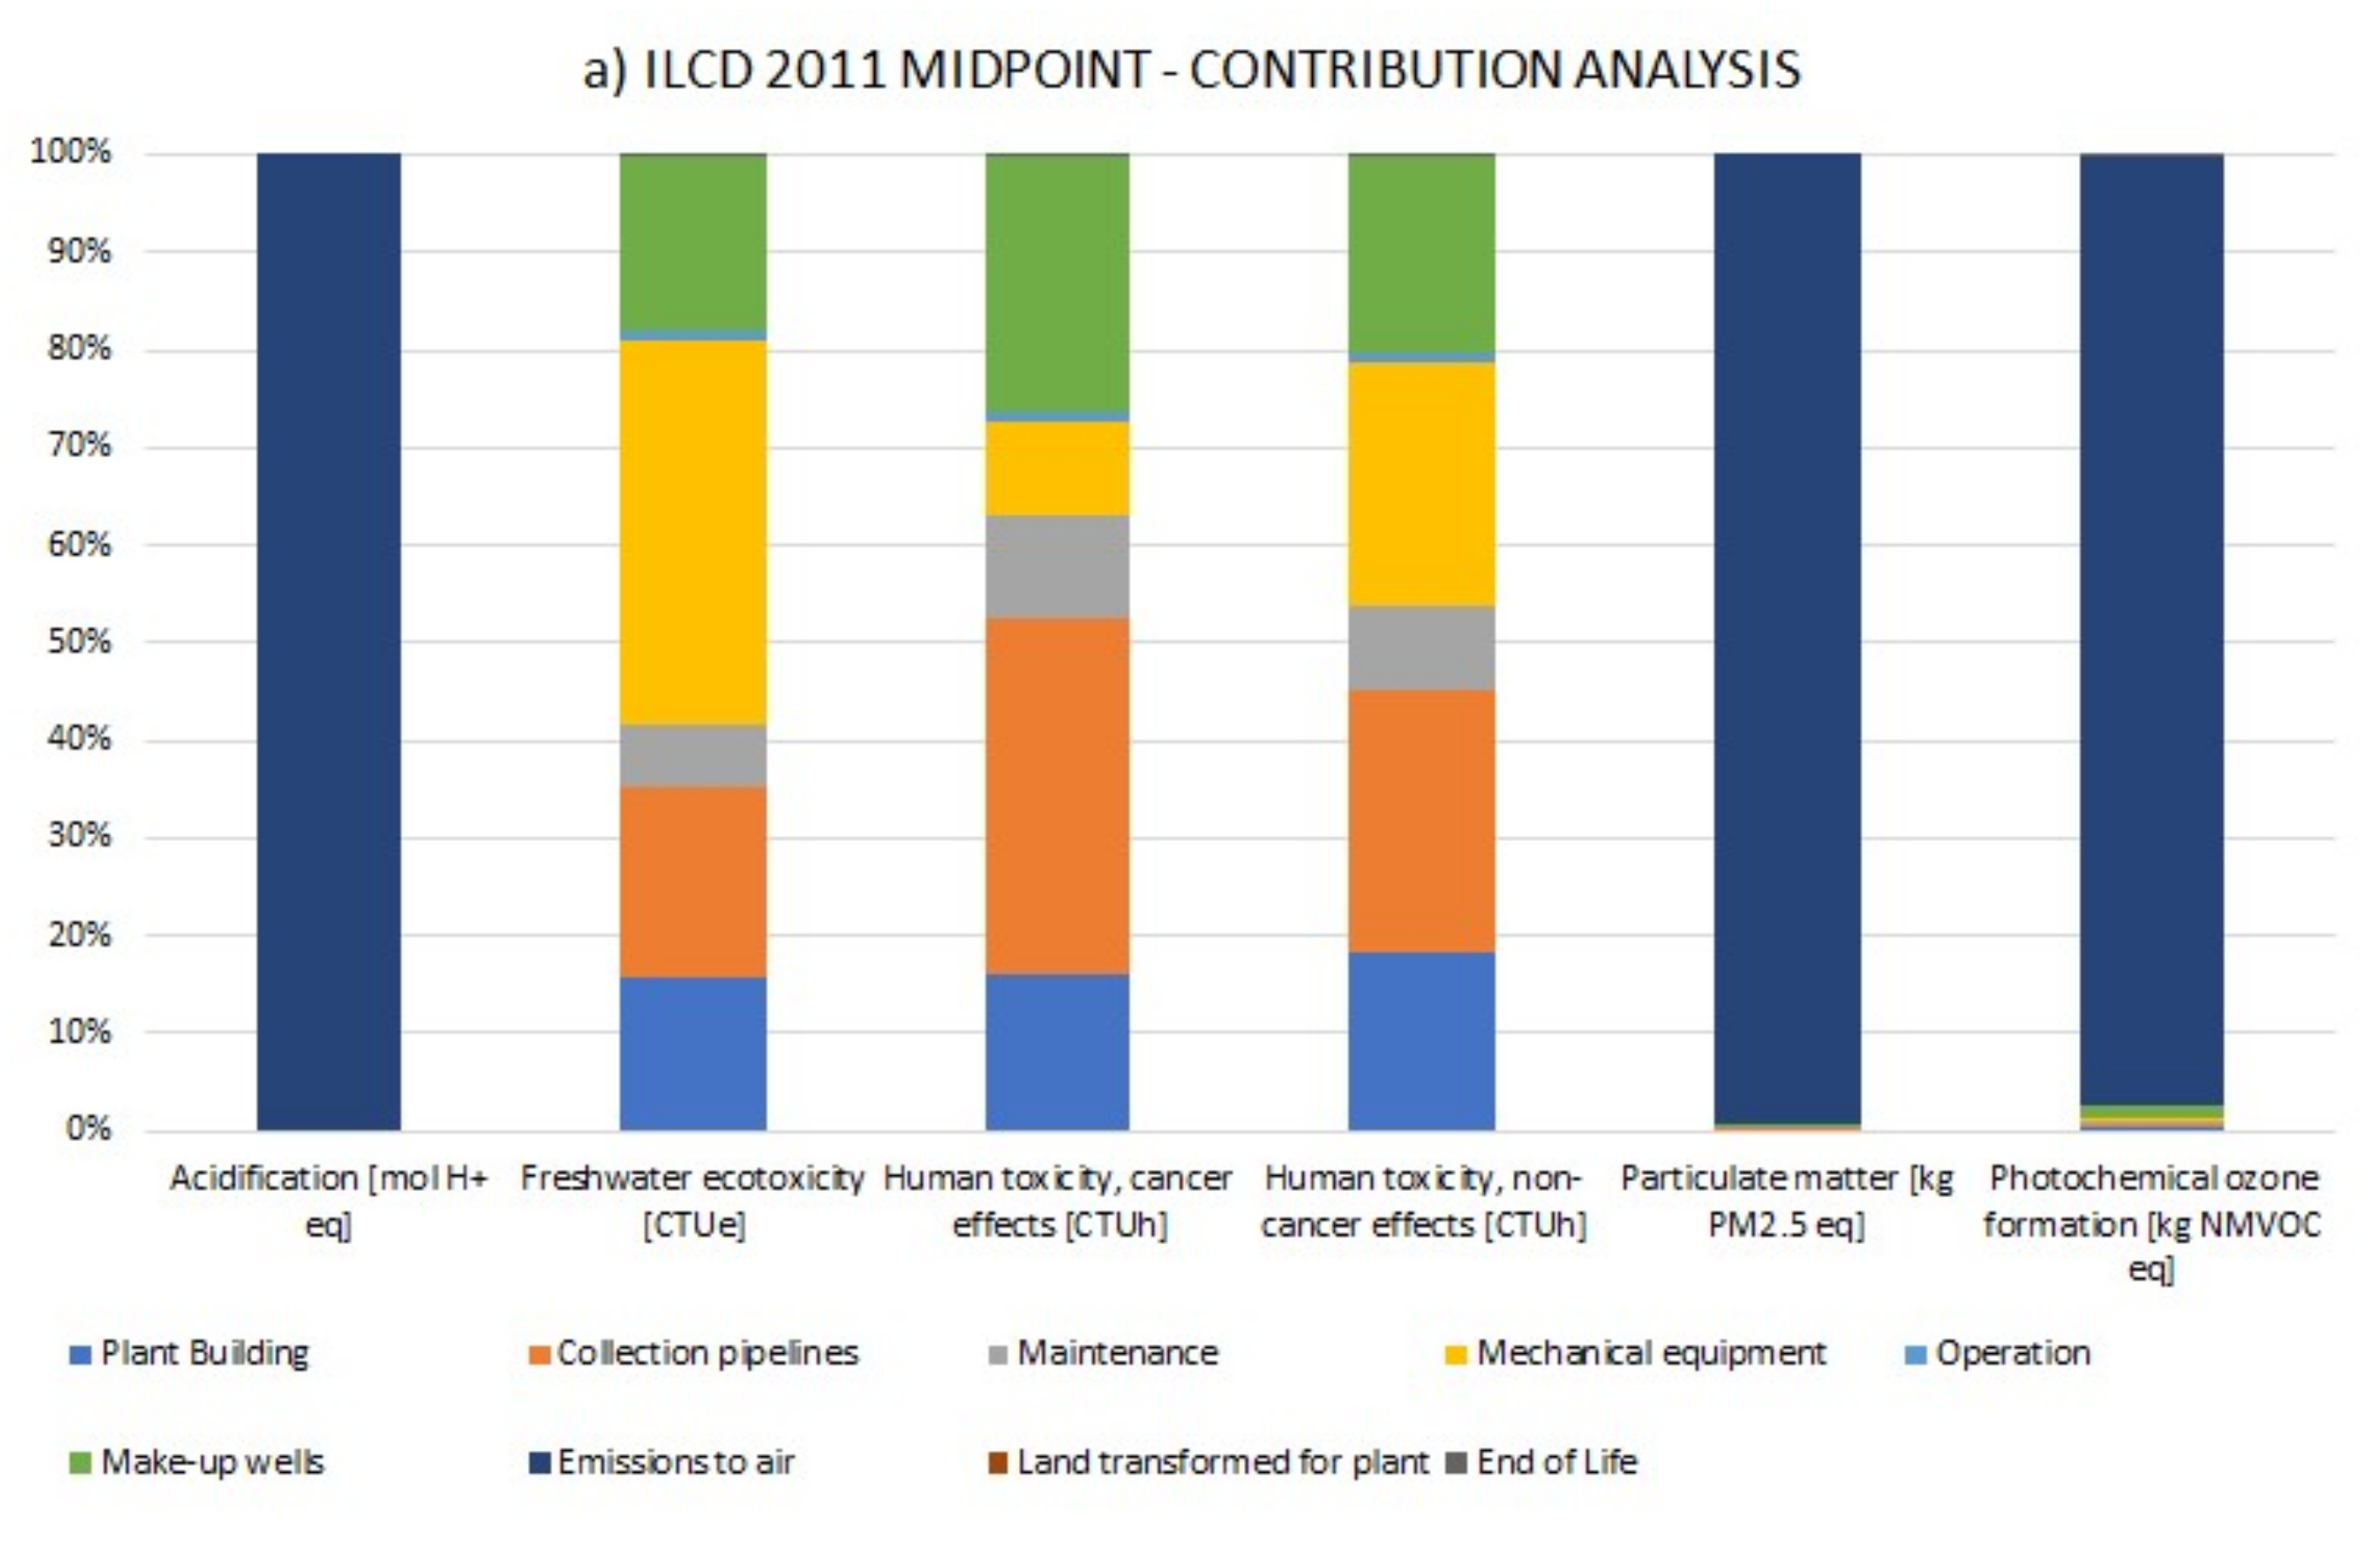
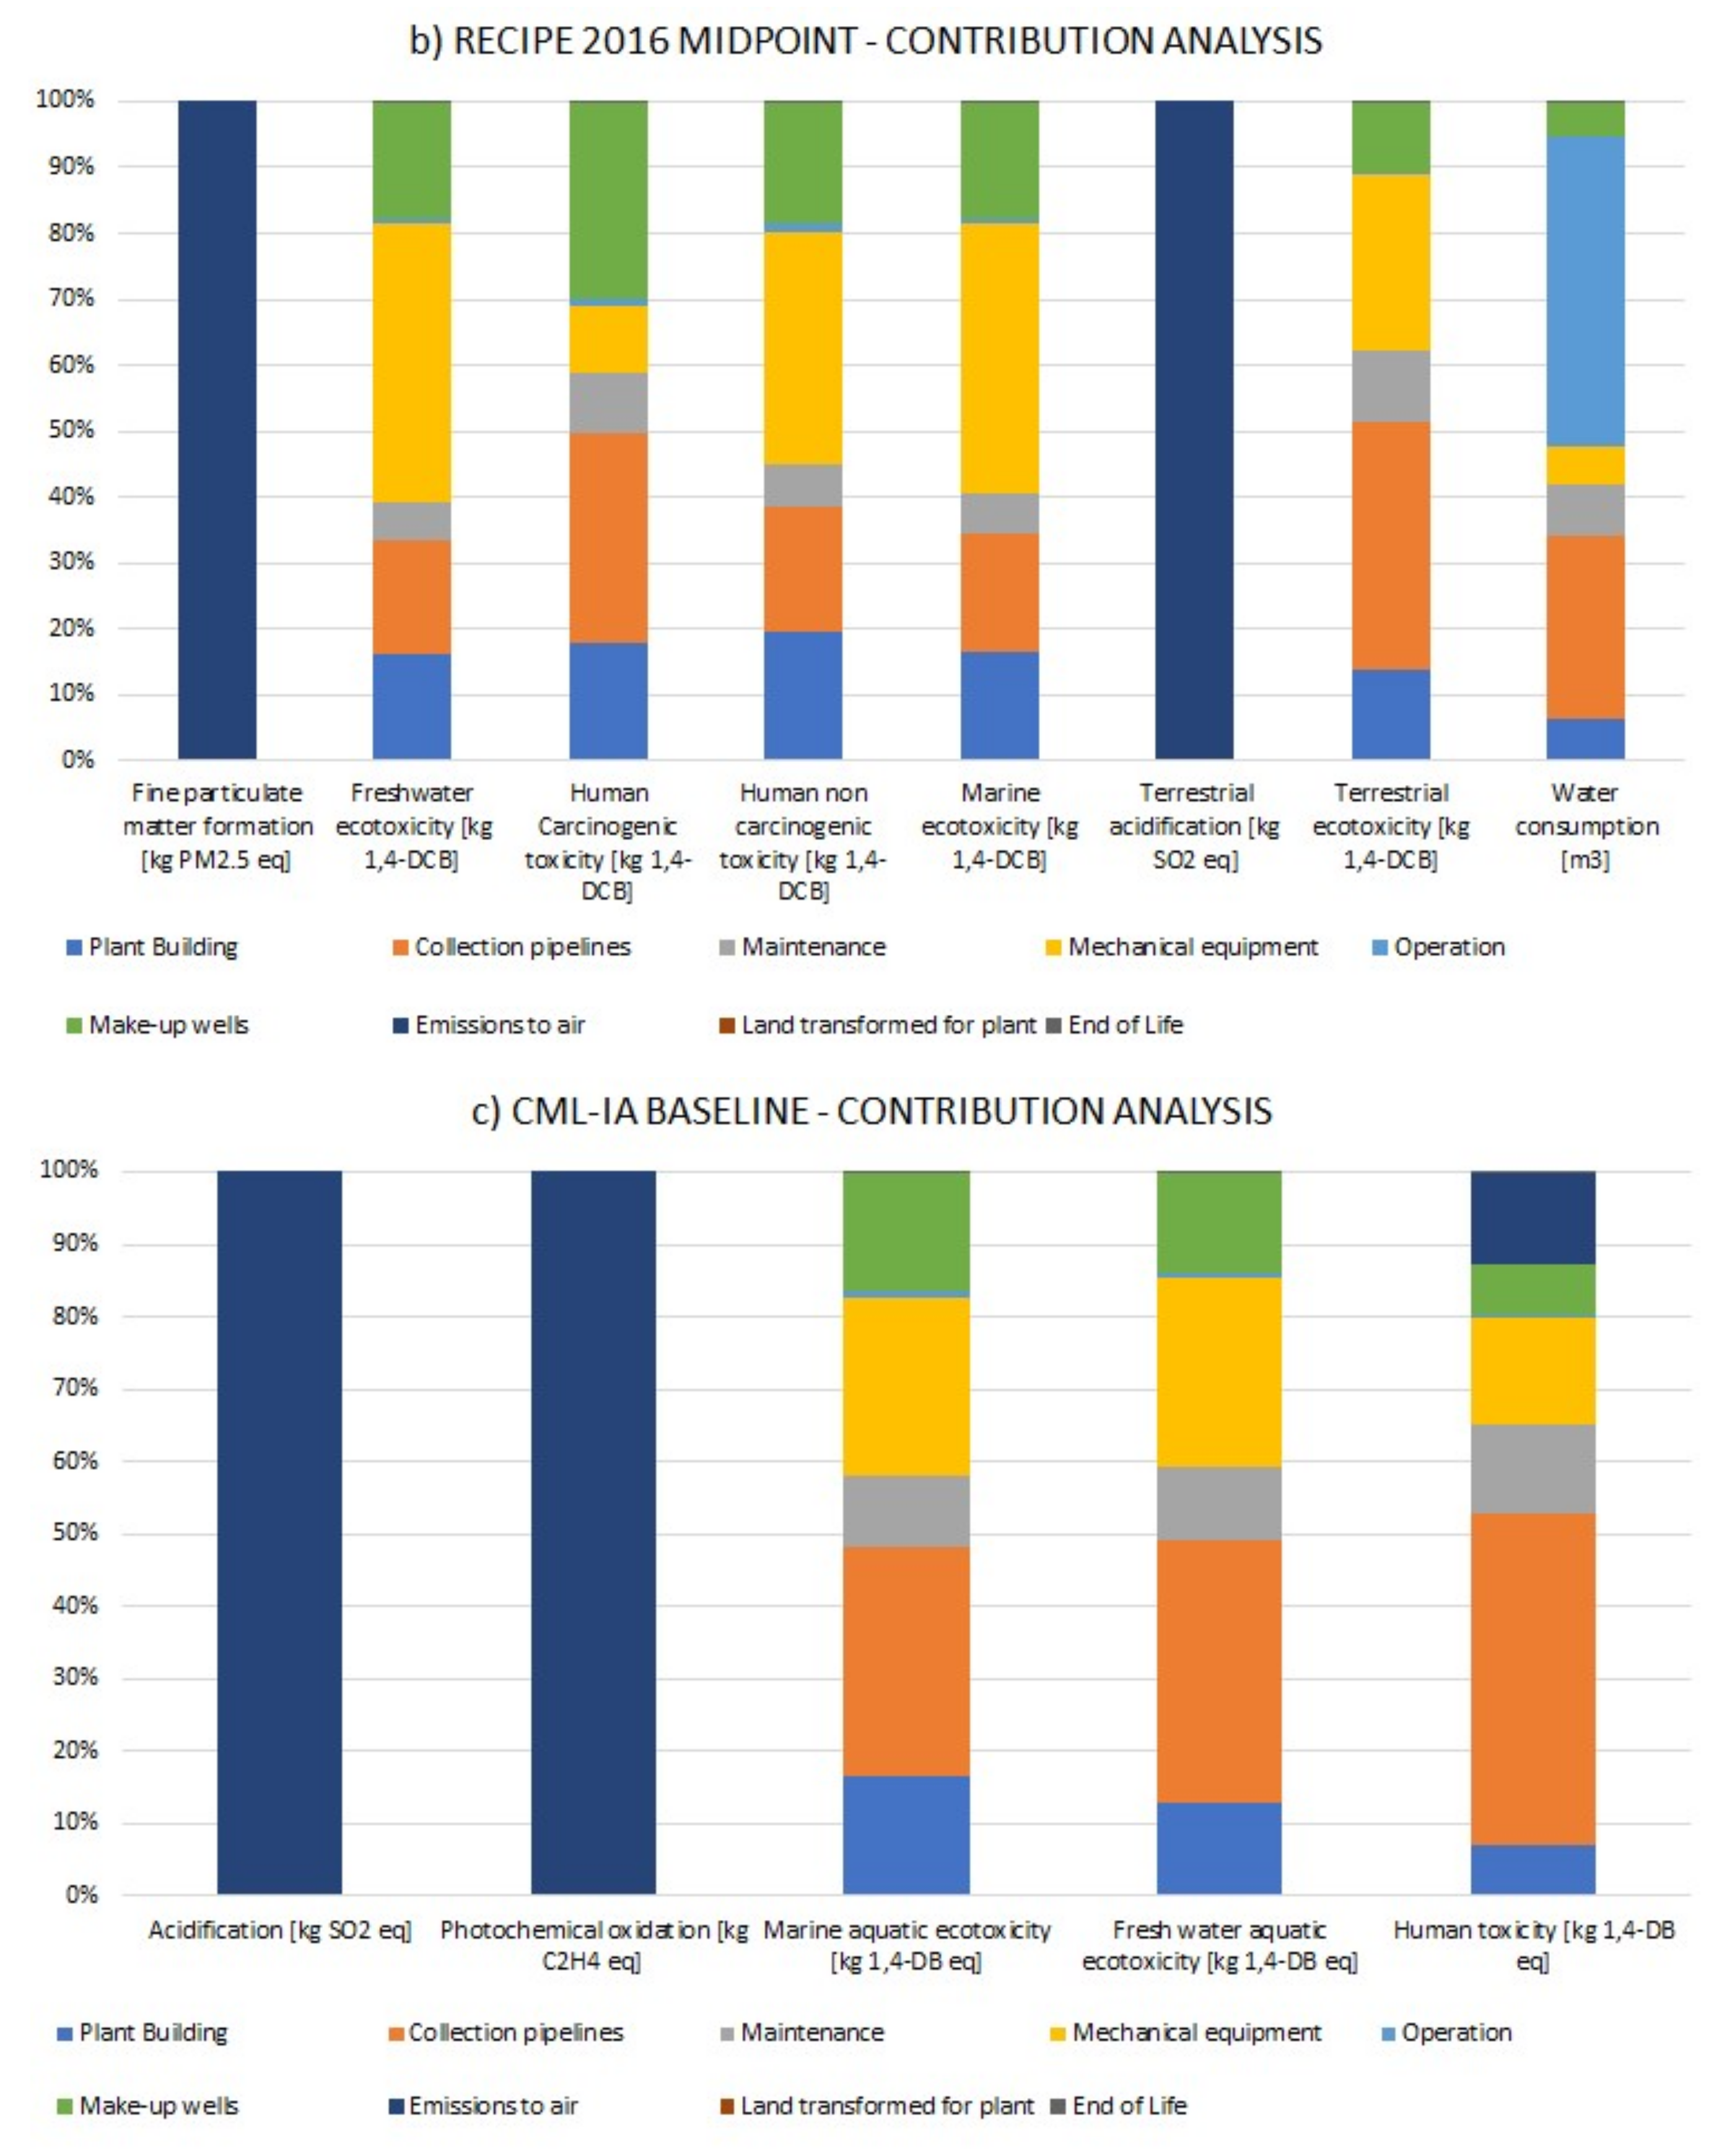
3.5. Life Cycle Impact Assessment (LCIA)—Benchmarking of Methods

As the purpose of this LCA is to proceed with an exergo-environmental analysis, the non-mandatory LCA steps of normalization and weighting are necessary to build a single score indicator. For such cases, it is recommended to apply a benchmarking among different Impact Assessment methodologies, in order to be sure that the major categories are equally represented and augment the reliability of the single score evaluation. In the present case, three accepted LCIA methods were proposed to quantify the single score environmental impact of each component of the system: ReCiPe 2016 (H) (hierarchist perspective impact assessment with normalization and weighting set: Europe ReCiPe H), ILCD 2011 Midpoint+ (EC-JRC Global, equal weighting) and CML-IA baseline (EU25+3, 2000) [30,31,32].
All three methods represent a different situation due to several reasons, for instance, each one has different impact categories that express the same environmental impact; or in some cases, the methods have equivalent categories with different impact and characterization factors. The results express, in general, a situation in line with high-priority impact categories for a geothermal system. With specific reference to acid gas emissions, following a conservative approach of previous LCA studies [6,33], the CML-IA non-baseline approach was applied in all cases, assuming that all H2S is converted in SO2 with a 1.88 conversion factor (corresponding to complete oxidation of H2S). However, it should be recalled that modern methods [32,33] do not consider H2S as a substance that generates strong impacts on acidification: consequently, its characterization factor (which has a relevant uncertainty) is not directly considered for specific midpoint categories such as acidification potential. The selected methods highlight that the most impactful categories are Acidification (B confidence level), Human toxicity, and Ecotoxicity (C confidence level). Climate change was also considered a high-priority category. All methods indicate that emissions from the Hellisheiði power plant, when compared to the amount of energy produced, have a minimal impact on the total normalized value. The impact assessment of the Global Warming Potential is about 22 kg CO2/MWh, which is a low value compared to the average of the Icelandic energy mix (43 Kg CO2/MWh; value calculated with ILCD 2011 midpoint using Ecoinvent 3.6).
The three LCIA methods allow identifying relevant categories for the environmental impact of this plant: ILCD and ReCiPe show evidence of impact for Particulate Matter Formation—a category with an intermediate level of priority. ReCiPe also points out the relevant impact in terms of Water Consumption. Finally, ILCD and CML detect impact in two categories—Photochemical Ozone Formation and Photochemical Oxidation, that have a low level of priority [11]. For all categories, contributions lower than 1% were not considered as below the significance level (Table 5, Table 6 and Table 7).
The normalization process applied in Table 5, Table 6 and Table 7 allows highlighting the most relevant categories for the midpoint analysis. In general, emissions to air produce a relevant impact regarding Acidification, Particulate Matter, Photochemical Ozone Formation, Human toxicity, and Freshwater ecotoxicity. The reduction of these impacts is an important objective to be achieved, which led to the introduction of the gaseous effluent treatment system on this plant. Each of the methods evaluates the impacts in different ways but it can be observed that all of them identify similar major environmental effects. Figure 5a–c shows the contribution analysis, which demonstrates that most of the impacts come from the construction of wells, pipelines, and mechanical equipment. It can be observed that power plant maintenance has a relatively low environmental impact, while the end of life almost is nearly negligible compared to the total.
The ReCiPe method [30] includes provision for the further step of Damage Assessment (EndPoint LCIA): all the Midpoint impact categories are reduced to three major damage macro-categories: Human health (DALY), Ecosystem quality (species × yr), and Resource depletion (USD2013). The results are 1.72 × 10⁻³ DALY, 2.47 × 10⁻⁶ species × yr, and 2.41 × 10⁻¹ USD2013 respectively (all these values are referred to the functional unit, MWh of exergy). After normalization, it is clear that Recipe indicates that Human Health is the most impactful damage category concerning the total impact, covering about 84.4% of the total (Figure 6).

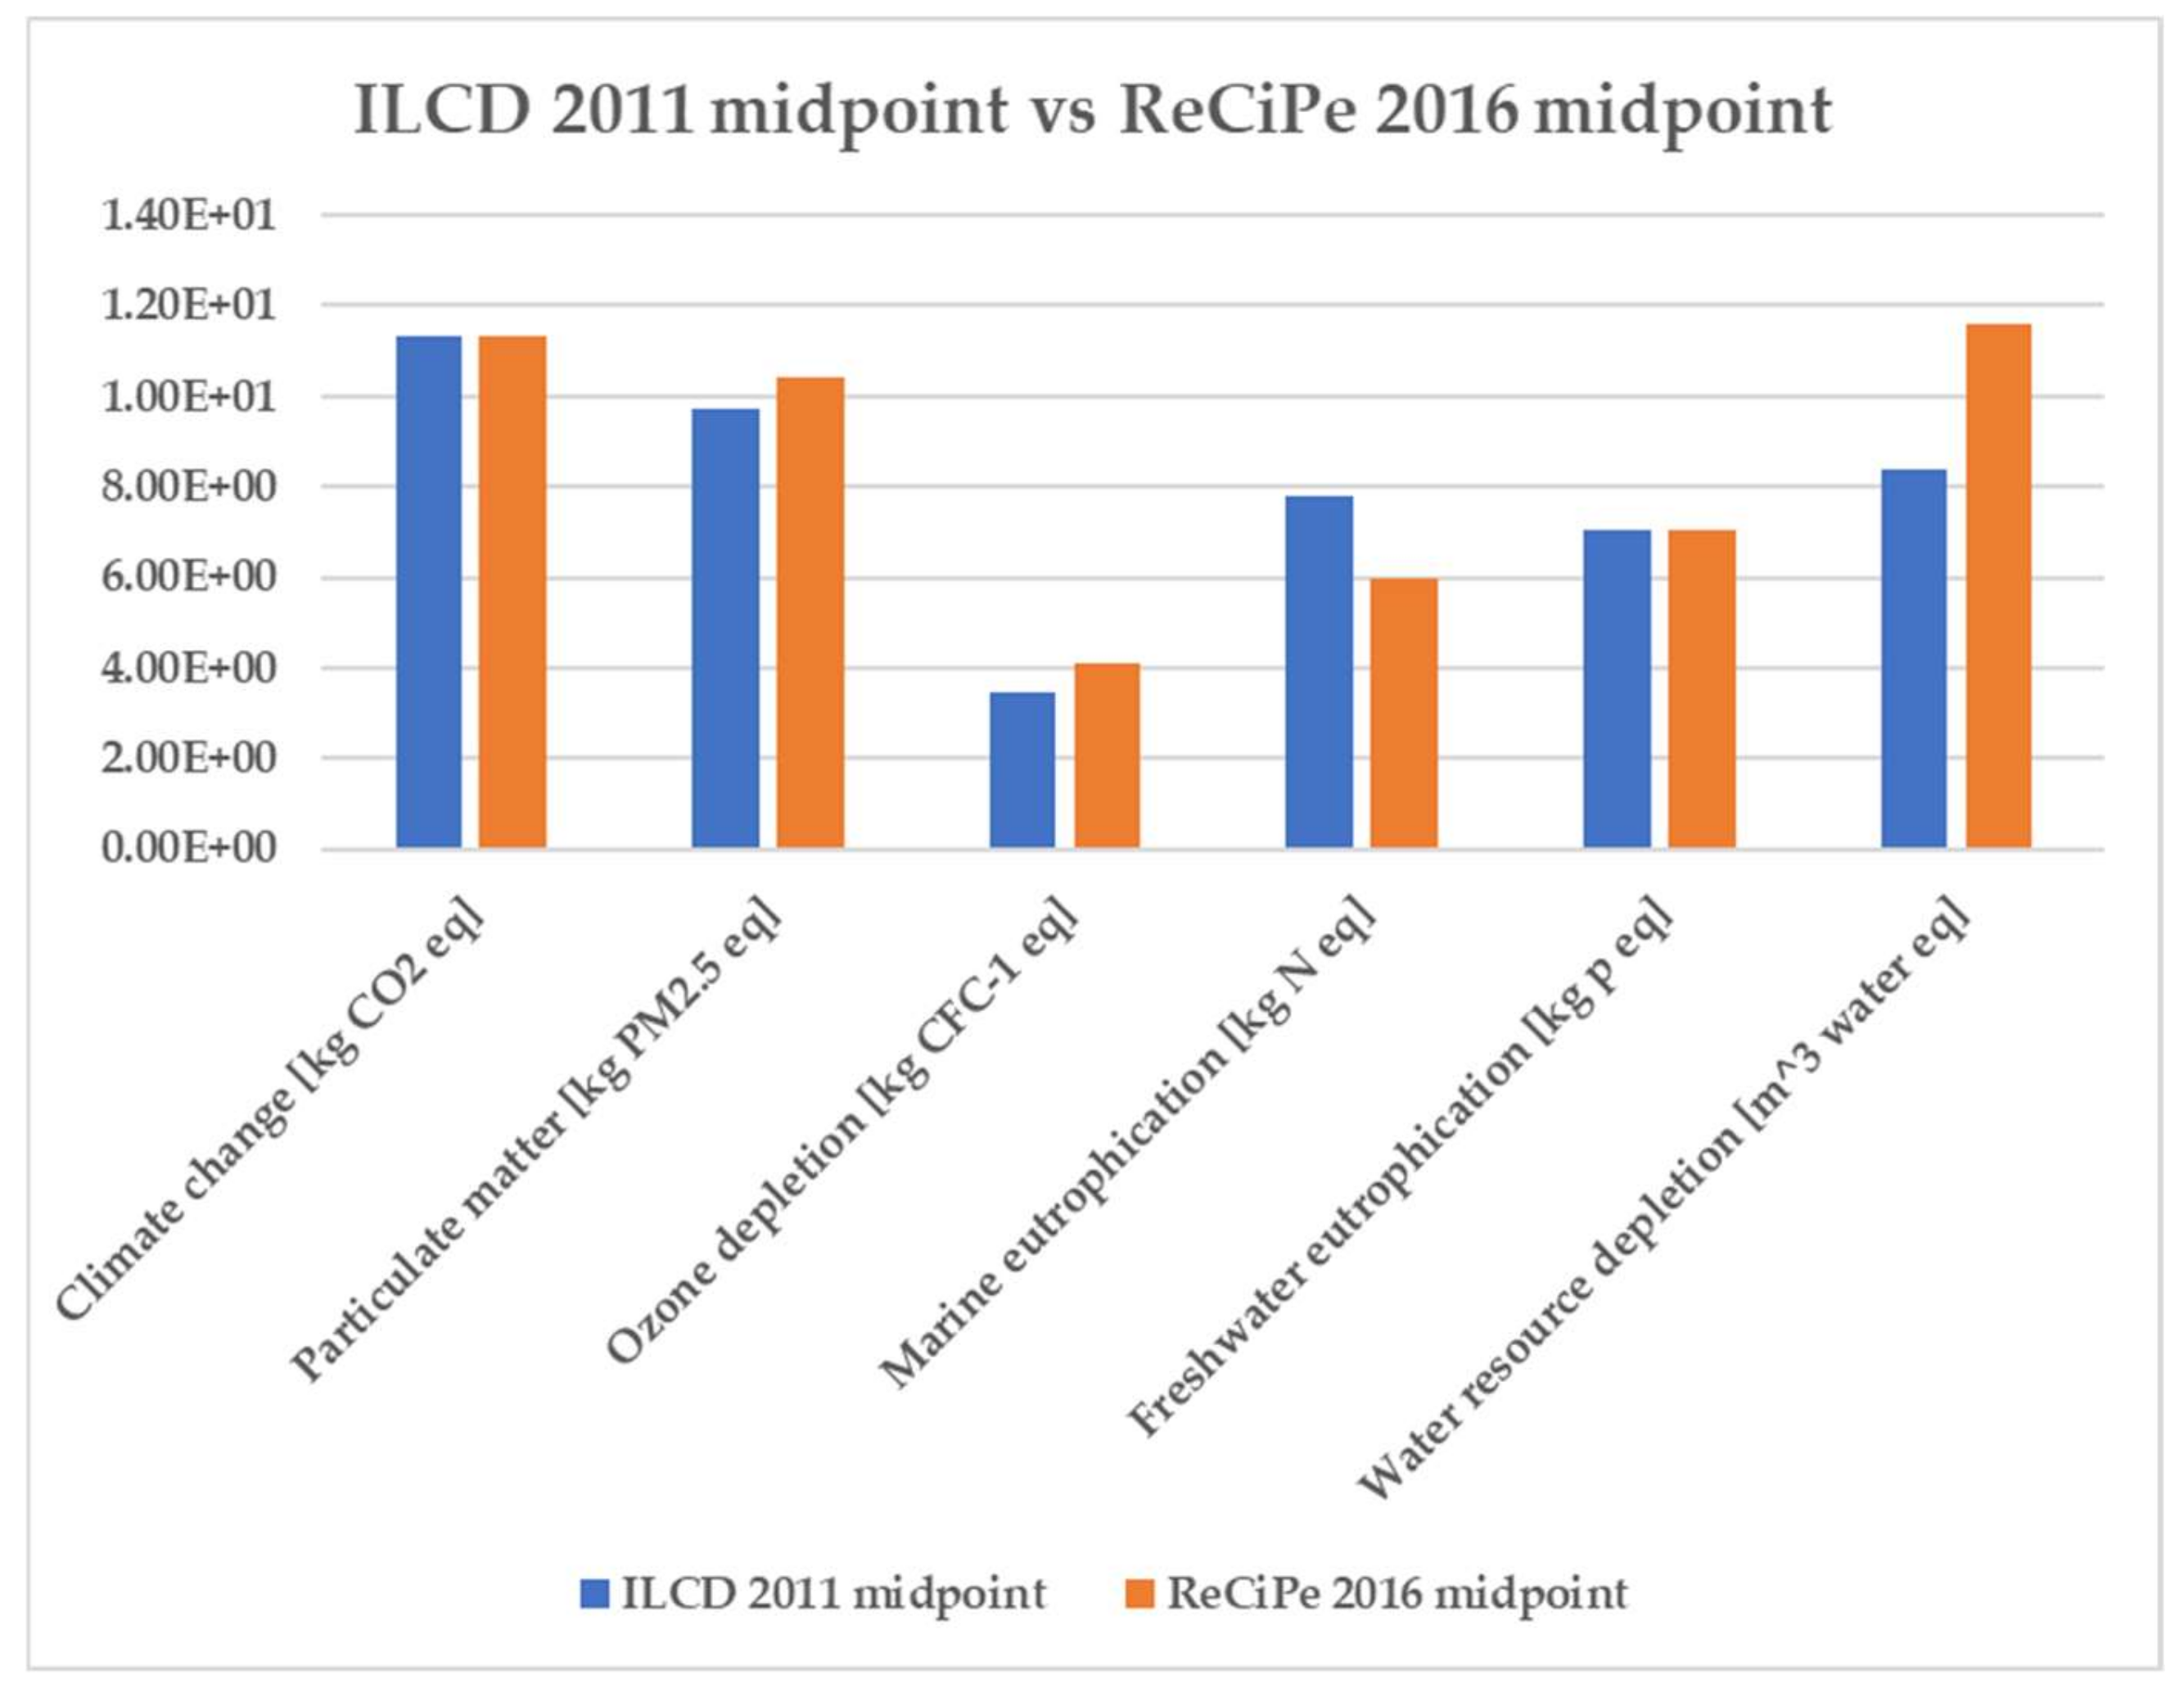
3.5.1. ReCiPe 2016 vs ILCD 2011

The purpose of this section is to discuss in detail the differences between two midpoint methodologies: ILCD 2011 and ReCiPe 2016. The two methods have a different number of impact categories and indeed focus on different environmental impacts. In cases where categories reproduce the same environmental damage, the calculation method may be dissimilar. Normalization is applied with very different approaches and the result is that the most impacting categories may not be the same or may have different overall impact percentages. It is interesting to analyse the comparable categories with equivalent measurement units for both methods. In this way, it is possible to understand the difference between the methodologies in the way of calculating the environmental impacts (Figure 7).
It can be noted from Figure 7 that the Climate Change and Freshwater Eutrophication categories are very close for both methods. The Particulate Matter category differs but the calculation method applied is similar. The Ozone Depletion, Marine Eutrophication and Water Resource Depletion categories differ widely and the last one is an example of the relevant difference in approach between the two methods: in fact, the overall assessed water consumption is 2.40 × 10⁻² m3 for ILCD 2011, while it is 3.91 × 101 m3 for ReCiPe 2016. Moreover, after normalization this is a negligible category for ILCD, covering about 0.08% of the total impact; for ReCiPe, instead, it is a relevant category and covers about 11.62% of the total impact. This fact occurs because ILCD uses a country-specific factor, which is reflected on the characterization factor, based on scarcity classification (Iceland is a country with a low scarcity of water: Water Scarcity ratio ≤0.1), instead, ReCiPe considers a characterization factor of 1 m3 of water consumed per m3 of water extracted [32,33].

3.5.2. CML Versus ILCD and ReCiPe

CML-IA baseline is a method with baseline indicators that are recommended for simplified studies [31]. Human toxicity has a different unit of measurement compared to the ILCD method; CML-IA expresses this category in kg 1.4 DB eq instead of CTUh, so results are not comparable. Global warming and Ozone layer depletion have the same calculation model and express the same results. Eutrophication, in CML-IA baseline, expresses the nitrification potential in kg PO4 equivalent per kg emission, and fate is not included in the model (the period is eternity). Differently, in ILCD—which applies the same model as ReCiPe -the Freshwater eutrophication is expressed in kg P eq and the characterization factor accounts for the environmental persistence (fate) in the emission of P. Although the different unit of measurement and approach used in both method, it is possible to make a calculation that converts from orthophosphate PO4 to phosphorus, multiplying by the molecular mass ratio (0.3261 kg P/kg PO4). Applying this correction, the eutrophication evaluated by CML assumes a value of 1.90 × 10⁻³ kg P—close to the value reported with ILCD for Freshwater Eutrophication (Table 8).
The CML-IA baseline should also be compared with ReCiPe 2016 midpoint (Table 9); the two methods have in common some impact categories:
  • Acidification
  • Eutrophication
  • Global warming
  • Ozone layer depletion
  • Human toxicity
  • Marine aquatic ecotoxicity
  • Terrestrial ecotoxicity
Acidification is expressed in kg of SO2 for both methods, however, CML is calculated with the adapted RAINS 10 model; instead, ReCiPe calculates Acidification with the Weighted World Average Fate Factor of SO2. For Eutrophication and Global warming, the same considerations, made for the comparison with the ILCD method, apply. The Ozone layer depletion is expressed in kg CFC-11 eq for both methods; however, CML applies the World Meteorological Organization (WMO) approach, which defines the ozone depletion potential of different gasses with an infinite time horizon. In contrast, ReCiPe applies the Ozone Depleting Substance (ODS) method proposed by the United States Environmental Protection Agency (EPA) with a 100 years of time horizon. Marine Aquatic Ecotoxicity, Terrestrial Ecotoxicity, and Human toxicity are expressed in terms of kg of 1.4 dichlorobenzene equivalent for both methods; however, CML applies the USES-LCA approach, describing fate, exposure, and effects of toxic substances for an infinite time horizon in one category; while ReCiPe applies USES-LCA with a100 years of time horizon, resulting in a different characterization factor. Moreover, ReCiPe has different midpoint factors for human cancer and non-cancer effects, so it expresses two Human toxicity categories, while CML calculates only one.
In conclusion, the benchmarking among different LCIA approaches showed that some methods give specific relevance to specific categories; however, the three methods demonstrated a substantial agreement referred to the main categories implied in the case of the present geothermal power plant. All this considered, it was necessary to adopt one single method for Life Cycle Assessment. The European trend in Life Cycle Thinking is to move progressively to the use of the Environmental Footprint (EF) method (with a dedicated secondary process database), a methodology derived from the ILCD method with significant changes and improvements. Nowadays, the EF 2.0 version exists and the EF 3.0 version is being developed. At the moment of the analysis, it was not possible to apply the EF method, because of the availability and completeness of the EF database and it was decided to use the ILCD method (which is applicable with the well-proven Ecoinvent 3.6 database) as the environmental score to be used later in the EEvA.

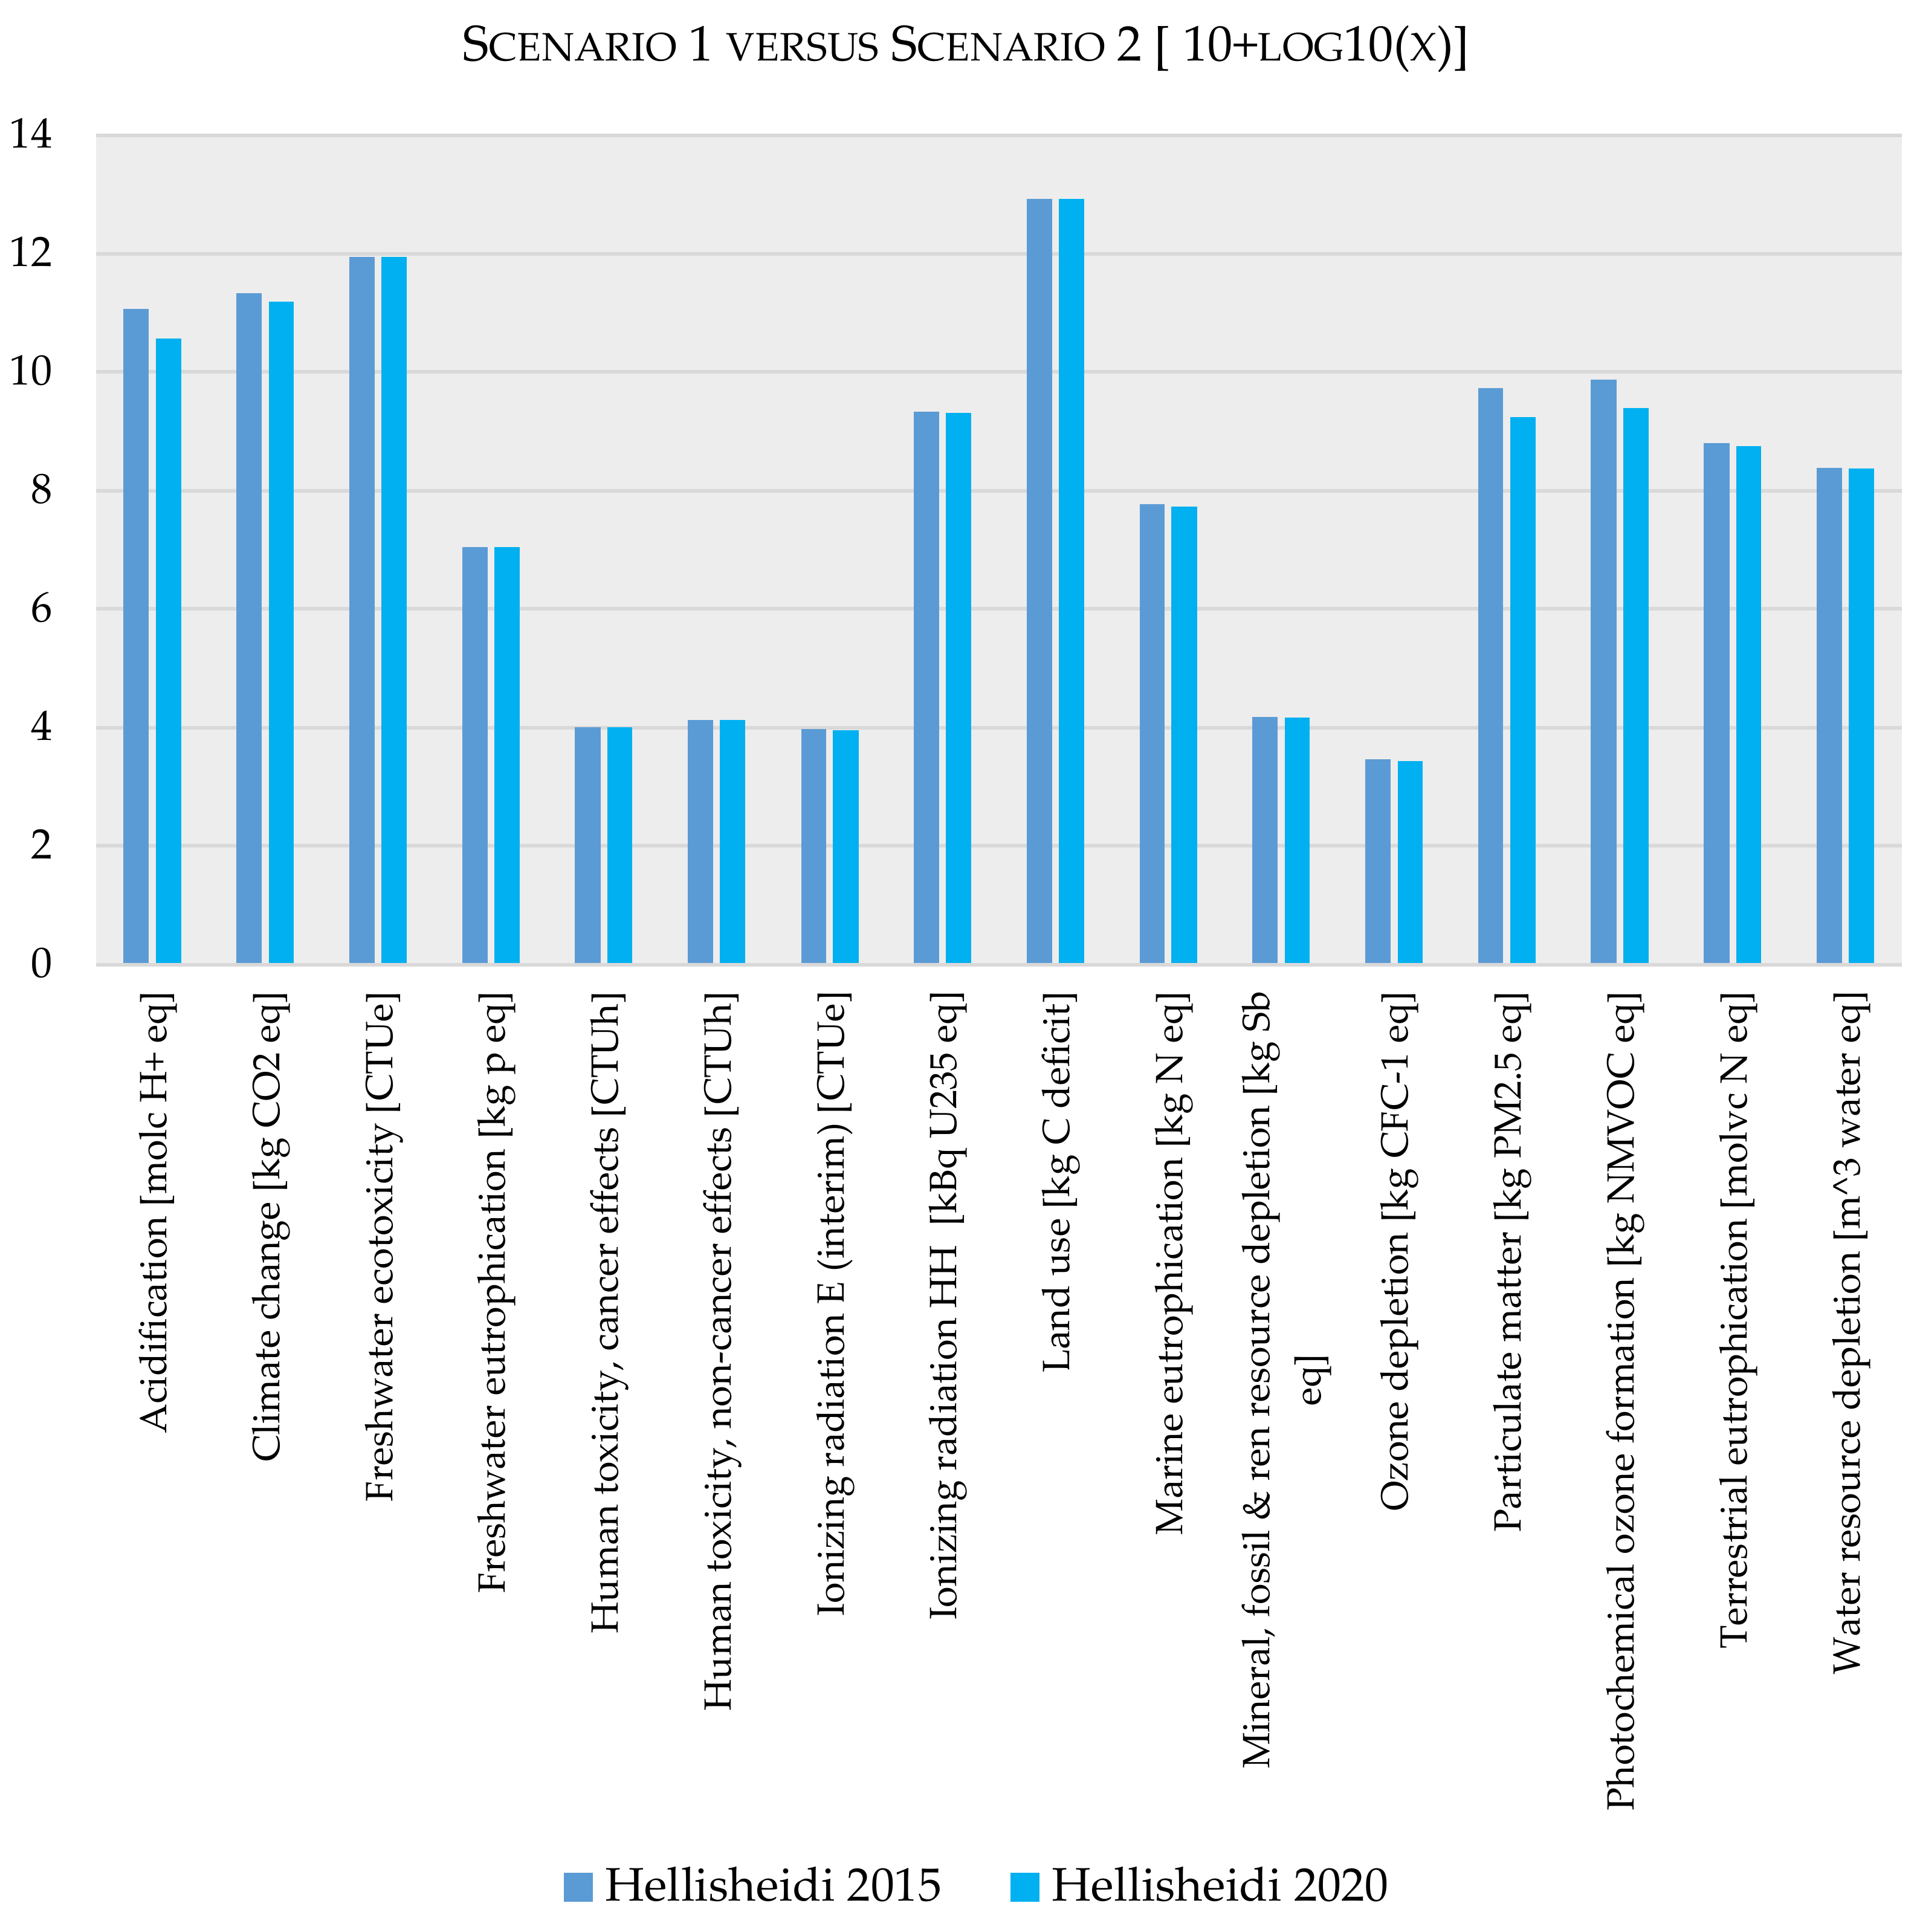
3.6. LCA Comparison of Scenario 1 and Scenario 2

The comparison between the two scenarios was carried out using the ILCD 2011 midpoint methodology (Figure 8).
The results show that all categories in Scenario 2 have a lower environmental impact compared to Scenario 1, as expected. The reduction of emissions to air of hydrogen sulphide and carbon dioxide have an essential role in the categories of Acidification, Climate Change, Particulate matter, and Photochemical ozone formation. A further improvement of the exhaust vapour treatment system in CarbFix and SulFix projects would mean a drastic reduction of impacts for these categories.
The use of electricity for the drilling of wells also represents an improvement, although not very considerable in all categories. This is an expected outcome because only 14 wells are drilled with the use of electricity during the lifetime of the power plant, the remaining 66 wells having already been drilled (64 wells at the beginning of the plant, 2 maintenance wells) with diesel fuel consumption. It would be possible for future geothermal plants to improve significantly the environmental performance if the drilling of productive and re-injection wells is performed from the beginning using electric drilling platforms.

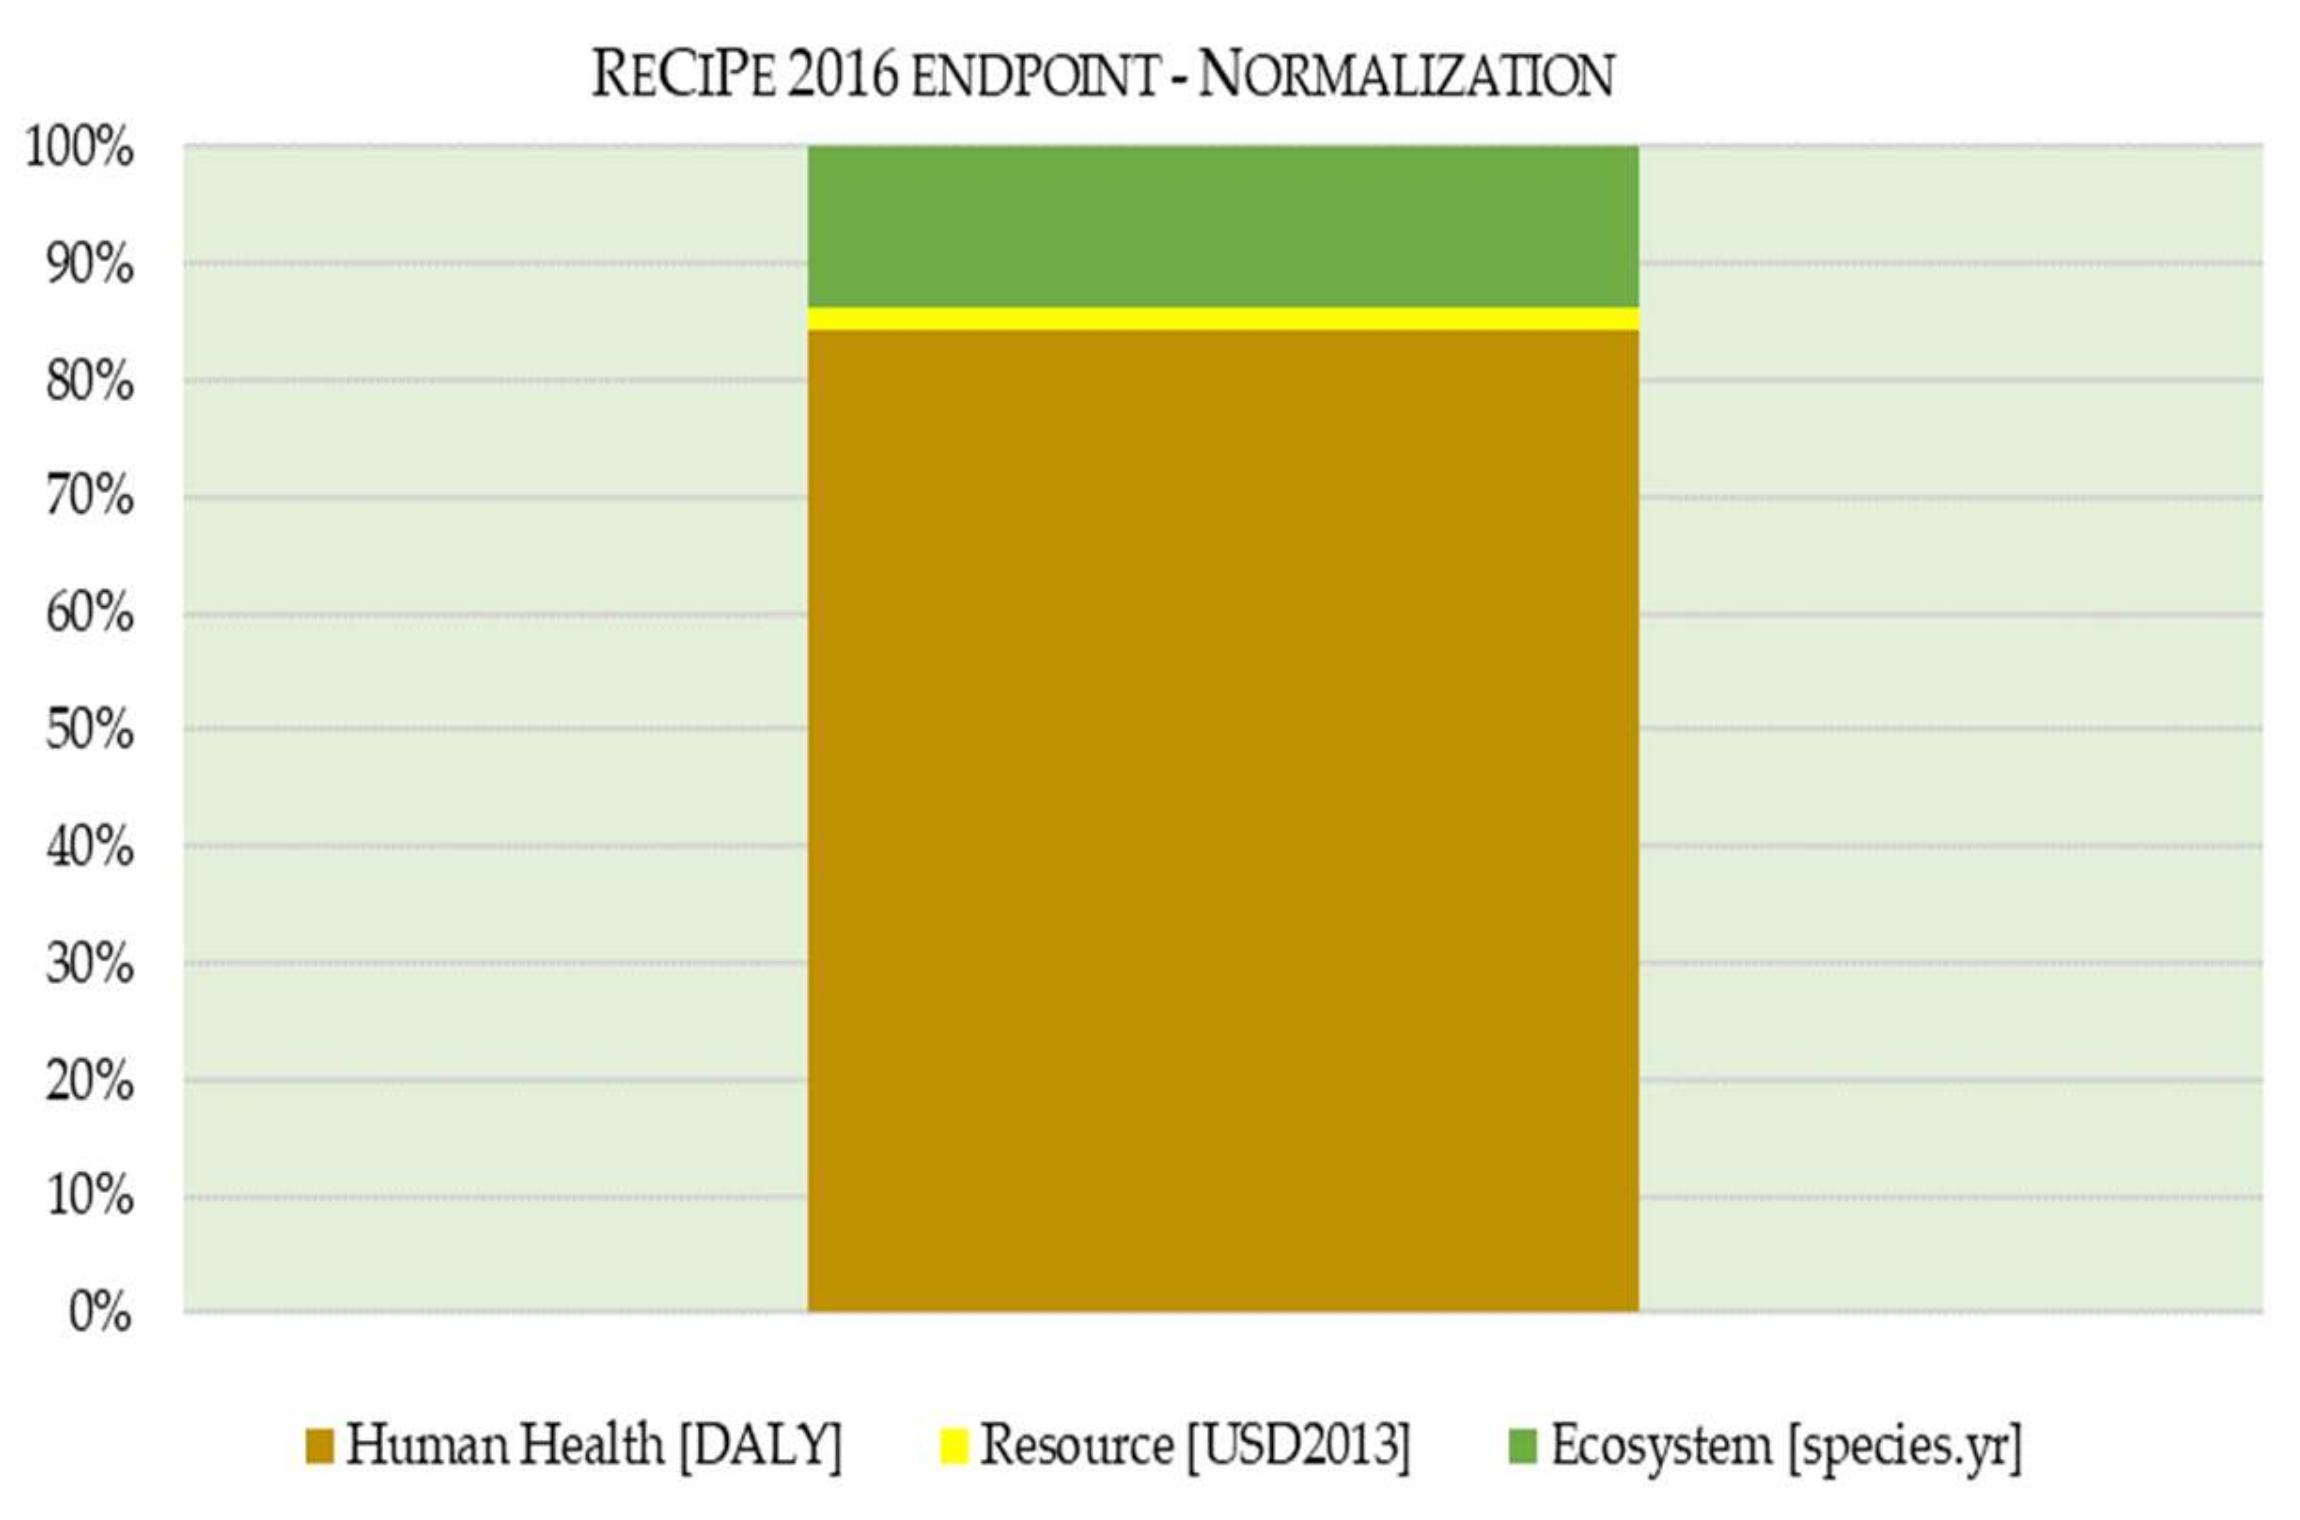
3.7. Calculation of Single Score Values

The next step after carrying out the impact analysis and selecting the reference method of analysis (here, ILCD 2011 Midpoint) is to calculate the single score of the method (Equation (3)), expressed in so-called eco-points. This was done for the main components of the power plant, presented in Figure 1, applying a disaggregation approach from the whole plant. From the result of the impact analysis of each component, normalization and weighting were carried out using the recommended EC-JRC Global-Equal Weighting normalization set. Normalization is done by dividing the characterized results by an estimate of the total or per capita equivalent emissions in that impact category associated with an entire geographical region.
NI i = CI i NR i   sin gle   score =   NI i ×   w i ,
where   NI i —normalized value of i—th impact category, CI i —i—th impact category, NR i —normalization factor representing the specific region, w i —weighting factor
The results of normalization and weighting at the component level are reported in Table 10. The results are divided into main powerplant components (referred to the scheme in Figure 1). The other contributions of the power plant are considered as common to be distributed among main components based on the total exergy destruction of each component (as explained in the next section, Equation (4)).

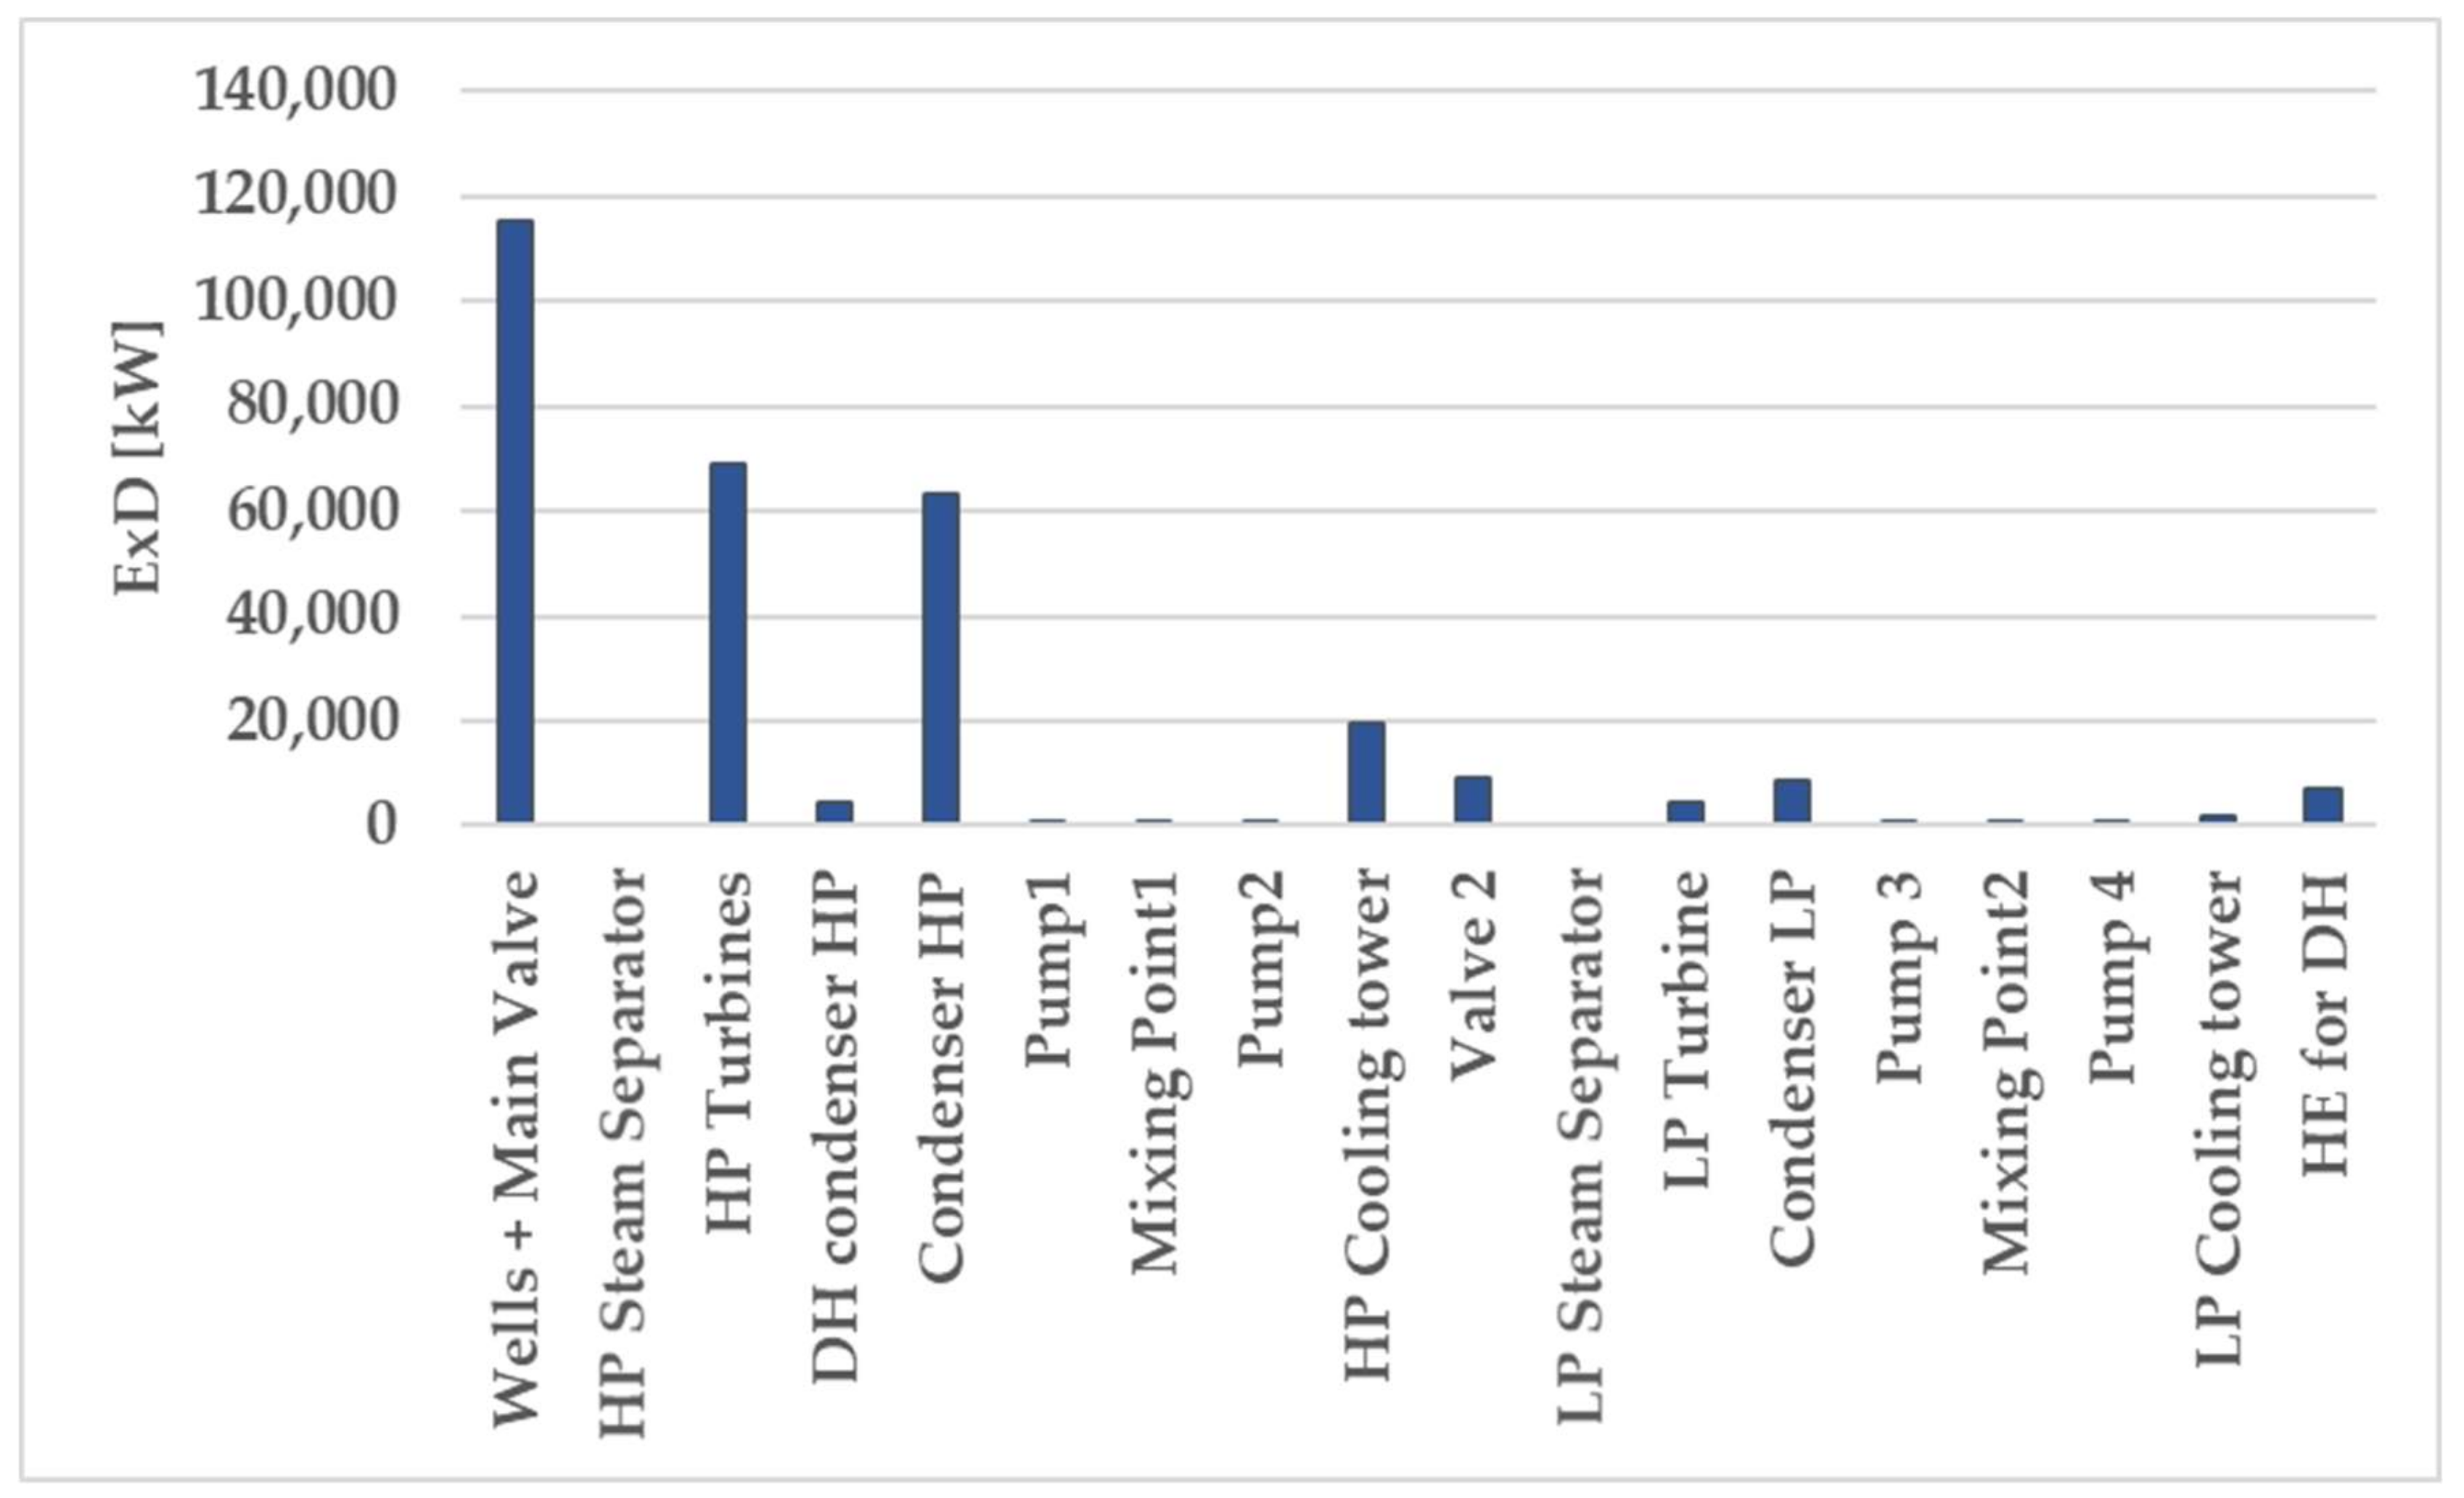
4. Exergo-Environmental Assessment

In the first step of exergo-environmental assessment, detailed exergy analysis is performed. Exergy is an indicator of the capacity of a system, of matter streamflow, or an energy interaction (heat, work, potential or kinetic energy) to produce work when interacting with the reference environment. An exergy balance can be written separating input (+) and output (−) terms:
k W k + i θ mi Q i + j E j = k W k + + i θ mi Q i + + j E j + h E x D L ,
where the parameter W k (kW) is the exergy work (work = exergy),   θ m i Q i is the heat exergy, with θ m i corresponding to the Carnot factor θ m i = 1 T r e f T a v S , E j is the transformation exergy and E x D L s the exergy Destruction or Loss—the balance is non-conservative because real processes are irreversible.
The aim of the exergy analysis is to identify the component in which exergy destruction and loss occurs and to determine the thermodynamic performance of the system [34,35]. For each component of the system, exergy of input and output flows and exergy destructions and losses are calculated.
As the next step, it is possible to assign the results of the environmental analysis to the exergy streams. The environmental impact per unit of exergy of j-stream, entering or exiting the powerplant component, b j (Pts/MJ of exergy; or Pts/MWh referring to the final cost of electricity or heat) is defined by:
b j =   B ˙ j Ex j ,
where the parameter B ˙ j (Pts/s) is the environmental impact rate, expressed in single score eco-points (here, ILCD 2011 Midpoint) per unit of time (considering 7446 hr/yr [36] and 30 years of lifetime [37]) and E x j (MW) is the exergy content related to each j-stream.
With respect to LCA, EEvA applies conservation balances for mass and energy through the whole plant and identifies the exergy destructions and losses. Following that, the EEvA methodology is based on the solution of environmental impact balances performed for each component k:
B ˙ j , k , in +   Y ˙ k = B ˙ j , k , out .
Auxiliary equations are also necessary if the number of unknown variables in Equation (6) is greater than one [35]. Auxiliary equations are applied using Fuel and Product principles, following consolidated rules of exergo-economic analysis [35,38]. The environmental balance equations are given in Table 11.
The component-related environmental impact rate, Y ˙ k (Pts/s), is associated with the life cycle of the component k and consist of the impacts occurring during construction, O&M, and end of life stages of component k. Moreover, for the components within which the chemical reaction occurs and the pollutants are formed, their impact has to be also considered. The NCGs were considered within the environmental cost of the geothermal fluid, derived from the environmental impact of the wells.
In the present study the component-related environmental impact Y ˙ k , was calculated including not only the impact rate of the component k but also considering the contribution to the environmental impact deriving from the relevant auxiliary components functional to the whole plant (e.g., buildings, pipelines, operation and maintenance, end of life, etc.), which were distributed on each component proportionally to the exergy destruction ratio z D , k = E x D , k E x D , T O T , as shown in Equation (7):
  Y ˙ k =   Y ˙ CO , k + z D , k ×   Y ˙ TOT OC ,
where Y ˙ C O , k : is the impact of the component related to the production of raw materials and manufacturing; Y ˙ T O T O C : is the impact of all the other components which have not been represented in Figure 1.
By solving this set of equations it was possible to calculate the values of environmental impact rates of each component streams as well as exergo-environmental variables. For the interpretation of an EEvA, the following exergo-environmental variables can be defined:
I.
Environmental impact of exergy destruction occurring inside each component:
B ˙ D , k = b F , k ·   E ˙ x D , k ,
where b F , k is the average specific impact associated with the flows that supply the component k.
The exergy losses (which are unavoidable and referred to as non-productive components needed for the operation of th whole plant) were treated as non-impacting on the system (the environmental impact cost of streams 28 and 30 is considered as zero).
II.
Total environmental impact associated with a component allowing to determine the largest environmental impact:
B ˙ TOT , k = B ˙ D , k +   Y ˙ k .
III.
The exergo-environmental factor f b , k , representing the percentage contribution of Y ˙ k compared to the total B ˙ D , k + Y ˙ k , that expresses the primary source of the environmental impact of these components:
f b , k =     Y ˙ k B ˙ D , k +   Y ˙ k .
IV.
The relative difference of the specific environmental impacts (Products-to Fuel) for the k-th component allows identifying the potential for improvement:
r b , k =   b P , k b F , k b F , k .
In terms of exergy balance, the relative exergy destructions of each component are displayed in Figure 9. The component with the highest destruction is the main valve at the wellhead, due to the drastic reduction of pressure, from the reservoir conditions to the operating parameter at the inlet of the power plant. This component includes the exergy destruction due to friction losses of the fluid ascending through the wells: this first component includes thus (for the exergo-environmental analysis) both the wells and the main valve. The second component with the highest exergy destruction is the set of HP turbines, with an overall exergy destruction which is about half the value recorded for the wells/valve assembly. These two components contribute to more than 60% of the total exergy destruction of the power plant. The exergy efficiency of the power plant results to be 49.7%, with the highest inefficiencies located in the HP section.
The results of the exergo-environmental analysis are presented in Table 12. Concerning the total environmental impact (ḂTOT,k), which includes both contributions of the components’ life cycle and exergy destructions, the wells and main valve emerged as the most impacting component, representing about 35% of the global effect. 85% of the wells and main valve impact value is due to the specific environmental cost of the component Ẏk, whereas only a small part (15%) is attributable to the exergy destructions (ḂD,k), even if this is the largest within the power plant. Indeed, even if the thermodynamic irreversibility occurring inside the wells and main valve contributes to 38% of the total impact of exergy destructions, the specific cost of the component is one order of magnitude higher. The contribution of the specific cost of the wells is the most relevant among the components and its share is above 40%. The other components which have a significant environmental impact are the HP turbines, the HP Condenser, and the HP cooling towers. Both the HP turbine and HP Condenser contribution is mainly attributable to the specific cost of the component Ẏk, while for the HP cooling tower (as wells as for the LP cooling tower), the environmental cost is dominated by the exergy destruction; this implies that there is, in this case, a margin of improvement, for example improving the design, increasing the surface area of the fillings of the cooling towers.
The components which have the highest potential for improvement are those with a high value of r b , k : in this case, the HP turbines, the DH condenser, and the HP Condenser. Indeed, there is room for improvement in these components, as testified by the high exergy destruction values. On the other hand, the Wells and main valve present a low value of r b , k , this means that to improve this component, a more difficult intervention should be carried out.
Finally, it is possible to perform of the environmental cost of electricity and heat produced by the power plant. Specifically, the environmental cost of electricity is 1.82 cPts/MWh, generated by 81% by the specific cost of the component and by 19% by the exergy destruction, while the environmental cost of heat is 1.32 cPts/GJ of generated hot water, derived by 73% by the specific cost of the components and 27% by the exergy destruction.

5. Discussion & Conclusions

The Hellisheiði geothermal power plant, producing electricity and heat, was revisited applying an updated and component-level Life Cycle Analysis and benchmarking different impact assessment approaches; after that, exergy and exergo-environmental modelling were applied.
The LCA methodology follows until the midpoint evaluation of the LCA guidelines for geothermal plants developed in the GEONVI project. The LCI data were updated to Ecoinvent 3.6 database for secondary flows and the LCI was disaggregated into the relevant plant components. The environmental impacts covered the typical phases of construction, operation, and disposal of the plant. The environmental performance is specific to this case, as it depends on the resource conditions, on the technology utilized for energy conversion, and on measures taken for the abatement of emissions. The main parameters that influence the environmental impact are the gases present in the geothermal fluid—in particular CO2 and H2S—and the pollutants associated with the use of diesel fuel (drilling, dismantling, and closure of wells). Two scenarios were considered: (i) the original power plant case (2012 inventory) (ii) the present development status with new technology for the abatement and re-injection of emissions and other relevant improvements (e.g., electrical drilling platforms for the new wells).
In order to proceed with the Exergo-Environmental Analysis, it was necessary to calculate a single-score value for each of the fundamental plant components applying an accepted method for Impact Assessment after Normalization and Weighting. Three approaches were considered and benchmarked: ILCD 2011, Recipe 2016, and CML-IA (all of them relying on Ecoinvent 3.6 for secondary data). After verifying consistency among the methods for the major midpoint impact categories, the ILCD 2011 approach was selected.
The comparison between Scenario 1 and Scenario 2 shows at present moderate improvements for the categories of acidification, climate change, particular matter, and photochemical ozone formation. The reduction of emissions into the atmosphere affects the categories mentioned. It is expected that the removal of CO2 and H2S will be extended in the near future and this will further improve the environmental performance. Electric drilling of wells significantly reduces impacts on all categories and is recommended wherever possible but at the moment only 14 wells are drilled with this technology.
Finally, the exergo-environmental analysis based on ILCD 2011 single-weighted impact scores for the main plant components allowed to highlight the most impactful contributions for the power plant, namely the geothermal wells + main valve, the HP turbines, the HP condenser, and the HP Cooling towers. The environmental cost of the geothermal wells specific is the main contributor to the environmental impact of the power plant (Ẏk = 1.13 × 10⁻³ Pts/s). Even if the exergy destruction in the wells + valve is the biggest (ExD = 115 MW), its environmental contribution is still one order of magnitude lower than the specific environmental costs of the wells+valve. This implies that an improvement in drilling techniques is required in order to improve the environmental sustainability of geothermal power plants.
On the other hand, referring to the high-pressure turbines and condenser, the impact share attributable to the exergy destruction of the components is relevant but still less impacting concerning their specific environmental cost. Conversely, for the HP cooling towers (as well as for the LP cooling towers), the exergy destruction of the components is more relevant than their specific environmental costs. This implies that a better design of the component could allow for a significant reduction of the total environmental cost of the component, as testified by the low value of the exergo-environmental factor fb.
The fact that the environmental cost Ẏk is large for the wells reflects the common situation for geothermal systems, where wells drilling and construction plays a major role; on the whole—compared to fossil-fuelled power plants-exergy destructions (ḂD,k) need to be considered but play a minor role, as happens for other renewable energy systems.
The final obtained environmental cost of electricity was 1.82 cPts/MWh, generated mainly 81% by the specific cost of the component, while the environmental cost of heat is 1.32 cPts/GJ of generated hot water, also mainly derived by the specific cost of the components (73%).
As a final remark, the EEva here applied only takes into account ILCD 2011 single-weighted impact scores. This was done for the sake of brevity and for stressing the methodology of the LCA and EEvA procedures. Future developments will involve a sensitivity analysis with the employment of a benchmarking of different LCIA methods.

Author Contributions

V.C. and C.Z. were responsible for building the LCI. C.Z. was the main developer of the LCA. B.M. provided disaggregation of the LCI at component level and supported the interpretation of the LCA and exergo-environmental results. L.T. was responsible for the exergy and exergo-environmental analysis and organized with G.M. the validation and presentation of the results. All authors contributed to the writing and reviewing of the manuscript. All authors have read and agreed to the published version of the manuscript.

Funding

This research received no external funding.

Institutional Review Board Statement

Not applicable.

Informed Consent Statement

Not applicable.

Data Availability Statement

Not applicable.

Conflicts of Interest

The authors declare no conflict of interest.

Nomenclature

B ˙ Environmental impact rateLCIALife Cycle Impact Assessment
B ˙ D Environmental impact of exergy destructionLCTLife Cycle Thinking
Y ˙ Component relate environnemental impact rateLPLow Pressure
bEnvironment impact per unit of exergyMweMega Watt electric
CHPCogeneration of Heat and PowerMWtMega Watt thermal
CIImpact categoryNCGNon condensable gases
DHDistrict HeatingNINormalized value
EEvAExergo-environmental AnalysisO&MOperation and maintenance
EFEnvironmental FootprintODSOzone Depleting Substance
EGSEnhanced geothermal systemORCOrganic Rankine Cycle
EoLEnd of LifeθCarnot factor
EPEco PointQHeat
EPAEnvironmental Protection AgencyrRelative difference of specific environmental impacts
EUEuropean UnionRESRenewable energy sources
ExExergysEntropy
fExergo-environmental factorTTemperature
HPHigh PressurewWeighting factor
LCALife Cycle AnalysisWPower
LCILife Cycle InventoryzExergy destruction ratio

References

  1. Shortall, R.; Davidsdottir, B.; Axelsson, G. Development of a sustainability assessment framework for geothermal energy projects. Energy Sustain. Dev. 2015, 27, 28–45. [Google Scholar] [CrossRef]
  2. Eberle, A.; Heath, G.A.; Petri, A.C.C.; Nicholson, S.R. Systematic Review of Life Cycle Greenhouse Gas Emissions from Geothermal Electricity. Systematic Review of Life Cycle Greenhouse Gas. Emissions from Geothermal Electricity; National Renewable Energy Laboratory: Golden, CO, USA, 2017. [Google Scholar]
  3. Asdrubali, F.; Baldinelli, G.; D’Alessandro, F.; Scrucca, F. Life cycle assessment of electricity production from renewable energies: Review and results harmonization. Renew. Sustain. Energy Rev. 2015, 42, 1113–1122. [Google Scholar] [CrossRef]
  4. Basosi, R.; Bonciani, R.; Frosali, D.; Manfrida, G.; Parisi, M.L.; Sansone, F. Life Cycle Analysis of a Geothermal Power Plant: Comparison of the Environmental Performance with Other Renewable Energy Systems. Sustainability 2020, 12, 2786. [Google Scholar] [CrossRef]
  5. Karlsdóttir, M.R.; Palsson, O.P.; Pálsson, H.; Maya-Drysdale, L. Life cycle inventory of a flash geothermal combined heat and power plant located in Iceland. Int. J. Life Cycle Assess. 2015, 20, 503–519. [Google Scholar] [CrossRef]
  6. Paulillo, A.; Striolo, A.; Lettieri, P. The environmental impacts and the carbon intensity of geothermal energy: A case study on the Hellisheiði plant. Environ. Int. 2019, 133, 105226. [Google Scholar] [CrossRef]
  7. Heberle, F.; Schifflechner, C.; Brüggemann, D. Life cycle assessment of Organic Rankine Cycles for geothermal power generation considering low-GWP working fluids. Geothermics 2016, 64, 392–400. [Google Scholar] [CrossRef]
  8. Frick, S.; Kaltschmitt, M.; Schröder, G. Life cycle assessment of geothermal binary power plants using enhanced low-temperature reservoirs. Energy 2010, 35, 2281–2294. [Google Scholar] [CrossRef] [Green Version]
  9. Pratiwi, A.; Ravier, G.; Genter, A. Life-cycle climate-change impact assessment of enhanced geothermal system plants in the Upper Rhine Valley. Geothermics 2018, 75, 26–39. [Google Scholar] [CrossRef]
  10. Parisi, M.L.; Douziech, M.; Tosti, L.; Pérez-López, P.; Mendecka, B.; Ulgiati, S.; Fiaschi, D.; Manfrida, G.; Blanc, I. Definition of LCA Guidelines in the Geothermal Sector to Enhance Result Comparability. Energies 2020, 13, 3534. [Google Scholar] [CrossRef]
  11. Blanc, I.; Damen, L.; Douziech, M.; Fiaschi, D.; Manfrida, G.; Parisi, M.L.; Lopez, P.P.; Ravier, G.; Tosti, L.; Mendecka, B. First Version of Harmonized Guidelines to Perform Environmental Assessment for Geothermal Systems Based on LCA and non LCA Impact Indicators: LCA Guidlines for Geothermal Installations. Deliverable 3.2, GEOENVI Project. 2020. Available online: https://www.geoenvi.eu/wp-content/ (accessed on 10 February 2021).
  12. Singh, R.K.; Murty, H.; Gupta, S.; Dikshit, A. An overview of sustainability assessment methodologies. Ecol. Indic. 2012, 15, 281–299. [Google Scholar] [CrossRef]
  13. International Organization for Standardization (ISO). International Standard ISO 14044 Environmental management—Life cycle assessment—Requirements and Guidelines Management, 1 ed; ISO: Geneva, Swizterland, 2006; pp. 1–46. [Google Scholar]
  14. Huppes, G.; van Oers, L. Evaluation of Weighting Methods for Measuring the EU-27 Overall Environmental Impact. JRC Sci. Tech. Reports 2011. [Google Scholar]
  15. Pizzol, M.; Laurent, A.; Sala, S.; Weidema, B.; Verones, F.; Koffler, C. Normalisation and weighting in life cycle assessment: Quo vadis? Int. J. Life Cycle Assess. 2017, 22, 853–866. [Google Scholar] [CrossRef] [Green Version]
  16. Meyer, L.; Tsatsaronis, G.; Buchgeister, J.; Schebek, L. Exergoenvironmental analysis for evaluation of the environmental impact of energy conversion systems. Energy 2009, 34, 75–89. [Google Scholar] [CrossRef]
  17. Cavalcanti, E.J.C. Exergoeconomic and exergoenvironmental analyses of an integrated solar combined cycle system. Renew. Sustain. Energy Rev. 2017, 67, 507–519. [Google Scholar] [CrossRef]
  18. Başoğul, Y. Environmental assessment of a binary geothermal sourced power plant accompanied by exergy analysis. Energy Convers. Manag. 2019, 195, 492–501. [Google Scholar] [CrossRef]
  19. Nasruddin, N.; Saputra, I.D.; Mentari, T.; Bardow, A.; Marcelina, O.; Berlin, S. Exergy, exergoeconomic, and exergoenvironmental optimization of the geothermal binary cycle power plant at Ampallas, West Sulawesi, Indonesia. Therm. Sci. Eng. Prog. 2020, 19, 100625. [Google Scholar] [CrossRef]
  20. Ecoinvent Database 3.6. 2020. Available online: https://www.ecoinvent.org/database/older-versions/ecoinvent-36/ecoinvent-36.html (accessed on 1 December 2020).
  21. Di Pippo, R. Geothermal Power Generation: Developments and Innovation. Elsevier: Amsterdam, The Netherlands, 2016; ISBN 9780081003442. [Google Scholar]
  22. Hallgrímsdóttir, E.; Ballzus, C.; Hrólfsson, I. The Geothermal Power Plant at Nesjavellir, Iceland. GRC Trans. 2012, 36, 3109–3114. [Google Scholar]
  23. Karlsdottir, M.R.; Heinonen, J.; Palsson, H.; Palsson, O.P. Life cycle assessment of a geothermal combined heat and power plant based on high temperature utilization. Geothermics 2020, 84, 101727. [Google Scholar] [CrossRef]
  24. Tosti, L.; Ferrara, N.; Basosi, R.; Parisi, M.L. Complete Data Inventory of a Geothermal Power Plant for Robust Cradle-to-Grave Life Cycle Assessment Results. Energies 2020, 13, 2839. [Google Scholar] [CrossRef]
  25. Snæbjörnsdóttir, S.Ó.; Sigfússon, B.; Marieni, C.; Goldberg, D.; Gislason, S.R.; Oelkers, E.H. Carbon dioxide storage through mineral carbonation. Nat. Rev. Earth Environ. 2020, 1, 90–102. [Google Scholar] [CrossRef] [Green Version]
  26. Clark, D.E.; Oelkers, E.H.; Gunnarsson, I.; Sigfússon, B.; Snæbjörnsdóttir, S.Ó.; Aradóttir, E.S.; Gíslason, S.R. CarbFix2: CO2 and H2S mineralization during 3.5 years of continuous injection into basaltic rocks at more than 250 °C. Geochim. Cosmochim. Acta 2020, 279, 45–66. [Google Scholar] [CrossRef]
  27. OpenLCA 1.10, GreenDelta. Available online: https://www.openlca.org/download/ (accessed on 10 February 2021).
  28. Unisim® Design R471; Honeywell International Sàrl: Rolle, Swutzerland, 2019.
  29. Gunnarsson, I.; Aradóttir, E.S.; Oelkers, E.H.; Clark, D.E.; Arnarson, M.; Sigfússon, B.; Snæbjörnsdóttir, S.Ó.; Matter, J.M.; Stute, M.; Júlíusson, B.M.; et al. The rapid and cost-effective capture and subsurface mineral storage of carbon and sulfur at the CarbFix2 site. Int. J. Greenh. Gas. Control. 2018, 79, 117–126. [Google Scholar] [CrossRef] [Green Version]
  30. Huijbregts, M.A.J.; Steinmann, Z.J.N.; Elshout, P.M.F.; Stam, G.; Verones, F.; Vieira, M.; Zijp, M.; Hollander, A.; van Zelm, R. ReCiPe2016: A harmonised life cycle impact assessment method at midpoint and endpoint level. Int. J. Life Cycle Assess. 2017, 22, 138–147. [Google Scholar] [CrossRef]
  31. Universiteit Leiden CML-IA Characterisation Factors. Institude Environ. Sci. 2015, 20, 709–721.
  32. EC-JRC-Institute for Environment and Sustainability. Characterisation Factors of the ILCD Recommended Life Cycle Impact Assessment Methods: Database and Supporting Information; EC-JRC-Institute for Environment and Sustainability: Brussels, Belgium, 2012; ISBN 9789279227271. [Google Scholar]
  33. Castellani, V.; Diaconu, E.; Fazio, S.; Sala, S.; Schau, E.; Secchi, M.; Zampori, L. ; European Commission; Joint Research Centre. Supporting Information to the Characterisation Factors of Recommended EF Life Cycle Impact Assessment Methods: New Methods and Differences with ILCD.; European Commission: Brussels, Belgium, 2018; ISBN 978-92-79-76742-5. [Google Scholar]
  34. Bejan, A.; Tsatsaronis, G.; Moran, M.J.; Seshadri, K. Thermal Design and Optimization; John Wiley & Sons: Hoboken, NJ, USA, 2003; Volume 21, ISBN 978-0-471-58467-4. [Google Scholar]
  35. Lazzaretto, A.; Tsatsaronis, G. SPECO: A systematic and general methodology for calculating efficiencies and costs in thermal systems. Energy 2006, 31, 1257–1289. [Google Scholar] [CrossRef]
  36. Talluri, L.; Manfrida, G.; Fiaschi, D. Thermoelectric energy storage with geothermal heat integration—Exergy and exergo-economic analysis. Energy Convers. Manag. 2019, 199, 111883. [Google Scholar] [CrossRef]
  37. Fiaschi, D.; Manfrida, G.; Petela, K.; Talluri, L. Thermo-Electric Energy Storage with Solar Heat Integration: Exergy and Exergo-Economic Analysis. Energies 2019, 12, 648. [Google Scholar] [CrossRef] [Green Version]
  38. Fiaschi, D.; Manfrida, G.; Petela, K.; Rossi, F.; Sinicropi, A.; Talluri, L. Exergo-economic and enviromental analysis of a solar integrated thermo-electric storage. Energies 2020, 13, 2484. [Google Scholar]
Figure 1. Simplified schematic representation of the Hellisheiði power plant.
Sustainability 13 01935 g001
Figure 2. Flowchart showing the geothermal plant life cycle.
Sustainability 13 01935 g002
Figure 3. Life cycle phases for the combined heat and power geothermal plant at Hellisheiði.
Sustainability 13 01935 g003
Figure 4. Schematic of geothermal gas injection of CarbFix pilot plant through the process simulation developed with Unisim® Design R471.
Sustainability 13 01935 g004
Figure 5. Contribution analysis (a) ILCD 2011 midpoint, (b) ReCiPe 2016 midpoint, (c) CML-IA baseline.
Sustainability 13 01935 g005aSustainability 13 01935 g005b
Figure 6. ReCiPe 2016 endpoint, Normalization.
Sustainability 13 01935 g006
Figure 7. Differences between ILCD 2011 and ReCiPe 2016 for some relevant midpoint impact categories (vertical scale 10 + log10[x]).
Sustainability 13 01935 g007
Figure 8. Comparison between the two scenarios analysed, ILCD 2011 midpoint (vertical scale10 + log10(x) of the category indicator).
Sustainability 13 01935 g008
Figure 9. Exergy destruction [kW] of each component of the power plant.
Sustainability 13 01935 g009
Table 1. Low-Pressure and High-Pressure Turbine Cooling towers Life Cycle Inventory (LCI).
Cooling Towers CTLP kg
Number1-
Expected lifetime30-
Stainless steel-1651.78
Steel -844.41
Copper-119.72
Plastic-367.34
GRP-92,809.80
Cooling Towers CTHP kg
Number6-
Expected lifetime30-
Stainless steel-9910.7
Steel -5066.41
Copper-718.31
Plastic-2204.02
GRP-556,858.80
Table 2. Efficiencies, types of equipment, and gas composition data at CarbFix pilot plant.
Efficiencies CH4CO2H2SHydrogenNitrogen
1_stage (Section 1)0.7800.3200.6800.9100.264
2_ stage (Section 2)0.8000.3380.7140.9340.267
Gas Composition (mol)CH4CO2H2SHydrogenNitrogen
1_stage (Section 1)0.0040.54500.22700.15900.0544
2_ stage (Section 2)0.00830.52700.01720.3440>0.0872
EquipmentkW
Absorption Tower compressor22 × 250
Absorption Tower pump150
Cooling pump135
Table 3. Details of NCG compressors and Recovery Pump design.
NCG CompressorsInletOutlet Recovery PumpInletOutlet
Temperature [°C]38.0540.01Temperature [°C]20.2920.32
Pressure [bar]4.915.009Pressure [bar]6.0029
Mass Flow [kg/s]249.4249.4Mass Flow [kg/s]35.4735.47
Compressor typeCentrifugalTotal Power [kW]7.059
Compressor Speed [rpm]3000
Table 4. Simulation of gas streams performed with Unisim® Design R471 [28].
Non-Water Soluble GasesCO2 [kg/s]H2S [kg/s]CH4 [kg/s]H2 [kg/s]N2 [kg/s]
249.9 kg/s total-----
0.154 m3/s exhaust gas 0.08110.00260.001280.5300.0134
Gases
Gas-charged waterCO2 [kg/s]H2S [kg/s]CH4 [kg/s]H2 [kg/s]N2 [kg/s]
35.47 kg/s 0.1450.12705.02 × 10−62.12 × 10⁻⁴
Table 5. ILCD 2011 midpoint results—most impactful categories.
ILCD CategoriesImpact ResultNormalization (%)
Acidification [molc H+ eq]1.16 × 10145.97%
Particulate matter [kg PM2.5 eq]5.43 × 10−123.82%
Human toxicity, cancer effects [CTUh]1.02 × 10−618.24%
Freshwater ecotoxicity [CTUe]8.77 × 1015.21%
Photochemical ozone formation [kg NMVOC eq]7.36 × 10−13.61%
Human toxicity, non-cancer effects [CTUh]1.37 × 10−61.96%
Other categories-1.18%
Table 6. ReCiPe 2016 midpoint results—most impactful categories
ReCiPe Midpoint CategoriesImpact ResultNormalization (%)
Marine ecotoxicity [kg 1,4-DCB]3.32 × 10−125.48%
Human carcinogenic toxicity [kg 1,4-DCB]6.09 × 10−117.40%
Terrestrial acidification [kg SO2 eq]8.85 × 10017.10%
Freshwater ecotoxicity [kg 1,4-DCB]2.54 × 10−116.36%
Water consumption [m3]3.91 × 10111.62%
Fine particulate matter formation [kg PM2.5 eq]2.57 × 1007.96%
Terrestrial ecotoxicity [kg 1,4-DCB]2.38 × 1011.82%
Human non-carcinogenic toxicity [kg 1,4-DCB]3.18 × 1001.69%
Other categories-0.57%
Table 7. CML-IA baseline results—most impactful categories.
CML-IA Baseline Categories.Impact ResultsNormalization (%)
Acidification [kg SO2 eq]1.06 × 10160.14%
Photochemical oxidation [kg C2H4 eq]4.26 × 10−123.44%
Marine aquatic ecotoxicity [kg 1,4-DB eq]5.25 × 10311.25%
Human toxicity [kg 1,4-DB eq]1.49 × 1012.85%
Fresh water aquatic ecotox [kg 1,4-DB eq]3.88 × 1001.77%
Other categories-0.55%
Table 8. Difference between CML-IA baseline and ILCD 2011 midpoint.
CML-IA BaselineAmountILCD 2011 Midpoint
Global warming (GWP100a) [kg CO2eq]2.21 × 1012.20 × 101Climate change [kg CO2eq]
Ozone layer depletion (ODP) [kg CFC-11 eq]2.90 × 10−72.90 × 10−7Ozone depletion [kg CFC-11 eq]
Human toxicity [kg 1,4-DB eq]1.49 × 1011.02 × 10−6Human toxicity, cancer effects [CTUh]
1.37 × 10⁻⁶Human toxicity, non-cancer effects [CTUh]
Eutrophication [kg PO4---eq]
(Eutrophication [kg P-PO4eq]
5.83 × 10⁻³
1.19 × 10⁻³
1.13 × 10⁻³Freshwater eutrophication
[kg p eq]
Table 9. Difference between CML-IA baseline and ReCiPe 2016 midpoint.
CML-IA BaselineAmountReCiPe 2016 Midpoint
Acidification [kg SO2eq]1.06 × 1018.85 × 100Terrestrial acidification [kg SO2eq]
Eutrophication [kg PO4--- eq]5.83 × 10−31.12 × 10−3Freshwater eutrophication [kg P eq]
(GWP100a) [kg CO2eq]2.21 × 1012.23 × 101Global Warming [kg CO2eq]
Human toxicity [kg 1,4-DB eq]1.49 × 1016.09 × 10−1Human carcinogenic toxicity [kg 1,4-DCB]
3.18 × 100Human non-carcinogenic toxicity [kg 1,4-DCB]
Marine aquatic ecotoxicity [kg 1,4-DB eq]5.25 × 1033.32 × 10−1Marine ecotoxicity [kg 1,4-DB eq]
Ozone layer depletion (ODP) [kg CFC-11 eq]2.90 × 10−71.25 × 10−6Stratospheric Ozone depletion [kg CFC-11 eq]
Terrestrial ecotoxicity [kg 1,4-DB eq]2.17 × 10−22.38 × 101Terrestrial ecotoxicity [kg 1,4-DB eq]
Table 10. Single scores of main components; ILCD 2011 midpoint, EC-JRC Global-Equal Weighting.
Single Score, EP Single Score, EP
Main Components[Pt]Common Components[Pt]
HP Steam SeparatorHPS1.40 × 103Moisture removerHPM8.00 × 102
HP TurbinesHPTG5.06 × 104Moisture removerLPM7.79 × 102
DH condenser HPHPC-DH6.78 × 102DeaeratorDA5.45 × 102
HP CondenserHPC1.13 × 104Cold water tankCWT5.75 × 100
Pump 1PHP17.12 × 101District Heating tankDHT2.87 × 100
Pump 2 PHP21.93 × 103WellsWLL1.35 × 105
HP Cooling towerHPCT1.35 × 104PipelinesPP1.77 × 105
LP Steam SeparatorLPS1.33 × 102Building Power PlantBPP6.37 × 104
LP TurbineLPTG6.18 × 103Building Heating StationBHS2.73 × 104
Condenser LPLPC1.43 × 103Land UseLU7.59 × 102
Pump 3PLP11.10 × 101EmissionEmi1.56 × 106
Pump 4PLP24.55 × 102OperationOpe5.27 × 103
LP Cooling towerLPCT2.24 × 103MaintenanceMan5.32 × 104
HE for DHDHHX2.20 × 103End of LifeEoL1.48 × 103
Table 11. Environmental impact balances and the corresponding auxiliary equations for the Hellisheiði power plant based on components specified in Figure 1.
ComponentEnvironmental Balance EquationAuxiliary Equation
Wells + Main Valve B ˙ in = b 1 · Ex 1 B ˙ out = b 2 · Ex 2 b 1 = b fuel kJ
b fuel kJ =   Y ˙ 1 E x 1 E x 12 Ex 26 Ex 27
HP Steam Separator B ˙ in = b 2 · Ex 2 +   Y ˙ 2
B ˙ out = b 3 · Ex 3 + b 6 · Ex 6
b 3 = b 6
HP Turbines B ˙ in = b 3 · Ex 3 +   Y ˙ 3
B ˙ out = b 4 · Ex 4 + b THp · Wt Hp
b 3 = b 4
DH condenser HP B ˙ in = b 4 · Ex 4 + b 13 · Ex 13 +   Y ˙ 4
B ˙ out = b 4 b · Ex 4 b + b 14 · Ex 14
b 13 = 0 b 4 = b 4 b
Condenser HP B ˙ in = b 4 b · Ex 4 b + b 18 · Ex 18 + Y 5
B ˙ out = b 5 · Ex 5 + b 19 · Ex 19
b 18 = b 19
b 4 b = b 5
Pump1 B ˙ in = b 5 · Ex 5 + b P 1 · Wp 1 +   Y ˙ 6
B ˙ out = b 16 · Ex 16
b p 1 = b t tot
Mixing Point1 B ˙ in = b 16 · Ex 16 + b 19 · ex 19 +   Y ˙ 7
B ˙ out = b 17 · Ex 17
-
Pump2 B ˙ in = b 17 · Ex 17 + b P 2 · Wp 2 +   Y ˙ 8
B ˙ out = b 25 · Ex 25
b p 2 = b t tot
HP Cooling tower B ˙ in = b 25 · Ex 25 + b 28 · Ex 28 +   Y ˙ 9
B ˙ out = b 18 · Ex 18 + b 26 · Ex 26 + b 29 · Ex 29
b 28 = 0
b 18 = b 26
Valve 2 B ˙ in = b 6 · Ex 6 +   Y ˙ 10
B ˙ out = b 7 · Ex 7
-
LP Steam Separator B ˙ in = b 7 · Ex 7 +   Y ˙ 11
B ˙ out = b 8 · Ex 8 + b 11 · Ex 11
b 8 = b 11
LP Turbine B ˙ in = b 8 · Ex 8 +   Y ˙ 12
B ˙ out = b 9 · Ex 9 + b Tlp · Wt lp
b 8 = b 9
b t tot = b THp · Wt Hp + b Tlp · Wt lp Wt Hp + Wt lp
Condenser LP B ˙ in = b 9 · Ex 9 + b 20 · Ex 20 +   Y ˙ 13
B ˙ out = b 10 · Ex 10 + b 21 · Ex 21
b 20 = b 21
b 10 = b 9
Pump 3 B ˙ in = b 10 · Ex 10 + b P 3 · Wp 3 +   Y ˙ 14
B ˙ out = b 22 · Ex 22
b p 3 = b t tot
Mixing Point2 B ˙ in = b 22 · Ex 22 + b 21 · Ex 21 +   Y ˙ 15
B ˙ out = b 23 · Ex 23
-
Pump 4 B ˙ in = b 23 · Ex 23 + b P 4 · Wp 4 +   Y ˙ 16
B ˙ out = b 24 · Ex 24
b p 4 = b t tot
LP Cooling tower B ˙ in = b 24 · Ex 24 + b 30 · Ex 30 +   Y ˙ 17
B ˙ out = b 20 · Ex 20 + c 27 · Ex 27 + c 31 · Ex 31
b 30 = 0
b 20 = b 27
HE for DH B ˙ in = b 11 · Ex 11 + b 14 · Ex 14 +   Y ˙ 18
B ˙ out = b 15 · Ex 15 + b 12 · Ex 12
b 11 = b 12
Table 12. Exergo-environmental variables of the Hellisheiði plant.
ComponentSingle Score,
EP [Pts]
k
[Pts/s]
D,k
[Pts/s]
TOT,k
[Pts/s]
fb,k
[%]
rb,k
[–]
Wells + Main Valve907,9641.13 × 10−32.05 × 10−41.33 × 10−30.8470.214
HP Steam Separator14001.74 × 10−60.00 × 1001.74 × 10−610.002
HP Turbines513,8686.39 × 10−41.49 × 10−47.88 × 10−40.8111.34
DH condenser HP28,4623.54 × 10−58.95 × 10−64.43 × 10−50.79813.6
Condenser HP435,3915.41 × 10−41.37 × 10−46.78 × 10−40.79910.2
Pump1102.51.28 × 10−72.35 × 10−81.51 × 10−70.8440.638
Mixing Point128263.51 × 10−69.34 × 10−61.29 × 10−50.2740.017
Pump228073.49 × 10−66.59 × 10−74.15 × 10−60.8410.650
HP Cooling tower145,0491.80 × 10−44.32 × 10−46.12 × 10−40.2951.84
Valve 259,3527.38 × 10−51.91 × 10−59.29 × 10−50.7940.496
LP Steam Separator1331.65 × 10−70.00 × 1001.65 × 10−710.00103
LP Turbine34,0184.23 × 10−51.34 × 10−55.57 × 10−50.7590.521
Condenser LP58,6197.29 × 10−52.76 × 10−51.00 × 10−40.7268.92
Pump 315.971.99 × 10−83.73 × 10−92.36 × 10−80.8420.644
Mixing Point2353.44.40 × 10−71.57 × 10−62.01 × 10−60.2180.0181
Pump 4670.78.34 × 10−71.62 × 10−79.96 × 10−70.8370.663
LP Cooling tower12,8321.60 × 10−54.54 × 10−56.14 × 10−50.2600.875
HE for DH48,8166.07 × 10−52.25 × 10−58.32 × 10−50.7302.39
Total2,252,679.62.80 × 10−31.07 × 10−33.87 × 10−3
Publisher’s Note: MDPI stays neutral with regard to jurisdictional claims in published maps and institutional affiliations.

