
Influence of Solar Concentrator in the Form of Luminescent PMMA on the Performance of a Silicon Cell


Department of Technologies and Installations for Waste Management, Silesian University of Technology, 44-100 Gliwice, Poland
*
Author to whom correspondence should be addressed.
Sustainability 2021, 13(4), 2086; https://0-doi-org.brum.beds.ac.uk/10.3390/su13042086
Submission received: 28 December 2020
/
Revised: 26 January 2021
/
Accepted: 29 January 2021
/
Published: 16 February 2021
(This article belongs to the Special Issue Environmental Science and Sustainable Waste Management)
Abstract
:The methods of production of electricity from renewable sources are currently highly researched topics. The reason for this is growing social awareness regarding the environmental impact of traditional energy technologies. The main aim of this study is to describe the results of using silicon cell technology and dye concentrator in a single system. The experiment presented in the paper was conducted in a laboratory environment using a dye concentrator in the form of tinted and luminescent acrylic glass (polymethyl methacrylate, PMMA). The experiment was conducted using a few measurement calibrations for the described system, such as different temperatures of the researched silicon cell or different intensity of illuminance from a solar simulator. The results of the experiment showed increase in the performance of the solar cell between 0.05% and 1.42% depending on the pigments used in the concentrator. The highest results were achieved for luminescent red PMMA and on average the improvement was 1.21%. This shows us the potential for the implementation of a luminescent dye concentrator in solar electric technology.
1. Introduction
Using electricity in everyday life is common for a typical citizen of Europe. According to data shown by Eurostat, the net electricity generation is currently on a stable level; in 2018, it was around 2806 TWh, but it should be noted that, according to archive data from 2008, it was 2844 TWh. This value gives a wrong impression that energy consumption is stable, but when analyzing data provided for Europe, we can also find out that electricity consumption by households increased by 1.3% in the period between 2008 to 2018. The share of renewable sources in electricity generation grew from 16.6% in 2008 to 28.5% in 2018 [1]. The reason for this increase is the European Union’s Directive 28/2009/EC which defines the aim for the share of renewable energy in the final electricity generation for each of its member states [2]. The first directive defined the aim for 2020, and currently there are new aims for Europe which specify the level of 32% for renewable energy in the final energy consumption. That information shows that it is necessary to carry out studies aimed to increase the performance of photovoltaic systems, especially in case of countries with low solar illuminance. It should also be noted that the European Union uses a market-based instrument to stimulate the growth of renewable energy sources as a potential producer of electricity in Europe. That is why each member state of the European Union is obligated to support consumers by:
- reducing the cost and risk of investments,
- reducing demand for new installations,
- providing greater legal certainty for investments [3].
The basic assumption for Europe in terms of research and modernization of solutions using green renewable energy as a source for electricity is to decarbonize the economy and decrease the impact of transport, as well as heat and energy sectors on the natural environment. The plan of the European Renewable Energy Council (EREC) assumes the goal of a 55% share of electric vehicles in 2050, which would consume around 400 TWh per year, adding ~20% to Europe’s current electricity consumption. The heating sector is quite problematic because it has a seasonal nature in Europe. The 2-degree presented by International Energy Agency predicts that by 2050, 68% of Europe’s electricity production will come from renewable sources, 23% from nuclear power plants, and the remaining 9% from traditional technologies which use fossil fuels, preferably natural gas [4].
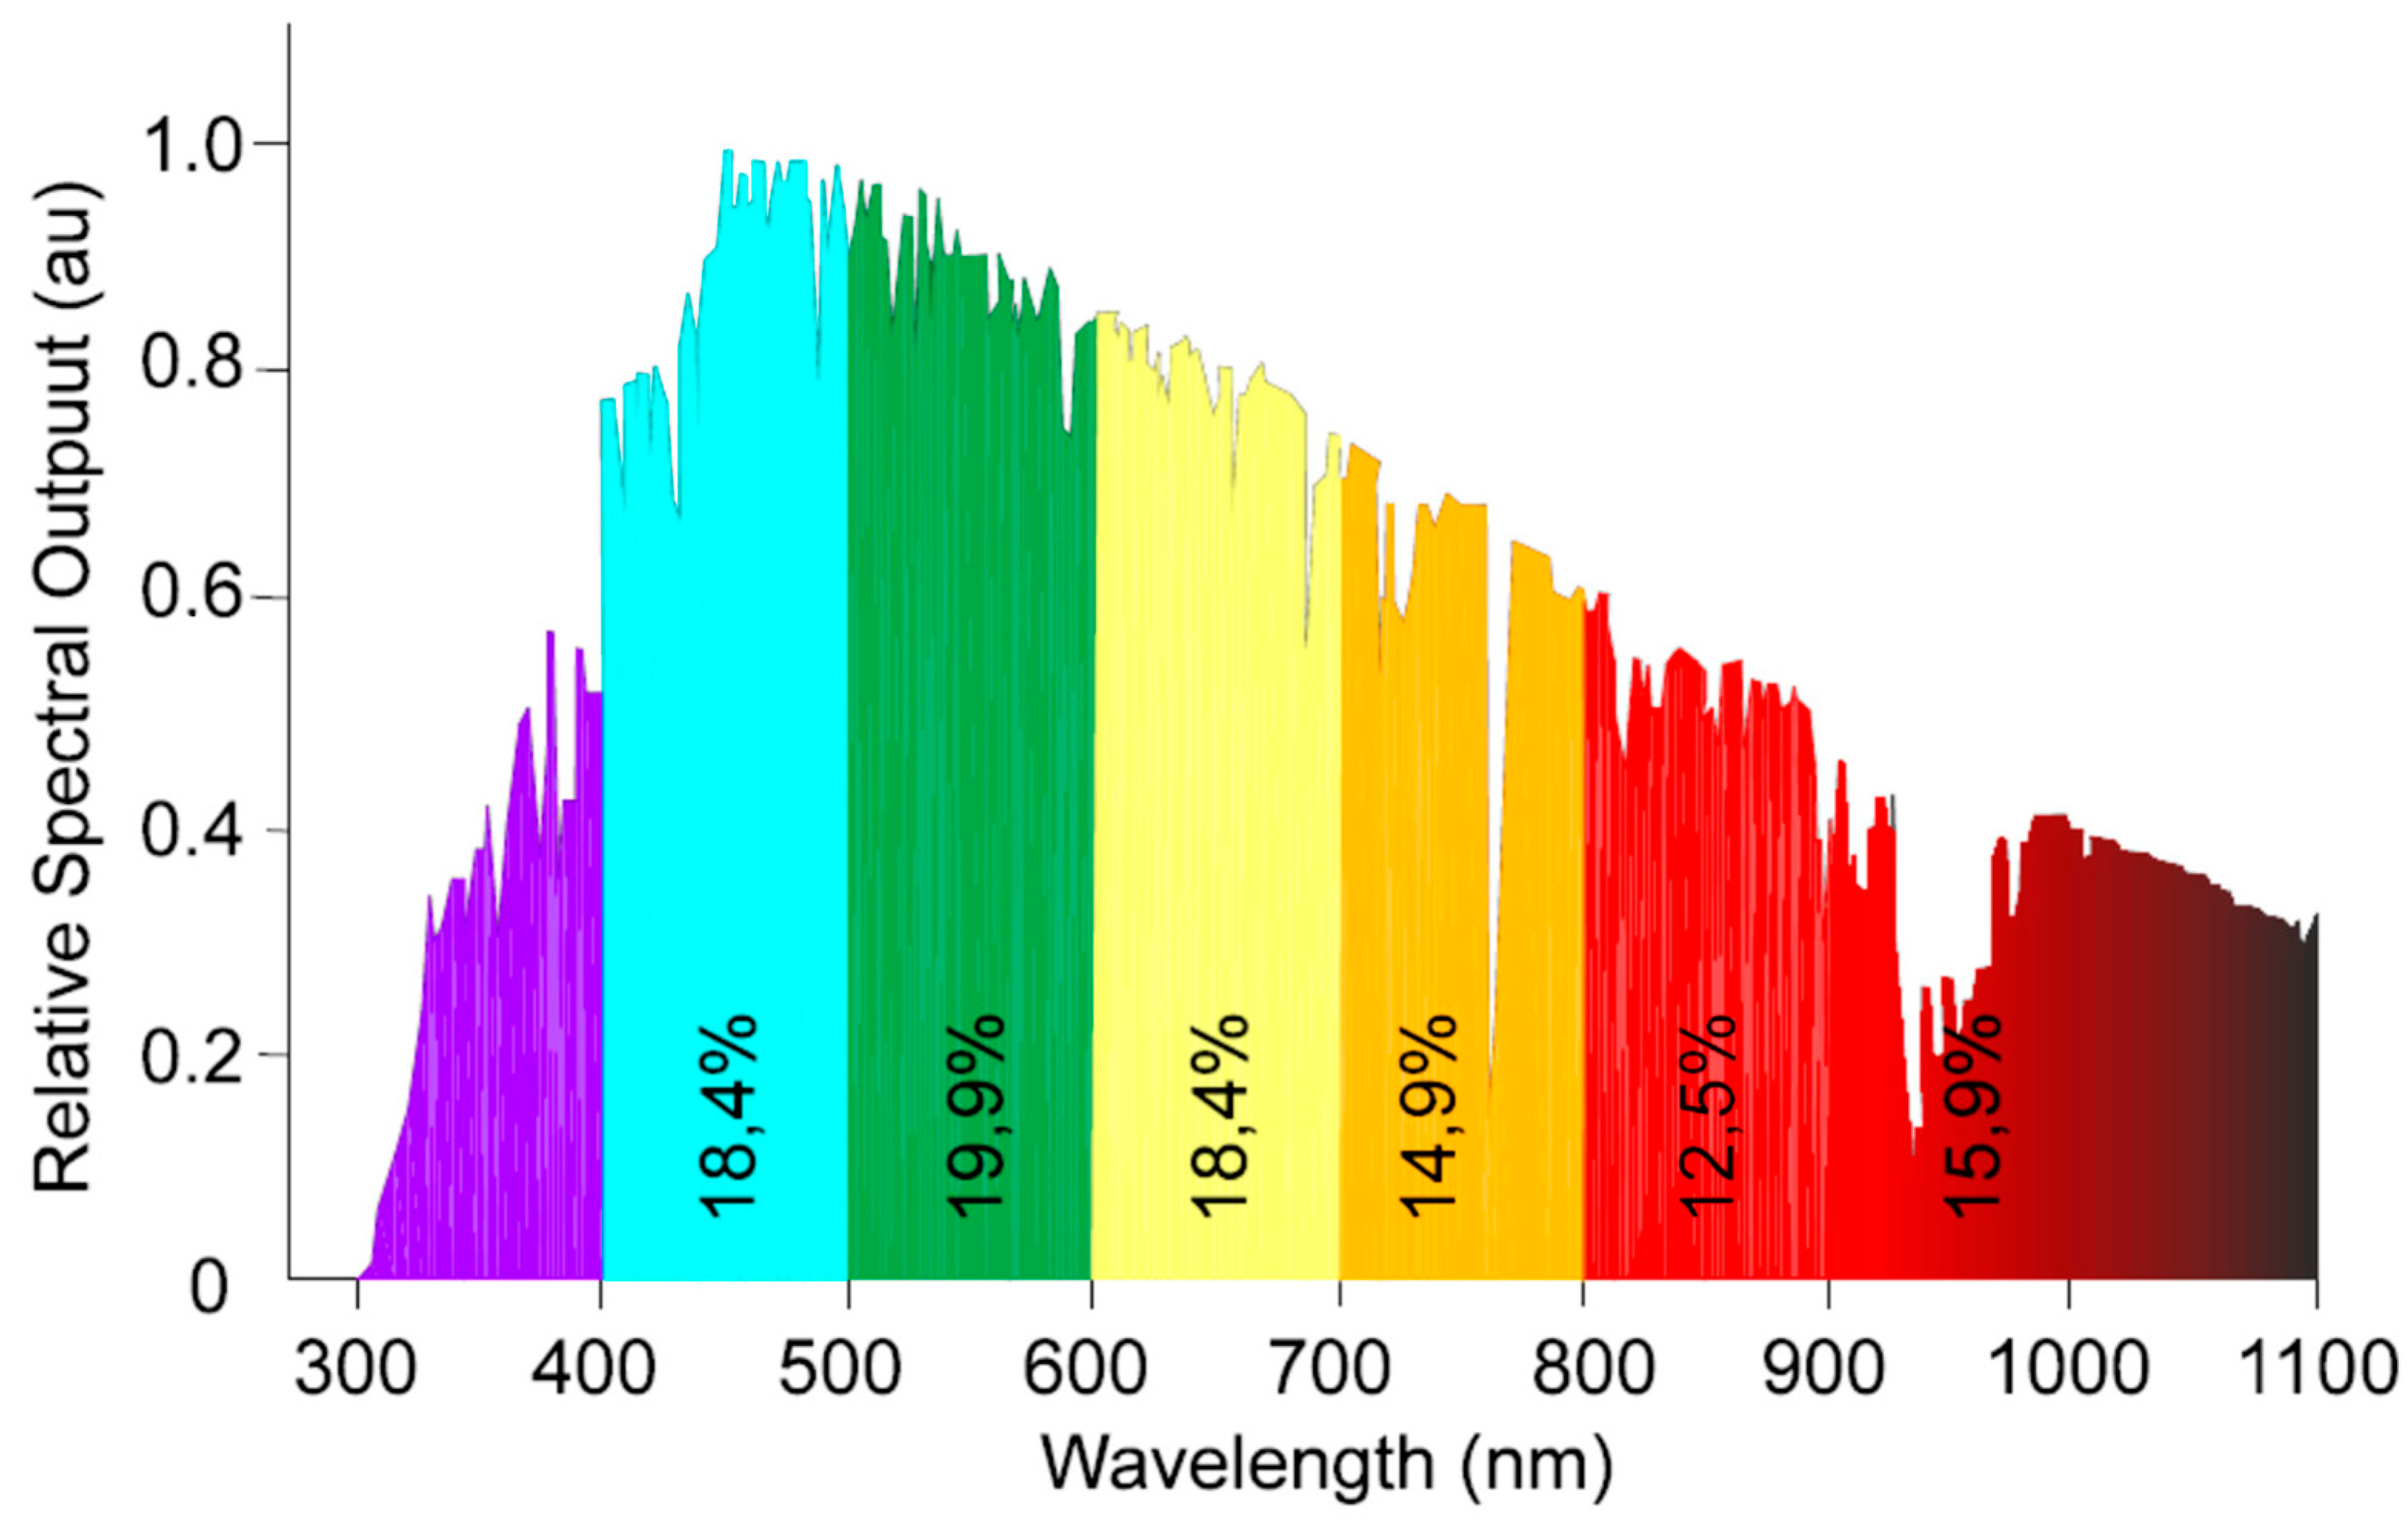
The performance of a solar installation depends on many factors. The efficiency of a photovoltaic module is strictly associated with the temperature in which it works, materials used to produce the cell, the type of the anti-reflective layer used in the cell, the angle between the module and the sun, and, of course, the technologies used to manufacture the solar cell [5]. One of the methods to increase the energy yield from renewable energy sources is to use new and more efficient technologies. The problem with this assumption is the fact that we will be able to see the result of their exploitation only after replacing currently exploited technology. It is not profitable from the point of view of investors that already have efficient installations that produce energy for their consumers and can be operated for several more years. That is the reason for developing new solutions which will allow us to increase the performance of the most popular photovoltaic (PV) technologies by implementing a few low-cost modifications. To properly analyze the idea of increasing the efficiency of silicon cells by using dye concentrators, we need to consider several different aspects. The first one is the light source. In the natural environment, the source of irradiance is the sun, and in a laboratory, a solar simulator. The goal of a solar simulator is to simulate natural sunlight conditions. Figure 1 shows the distribution of spectral irradiance for natural light [6].
The spectrum distribution for the natural irradiance shown in Figure 1 is extremely important because it allows the analysis of specific technology in artificial (laboratory) conditions in a way which allows us to compare it to a technology exploited in natural conditions. Therefore, we can assume that the results achieved in the laboratory can also be obtained in the natural environment. Another important factor that needs to be preserved during research on solar technology are standard testing conditions (STC). For photovoltaic technology, the standard test condition is defined as an irradiance of 1000 W/m2, an AM (air mass) of 1.5, and a device temperature of 25 °C [8]. Those normalized conditions allow comparing results from different technologies tested around the world. Thanks to that it is possible to compare the performance of the silicon cell technology with the efficiency of the dye solar cell (DSSC) or perovskite technologies.
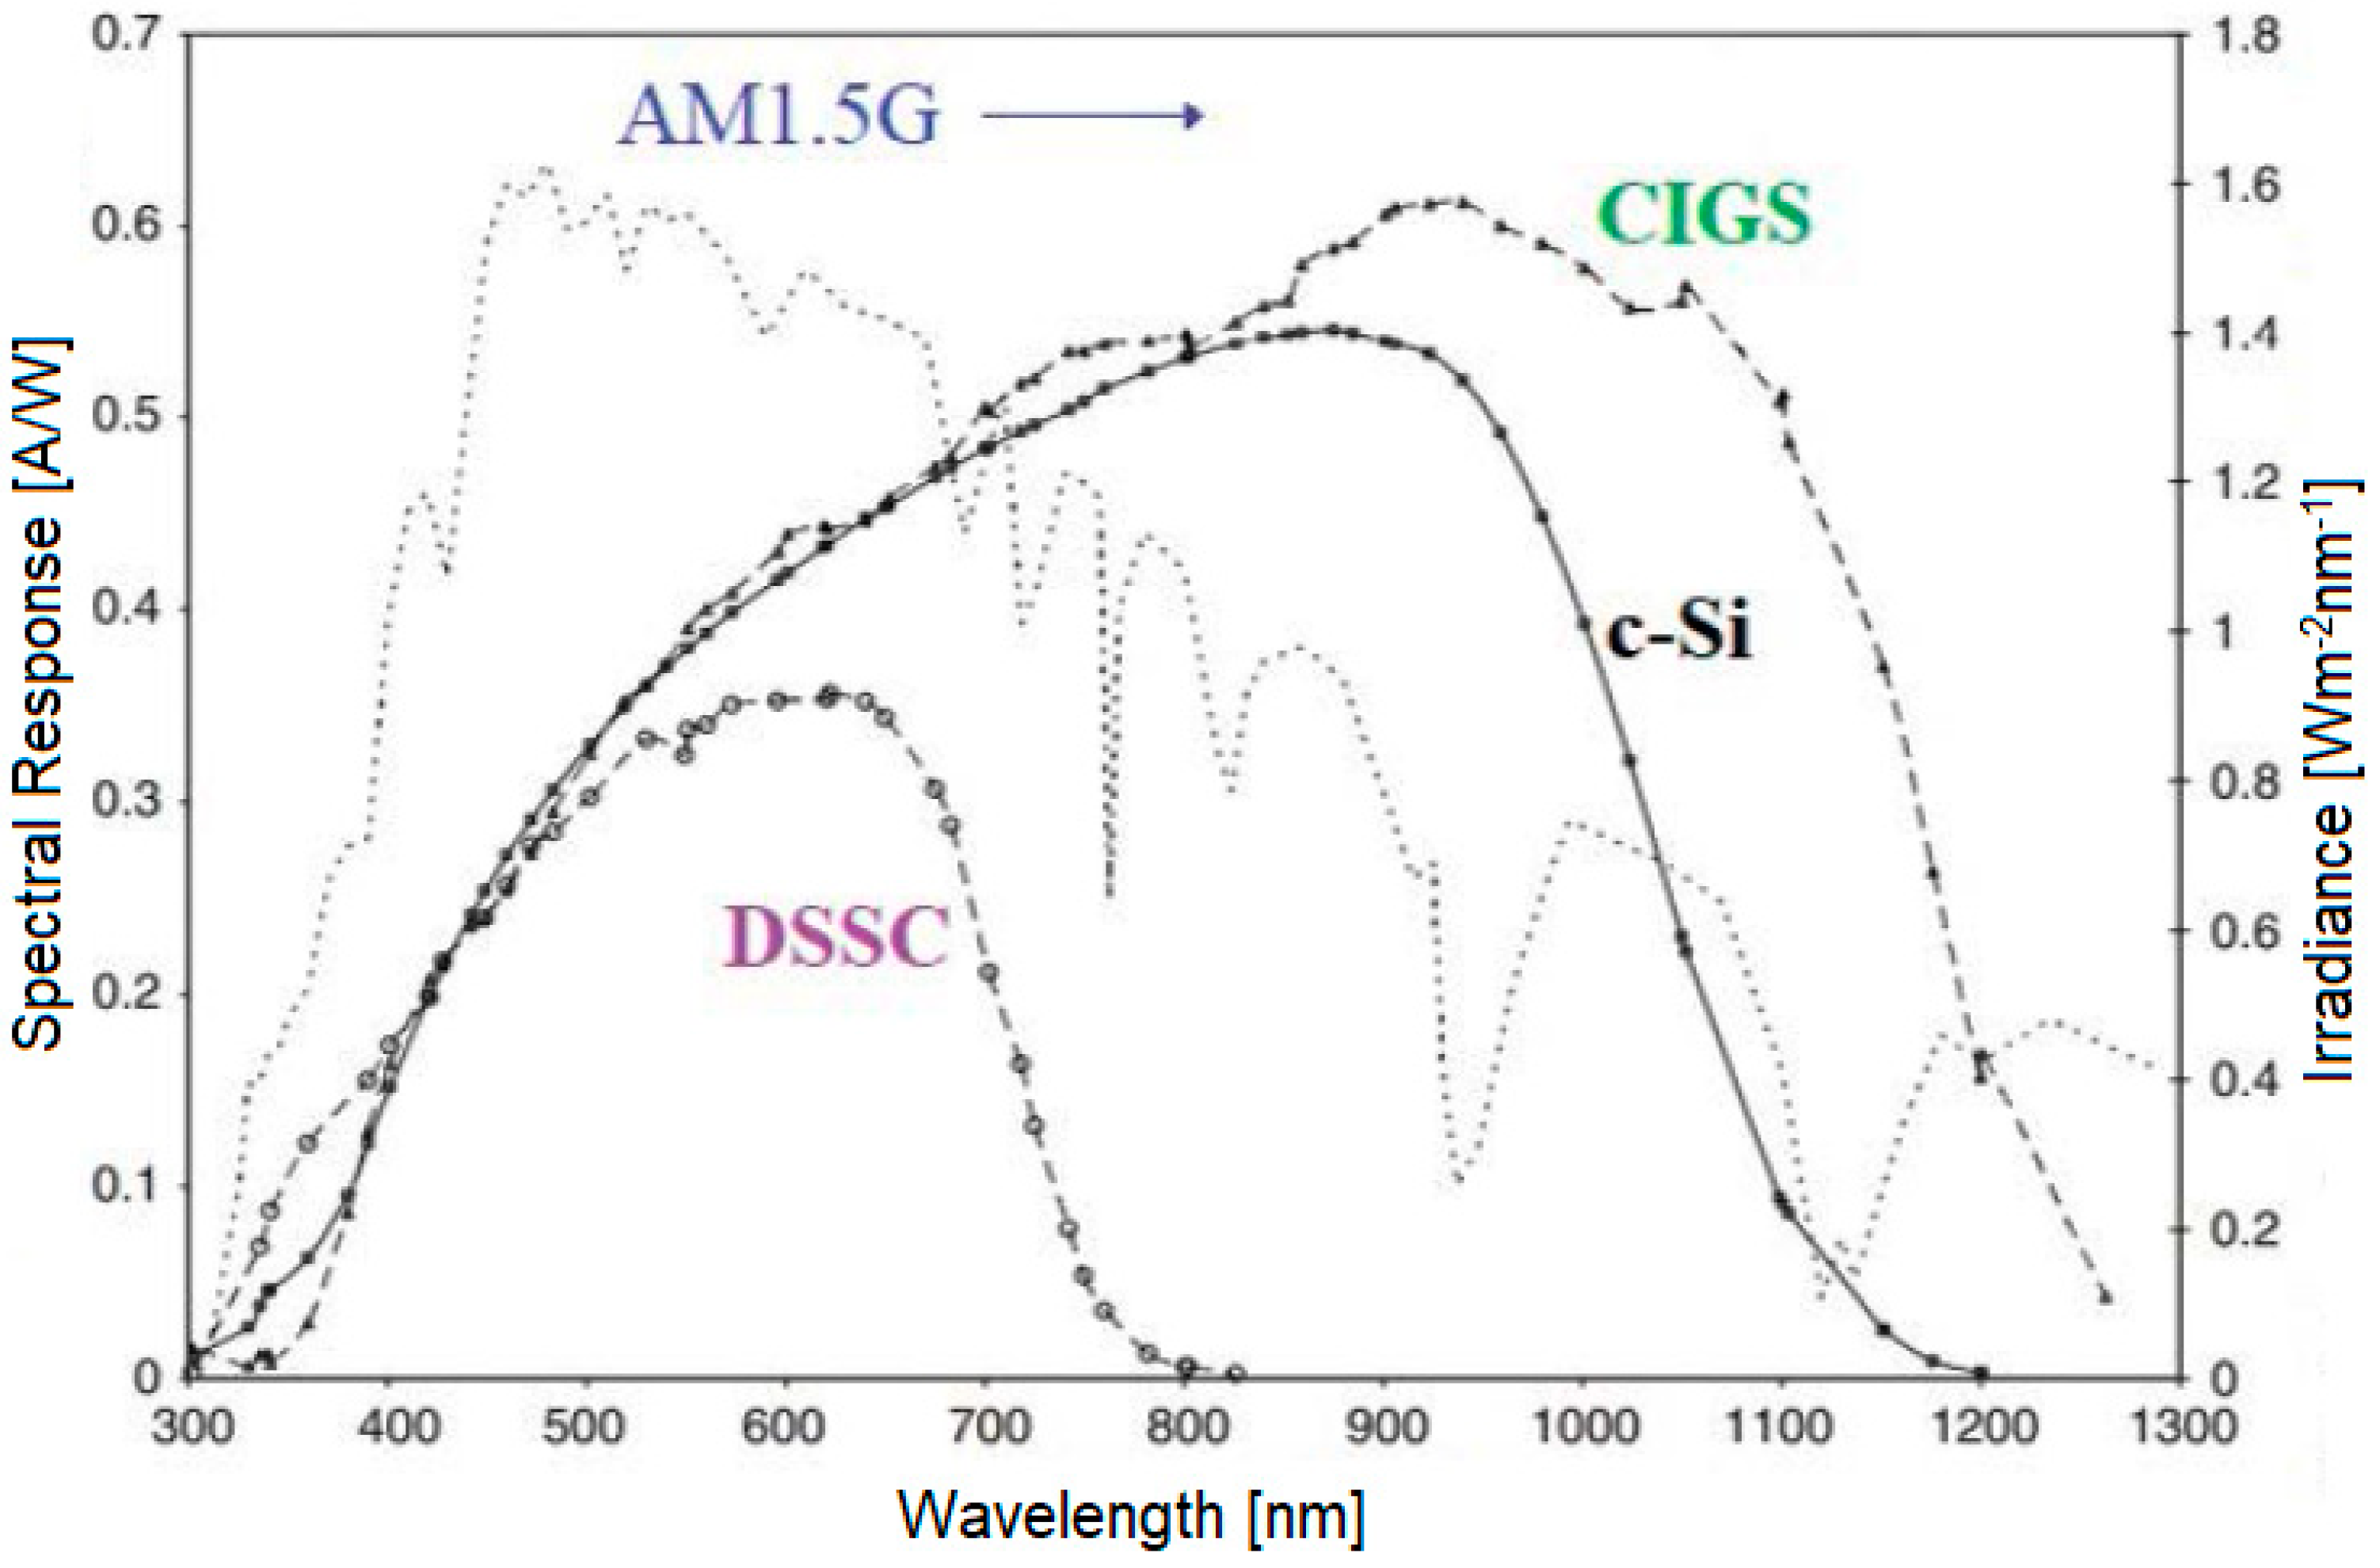
Each technology used in photovoltaic has different characteristics; the silicon cells and dye concentrators have various responses to light of a specific spectrum. For example, a silicon cell’s response is the best at wavelength of 800 to 950 nm, and between 550 and 650 nm for DSSC. This means that a silicon cell will work more efficiently with red light, and DSSC (depending on the materials which were used to produce them) in green or yellow light. Figure 2 shows how different photovoltaic technologies respond to the solar spectrum irradiance [9].
Many concentrator technologies allow us to increase the performance of the photovoltaic installation. The Fresnel lens is the most used optical element in concentrator photovoltaic systems [10]. This type of element can be used in the circular and rectangular flat form. The research provided by Arthur Davis reported that a circular shape has better transmittance (82%) than a rectangular shape (80%) [11]. The optical efficiency for this kind of technology is strictly connected to focal length. The value of optical efficiency can be calculated using the following Formula (1).
where Pin is the power at the entrance of the system, and Pout is the power at the exit of the system.
The researcher in his experiment used polymethyl methacrylate (PMMA) as a material from which the lens was fabricated. His results show that the optical efficiency for 175 mm focal length is 56.58% and 88.3% for 700 mm [12]. The curved form of Fresnel lens was also researched by Leutz et al., Akisawa et al., and Pham et al. The results for this type of shape shown that optical efficiency varies from 64% for 4 m2 and 72% for 18 m2 lens in the case of Leutz’s research; Akisawa et al., and Pham et al. reported higher results (82%). In both studies, the lens cooperates with the solar cell of 2 m2 in diameter [13,14,15].
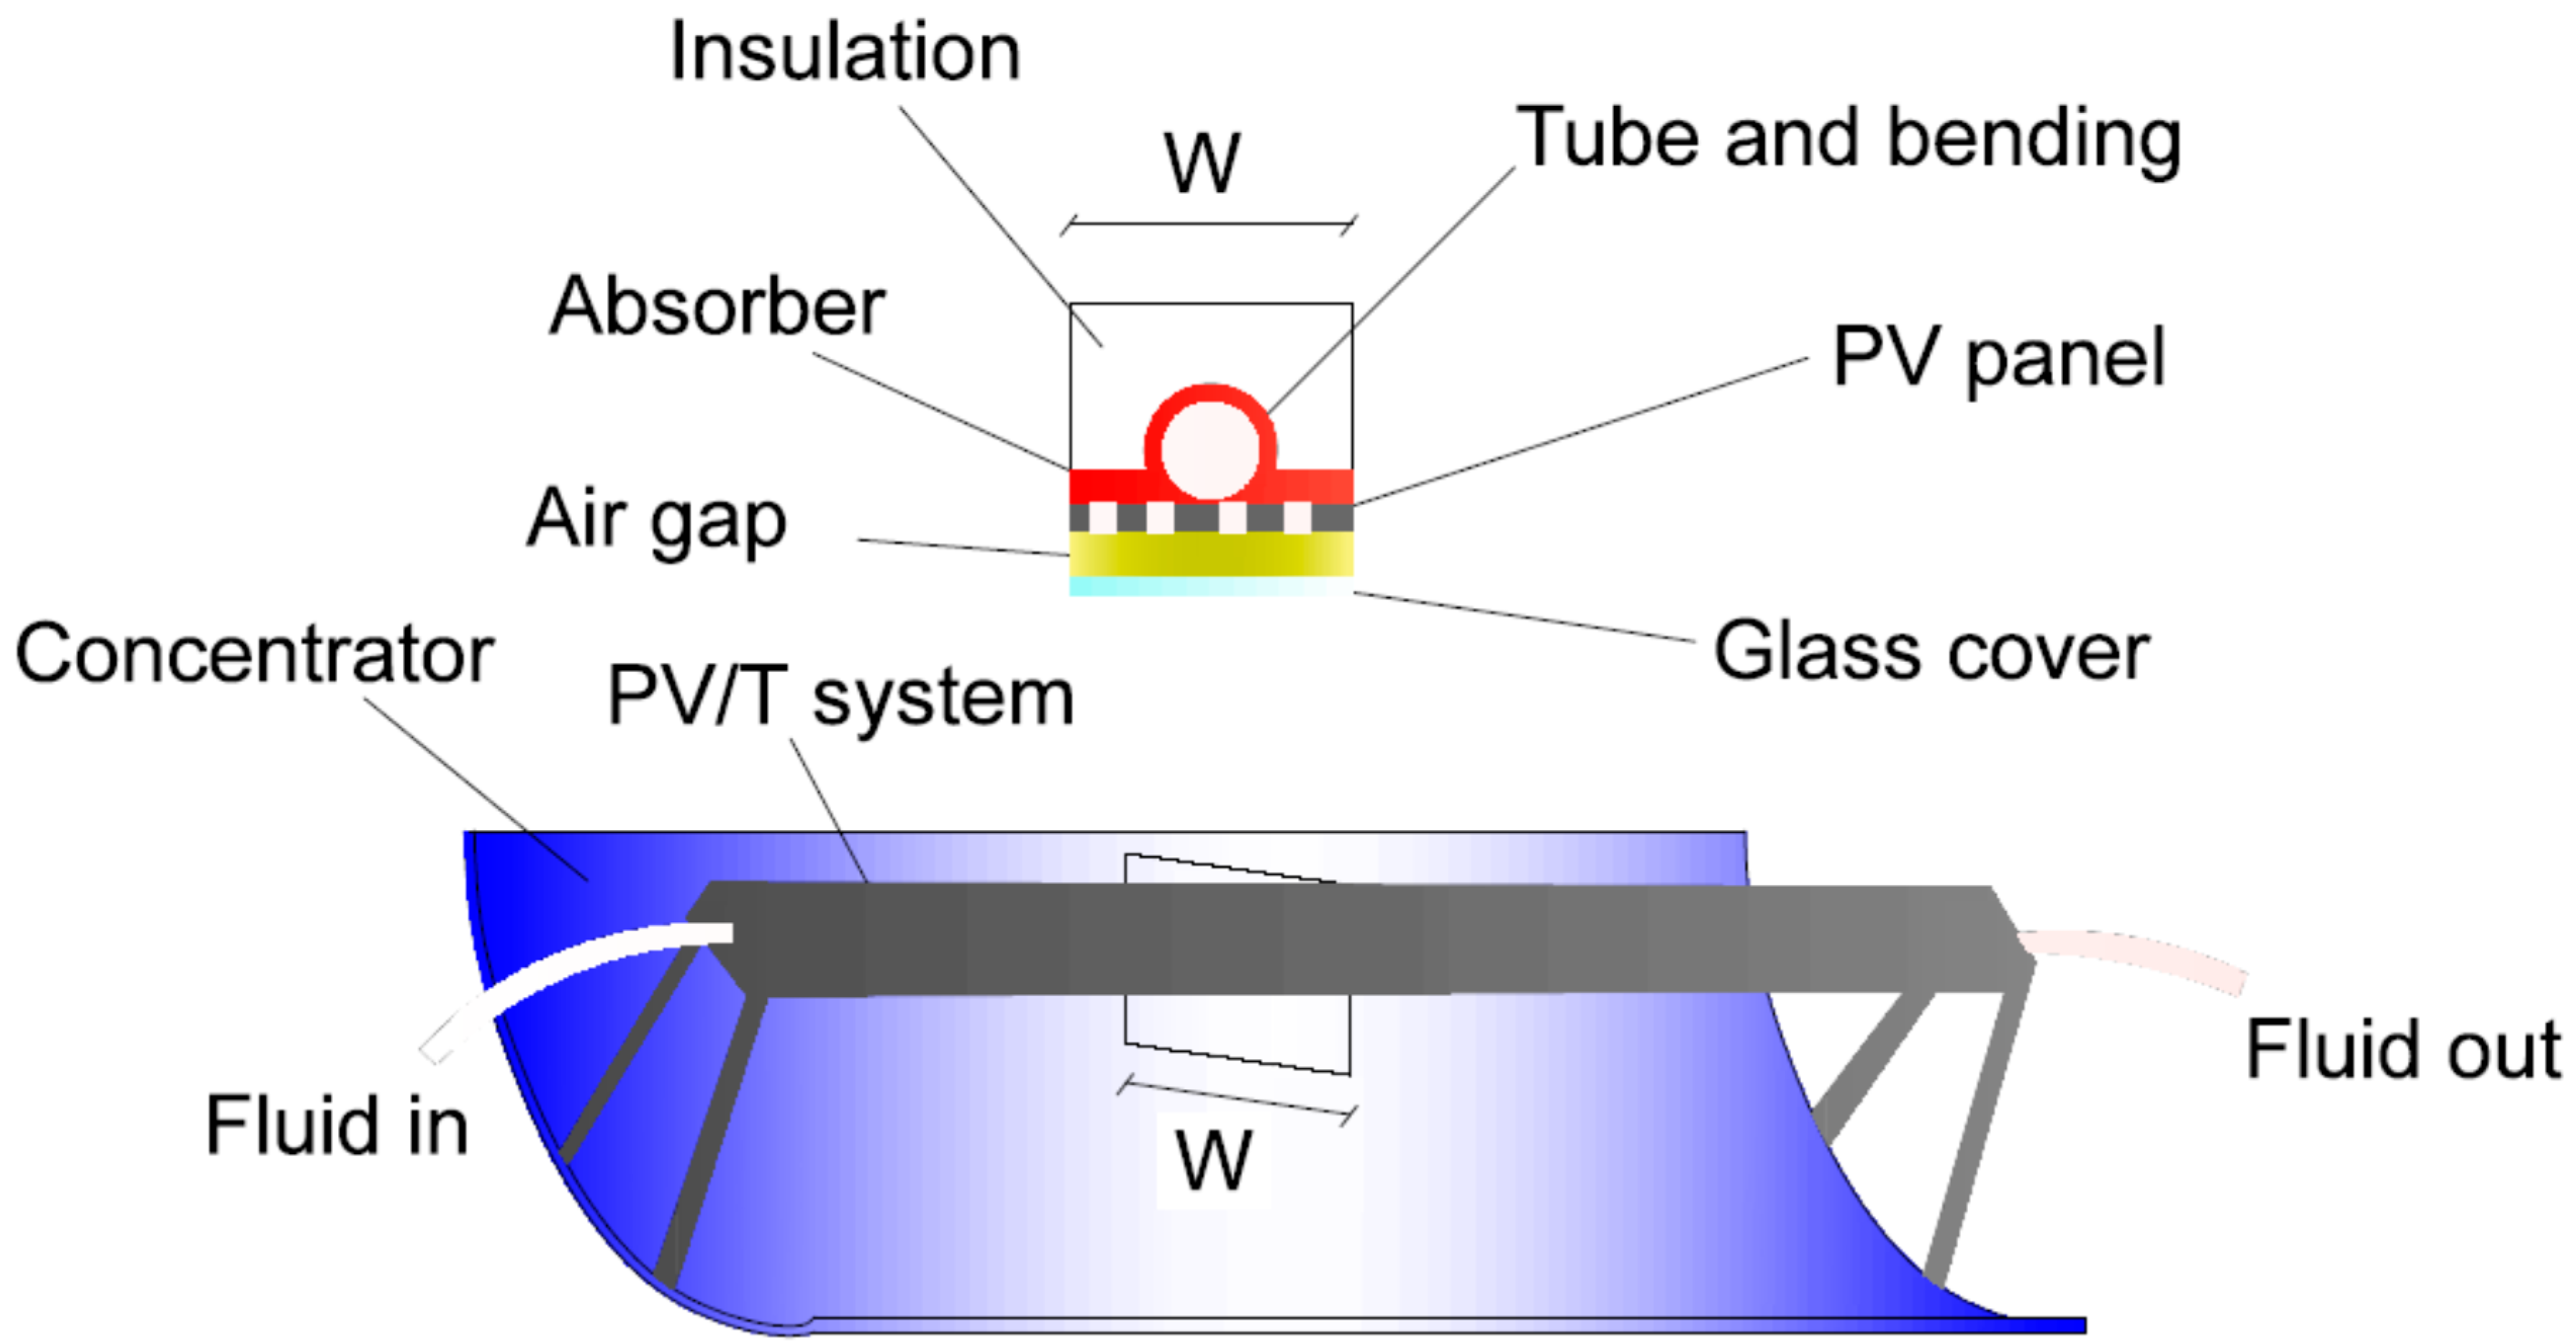
The other type of concentrator technology is the parabolic mirror. In this solution, the concentrator is the part that collects the light from the area and redirects it to the photovoltaic installation (modules). The study of Canavarro et al. showed that a low concentration equal to 70 suns can give results of 80% of optic efficiency [16]. The problem with this type of solution is the fact that it needs long-term positioning to analyze. The performance of the system is strictly connected to the sun tracking mechanism. The correct positioning of the parabolic mirror shows the best results in the overall performance of the photovoltaic installation. Excluding the sun-tracking mechanism, the most important problem for traditional solar concentrators is the increase in temperature of the solar cell after redirecting sunlight by the concentrator. The typical photovoltaic module shows a decrease in its power output on the average value of 0.3% per rising of 1 °C. The answer for this occurrence can be research presented by Yazdanifard et al. The study shows a simulation for the system which uses a cylinder-parabolic concentrator (CPV) for a CPV/thermal installation (Figure 3). As a result, the energy efficiency was raised from 7.12% (for equivalent CPV/T system) to 10.63% [17].
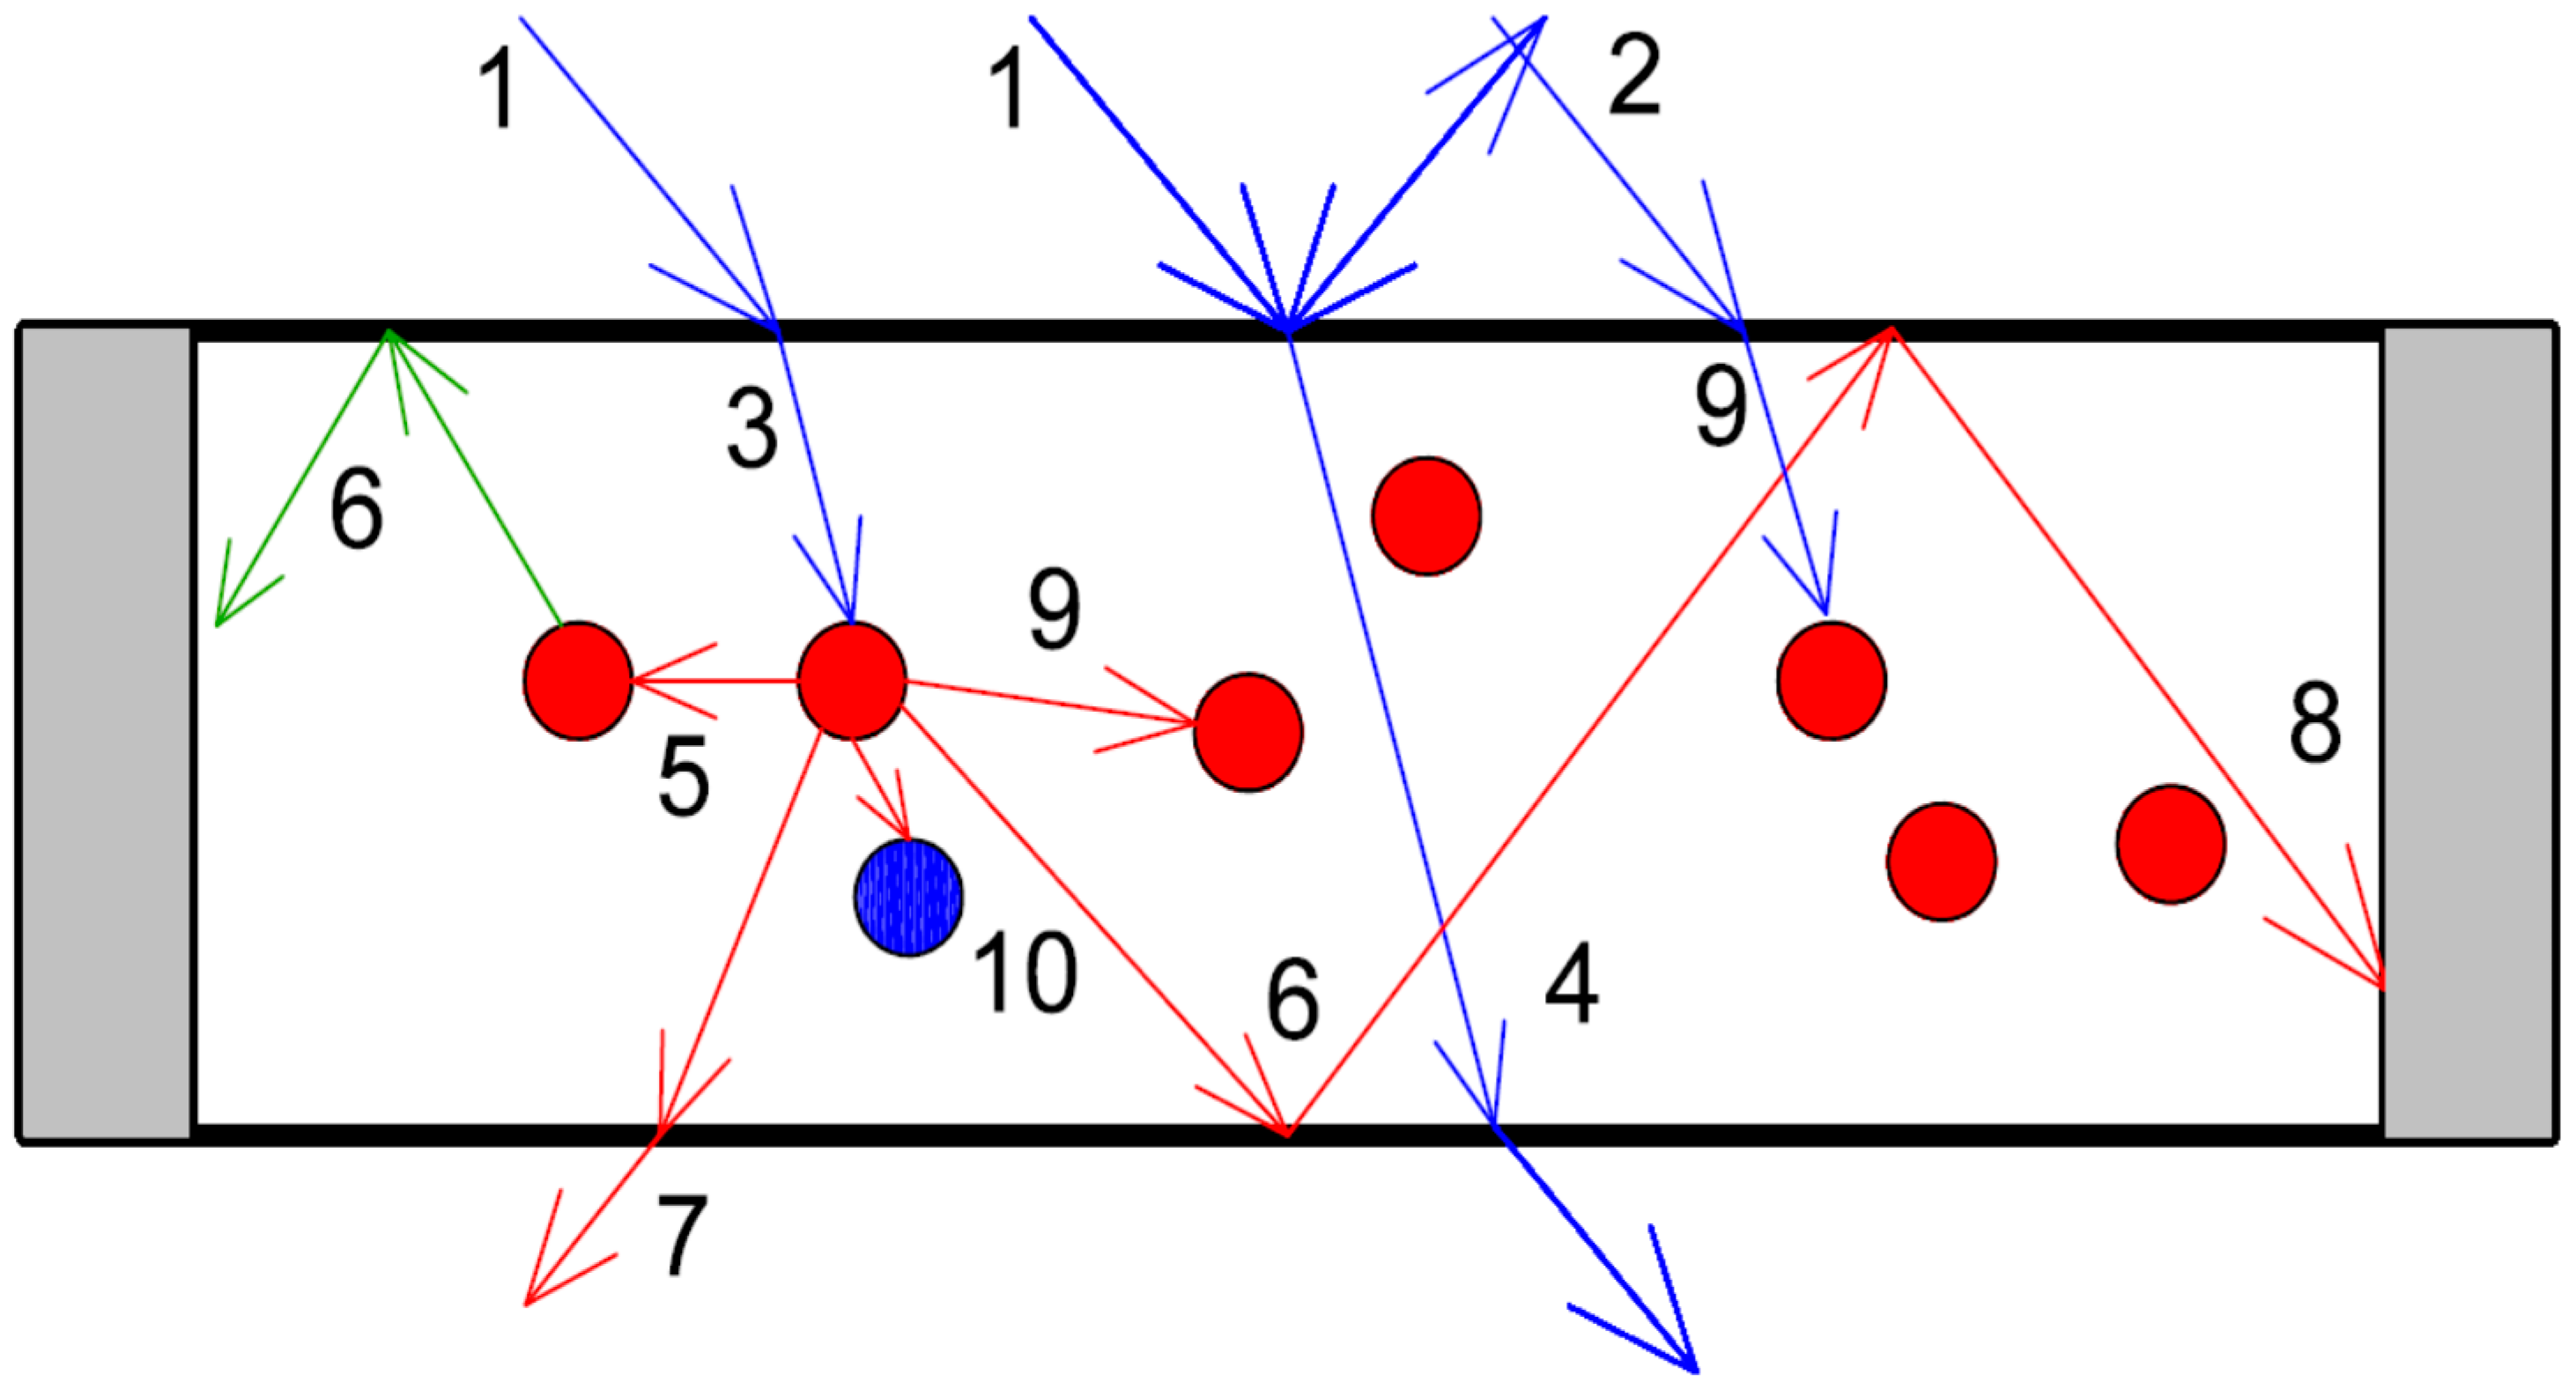
A concentrator in a form of luminescence PMMA can be included in the luminescent solar concentrator technology (LSC). LSC, which contains luminescence pigment, partially curves, and absorbs sunlight to fluoresce it at a longer wavelength [9,18,19]. This concept is called the Stokes shift and describes the shift between the absorbed and emitted light in the fluorescence [20,21,22,23]. It should be noted that the technology that combines the concentration of irradiance and emission of light after Stokes shifting can be used only after analyzing spectral response for a solar cell, which was shown in Figure 2 [23]. The luminescent solution has many advantages over other types of concentrator technology. The most important is the fact that it can work without direct irradiation, which is especially important from the perspective of the region of the world in which natural light is dispersed [24,25]. Thanks to that quality from the perspective of efficiency it can be successfully implemented in solar installation. The other advantage of this technology is that it can work without the need of a sun-tracking mechanism and does not need large elements that occupy the large area around the cells/modules. The research also indicates that they can absorb light from a wide wavelength range [R]. The working principle of LSC is shown in Figure 4, which shows the light route in the luminescent concentrator. At first, the light falls on the surface of the concentrator (1 natural irradiance) and part of it is absorbed (3), but the other part is reflected by the surface of the concentrator (2). The absorbed light part goes through the material of the concentrator (4) and the others are absorbed and reflected by the pigments (9), reabsorbed by neighbor dye molecules (5), and lost during transmission in the material (10). The numbers (6) in the schema are an escape-cone loss, (7) is transmitted radiation, and (8) is non-radiative decay [26].
The planar LSC is one of the technologies that contributes to the zero-energy building (eco-friendly building) as a material and concept implemented with windows facades. This allows transforming traditional windows into energy-producing units [27]. The implementation of LSC panel in noise barrier material in the Netherland is an example of real-world adaptation for this solution [28,29,30]. The other investigated geometry is in the cylindrical form [31,32,33]. The theoretical simulation shows that this type of form shows higher optical concentration than its planar counterpart. The literature says that the additional increase is around 4.5%. This value is even higher in real conditions, according to the experiment which tested a multi-cylindrical bundle and a layered planar LSC; the value for optical concentration for the bundle was around 5.28%, which is 3.5 times higher than the results shown by planar LSC (1.54%) [34].
This paper aims to find out the change in working parameters for silicon cells surrounded by luminescent planar PMMA. Such a solution is the most optimal form from the perspective of the author, covering working silicon cells with luminescent plate resulting in lower working parameters for the studied solar cells. This paper presents results on the laboratory scale. The implementation of the proposed solution in the real condition is under further investigation.
2. Materials and Methods
In the presented research, we used clear polycrystalline silicon solar cells. The test conducted during the research was repeated at a defined temperature for different irradiation. The basic parameters for silicon cells in the STC condition are presented in Table 1.
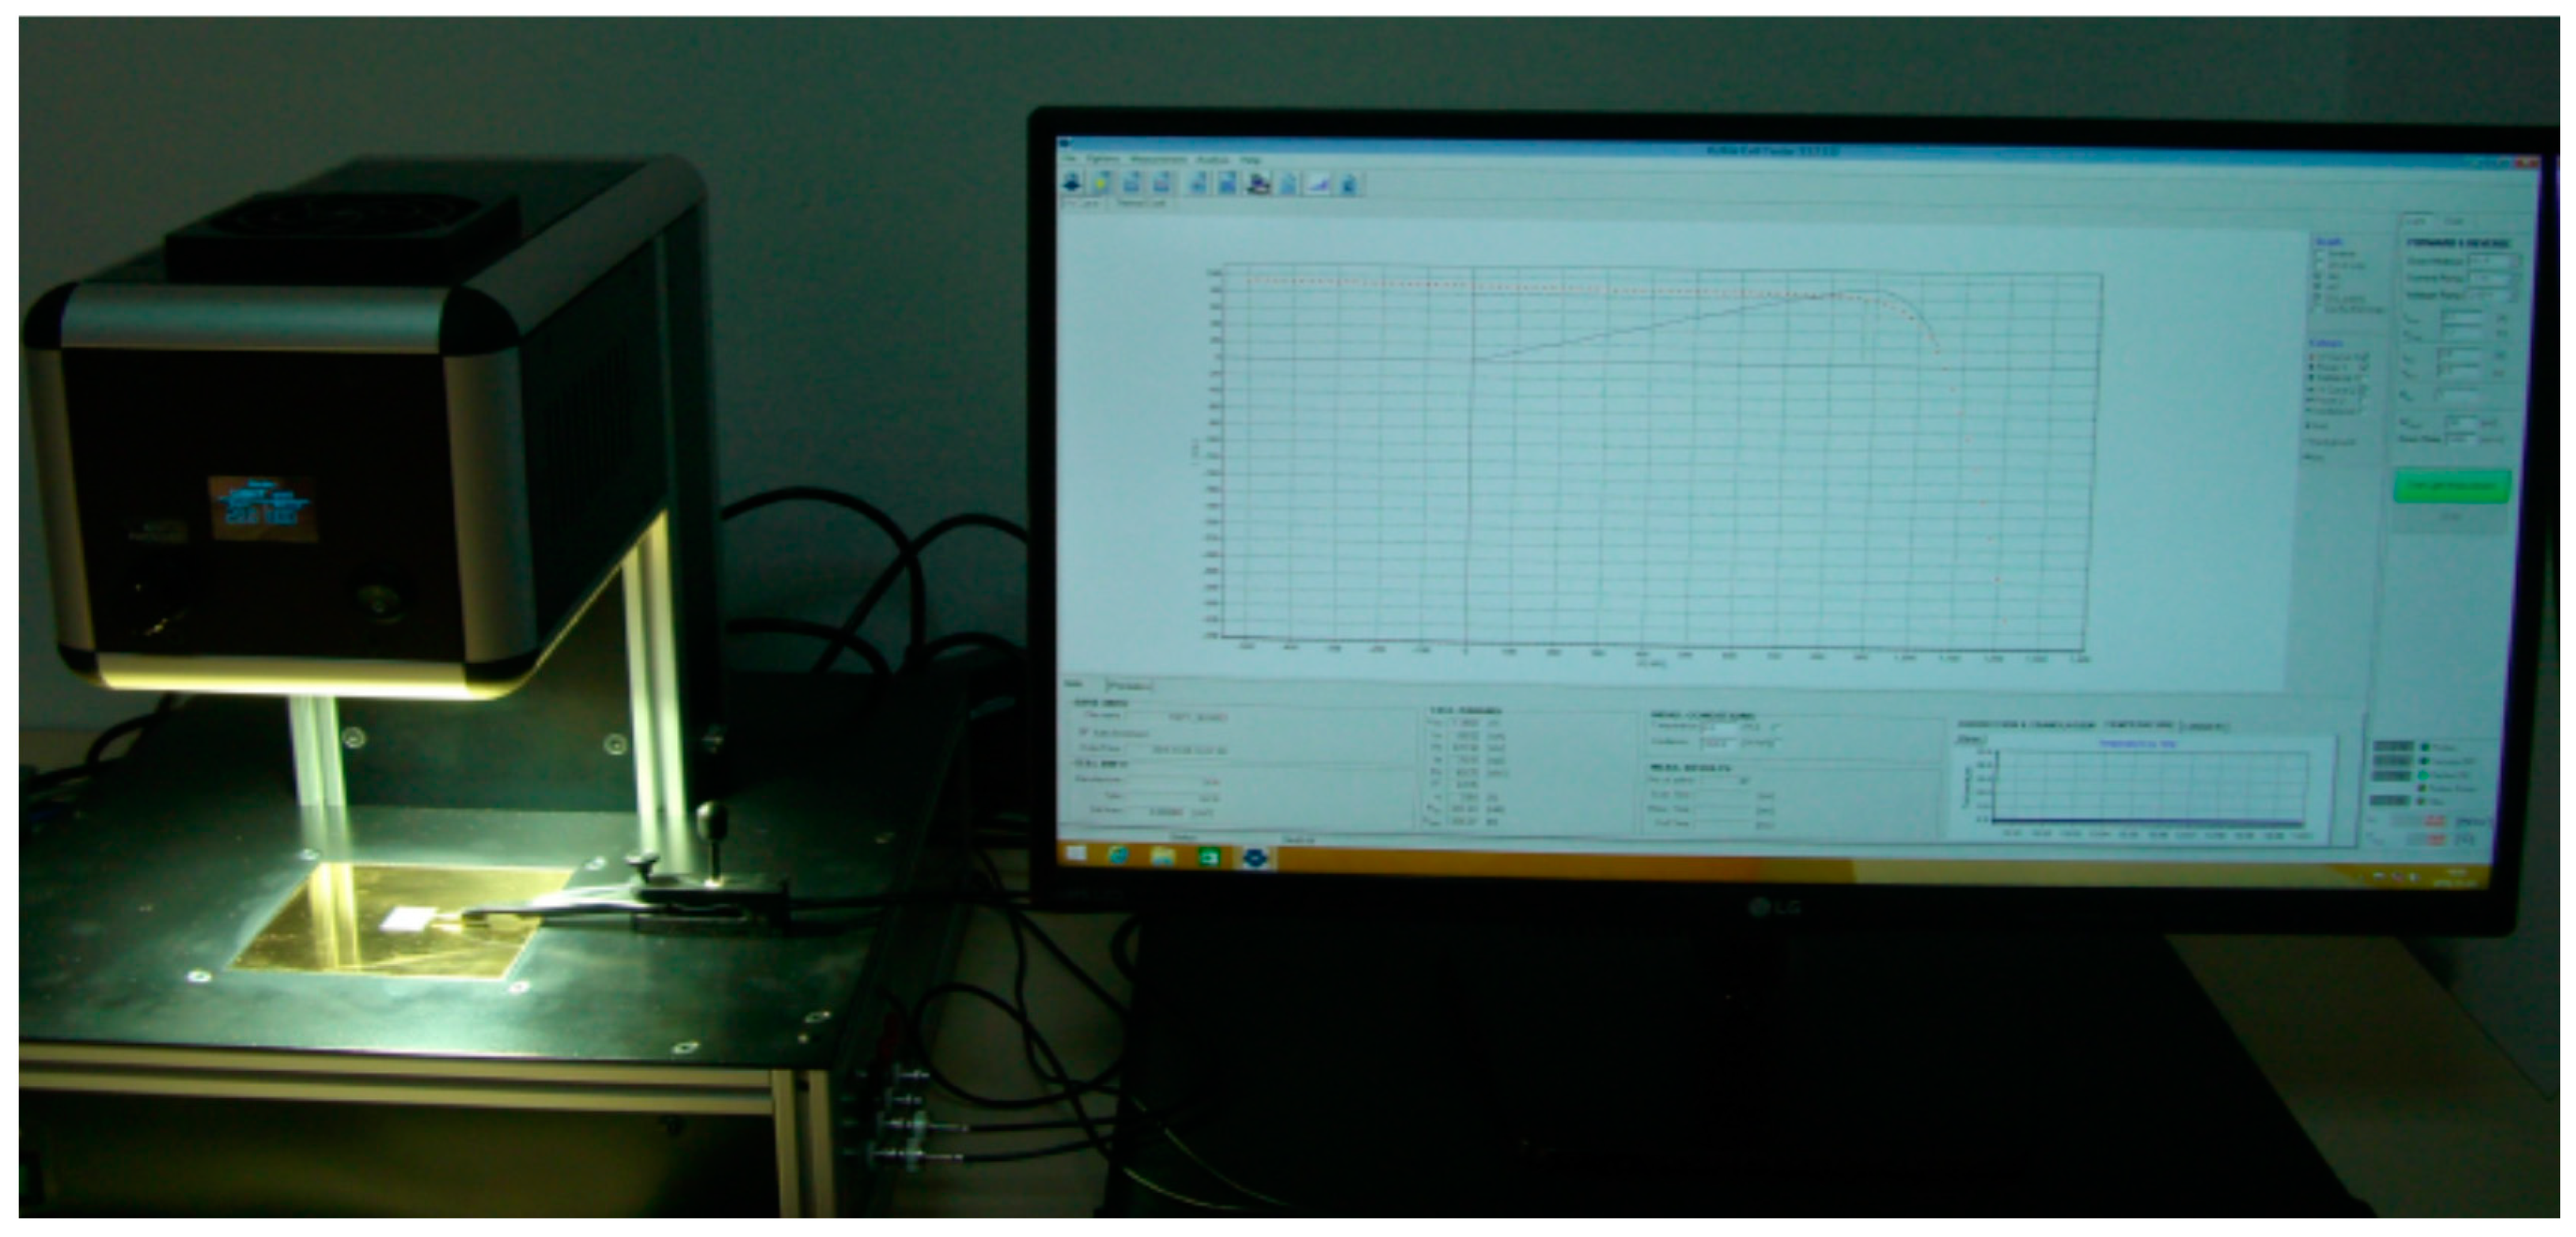
The measurements were conducted using a photovoltaic test station which includes:
- Keithley SMU2401 gauge current measurement ≈˂±1 nA–1 A, voltage measurement ±20 V;
- a measurement table with an integrated SS05SA LED solar simulator (the table allows determination of the temperature for the tested cell in a range of 10–60 °C (Peltier module cooled by air)), a solar cell suction system, and a Kelvin probe;
- an Auxiliary Unit ver. 3.0 (a computer station with software which allows us to control the temperature, level of irradiation, the suction of the cell and probes, and other functions).
The first step in the research was to define the level of irradiance and temperature in which the measurements will be conducted. All the results presented in the paper are an average of (minimum) 3 consecutive measurements. Such a procedure decreases the error caused by light instability. The basic characteristic of the cell was measured using the Keithley gauge and presented in a form of I-V curve (aparage-voltage curve) via the PC software.
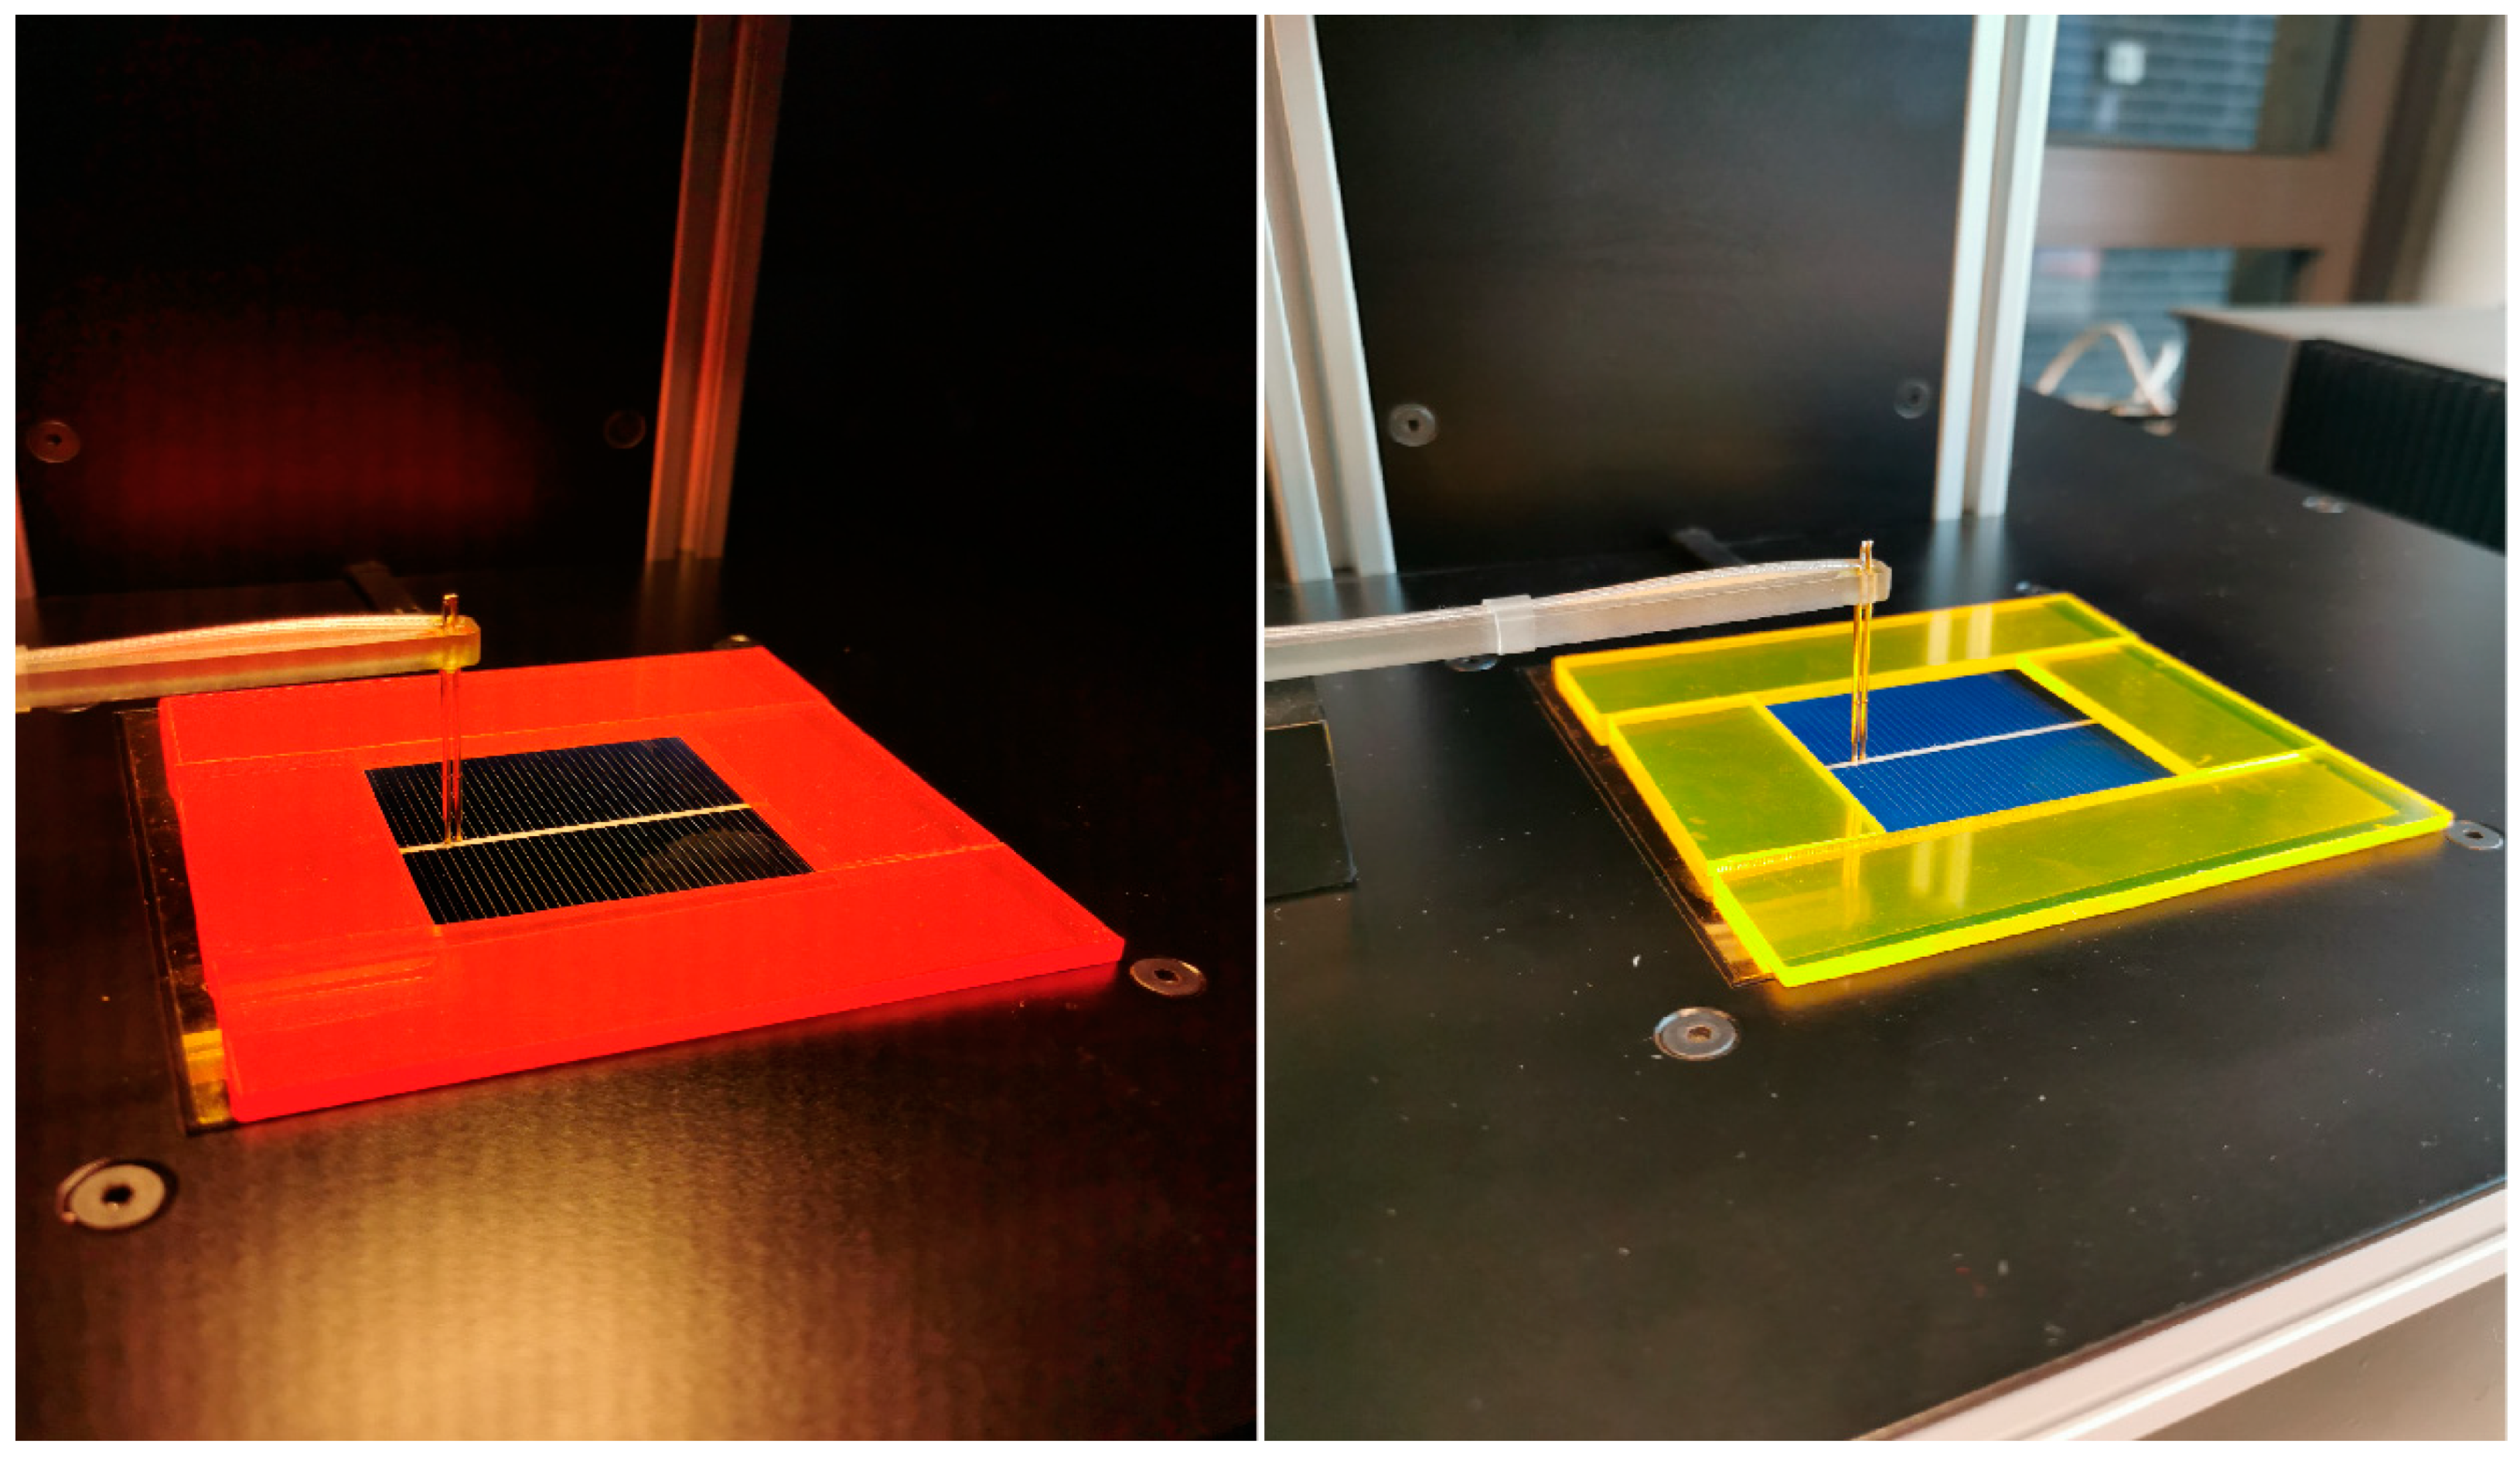
Dye concentrators used in the experiment were 4 PMMA plates that surrounded the tested solar cell. The width of each plate was 2.5 cm and their combined length was equal to 5 cm, while the total length of the other two was 10 cm. Figure 5 and Figure 6 show the photovoltaic laboratory station and system with a dye concentrator during the testing procedure for yellow and luminescence PMMA.
The dye concentrators used during the research were bought from the ArtCOP in a form of predetermined plates. The dimensions, such as length and width of the plates, were defined by the researcher and were as follows: 100 m2 and 50 m2 length and 25 m2 width. The thickness of the plates was determined by the supplier and was 3 mm; currently, this is the only option of a luminescent PMMA available on the Polish market.
3. Results
During the measurement, the irradiation stabilized at the values shown in Table 2, Table 3 and Table 4. The fluctuation in the level of illumination was around 10 W/m2. This means that measurement for irradiation of 1000 W/m2 could be done in an interval of 990–1010 W/m2. The power output shown in Table 2 can easily be calculated using Formula (2). Table 2 shows the measurements for clear polycrystalline silicon cell for different irradiation in defined temperatures. By analyzing the results from the perspective of illumination, we can see that the efficiency of the cell is on a stable level. Reduction of the temperature of the cell resulted in an increase of the performance of the system. This phenomenon is well known among photovoltaic modules producers. Each module used in a photovoltaic installation has its own rated temperature, specified in its data sheet provided in the technical specification. Below, the formula which allows calculation of Pm is shown:
where:
Pm = A·Pin·η [W]
- A—Area for silicon cell/photovoltaic module [m2]
- Pin—Amount of solar radiation reaching earth [W/m2]
- η—Efficiency of silicon cell/photovoltaic module
In Table 3 and Table 4, we can see the results for the systems which use a dye concentrator to curve the illumination and concentrate it on the surface area of a working silicon cell. By comparing it with the basic system which uses only clear polycrystalline silicon cell, we can assume the change in the performance on the level between −0.4 to +0.26% for red PMMA. The negative value is characteristic of the measurement in low irradiance and temperature condition. For yellow PMMA, the results in performance are on the level between −0.54 to +0.7%. The negative value for yellow PMMA was only obtained for very low irradiance equal to 200 W/m2 and low temperature of 16 °C. This data can indicate that PMMA pigmented by yellow color can better curve the light than similar red PMMA. We can also observe small improvement in amperage value for tested cell. The change in value for voltage oscillated within the measuring error of the device used for the measurements. For yellow PMMA, the average increase in Isc was around the value 14.24 mA and 1.05 mV for Voc; in the case of red PMMA the results were lower for Isc (3.63 mA) and around 1.21 mV for Voc. The results indicate that yellow PMMA has better bending abilities than the red solution.
Table 5 and Table 6 present the results for the tests for the system with luminescent PMMA. This kind of solution allows us not only to curve solar light via a PMMA plate, but also to use the effect of luminescence to increase the performance of the solar cell. The Stokes shift is a well-known concept in luminescence. The idea of the Stokes shift describes the change in the spectrum of the light before and after emitting it via a luminescence pigment. Red luminescence pigment will emit the light shifted toward the red spectrum; in theory, this means that in case of silicon cell technology, which works better in such conditions, we will increase its performance by using it.
In Table 4, we can see the results for the systems with yellow and red luminescent PMMA. By analyzing the presented data and comparing it to the results for a clear silicon cell, we observe higher efficiency for the system which uses a red luminescence PMMA. The average results shown for the red luminescence PMMA were equal to 1.21%, and 0.25% for yellow. The highest result for the first one was achieved at irradiation of 400 W/m2, temperature of 28 °C, and was 1.42%; for the yellow option, it was achieved at irradiation of 400 W/m2, 25 °C, and was equal to 0.54%. It is also worth noting that three out of five measurements for the yellow option in the lowest irradiance achieved negative value. All results achieved for the red luminescent PMMA showed an increase in the performance of the silicon cell.
Comparing the results for amperage and voltage with a clear cell system we can see a small change in the value of Voc (red LSC 1.89 mV and yellow LSC 0.9 mV). This change is insignificant and can relate to the measuring error for Keithley SMU2401 gauge current measurement. The most important change was noticed for the amperage values. The average results shown for yellow LSC was around 14.24 mA, and 38.5 mA for red LSC. These results confirm the literature information which points out that using LSC gives results in a higher amperage value for the tested system.
If we compare the results obtained for the normal and luminescent concentrator, we find that normal yellow PMMA has better bending characteristics than its red counterpart. The results achieved for traditional yellow PMMA was higher than its luminescent counterpart. This means that before using LSC there is a need to analyze the technology in which we want to implement LSC. The various technologies of cells work differently in specific spectrums of light (as shown in Figure 2). The lower results for yellow LSC can also be connected to the losses which were described in Figure 4, and the energy losses connected to the reemission of light by luminescent PMMA.
4. Discussion
Photovoltaic installations are one of the methods used to generate electricity in Europe and other continents. The reason for this is the decline of resources of fossil fuels and progressive degradation of the natural environment. Still, the preserved resources of fossil fuels will be needed in the process of production of other materials, like coal in production of steel. Green renewable energy sources, in contrast to fossil fuels, are theoretically inexhaustible resources which we can use as long as our solar system exists. Because of this, the technologies that utilize them will certainly be constantly developed to make them close to perfection in the future.
The idea of the photovoltaic concentrator is a well-known concept in the photovoltaic industry, but usually it is implemented in the form of mirrors and lenses. The concept of using a LSC concentrator as a part that guides light to the solar cell is a new idea, especially if we use it in a form of pigmentated PMMA. The results presented in the paper show potential for using a dye concentrator especially in a form of luminescence PMMA. The tested cell shows an average increase in performance equal to 1.21% for a red luminescent glass, 0.25% for a yellow luminescent glass, 0.41% for a yellow PMMA, and the lowest average results of 0.13% for a red PMMA. This value can be interpreted as small, but it should be noted that the presented solution can be implemented in all-silicon solar technology, which is currently commonly used in the energy industry [12].
The results also show clearly that an increase of amperage can be expected after implementing a dye concentrator in photovoltaic technology. In the tested concentrator, the highest increase for Isc was achieved by red LSC and traditional yellow PMMA. The best results were achieved by the red LMS and were around 38.53 mA and 1.89 mV. Dye concentrators can be also implemented in other technologies such as a dye-sensitized solar cell (DSSC) or a perovskite solar cell, but the research for each solution should be carried out before implementation.
The smallest dimension for generally available luminescent PMMA is 50 × 50 m2 thickness 3 m2 but even smaller elements can be successfully implemented in installation and increase its performance. According to the literature, LSC with cylindrical geometry can theoretically show higher results and can be successfully implemented in currently used technology thanks to its small scale. Further research is necessary, but at this step we can for sure say that this technology has great potential especially from the perspective of countries with four seasons (with highly dispersed irradiation during winter).
The other question which will need to be answered before the implementation of this technology in a solar installation is how it works in a system using a whole photovoltaic module. Each module is composed of many cells, connected in series and in parallel. The efficiency of the module, in theory, is equal to the performance of the weakest cell, so increasing the performance for several of them will not give expected results. The LSC should be also maintained together with the photovoltaic installation because any type of damage to both the concentrator and the module may result in not achieving the expected results. In practice, the standard photovoltaic solutions also need to undergo regular maintenance to remove contamination in the form of impurities collected on the usable surface of the photovoltaic module. That is also the reason why continuous research of this technology should be carried on.
Author Contributions
Conceptualization B.M.; data curation, B.M.; methodology, B.M. and M.B.; supervision, K.P.; visualization, M.B.; writing—original draft, B.M.; writing—review & editing, B.M., M.B. and K.P. All authors have read and agreed to the published version of the manuscript.
Funding
Research funded by subsidies granted for the year 2019 from the Department of Technology and Installations for Waste Management, Silesian University of Technology. Grant number 08/030/BK_21/0089.
Institutional Review Board Statement
Not Applicable.
Informed Consent Statement
Not Applicable.
Data Availability Statement
Data sharing is not applicable to this article.
Conflicts of Interest
The authors declare no conflict of interest.
References
- Eurostat, Electricity Production, Consumption, and Marked Overview. Available online: https://ec.europa.eu/eurostat/statistics-explained/index.php/Electricity_production,_consumption_and_market_overview#Household_electricity_consumption (accessed on 7 November 2020).
- European Commission. Directive2009/28/EC of the European Parliament and of the Council on the promotion of the use of energy from renewable sources and amending and subsequently repealing Directives 2001/77/EC and 2003/30/EC. Off. J. EU 2009, 23, 2009. [Google Scholar]
- Ortega-Izquierdo, M.; Del Rio, P. Benefits and costs of renewable electricity in Europe. Renew. Sustain. Energy Rev. 2016, 61, 372–383. [Google Scholar] [CrossRef]
- Green, R.; Staffel, I. Electricity in Europe: Existing fossil fuels. Oxf. Rev. Econ. Policy 2016, 32, 282–303. [Google Scholar] [CrossRef] [Green Version]
- Korzeniowska, E.; Tomczyk, M.; Pietrzak, Ł.; Hadziselimovic, M.; Stumberger, B.; Sredensek, K.; Seme, S. Efficiency of Laser-Shaped Photovoltaic cells. Energies 2020, 13, 4747. [Google Scholar] [CrossRef]
- Esen, V.; Saglam, S.; Oral, B. Light sources of solar simulators for photovoltaic devices: A review. Renew. Sustain. Energy Rev. 2017, 77, 1240–1250. [Google Scholar] [CrossRef]
- Żdanowicz, T. Pomiary Ogniw i Modułów cz.2. Magazyn Fotowoltaika 2020, I, 13–18. [Google Scholar]
- Kenny, R.P.; Viganó, D.; Salis, E.; Bardizza, G.; Norton, M.; Müllejans, H. Power rating of photovoltaic modules including validation of procedures to implement IEC 61853-1 on solar simulators and under natural sunlight. Prog. Photovolt. Res. Appl. 2013, 21, 1384–1399. [Google Scholar] [CrossRef]
- El-Bashir, S.M. Enhanced fluorescence polarization of fluorescent polycarbonate/zirconia nanocomposites for second generation luminescent solar concentrators. Renew. Energy 2018, 115, 269–275. [Google Scholar] [CrossRef]
- El Himer, S.; El Ayane, S.; El Yahyaoui, S.; Salvestrini, J.P.; Ahaitouf, A. Photovoltaic concentration: Research and development. Energies 2020, 13, 5721. [Google Scholar] [CrossRef]
- Davis, A. Fresnel lens solar concentrator derivations and simulations. In Novel Optical Systems Design and Optimization XIV; International Society for Optics and Photonics: Bellingham, WA, USA, 2011; Volume 8129, p. 81290J. [Google Scholar]
- El Himer, S.; Ahaitouf, A.; El-Yahyaoui, S.; Mechaqrane, A. Performance analysis of non-imaging Fresnel lens as a primary stage for CPV units. In Proceedings of the IOP Conference Series: Earth and Environmental Science, Banda Aceh, Indonesia, 26–27 September 2018; Volume 161, p. 012029. [Google Scholar]
- Leutz, R.; Suzuki, A.; Akisawa, A.; Kashiwagi, T. Design of a non-imaging Fresnel lens for solar concentrators. Sol. Energy 1999, 65, 379–387. [Google Scholar] [CrossRef]
- Akisawa, A.; Hiramatsu, M.; Ozaki, K. Design of dome-shaped non-imaging Fresnel lenses taking chromatic aberration into account. Sol. Energy 2012, 86, 877–885. [Google Scholar] [CrossRef]
- Pham, T.T.; Vu, N.H.; Shin, S. Design of curved Fresnel lens with high performance creating competitive price concentrator photovoltaic. Energy Procedia 2018, 144, 16–32. [Google Scholar] [CrossRef]
- Canavarro, D.; Chaves, J.; Collares-Pereira, M. New second-stage concentrators (XX SMS) for parabolic primaries; Comparison with conventional parabolic trough concentrators. Sol. Energy 2013, 92, 98–105. [Google Scholar] [CrossRef]
- Yazdanifard, F.; Ebrahimnia-Bajestan, E.; Ameri, M. Performance of a parabolic trough concentrating photovoltaic/thermal system: Effects of flow regime, design parameters, and using nanofluids. Energy Conver. Manag. 2017, 148, 1265–1277. [Google Scholar] [CrossRef]
- Sloof, L.H.; Bende, E.E.; Burgers, A.R.; Budel, T.; Pravettoni, M.; Kenny, R.P.; Dunlop, E.D.; Büchtemann, A. A luminescent solar concentrator with 7.1% power conversion efficiency. Phys. Status Solidi Rapid Res. Lett. 2008, 2, 257–259. [Google Scholar] [CrossRef] [Green Version]
- Aghaei, M.; Nitti, M.; Ekins-Daukes, N.J.; Reinders, A.H. Simulation of a Novel Configuration for Luminescent Solar Concentrator Photovoltaic Devices using Bifacial Silicon Solar cells. Appl. Sci. 2020, 10, 871. [Google Scholar] [CrossRef] [Green Version]
- Moraitis, P.; Schropp, R.E.I.; van Sark, W.G. Nanoparticles for Luminescent Solar Concentrators—A review. Opt. Mater. 2018, 84, 636–645. [Google Scholar] [CrossRef]
- Brennan, L.J.; Purcell-Milton, F.; McKenna, B.; Watson, T.M.; Gun’ko, Y.K.; Evans, R.C. Large area quantum dot luminescent solar concentrators for usewith dye-sensitised solar cells. J. Mater. Chem. A 2018, 6, 2671–2680. [Google Scholar] [CrossRef] [Green Version]
- Zhou, Y.; Benetti, D.; Fan, Z.; Zhao, H.; Ma, D.; Govorov, A.O.; Vomiero, A.; Rosei, F. Near infrared, highly efficient luminescent solar concentrators. Adv. Energy Mater. 2016, 6, 1501913. [Google Scholar] [CrossRef]
- Goetzberger, A.; Hebling, C. Photovoltaic materials, past, present, future. Sol. Energy Mater. Sol. Cells 2000, 62, 1–19. [Google Scholar] [CrossRef]
- Reisfeld, R.; Jørgensen, C.K. Luminescent solar concentrators for energy conversion. In Solar Energy Materials; Springer: Berlin/Heidelberg, Germany, 1982; pp. 1–36. [Google Scholar]
- Mi´ci´c, O.I.; Cheong, H.M.; Fu, H.; Zunger, A.; Sprague, J.R.; Mascarenhas, A.; Nozik, A.J. Size-dependent spectroscopy of inp quantum dots. J. Phys. Chem. 1997, 101, 4904–4912. [Google Scholar] [CrossRef]
- Zhang, N. Planar Waveguide Solar Concentrator with Couplers Fabricated by Laser-Induced Backside Wet Etching. Master’s Thesis, University of Toledo, Toledo, OH, USA, 2013. [Google Scholar]
- McKenna, B.; Evans, R.C. Towards efficient spectral converters through materials design for luminescent solar devices. Adv. Mater. 2017, 29, 1606491. [Google Scholar] [CrossRef] [PubMed]
- Kanellis, M.; de Jong, M.M.; Slooff, L.; Debije, M.G. The solar noise barrier project: 1. Effect of incident light orientation on the performance of a large-scale luminescent solar concentrator noise barrier. Renew. Energy 2017, 103, 647–652. [Google Scholar] [CrossRef] [Green Version]
- Debije, M.G.; Tzikas, C.; Rajkumar, V.A.; de Jong, M.M. The solar noise barrier project: 2. The effect of street art on performance of a large scale luminescent solar concentrator prototype. Renew. Energy 2017, 113, 1288–1292. [Google Scholar] [CrossRef]
- Debije, M.G.; Tzikas, C.; de Jong, M.M.; Kanellis, M.; Slooff, L.H. The solar noise barrier project: 3. The effects of seasonal spectral variation, cloud cover and heat distribution on the performance of full-scale luminescent solar concentrator panels. Renew. Energy 2018, 116, 335–343. [Google Scholar] [CrossRef]
- McIntosh, K.R.; Yamada, N.; Richards, B.S. Theoretical comparison of cylindrical and square-planar luminescent solar concentrators. Appl. Phys. B 2007, 88, 285. [Google Scholar] [CrossRef]
- Videira, J.J.H.; Bilotti, E.; Chatten, A.J. Cylindrical and square fibre luminescent solar concentrators: Experimental and simulation comparisons. In Proceedings of the 40th IEEE Photovoltaic Specialist Conference, Denver, CO, USA, 8–13 June 2014. [Google Scholar]
- Correia, S.F.H.; Lima, P.P.; Pecoraro, E.; Ribeiro, S.J.L.; Andre, P.S.; Ferreira, R.A.; Carlos, L.D. Scale up the collection area of luminescent solar concentrators towards metre-length flexible waveguiding photovoltaics. Prog. Photovolt. 2016, 24, 1178–1193. [Google Scholar] [CrossRef]
- Correia, S.F.H.; Frias, A.R.; Fu, L.; Rondao, R.; Pecoraro, E.; Ribeiro, S.J.L.; Andre, P.S.; Ferreira, R.A.; Carlos, L.D. Large-Area Tunable Visible-to-Near-Infrared Luminescent Solar Concentrators. Adv. Sustain. Syst. 2018, 2, 1800002. [Google Scholar] [CrossRef]
Figure 1.
IEC (International Electrotechnical Commission) 60904-9 Reference: solar spectrum irradiance distribution [7].
Figure 1.
IEC (International Electrotechnical Commission) 60904-9 Reference: solar spectrum irradiance distribution [7].

Figure 2.
Spectral responses for selected photovoltaic (PV) technologies tested in a set standard light spectrum [7].
Figure 2.
Spectral responses for selected photovoltaic (PV) technologies tested in a set standard light spectrum [7].

Figure 3.
Concept for cylindro-parabolic solar concentrator presented by Yazdanifard et al. [17].
Figure 3.
Concept for cylindro-parabolic solar concentrator presented by Yazdanifard et al. [17].

Figure 4.
The luminescence concentrator schema was presented by Zhang N. in his master thesis. Red dots: molecules of the pigment, blue dots: host/material absorption [26].
Figure 4.
The luminescence concentrator schema was presented by Zhang N. in his master thesis. Red dots: molecules of the pigment, blue dots: host/material absorption [26].

Figure 5.
The photovoltaic laboratory station used during the research.

Figure 6.
The dye concentrator in a form of polymethyl methacrylate (PMMA) plates used during the research.
Figure 6.
The dye concentrator in a form of polymethyl methacrylate (PMMA) plates used during the research.


Table 1.
Basic parameters for the tested silicon cell in standard testing conditions (STC).
| Polycrystalline Silicon Cell | ||
|---|---|---|
| Area | 25.00 | Cm2 |
| Voc | 639.10 | mV |
| Isc | 948.05 | mA |
| Vm | 512.00 | mV |
| Im | 891.16 | mA |
| Pm | 456.29 | mW |
| FF | 0.75 | - |
| Efficiency | 18.25 | % |
Table 2.
Average results for measurement in different conditions for clear polycrystalline silicon cell (EFF av- average efficiency of the photovoltaic cell, Pm av- average power output, Voc av- average open circuit voltage, Isc av- average short circuit current).
Table 2.
Average results for measurement in different conditions for clear polycrystalline silicon cell (EFF av- average efficiency of the photovoltaic cell, Pm av- average power output, Voc av- average open circuit voltage, Isc av- average short circuit current).
| Irradiation [W/m2] | Temperature [°C] | EFF av [%] | Pm av [mW] | Voc av [mV] | Isc av [mA] |
|---|---|---|---|---|---|
| 1000 | 30 | 17.90 | 446.74 | 629.63 | 949.66 |
| 28 | 17.98 | 450.25 | 633.53 | 948.07 | |
| 26 | 18.19 | 455.66 | 637.50 | 950.55 | |
| 25 | 18.25 | 456.56 | 639.23 | 948.08 | |
| 16 | 18.93 | 473.44 | 657.13 | 953.64 | |
| 800 | 30 | 17.86 | 357.24 | 623.47 | 753.72 |
| 28 | 18.00 | 359.46 | 627.17 | 751.92 | |
| 26 | 18.18 | 363.21 | 631.23 | 752.41 | |
| 25 | 18.10 | 361.95 | 632.77 | 752.83 | |
| 16 | 18.92 | 377.96 | 651.17 | 756.27 | |
| 600 | 30 | 17.76 | 267.85 | 615.23 | 567.27 |
| 28 | 17.95 | 269.08 | 619.03 | 564.27 | |
| 26 | 18.12 | 272.55 | 623.03 | 565.04 | |
| 25 | 18.06 | 270.34 | 624.50 | 562.37 | |
| 16 | 18.91 | 283.46 | 643.30 | 565.76 | |
| 400 | 30 | 17.74 | 176.22 | 602.43 | 373.33 |
| 28 | 17.86 | 177.85 | 606.87 | 368.27 | |
| 26 | 18.23 | 181.75 | 610.70 | 375.69 | |
| 25 | 18.06 | 179.52 | 612.70 | 369.72 | |
| 16 | 19.06 | 190.11 | 631.63 | 377.36 | |
| 200 | 30 | 17.88 | 89.72 | 567.80 | 183.20 |
| 28 | 18.02 | 89.93 | 586.43 | 183.67 | |
| 26 | 18.07 | 89.48 | 590.47 | 183.95 | |
| 25 | 18.26 | 91.04 | 493.03 | 187.41 | |
| 16 | 19.15 | 95.20 | 612.07 | 184.10 |
Table 3.
Average results for measurement in different conditions for the systems which use clear polycrystalline silicon cell and pigmented red PMMA.
Table 3.
Average results for measurement in different conditions for the systems which use clear polycrystalline silicon cell and pigmented red PMMA.
| Irradiation [W/m2] | Temperature [°C] | EFF av [%] | Pm av [mW] | Voc av [mV] | Isc av [mA] |
|---|---|---|---|---|---|
| 1000 | 30 | 18.03 | 449.74 | 630.03 | 956.55 |
| 28 | 18.21 | 454.96 | 648.40 | 957.78 | |
| 26 | 18.26 | 455.94 | 637.27 | 950.51 | |
| 25 | 18.29 | 455.81 | 639.03 | 956.63 | |
| 16 | 19.10 | 476.32 | 657.40 | 958.02 | |
| 800 | 30 | 18.01 | 359.37 | 623.33 | 761.24 |
| 28 | 18.15 | 362.95 | 627.33 | 759.23 | |
| 26 | 18.22 | 363.55 | 631.17 | 754.78 | |
| 25 | 18.29 | 365.02 | 633.03 | 759.34 | |
| 16 | 19.09 | 380.46 | 651.13 | 760.25 | |
| 600 | 30 | 17.95 | 269.79 | 615.10 | 568.94 |
| 28 | 18.10 | 272.54 | 619.17 | 570.34 | |
| 26 | 18.17 | 271.97 | 622.77 | 564.01 | |
| 25 | 18.21 | 273.49 | 624.53 | 566.81 | |
| 16 | 19.01 | 285.22 | 643.37 | 569.39 | |
| 400 | 30 | 17.96 | 178.36 | 603.10 | 378.46 |
| 28 | 18.06 | 180.38 | 607.10 | 377.46 | |
| 26 | 18.18 | 181.85 | 610.30 | 377.45 | |
| 25 | 18.31 | 183.26 | 612.67 | 374.48 | |
| 16 | 19.10 | 189.74 | 632.10 | 375.93 | |
| 200 | 30 | 18.07 | 90.65 | 582.63 | 184.66 |
| 28 | 18.25 | 90.86 | 586.27 | 182.84 | |
| 26 | 18.33 | 92.00 | 590.90 | 181.56 | |
| 25 | 18.48 | 91.91 | 592.30 | 188.46 | |
| 16 | 18.75 | 93.22 | 612.10 | 184.17 |
Table 4.
Average results for measurement in different conditions for the systems which use clear polycrystalline silicon cell and pigmented yellow PMMA.
Table 4.
Average results for measurement in different conditions for the systems which use clear polycrystalline silicon cell and pigmented yellow PMMA.
| Irradiation [W/m2] | Temperature [°C] | EFF av [%] | Pm av [mW] | Voc av [mV] | Isc av [mA] |
|---|---|---|---|---|---|
| 1000 | 30 | 18.28 | 456.44 | 630.267 | 974,351 |
| 28 | 18.46 | 461.44 | 635.000 | 972.298 | |
| 26 | 18.64 | 465.19 | 637.900 | 971.431 | |
| 25 | 18.59 | 464.94 | 639.467 | 977.666 | |
| 16 | 19.35 | 484.19 | 657.633 | 978.289 | |
| 800 | 30 | 18.26 | 364.34 | 623.733 | 771.726 |
| 28 | 18.45 | 368.62 | 627.767 | 772.565 | |
| 26 | 18.61 | 370.85 | 631.400 | 770.171 | |
| 25 | 18.59 | 371.13 | 633.233 | 774.280 | |
| 16 | 19.37 | 387.21 | 651.700 | 775.188 | |
| 600 | 30 | 18.24 | 274.56 | 615.733 | 579.680 |
| 28 | 18.39 | 275.30 | 619.367 | 575.239 | |
| 26 | 18.48 | 230.64 | 623.500 | 580.820 | |
| 25 | 18.48 | 230.45 | 625.200 | 579.341 | |
| 16 | 19.21 | 239.47 | 643.733 | 579.495 | |
| 400 | 30 | 18.44 | 183.89 | 603.567 | 382.977 |
| 28 | 18.20 | 180.91 | 607.533 | 379.690 | |
| 26 | 18.54 | 183.54 | 611.93 | 379.41 | |
| 25 | 18.59 | 186.13 | 613.43 | 382.09 | |
| 16 | 19.41 | 193.86 | 632.57 | 383.90 | |
| 200 | 30 | 18.40 | 92.29 | 185.59 | 30.76 |
| 28 | 18.43 | 91.23 | 587.12 | 186.17 | |
| 26 | 18.32 | 90.62 | 590.02 | 190.63 | |
| 25 | 18.63 | 93.53 | 593.13 | 192.45 | |
| 16 | 18.60 | 92.83 | 610.00 | 189.16 |
Table 5.
Average results for measurements in different conditions for the systems which use clear polycrystalline silicon cell and red luminescent PMMA.
Table 5.
Average results for measurements in different conditions for the systems which use clear polycrystalline silicon cell and red luminescent PMMA.
| Irradiation [W/m2] | Temperature [°C] | EFF av [%] | Pm av [mW] | Voc av [mV] | Isc av [mA] |
|---|---|---|---|---|---|
| 1000 | 30 | 19.01 | 475.96 | 631.47 | 1019.00 |
| 28 | 19.23 | 480.61 | 635.10 | 1016.33 | |
| 26 | 19.43 | 484.80 | 639.13 | 1015.67 | |
| 25 | 19.28 | 482.34 | 640.80 | 1017.00 | |
| 16 | 20.01 | 499.76 | 658.60 | 1011.00 | |
| 800 | 30 | 19.03 | 379.69 | 624.97 | 805.56 |
| 28 | 19.22 | 384.86 | 628.80 | 807.06 | |
| 26 | 19.42 | 387.22 | 632.60 | 806.29 | |
| 25 | 19.33 | 385.98 | 634.40 | 806.28 | |
| 16 | 20.01 | 399.91 | 643.50 | 802.62 | |
| 600 | 30 | 19.02 | 285.80 | 616.73 | 606.30 |
| 28 | 19.19 | 288.73 | 620.40 | 606.47 | |
| 26 | 19.34 | 290.74 | 624.53 | 603.36 | |
| 25 | 19.34 | 289.77 | 626.27 | 602.69 | |
| 16 | 19.98 | 300.38 | 644.63 | 602.53 | |
| 400 | 30 | 19.03 | 189.30 | 604.53 | 395.63 |
| 28 | 19.28 | 192.42 | 608.90 | 402.41 | |
| 26 | 19.38 | 192.90 | 612.77 | 395.44 | |
| 25 | 19.41 | 193.85 | 614.67 | 396.66 | |
| 16 | 20.25 | 201.58 | 633.93 | 396.58 | |
| 200 | 30 | 18.94 | 94.65 | 584.70 | 198.53 |
| 28 | 19.21 | 96.29 | 587.87 | 195.75 | |
| 26 | 19.25 | 95.17 | 592.37 | 190.46 | |
| 25 | 19.66 | 97.33 | 594.37 | 197.03 | |
| 16 | 20.33 | 101.12 | 613.17 | 195.40 |
Table 6.
Average results for measurements in different conditions for the systems which use clear polycrystalline silicon cell and yellow luminescent PMMA.
Table 6.
Average results for measurements in different conditions for the systems which use clear polycrystalline silicon cell and yellow luminescent PMMA.
| Irradiation [W/m2] | Temperature [°C] | EFF av [%] | Pm av [mW] | Voc av [mV] | Isc av [mA] |
|---|---|---|---|---|---|
| 1000 | 30 | 18.14 | 452.96 | 630.20 | 966.42 |
| 28 | 18.33 | 458.75 | 633.93 | 966.27 | |
| 26 | 18.51 | 461.62 | 637.73 | 963.66 | |
| 25 | 18.42 | 460.05 | 639.63 | 966.01 | |
| 16 | 19.04 | 476.06 | 757.53 | 959.93 | |
| 800 | 30 | 18.12 | 362.35 | 623.70 | 768.05 |
| 28 | 18.31 | 365.87 | 627.60 | 766.20 | |
| 26 | 18.48 | 368.59 | 631.33 | 766.41 | |
| 25 | 18.41 | 367.33 | 633.03 | 766.12 | |
| 16 | 19.07 | 380.81 | 651.50 | 763.62 | |
| 600 | 30 | 18.06 | 271.97 | 615.43 | 574.73 |
| 28 | 18.26 | 273.66 | 619.20 | 570.30 | |
| 26 | 18.42 | 276.63 | 623.27 | 572.77 | |
| 25 | 18.38 | 275.47 | 625.00 | 573.03 | |
| 16 | 19.00 | 286.29 | 643.20 | 575.54 | |
| 400 | 30 | 18.14 | 179.96 | 603.07 | 377.41 |
| 28 | 18.15 | 180.31 | 606.90 | 378.19 | |
| 26 | 18.37 | 182.77 | 610.97 | 373.11 | |
| 25 | 18.61 | 185.11 | 613.47 | 382.94 | |
| 16 | 19.13 | 190.22 | 631.73 | 375.59 | |
| 200 | 30 | 18.26 | 91.62 | 582.83 | 186.65 |
| 28 | 18.25 | 90.65 | 587.27 | 185.71 | |
| 26 | 18.00 | 89.41 | 591.07 | 184.56 | |
| 25 | 18.10 | 89.39 | 592.50 | 186.66 | |
| 16 | 19.28 | 97.52 | 613.07 | 187.54 |
Publisher’s Note: MDPI stays neutral with regard to jurisdictional claims in published maps and institutional affiliations. |
© 2021 by the authors. Licensee MDPI, Basel, Switzerland. This article is an open access article distributed under the terms and conditions of the Creative Commons Attribution (CC BY) license (http://creativecommons.org/licenses/by/4.0/).
Share and Cite
MDPI and ACS Style
Milewicz, B.; Bogacka, M.; Pikoń, K. Influence of Solar Concentrator in the Form of Luminescent PMMA on the Performance of a Silicon Cell. Sustainability 2021, 13, 2086. https://0-doi-org.brum.beds.ac.uk/10.3390/su13042086
AMA Style
Milewicz B, Bogacka M, Pikoń K. Influence of Solar Concentrator in the Form of Luminescent PMMA on the Performance of a Silicon Cell. Sustainability. 2021; 13(4):2086. https://0-doi-org.brum.beds.ac.uk/10.3390/su13042086
Chicago/Turabian StyleMilewicz, Bartłomiej, Magdalena Bogacka, and Krzysztof Pikoń. 2021. "Influence of Solar Concentrator in the Form of Luminescent PMMA on the Performance of a Silicon Cell" Sustainability 13, no. 4: 2086. https://0-doi-org.brum.beds.ac.uk/10.3390/su13042086
Note that from the first issue of 2016, this journal uses article numbers instead of page numbers. See further details here.