Article

A Combined Measurement and Modelling Approach to Assess the Sustainability of Whole-Tree Harvesting—A Swedish Case Study

1
Department of Physical Geography and Ecosystem Science, Lund University, SE-223 62 Lund, Sweden
2
Department of Physical Geography, Stockholm University, SE-114 18 Stockholm, Sweden
3
IVL Swedish Environmental Research Institute, SE-411 33 Gothenburg, Sweden
*
Author to whom correspondence should be addressed.
Sustainability 2021, 13(4), 2395; https://0-doi-org.brum.beds.ac.uk/10.3390/su13042395
Submission received: 29 January 2021 / Revised: 10 February 2021 / Accepted: 14 February 2021 / Published: 23 February 2021
(This article belongs to the Special Issue Integrated Sustainability Assessment of Forest Bioenergy Options)

Abstract

:
The demand of renewable energy has increased the interest in whole-tree harvesting. The sustainability of whole-tree harvesting after clear-cutting, from an acidification point of view, depends on two factors: the present acidification status and the further loss of buffering capacity at harvesting. The aims of this study were to investigate the relationship between these two factors at 26 sites along an acidification gradient in Sweden, to divide the sites into risk classes, and to examine the geographical distribution of them in order to provide policy-relevant insights. The present status was represented by the acid neutralizing capacity (ANC) in soil solution, and the loss of buffering capacity was represented by the estimated exceedance of critical biomass harvesting (CBH). The sites were divided into three risk classes combining ANC and exceedance of CBH. ANC and exceedance of CBH were negatively correlated, and most sites had either ANC < 0 and exceedance (high risk) or ANC > 0 and no exceedance (low risk). There was a geographical pattern, with the high risk class concentrated to southern Sweden, which was mainly explained by higher historical sulfur deposition and site productivity in the south. The risk classes can be used in the formulation of policies on whole-tree harvesting and wood ash recycling.

1. Introduction

Emissions of sulfur (S) and nitrogen (N) from the burning of fossil fuels have led to acidic deposition, peaking in the second half of the 20th century [1,2] and resulting in acidified soils and waters in the forest ecosystems of Europe [3]. These emissions have been reduced considerably, but both measurements [4,5,6] and modelling [7] indicate that the recovery of forest soils, which is required for surface waters to fully recover, is slow compared to the emission reductions. Recovery may slow down more, or even be reversed, if branches, tops, and stumps are harvested, since harvesting is an acidifying process [8,9] which is reinforced if other parts than the stems are harvested [10,11,12,13]. Removal of branches and tops means a significantly increased removal of base cations, due to the higher base cation concentrations in those parts [14,15].
The demand for renewable fuel is expected to increase to replace fossil fuel and thus mitigate climate change [16]. In Sweden, the harvesting of branches and tops were notified on 35–41% of the notified final fellings during the five years between 2015 and 2019, whereas stump harvesting was very uncommon [17]. Estimations of the future biomass potential in Sweden have shown that the harvesting of branches and tops has the potential to increase [18]. It is therefore important to be able to assess the sustainability of whole-tree harvesting in regions with different acidification history and site properties.
The sustainability of whole-tree harvesting at a site, from an acidification point of view, depends on two factors: (1) how the site has been affected by previous acidification and (2) how whole-tree harvesting will affect the buffering capacity of the soil. The effects of anthropogenic acidification on soils are often described by soil solution chemistry below the root zone [4,5,6,19]. Acid neutralizing capacity (ANC) is an indicator often used to provide a quantitative estimate of the acidification status at a site as well as the quality of the water leaving the root zone [20]. However, it does not give any indications about the effect of whole-tree harvesting. The effect of whole-tree harvesting on the buffering capacity can be estimated using acidity budget calculations, e.g., through the concept of critical biomass harvesting (CBH) [13]. Such estimates can give indications of how the buffering capacity is affected by whole-tree harvesting, but since they only give information about the direction and a rate of the development, and not about the starting point, they do not give a complete assessment of the risks related to whole-tree harvesting. By combining ANC data based on soil solution chemistry measurements with acidity budget calculations, both previous acidification and the effect of whole-tree harvesting on the buffering capacity of the soil can be taken into account.
In this study we perform a refined mapping of the risks of acidification of forest soils caused by whole-tree harvesting, in this article defined as the harvesting of branches and tops but not stumps after clear-cutting, across a strong deposition gradient in Sweden. We achieve this by combining data on the present acidification status, represented by ANC in soil solution, with estimates of the potential effect of whole-tree harvesting on the buffering capacity, represented by exceedance of CBH, at 26 well investigated spruce sites. The aims were to (1) investigate the relationship between ANC in soil solution and exceedance of CBH, (2) identify risk classes for the sustainability of whole-tree harvesting, taking both factors into account, (3) investigate the geographical distribution of the risk classes and (4) discuss the results in relation to policies about whole-tree harvesting and wood ash recycling.

2. Materials and Methods

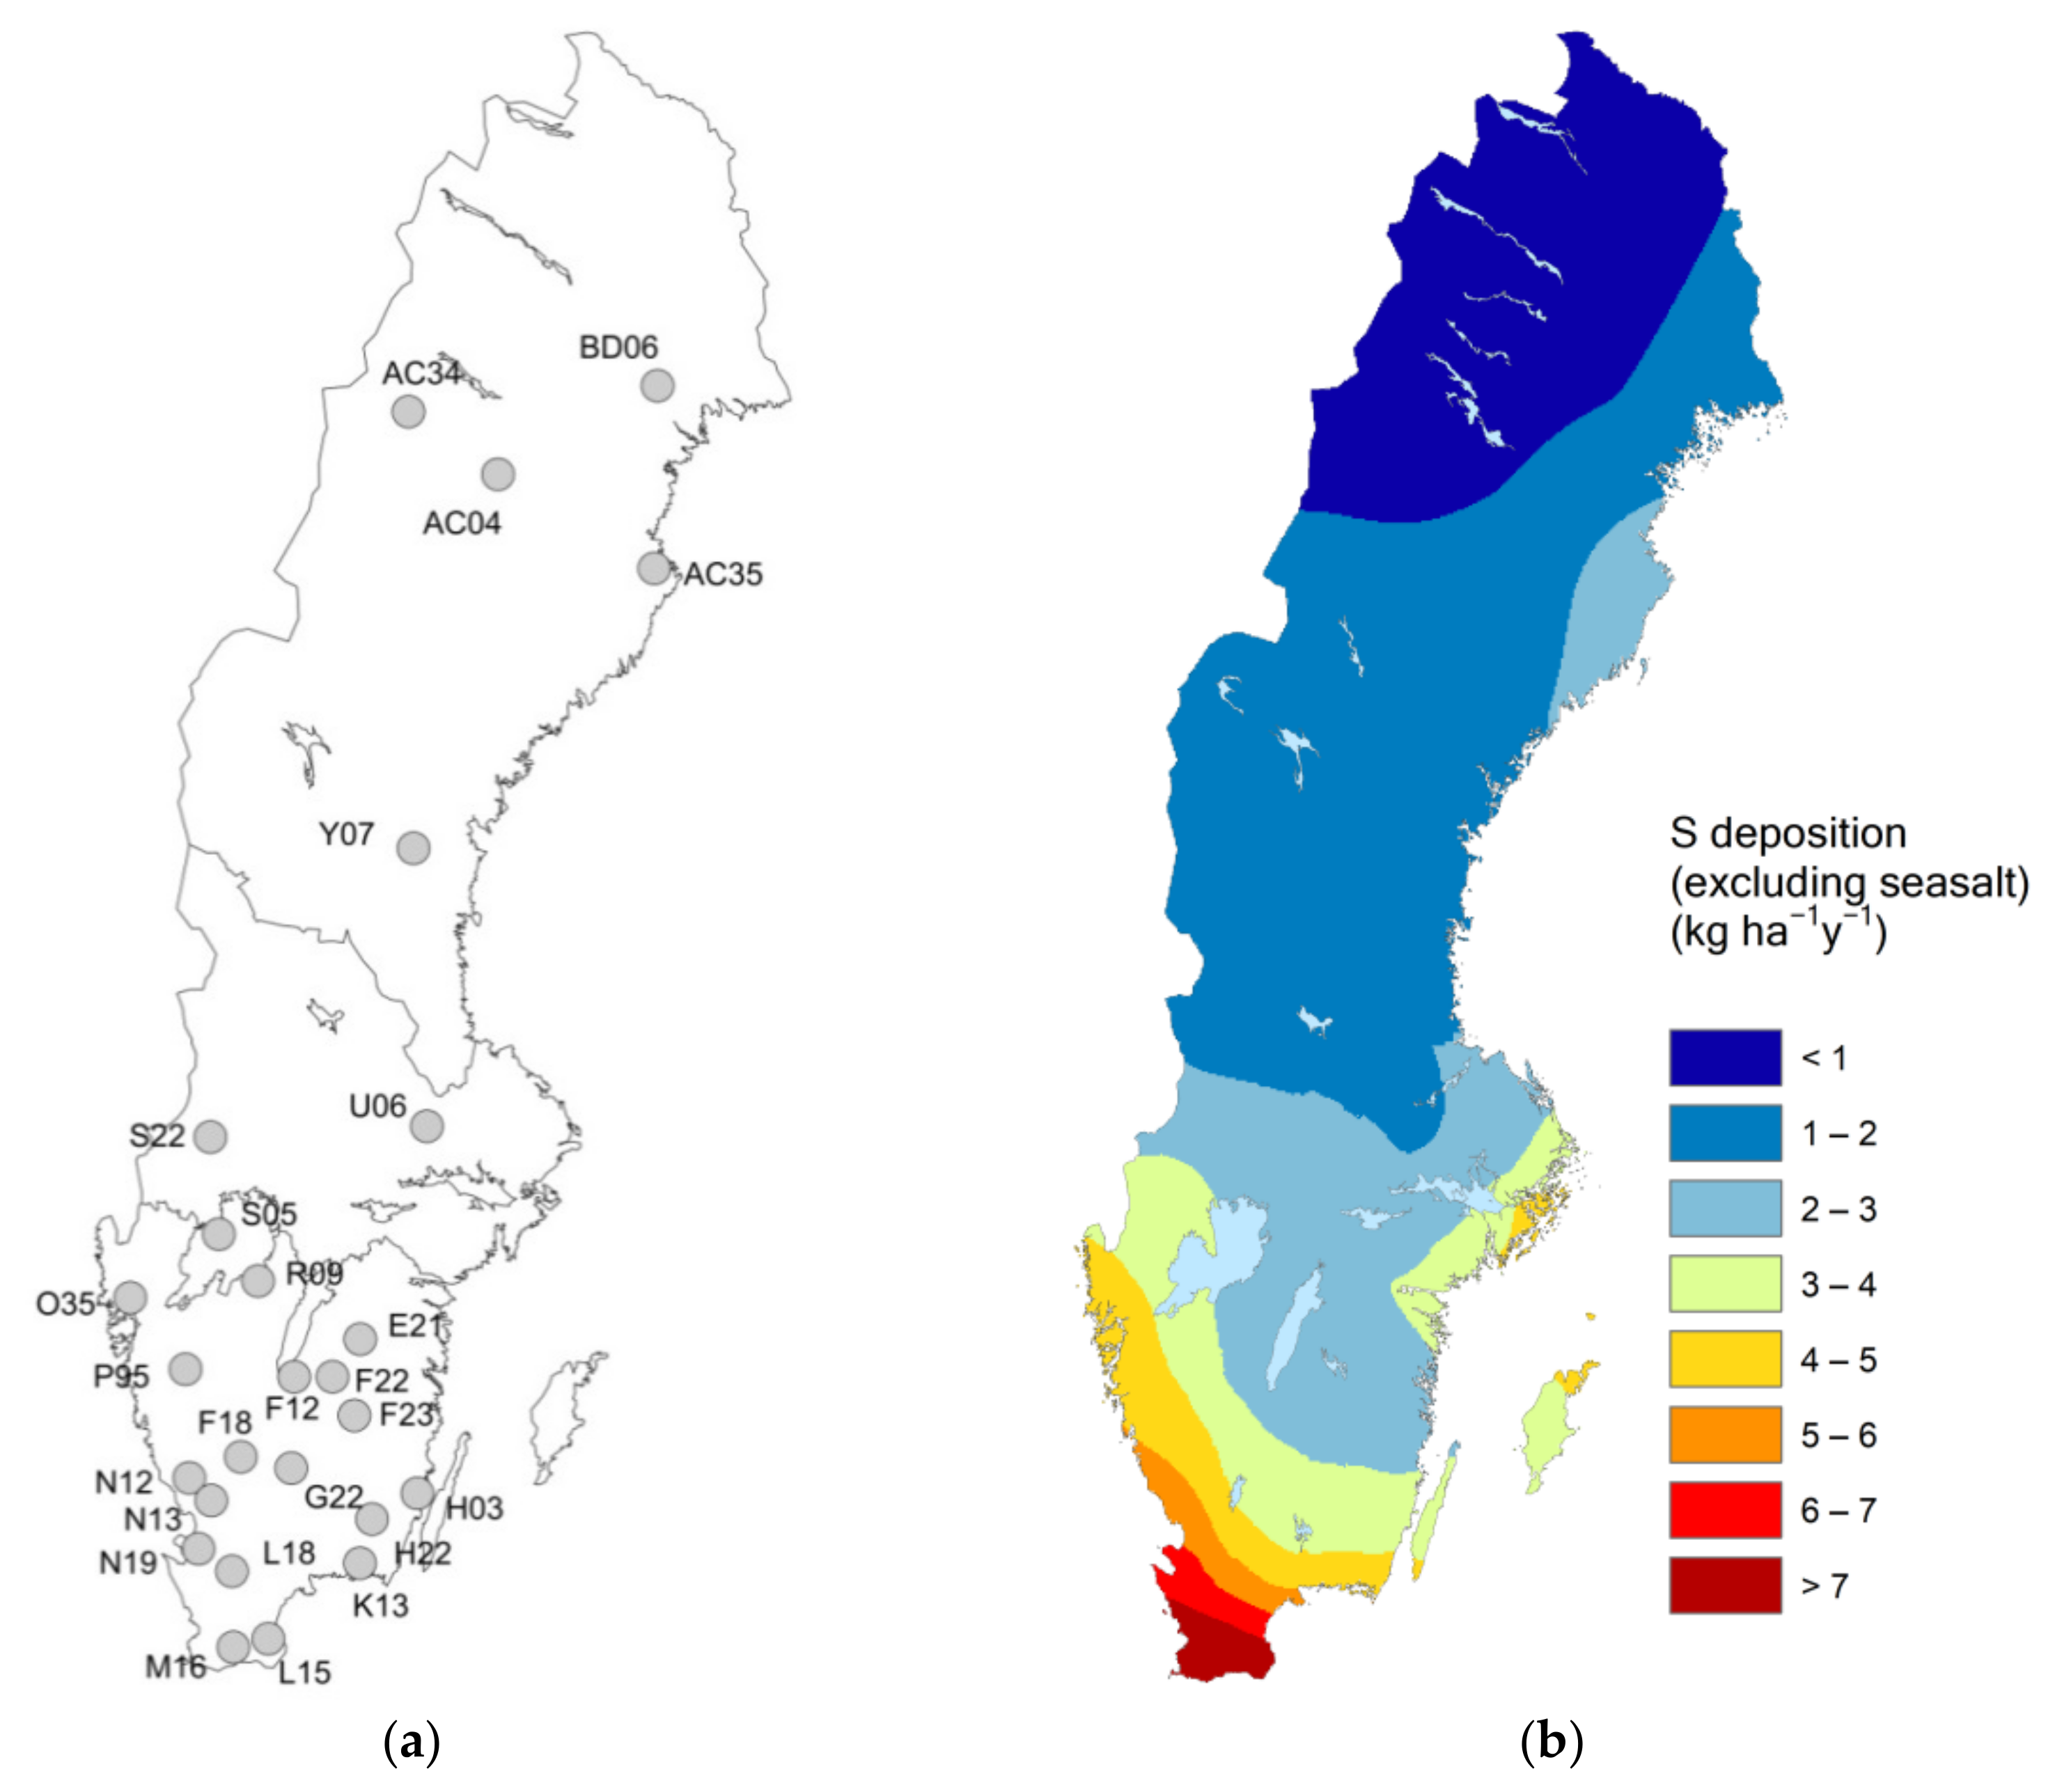
2.1. Study Sites and Measurements

The study was performed at 26 spruce sites from the Swedish Throughfall Monitoring Network (SWETHRO) [21], most of them active during all five years in the period 2014–2018 (Table 1). The 26 sites are geographically distributed across all three regions of Sweden—South, Central and North (Figure 1a)—to cover the steeply decreasing gradient of atmospheric S deposition from southwest to the north (Figure 1b). The site density is highest in the south of Sweden where deposition is highest, which is reflected in the number of sites in the three regions (Table 1).
The SWETHRO sites are 30 by 30 m squared plots within managed forest stands, where atmospheric deposition and soil solution chemistry are measured continuously. Throughfall deposition, i.e., precipitation that passed through the canopies, is collected monthly using open buckets in the winter, and polyethylene bottles with funnels threaded into the lid in the summer. Ten throughfall collectors are placed on each site, in an “L” shape along two of the borders of the monitoring area. The water samples are merged to one composite sample at the end of each month for chemical analysis at the accredited laboratory at IVL Swedish Environmental Research Institute and analyzed as described in previous studies [5]. The amount of throughfall precipitation per hectare is estimated based on the volume of water and the known diameter of the open bucket/funnel, and the throughfall deposition is derived by multiplying the amount of throughfall precipitation with measured concentrations.
For some of the sites, there are also wet deposition measurements on an open field close by, which are used to separate between wet and dry deposition. Wet deposition is measured using a 1.5 m high collector made of polyvinylchloride. A polyethylene plastic bag is placed inside the cylinder and changed at every sampling occasion. In addition, a robust plastic ring with a smooth rim is attached to the top of the cylinder. A net made of polyolefin is placed at the opening of the cylinder during spring, summer and autumn, to prevent debris to enter the plastic bag. During 2016 and 2017, the wet deposition samplers were equipped with “birdrings”, positioned horizontally around the openings of the sampler to prevent birds from sitting on the rim of the sampler.
To be able to quantify dry deposition for the chemical species that interact with the tree crowns, e.g., N, Ca, Mg, and K, string samplers are placed at the open field of some of the sites. The string samplers are placed under a transparent roof made of polycarbonate. The samplers consist of Teflon strings. They are sprayed with deionized water once a month, all year round, and the samples are sent to the laboratory for chemical analysis. During wintertime the string samplers sometimes have to be brought indoors before being sprayed with deionized water [23].
At each of the 26 sites, soil solution samples from a depth of 50 cm in the mineral soil are collected using 3–6 separate suction lysimeters with ceramic cups (P 80) (Table 1). Samples are taken three times a year: before (February–May), during (May–September), and after (September–December) the vegetation period. At the time of the sampling, negative pressure is initiated so that the lysimeter can suck in water, and after two days the water is collected. For each occasion, the water samples from the lysimeters are merged into one composite sample for analysis. If there is no collectible water, the site is still not revisited until the next scheduled sampling occasion. Drier sites therefore have fewer measurements of soil water concentrations.
Starting in 2010, a soil sampling campaign was performed at the SWETHRO sites. Soil samples from 4–5 distinct soil horizons, down to 50 cm in the mineral soil, were collected and sent for chemical analysis of, e.g., total elemental content and grain size distribution. Cylinders (three per soil sample) were used to estimate soil bulk density. Stoniness and moisture were assessed in field at all sites.

2.2. Estimation of ANC in Soil Solution

Acid neutralizing capacity (ANC in meq L−1) in soil solution was calculated for each site and each sampling occasion as:
ANC = [Ca2+] + [Mg2+] + [K+] + [Na+] + [NH4+] − [SO42−] − [Cl] − [NO3]
where all element concentrations are given in meq L−1. The median ANC for the available samples in 2014–2018 (Table 1) was calculated and used for analyses in this study.

2.3. Estimation of Exceedance of Critical Biomass Harvesting (CBH)

2.3.1. Concept

The concept critical biomass harvesting (CBH [13]) has been used in Swedish policies since 2018, when a new indicator “Acidification from forestry” was introduced in the Swedish Environmental Objective Framework. CBH builds on the same principle as critical loads (CL), which was a successful concept in reducing acidic deposition [19].
The basis for both CL and CBH calculations is the SMB formula (Equation (2), [24])
Sdep + Ndep + Cldep + BCharv +Alkleach = BCdep + BCweath + Nimm + Nharv + Nde
where dep = deposition, BC = base cations (Ca, Mg, Na and K), harv = net losses at harvesting, Alk= Alkalinity, leach = leaching, weath = weathering, imm = immobilization and de = denitrification (meq m−2 y−1).
In CL calculations, the critical load of acidity, i.e., the maximum amount of acid deposition (S + N) that can be allowed without negative ecosystem effects, is estimated through Equation (3), where all factors except Sdep and Ndep have been moved to the right side of the equation and the Alkleach is the critical alkalinity leaching (Alkleach(crit)). To calculate CL at a site, all factors on the right side of the equation except Alkleach(crit) are quantified based on site data. A chemical criterion and a critical limit are defined, linking acid deposition to ecosystem effects. They are used to calculate Alkleach(crit), which is a measure of the acidification of runoff water. Exceedance is then calculated according to Equation (4), where the actual deposition at the site is compared with the CL.
CL (Sdep + Ndep) = BCdep + BCweath + Nimm + Nharv + Nde − Cldep − BCharv − Alkleach(crit)
Exceedance = Sdep + Ndep − CL (Sdep + Ndep)
In a national study in Sweden, CBH was defined as the maximum biomass extraction that does not lead to an ANC value less than zero in the water leaving the root zone, and therefore does not lead to export of acidity [13]. Biomass harvesting contributes to the acidity flows by removing BC from the forest ecosystem. In the CBH calculations, the critical removal of BC through harvesting was quantified and compared with the actual biomass harvesting, based on Equation (2) and the same logics as in the CL calculations in Equations (3) and (4), but with a few simplifications. The chemical criterion used was ANC, and since the critical limit was set to 0, the Alkleach(crit) factor disappeared. Furthermore, the N cycling was greatly simplified based on three assumptions:
  • Only N that leaches is affecting acidity: NO3-N leaching is acidifying, one equivalent, and NH4-N leaching counteracts acidification, one equivalent, based on theories in [25].
  • N leaching is not affected by whole-tree harvesting.
  • N accumulating in soil organic matter will not contribute to acidification in the future.
By implementing those assumptions in Equation (1), CBH could be calculated using Equation (5), and exceedance could be calculated using Equation (6).
CBH (BCharv) = BCweath + BCdep + NH4-Nleach − Sdep − Cldep − NO3-Nleach
Exceedance = BCharv − CBH (BCharv)
In this study, the same formulas and assumptions as in the national CBH calculations were applied [13], and calculations were made for the upper 50 cm in the mineral soil, which is assumed to be the root zone for spruce. The calculations assume a steady state, meaning that all fluxes are given as annual averages over an entire forest rotation, varying according to site productivity. Therefore, the acidification history of a site is not taken into account, and the results only show a direction and a rate of the change.

2.3.2. The Weathering Model PROFILE

Whereas deposition, leaching, and removal of BC by harvesting can be based on site measurements, weathering rates were modelled using the PROFILE model [26]. PROFILE is a steady state soil geochemical model, in which weathering rates are calculated using transition state theory. Geochemical properties of the soil, e.g., mineral composition, mineral surface area, and soil moisture, are required as input, along with atmospheric deposition, climate, and biological parameters. An overview of the input data required for PROFILE and for calculations of CBH and its exceedance is given in Table 2, and a detailed description of the data and how they were processed is given in the following paragraphs.

2.3.3. Input Data

Deposition was required both for PROFILE modelling and for calculating CBH and its exceedance. The average deposition of S, Cl, N and BC for the years 2014–2018 was based on SWETHRO measurements (Appendix A). For S and Cl, where the canopy exchange was assumed to be very small, throughfall deposition was used. For N and the base cations Ca, Mg, and K, the canopy exchange is substantial, and thus the throughfall deposition could not be used as it is. For N, wet deposition was measured on all 26 sites. Dry deposition was estimated for ten SWETHRO sites in Sweden, based on measurements and calculations included in the surrogate surface method [23]. These results were generalized to all 26 sites, based on a method where the share of dry to total deposition of inorganic N (NO3-N + NH4-N) could be correlated with geographical position [23]. Wet deposition of Ca, Mg, and K for 2014–2018 was available for 14 of the 26 sites (Table 1). For the sites missing measurements, wet deposition was derived from interpolation using the inverse distance method. For this interpolation, the 14 sites, and additionally 12 sites from the SWETHRO network not included in this study but for which wet deposition data were available, were used. Dry deposition of Ca, Mg, and K was estimated based on the relationship between wet and dry deposition in an extensive modelling study based on data from 1998 [28,29], assuming that the relationship between wet and dry deposition has been constant over time. Na was assumed to come only from sea salt, and was calculated based on Cl deposition and the sea salt composition.
Climate data was required for the weathering modelling. Temperature, precipitation, and runoff for the years 2014–2018 were obtained from Swedish Meteorological and Hydrological Institute (SMHI) (Appendix A). Temperature and precipitation were extracted from the database PTHBV (data delivered in August 2020). Runoff was derived from SMHI:s water web, with data for 40,000 subcatchments in Sweden.
Leaching of N in the form of NH4-N and NO3-N was required for the CBH calculations, and was based on measurements of concentrations in soil solution at 50 cm depth and runoff (Table 3; Appendix A). Median concentrations from the years 2014–2018 were multiplied with runoff from the sites. For the results to be representative for a forest rotation, NO3-N after clearcutting was added. For that, an empirical function from was used, where NO3-N leaching in the clearcut phase was related to site productivity [30].
Net harvest losses of N and BC by whole-tree harvesting were required inputs for weathering modelling with the PROFILE model, and net harvest losses of BC were also important in the calculations of exceedance. The net harvest losses were calculated based on site productivity from the sites, derived from site index (Table 1). The site productivity is the growth of a stand under optimal conditions, and to imitate real conditions the site productivity was reduced by 20%, in accordance with earlier mass balance studies [13,31]. All stems and 60% of the branches, accompanied by 75% of their needles, were assumed to be harvested, in accordance with a scenario from the Swedish Forest Agency [32]. The calculations were performed in the same way as in a national CBH study [13], and the methodology along with densities and nutrient concentrations in different tree parts are given there.
Data on soil properties were important inputs to the weathering model PROFILE. Soil data in this study came from soil samplings at the sites, performed between 2010 and 2016. One of the required inputs was mineralogy for all soil layers, which was not measured, but can be calculated from measured total elemental content, quantified by plasma emission spectrometry analysis (ICP-AES). The total elemental content was used in the A2M program [27], model version 1.41, to calculate all possible mineral modes given a set of allowed minerals. However, for the organic upper layer the total elemental content from the second layer was used since the organic material in the organic layer substantially affects the total elemental content. For each layer at each site, the arithmetic means from A2M were then selected to represent the mineralogy at each layer. In absence of any other information, this was regarded as the best solution as it represents the barycentre of the solution polyhedron spanned by the extreme modes [27]. Mineralogies used for the sites are presented in Appendix B.
Soil bulk density was derived by weighing the dried samples collected with cylinders with known volume. Specific surface area was estimated based on grain size distribution and an empirically derived formula [33]. Stoniness (volume fraction of stones and boulders) and moisture were estimated based on visual assessments on the sites. Moisture was translated from a moisture class to m3 water per m3 soil [22]. Soil input data are described in Appendix C and Appendix D.

2.4. Risk Classification

As a basis for the risk classification, factor two, exceedance of CBH was plotted against factor one, ANC in soil solution. The sites were then grouped into three classes, based on their position in the graph (Table 4). Sites where both factors indicated risks related to acidification, i.e., sites where ANC was negative and whole-tree harvesting led to an exceedance of CBH, were placed in Class 1. Sites for which one of the factors indicated a risk but not the other, i.e., either negative ANC and no exceedance, or positive ANC and exceedance, were placed in Class 2. Finally, sites where none of the factors indicated risks related to acidification, i.e., sites for which ANC was positive and whole-tree harvesting did not lead to an exceedance of CBH, were placed in Class 3.

3. Results

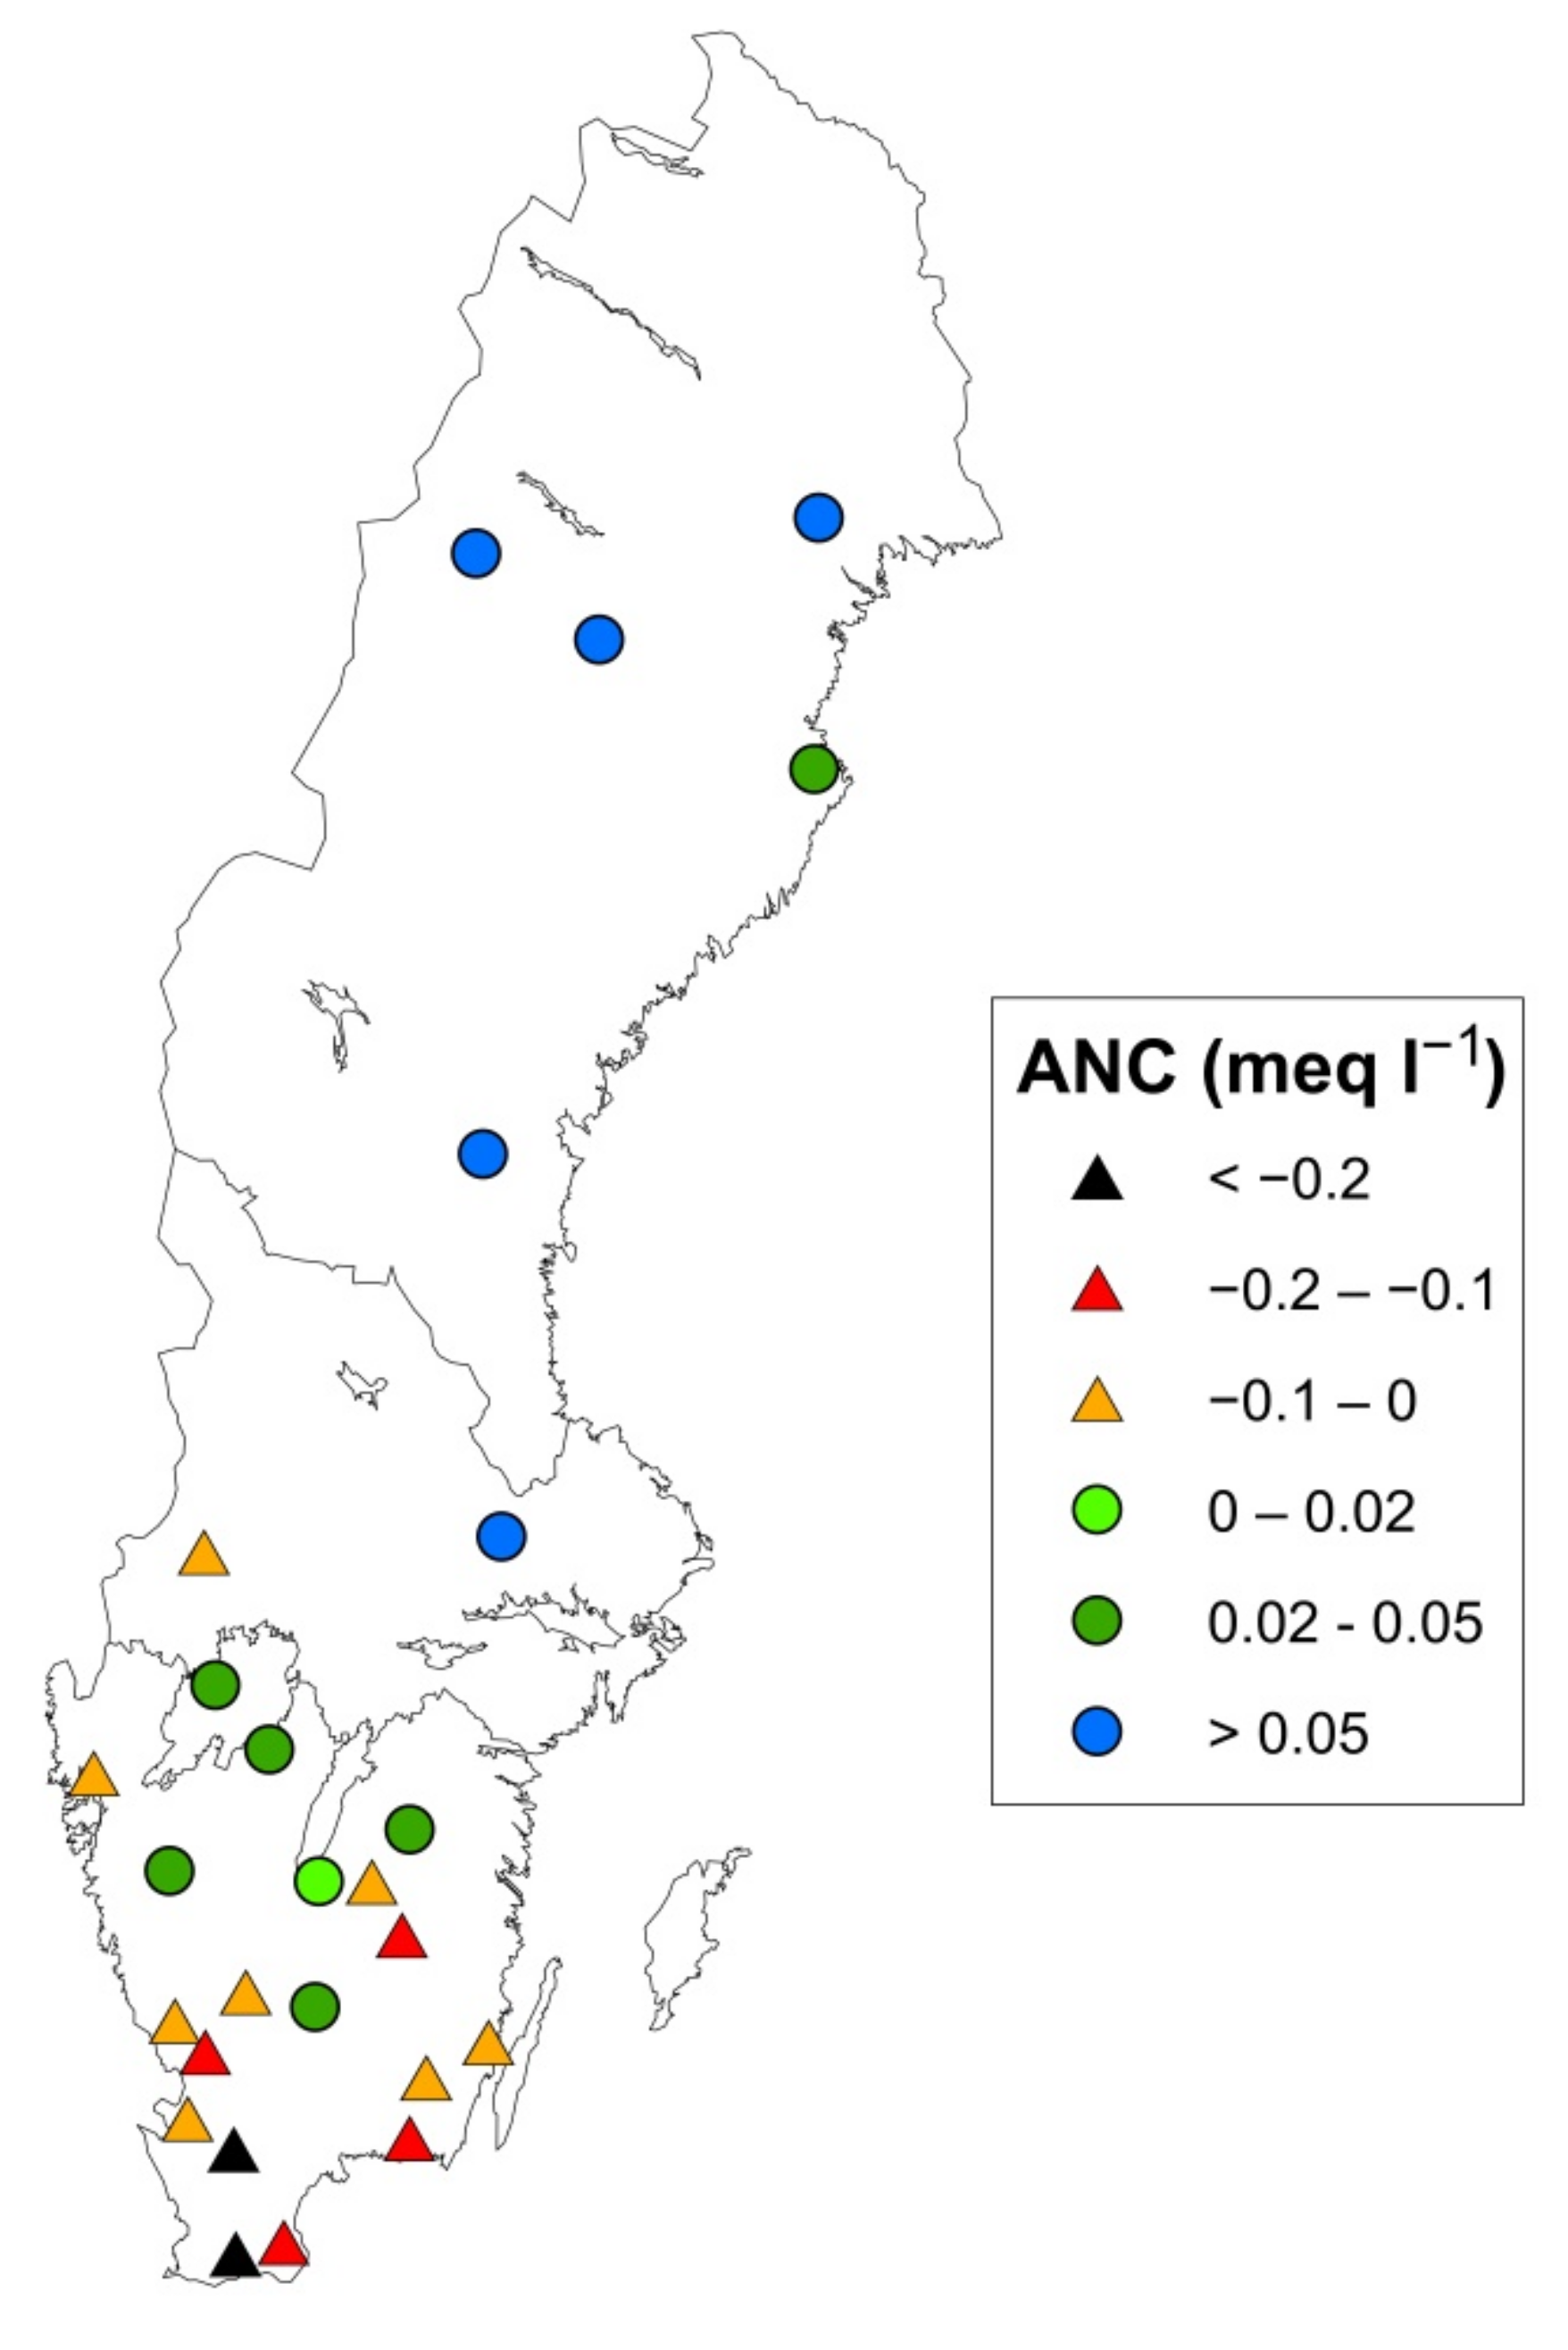
3.1. Present Soil Status: ANC in Soil Water (Factor 1)

ANC in soil solution spanned from −0.29 meq L−1 to 0.39 meq L−1, along a geographical gradient with generally higher ANC towards the north, although several deviations occurred at the regional scale (Figure 2, Table 3). In the northern region, ANC was clearly positive at all five sites. In the central region, ANC was positive at two sites and negative at one. In the southern region only four of the eighteen sites showed a positive ANC.

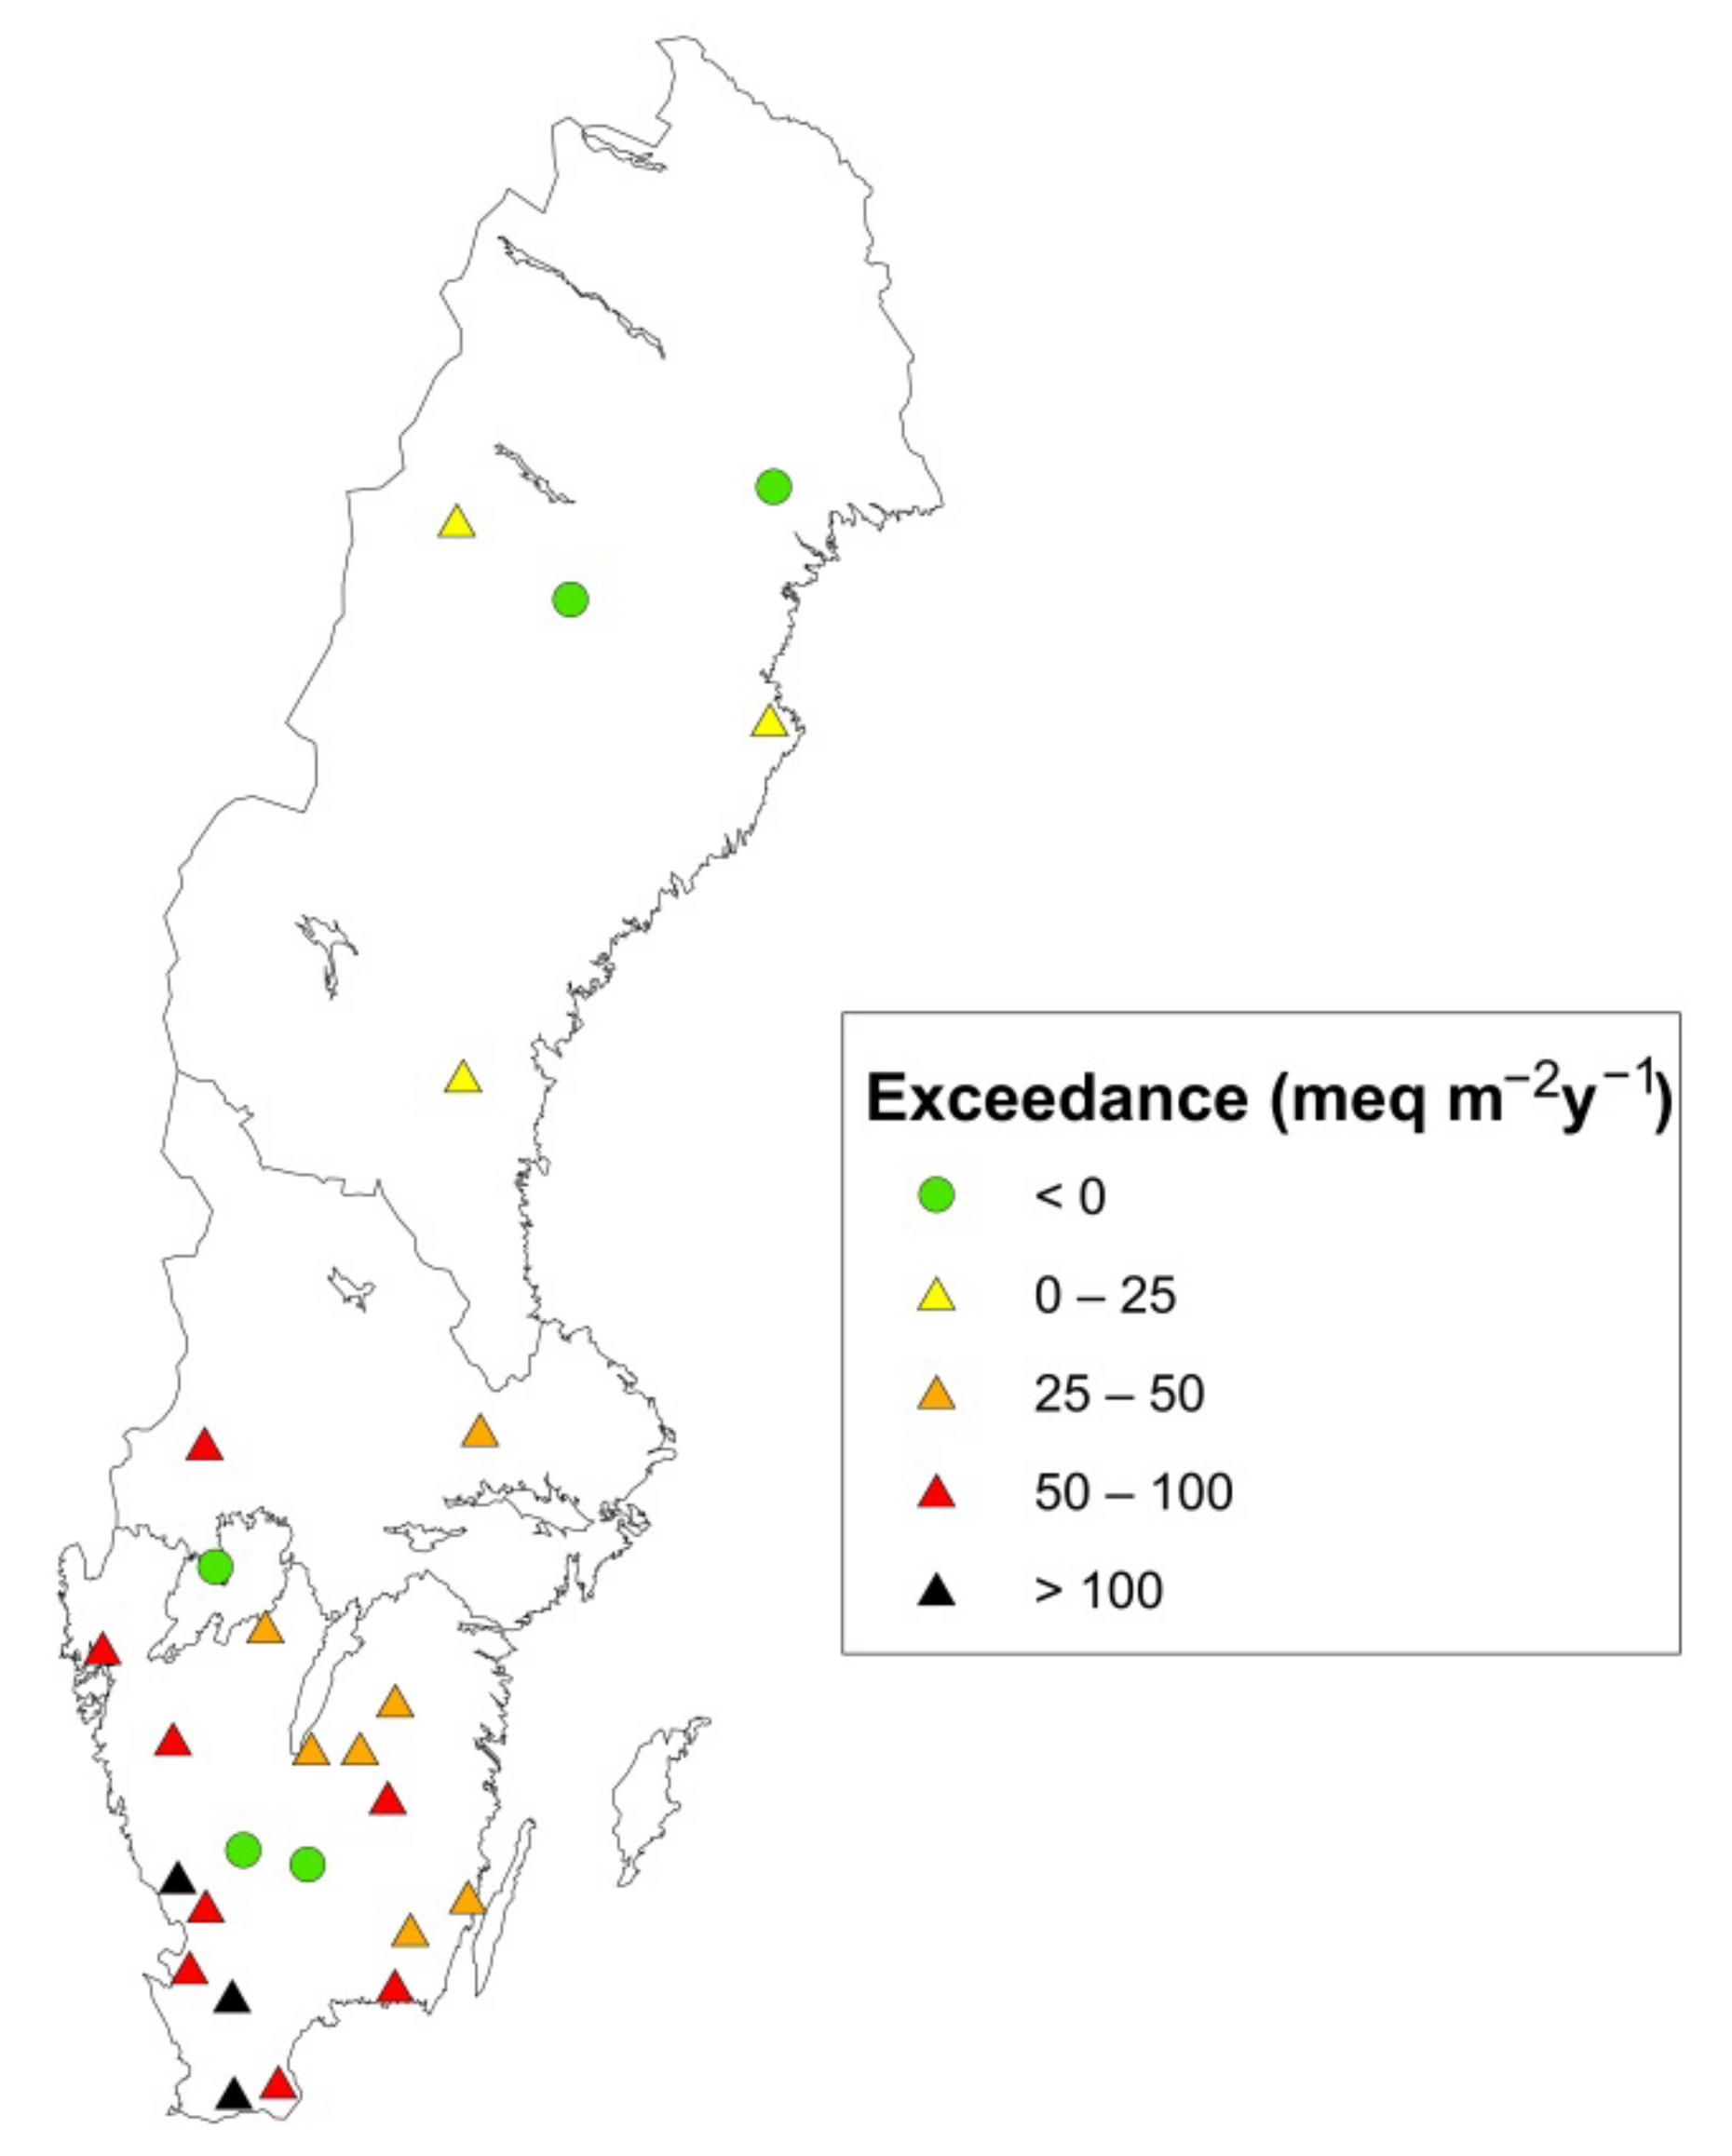
3.2. Effect of Whole-Tree Harvesting: Exceedance of CBH (Factor 2)

The CBH calculations showed an exceedance of critical harvesting for 21 of the 26 sites (Figure 3, Table 5). Just as for ANC in soil solution, there was a clear geographical gradient, with a generally decreasing exceedance towards the north. In the northern region, there was no exceedance for two of the five sites, and a low exceedance (up to 25 meq m−2 y−1) for the others. In the central and southern regions, the exceedance was above 25 meq m−2 y−1 for most of the sites, and at three of the sites in southernmost Sweden the exceedance was over 100 meq m−2 y−1. In the central and southern regions, three sites stood out with negative exceedance.

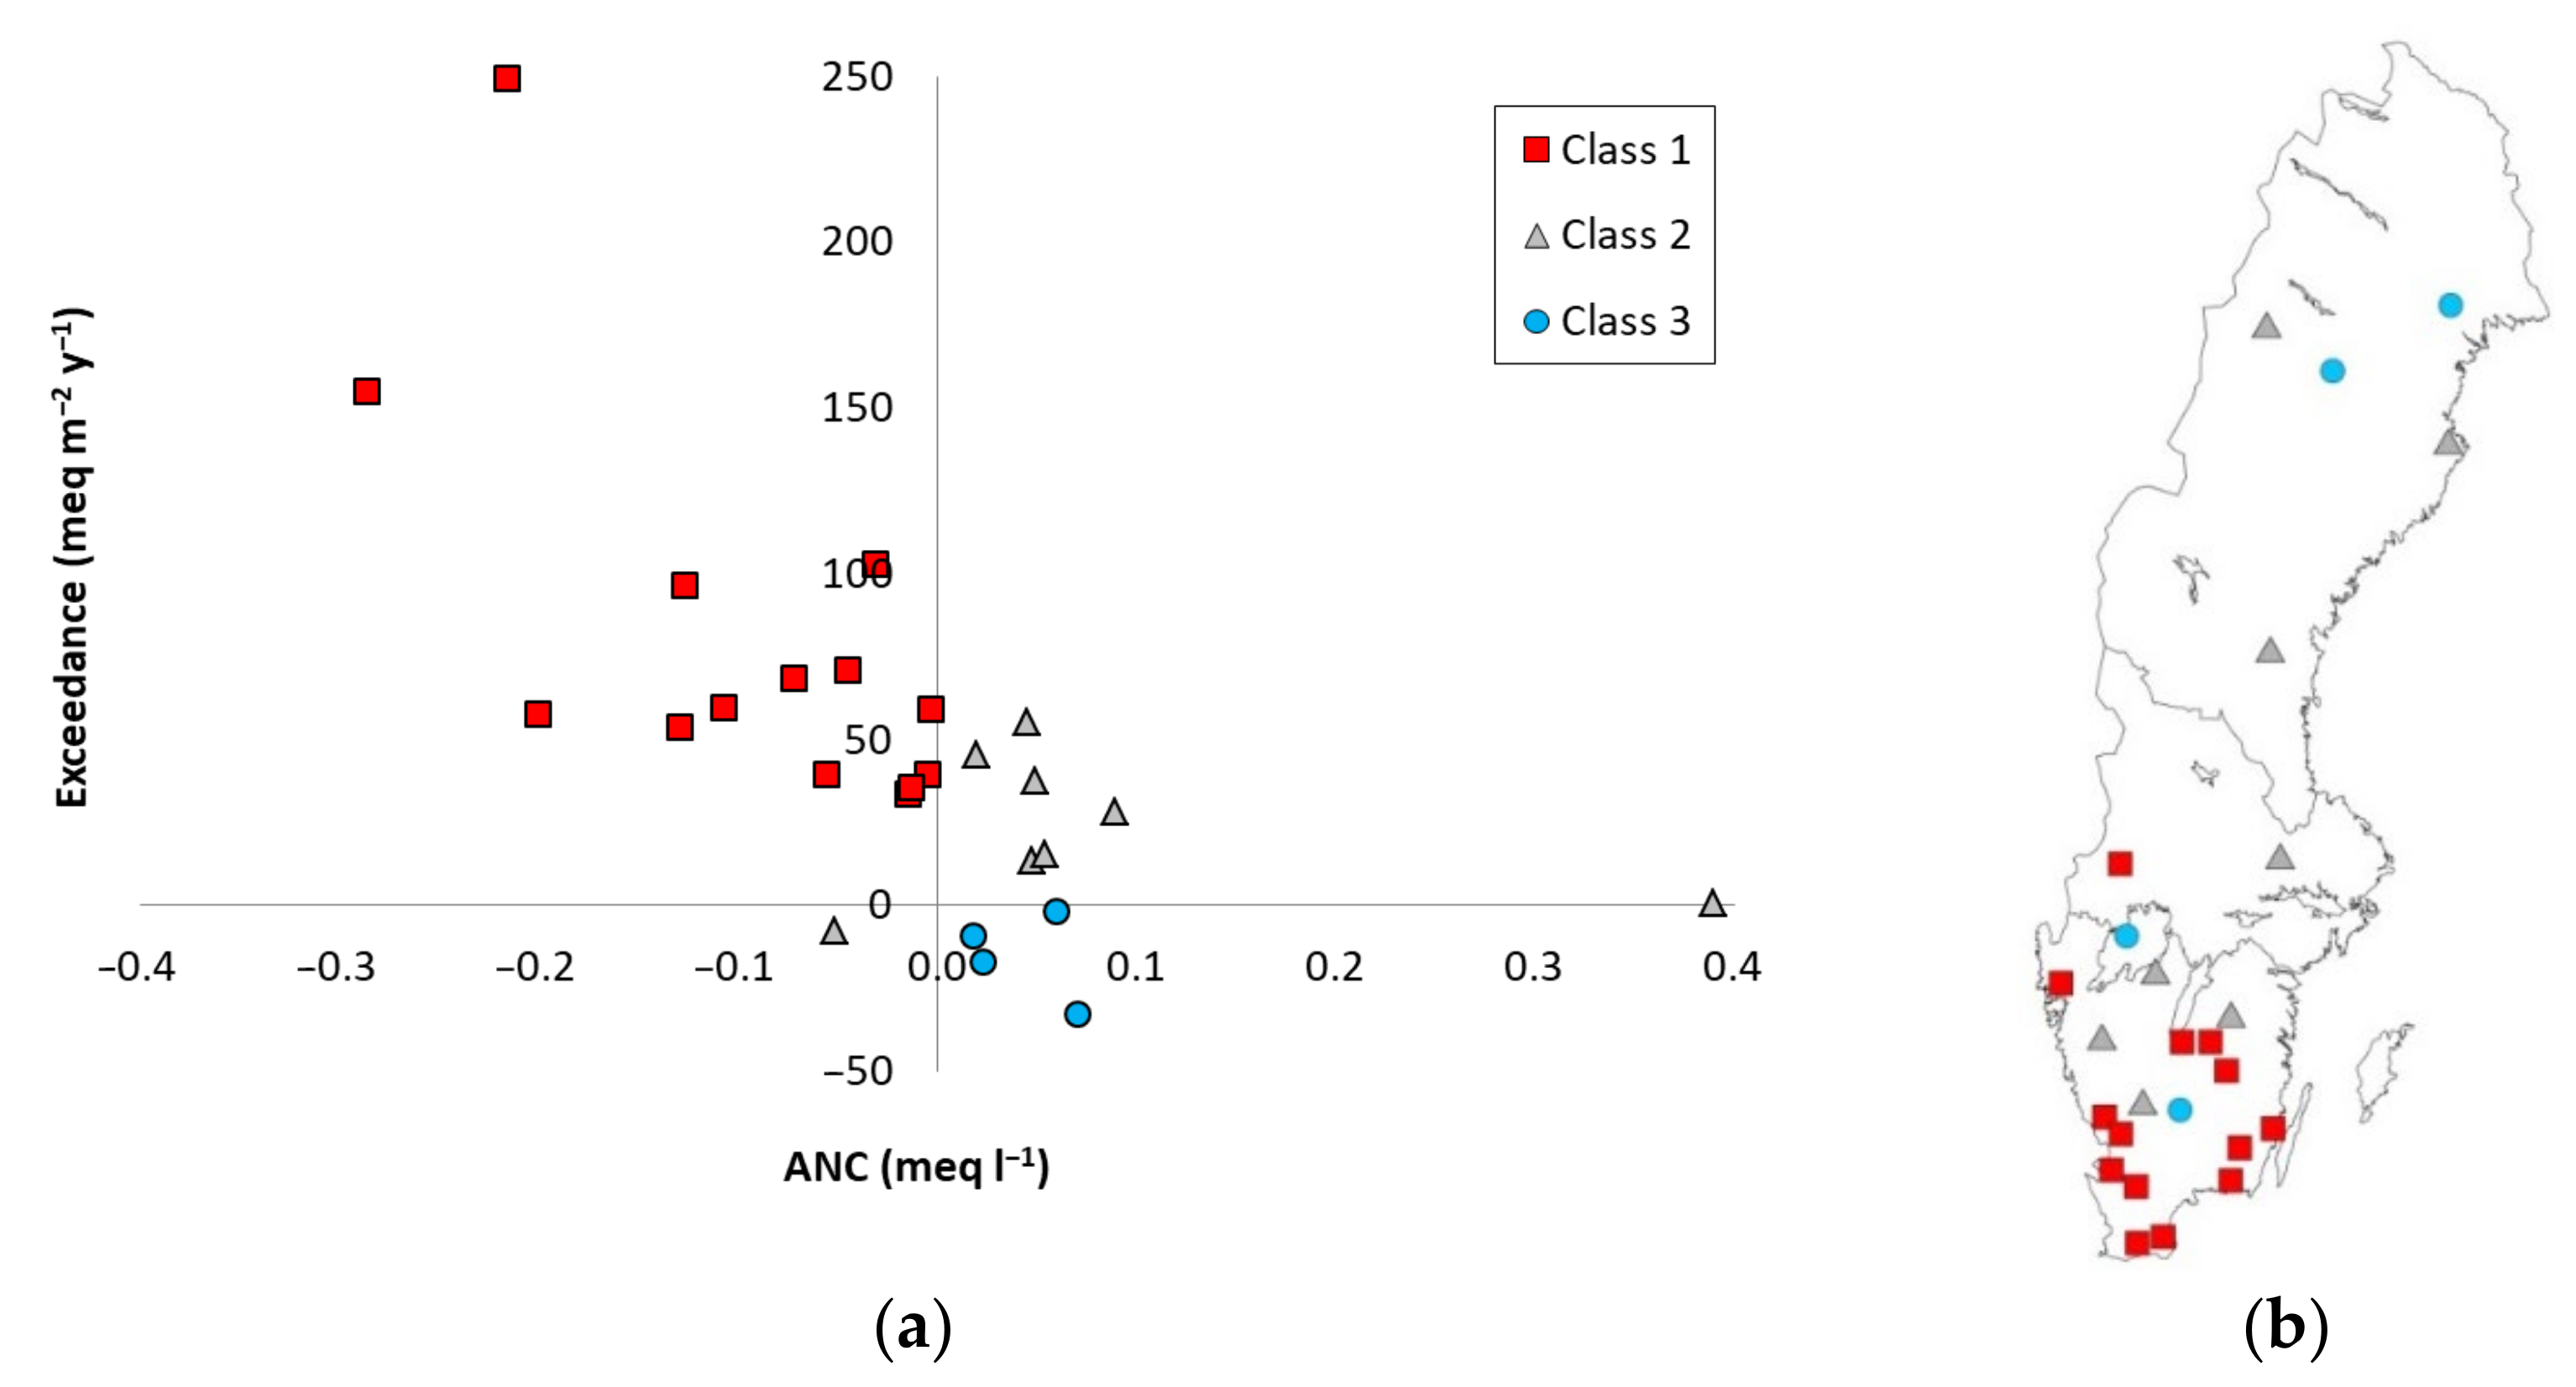
3.3. Risk Classification Based on the Two Factors

A comparison between ANC in soil solution and the exceedance of CBH for the 26 sites showed that exceedance was negatively and significantly (p = 0.00025) correlated with ANC in soil solution (Figure 4a). A slightly weaker correlation was also found between ANC and CBH (p = 0.0046).
The risk classes (Table 4) were unevenly distributed in the country (Figure 4b, Table 6). Risk Class 1 was highly dominating in the southern region, whereas the sites in the northern region belonged to either Class 2 (three sites) or Class 3 (two sites). In the central region, with only three sites, all three classes were represented.

4. Discussion

4.1. Geographical Distribution of Risk Classes

The geographical pattern, with Risk Class 1 highly dominating in the southern region and Risk Class 2 and 3 dominating in the other regions, could be explained by the S deposition gradient with decreasing deposition towards the north (Figure 1b), and the site productivity gradient going in the same direction (represented by site index in Table 1). The historical S deposition, which has been higher than today but always followed a similar gradient [2], could be regarded as the main explanatory factor for the gradient for the first factor in the risk classification: ANC in soil solution. S deposition causes BC to leach from the soils [3], and the effect could be seen in the relationship between S and the base cations Ca, Mg, and K in soil solution, with generally more S compared to BC towards the south (Table 3). For the second factor, exceedance of CBH, site productivity was the most important reason for the gradient. Higher site productivity in the south leads to more removal of base cations at whole-tree harvesting (Table 5), which increases the risk of exceedance of CBH. This is consistent with the conclusions from a study at nine forest sites with different site productivity in Sweden and Scotland where fast growing forests led to more acidification than slow growing forests [8].
The sites in Risk Class 1 had all been exposed to high S deposition and all had high site productivity. The two sites with the lowest ANC, M16 and L18, situated in the southernmost part of Sweden, were the only sites with elevated NO3-N concentrations in soil solution. This had a high impact both on ANC in soil solution and exceedance of CBH, and highlights the considerable potential of acidification from N deposition in areas where the N retention capacity is being exceeded [25,34].
Sites in Risk Class 3 appeared in the whole country, except for in the far south. Three of the sites, BD06, S05, and G22, had high weathering rates in comparison with most of the other sites (Table 5), which can partly explain both the high ANC and the negative exceedance. The site productivities for BD06 and S05 were low, which was also the case for the fourth site, AC04, and low site productivities were an important contributing factor for the negative exceedance at those sites.
Additionally, the sites in Risk Class 2 were spread over the country. Several of the sites had values close to 0 for ANC and/or for exceedance of CBH, and for those sites, uncertainties have a great impact in the risk classification. Seven of the eight sites in Class 2 had positive ANC, but the CBH calculations showed exceedance at whole-tree harvesting. Three of these sites, in the northern parts of the southern region, E21, R09, and P95, were situated outside the area with the highest historical S deposition (Figure 1b), but still in the part of southern Sweden where site productivities are generally high, which could explain the combination of positive ANC and exceedance of CBH. In northern Sweden, the exceedances were generally close to 0, and small differences in weathering rates, deposition or site productivity determined if the estimated exceedance was positive or negative. The site AC34 had an exceedance just above 0, but very high ANC. The high ANC indicates that there are sources of base cations not accounted for in the CBH calculations, e.g., that weathering rates are underestimated.
One of the eight sites in Class 2, F18, had a slightly negative ANC, but CBH was not exceeded at whole-tree harvesting. Negative exceedance at a site in this part of Sweden, where most sites show exceedance, could be explained by a combination of higher estimated weathering rates and a somewhat lower site productivity than at most surrounding sites.
The low density of sites in the central and northern regions in this study limited the possibilities to perform geographical generalizations. However, earlier studies of ANC in soil solution [21,35] and exceedance of CBH [13] at higher resolution can contribute to the interpretation of the results in this study. The ANC gradient over Sweden has been presented for 2006–2008 [21] and 2017–2019 [35], where ANC on all SWETHRO sites active those years were included (55 sites in 2006–2008 and 48 in 2017–2019). Although the ANC levels were generally slightly lower in 2006–2008 than in 2017–2019, indicating a slight recovery, both of those two studies showed positive ANC in the north (except for one site along the east coast in 2006–2008), ANC around 0 in the central part, and mainly negative ANC in the southern part, just as in the present study.
A high resolution national mapping of exceedance of CBH [13] showed that CBH was generally exceeded in spruce forests in Sweden at whole-tree harvesting, except for the inner part of northern Sweden, but it also showed that there were several exceptions for some areas in central Sweden and also a few areas in southern Sweden where there was no exceedance. This is consistent with the results from this study.

4.2. Policy Implications

At sites in Risk Class 1, from which the water leaving the root zone has no buffering capacity (ANC < 0) and where whole-tree harvesting leads to an exceedance of CBH, whole-tree harvesting is not sustainable from an acidification point of view. The sites in Risk Class 1 were situated in the southern part of Sweden, where recovery can be expected to be slow or non-existing even when whole-tree harvesting is not applied [5]. Whole-tree harvesting will lead to further loss of buffering capacity, which may inhibit recovery from acidification and thereby exacerbate the acidification status of the forest site. Wood ash recycling means that nutrients are returned to the soil, but there is a risk that the lost nutrients are only partly compensated for and/or that there is a time lag before the effect of wood ash recycling appears. Based on this, our assessment is that whole-tree harvesting at sites belonging to Risk Class 1 is not compatible with the Swedish environmental objective about acidification, even if the removal of base cations is compensated for by wood ash recycling.
For Risk Class 2, ANC and/or exceedance of CBH was often close to 0. Due to uncertainties in measurements and calculations, the class affiliation in itself was more uncertain than for Class 1. Sites that have a positive ANC, but an exceedance of CBH at whole-tree harvesting, have a better starting point than those in Risk Class 1, but the exceedance indicates that whole-tree harvesting is not sustainable in the long term; i.e., it will lead to loss of buffering capacity and a decrease in ANC. If ANC is decreasing at sites within this ANC interval, pH can be expected to be substantially affected. This was highlighted in a study on the effects of whole-tree harvesting and wood ash recycling on ANC in surface waters [36]. By compensating for the losses through wood ash recycling, the loss of buffering capacity caused by whole-tree harvesting can be inhibited. Sites in Risk Class 2 that have a negative ANC but no exceedance of CBH at whole-tree harvesting have the potential for recovery, but whole-tree harvesting will slow it down. We suggest that whole-tree harvesting at sites belonging to Risk Class 2 should be accompanied with wood-ash recycling.
In Risk Class 3, ANC was positive and the CBH was not exceeded at whole-tree harvesting. Our assessment is that the risk of negative effects of whole-tree harvesting on the acidification status is small, and that wood-ash recycling is not necessary at those sites.
In Risk Classes 1 and 2, where runoff water is already acidified or where acidification is in progress, there is a risk that nutritional imbalances will arise, which has been indicated in European studies [34,37]. This can, in turn, have a negative effect on tree vitality and tree growth [38,39]. Thus, although the risk assessment in this study focuses on the quality of the runoff water leaving the root zone, with potential effects on surface water, it is also highly relevant for soil acidification and tree nutrition. This study focuses on acidification, but there are other environmental aspects that can place restrictions on sustainable biomass harvesting, e.g., biodiversity [40]. These aspects should be taken into account in an overall risk assessment for sustainable biomass harvesting.

5. Conclusions

We investigated two factors for the assessment of the sustainability of whole-tree harvesting after clear-cutting: present acidification status represented by ANC in soil solution and exceedance of CBH. The two factors were negatively correlated, and the three risk classes, based on the two factors, showed a clear geographical pattern, although some deviations occurred. The gradients of historical S deposition and the site productivity were identified as the main causes of the geographical pattern. The high potential impact of acidification from N was highlighted at the two most extreme sites in the risk classification, where the N retention capacity was exceeded and nitrification caused acidification. The impact of soil weathering could be seen at single sites with high weathering rates, which were assigned in the low risk class, although historical S deposition and site productivity were high. The results strengthen the Swedish recommendations that wood ash recycling should be applied after whole-tree harvesting, except in the areas with low site productivity corresponding mainly to the inner part of northern Sweden. However, by including the present acidification status, we have also identified sites in southern Sweden where we assess that whole-tree harvesting is not compatible with the Swedish acidification objective.

Author Contributions

Conceptualization, C.A., S.B.; methodology, C.A., G.Z., S.B., V.K.; validation, C.A.; V.K.; S.B.; formal analysis, C.A., G.Z., S.B., V.K.; investigation C.A., V.K., N.S., G.P.K., P.E.K., S.H.; resources, C.A.; data curation, C.A., V.K.; writing—original draft preparation, C.A.; writing—review and editing, C.A, G.Z, V.K., S.B., P.E.K., N.S., G.P.K., S.H.; visualization, C.A.; project administration, C.A.; funding acquisition, C.A. All authors have read and agreed to the published version of the manuscript.

Funding

This research was funded by Lund University and by the Swedish research Council for Environment, Agricultural Sciences and Spatial Planning (FORMAS), through the strong research environment, QWARTS (212-2011-1691).

Informed Consent Statement

Not applicable.

Data Availability Statement

Input data for weathering modelling and CBH calculations are available in Appendix A (climate and deposition), Appendix B (mineralogy), and Appendix C and Appendix D and Table 1 (soil properties). Site productivity is available in Table 1, and nutrient concentrations and tree densities used in the calculations of removal of nutrients are published in papers referred to in the methods section. ANC in soil solution used in the risk classification is presented in Table 3. Deposition and soil solution chemistry presented in this paper is average or median values. The original data can be downloaded from the IVL website, www.ivl.se (accessed on 19 February 2021).

Conflicts of Interest

The authors declare no conflict of interest.

Appendix A

Table A1. Climate data and atmospheric deposition.
SiteClimateDeposition, kg ha−1 y−1
T, °CPrec, mmQ, mmS NO3-N NH4-NClCa Mg KNa
BD061.96942890.650.691.101.840.590.150.441.02
AC340.36875550.500.590.934.270.570.170.782.38
AC041.56354110.520.570.902.080.500.160.851.16
AC354.07093461.911.150.993.360.790.300.741.87
Y072.97694390.771.301.113.990.760.200.492.22
U066.95992170.882.172.314.681.290.441.562.61
S225.68344552.003.473.5013.570.930.400.997.55
S058.07063042.003.833.8222.991.640.751.6012.79
R098.46262241.633.194.5822.011.651.041.6812.25
O357.911026195.245.414.4570.832.122.301.4939.41
E217.56531911.102.964.309.751.750.932.125.43
P957.410475774.635.584.5763.031.942.071.5535.07
F227.06712361.413.284.7612.641.790.932.247.03
F127.06982491.483.495.0419.201.881.242.1510.69
F237.36812231.803.304.8215.161.660.622.448.43
F187.79294772.625.635.3241.022.242.042.2622.83
G227.77543481.913.935.6320.211.751.132.6711.25
N128.011697346.956.556.19107.882.703.052.2060.03
H038.65641801.854.233.8915.872.720.852.098.83
N138.310977535.276.696.3366.523.033.852.2737.01
H228.16962312.004.564.2514.112.311.122.137.85
N198.212085685.345.738.6757.482.632.392.3731.98
K138.87202473.125.014.7024.402.341.352.1113.58
L188.68734875.035.708.6855.402.441.772.3930.83
L158.78863715.936.509.4138.552.761.652.7521.45
M168.78102778.167.3210.5854.332.901.492.9030.23

Appendix B

Table A2. Minerals used for each site in the A2M model. The mineralogy is based on previously developed mineral zones of Sweden. All sites additionally include Quartz (Qz), Water (Wa), Hematite (Hem), Rutile (Ru), and Gibbsite (Gibb).
SiteMinerals 1
BD06Apa Bt Chl2 Ept Hbl Ill2 Or90 Ab100 An100 CPx Vrm1
AC34Apa Cc Chl1 Chl2 Ept Hbl Ill2 Or100 Mus Ab100 An100 Vrm2
AC04Apa Bt Chl2 Ept Hbl Ill2 Or90 Ab100 An100 CPx Vrm1
AC35Apa Bt Chl2 Ept Hbl Ill2 Or90 Ab100 An100 CPx Vrm1
Y07Apa Chl1 Chl2 Ept Hbl Ill2 Or100 Mus Ab100 An100 Vrm1 Vrm2
U06Apa Chl1 Chl2 Ept Hbl Ill2 Or100 Mus Ab100 An100 Vrm1 Vrm2
S22Apa Chl1 Chl2 Ept Hbl Ill1 Or100 Mus Ab100 An100 Vrm1 Vrm2
S05Apa Chl1 Chl2 Ept Hbl Ill1 Or100 Mus Ab100 An100 Vrm1 Vrm2
R09Apa Chl1 Chl2 Ept Hbl Ill1 Or100 Mus Ab100 An100 Vrm1 Vrm2
O35Apa Chl1 Chl2 Ept Hbl Ill1 Or100 Mus Ab100 An100 Vrm1 Vrm2
E21Apa Chl1 Chl2 Ept Hbl Ill1 Or100 Mus Ab100 An100 Vrm1 Vrm2
P95Apa Chl1 Chl2 Ept Hbl Ill1 Or100 Mus Ab100 An100 Vrm1 Vrm2
F22Apa Chl1 Chl2 Ept Hbl Ill1 Or100 Mus Ab100 An100 Vrm1 Vrm2
F12Apa Chl1 Chl2 Ept Hbl Ill1 Or100 Mus Ab100 An100 Vrm1 Vrm2
F23Apa Chl1 Chl2 Ept Hbl Ill1 Or100 Mus Ab100 An100 Vrm1 Vrm2
F18Apa Chl1 Chl2 Ept Hbl Ill1 Or100 Mus Ab100 An100 Vrm1 Vrm2
G22Apa Chl1 Chl2 Ept Hbl Ill1 Or100 Mus Ab100 An100 Vrm1 Vrm2
N12Apa Chl1 Chl2 Ept Hbl Ill1 Or100 Mus Ab100 An100 Vrm1 Vrm2
H03Apa Chl1 Chl2 Ept Hbl Ill1 Or100 Mus Ab100 An100 Vrm1 Vrm2
N13Apa Chl1 Chl2 Ept Hbl Ill1 Or100 Mus Ab100 An100 Vrm1 Vrm2
H22Apa Chl1 Chl2 Ept Hbl Ill1 Or100 Mus Ab100 An100 Vrm1 Vrm2
N19Apa Chl1 Chl2 Ept Hbl Ill1 Or100 Mus Ab100 An100 Vrm1 Vrm2
K13Apa Chl1 Chl2 Ept Hbl Ill1 Or100 Mus Ab100 An100 Vrm1 Vrm2
L18Apa Chl1 Chl2 Ept Hbl Ill1 Or100 Mus Ab100 An100 Vrm1 Vrm2
L15Apa Chl1 Chl2 Ept Hbl Ill1 Or100 Mus Ab100 An100 Vrm1 Vrm2
M16Apa Chl1 Chl2 Ept Hbl Ill1 Or100 Mus Ab100 An100 Vrm1 Vrm2
1 Abbreviations of minerals: Apa: Apatite; Bt: Biotite; Cc: Calcite; Chl1: Chlorite1; Chl2: Chlorite2; Ept: Epidote; Hbl: Hornblende; Ill1: Illite1; Ill2: Illite2; Or100: Orthoclase100; Or90: Orthoclase90; Mus: Muscovite; Ab100: Albite; An100: Anorthite; CPx: Clinopyroxene; Vrm1:Vermiculite1; Vrm2: Vermiculite2.
Table A3. Stoichiometry used for the normative mineralogy.
MineralSiTiAlFeMgCaNaKPH
Albite 3010001000
Anorthite2020010000
Apatite0000050031
Biotite2189136909004680162
Calcite0000010000
Chlorite113811241241073200442
Chlorite2871100581030000302
Clinopyroxene94375310743339020000
Epidote620481504000022
Gibbsite0010000000
Hematite0001000000
Hornblende10,100183360030003500276790030003133
Illite168052000012040
Illite266042842013040
Muscovite60148640122047
Orthoclase90300100001900
Orthoclase1003010000100
Quartz1000000000
Rutile0100000000
Vermiculite1293016218210320000804
Vermiculite21230682210310000490
Water0000000001

Appendix C

For all sites used in this study except BD06, clay and silt were not separated in the grain size analysis. Other sites in the SWETHRO database and in other databases had separate analyses of clay and silt, and the average fraction from these soil samples was used for the sites with missing data (Table A4).
Table A4. Average proportions of clay in the clay+silt fraction in three different databases. The overall average was used in this study.
DatabaseNumber of SitesSite NamesAverage (%)St dev
NORDSOIL116See [41]128
SWETHRO 29L05, LO7, M10, BD06, O35B, M16B, P95B, P95C, P95D2515
Whole-tree harvesting experiments 34Tönnersjöheden, Kosta, Lövliden, Lund97
Total29 1513
1 [41]. 2 [21]. 3 [42].

Appendix D

Table A5. Layer thickness and density.
SiteLayer Thickness (cm)Density (kg m−3)
1234512 345
BD063.914.036.00.00.020013781591
AC348.010.011.029.00.01308909171183
AC042.38.09.020.013.01061024111612051519
AC356.311.09.024.06.02851659165918781436
Y071.34.011.025.010.02139038919151377
U063.97.04.025.014.0113623121214921386
S221.910.015.025.00.0135834817978
S055.512.020.015.03.03821194152612981340
R091.86.014.030.00.014990113521513
O356.49.07.023.011.0172118612029351575
E211.67.09.030.04.019391998613131326
P959.57.037.06.00.0123126710631420
F221.84.024.022.00.01085778671129
F121.58.015.015.012.0103658107315381239
F232.08.010.025.07.013167491411651246
F184.35.015.030.00.0110110710901500
G222.95.09.026.010.01631033154816091609
N124.45.09.029.07.014360677917161716
H036.410.010.020.010.01111219116210011676
N134.69.011.019.011.01398939101082939
H222.610.015.025.00.017410537641408
N193.210.07.033.00.01287137611066
K134.05.010.035.00.02255158861382
L184.812.010.028.00.02778028481144
L157.013.010.020.07.0151136310358971171
M164.14.010.036.00.019575810521068
Table A6. Specific surface area.
SiteSpecific Surface Area (m2 m−3)
12345
BD0628,1511,059,207687,921
AC349598495,895471,949554,705
AC044821314,861334,683411,358459,973
AC356887256,904477,979300,161458,813
Y0728,327288,376197,188241,860671,414
U064302176,673391,887564,446418,842
S2223,270315,461350,423476,259
S0512,082545,612845,384643,632773,341
R0910,883110,442224,527261,998
O356258326,562293,151124,139216,583
E2145,320410,031480,261553,340474,955
P959760605,526553,612451,694
F223574160,078237,043739,259
F126175222,081218,479362,367401,651
F2313,343245,158333,636510,119515,197
F184811383,490649,066999,059
G2218,670310,687529,126571,219611,470
N1213,878239,824336,315121,409501,299
H032661395,470355,255378,365495,719
N137203499,499497,650564,692507,460
H2223,495245,005109,938883,003
N1910,033325,829335,266609,040
K1333,601147,733286,103461,641
L1824,927187,979250,305393,976
L152825101,456523,96768,31575,974
M1613,648203,506227,709169,613

References

  1. Schöpp, W.; Posch, M.; Mylona, S.; Johansson, M. Long-term development of acid deposition (1880–2030) in sensitive freshwater regions in Europe. Hydrol. Earth Syst. Sci. 2003, 7, 436–446. [Google Scholar] [CrossRef] [Green Version]
  2. Ferm, M.; Granat, L.; Engardt, M.; Karlsson, G.P.; Danielsson, H.; Karlsson, P.E.; Hansen, K. Wet deposition of ammonium, nitrate and non-sea-salt sulphate in Sweden 1955 through 2017. Atmos. Environ. X 2019, 2. [Google Scholar] [CrossRef]
  3. Grünewald, U.; Reuss, J.O.; Johnson, D.W. Acid Deposition and the Acidification of Soils and Waters. Ecological Studies 59–119 pp. New York, Berlin, Heidelberg, Tokyo: Springer-Verlag 1986. ISBN 3-540-96290-5. 94,-DM. Int. Rev. Der Gesamten Hydrobiol. Und Hydrogr. 1988, 73, 124. [Google Scholar] [CrossRef]
  4. Johnson, J.; Graf Pannatier, E.; Carnicelli, S.; Cecchini, G.; Clarke, N.; Cools, N.; Hansen, K.; Meesenburg, H.; Nieminen, T.M.; Pihl-Karlsson, G.; et al. The response of soil solution chemistry in European forests to decreasing acid deposition. Glob. Chang. Biol. 2018, 24, 3603–3619. [Google Scholar] [CrossRef]
  5. Akselsson, C.; Hultberg, H.; Karlsson, P.E.; Pihl Karlsson, G.; Hellsten, S. Acidification trends in south Swedish forest soils 1986–2008: Slow recovery and high sensitivity to sea-salt episodes. Sci. Total Environ. 2013, 444, 271–287. [Google Scholar] [CrossRef] [Green Version]
  6. Pannatier, E.G.; Thimonier, A.; Schmitt, M.; Walthert, L.; Waldner, P. A decade of monitoring at Swiss Long-Term Forest Ecosystem Research (LWF) sites: Can we observe trends in atmospheric acid deposition and in soil solution acidity? Environ. Monit. Assess. 2011, 174, 3–30. [Google Scholar] [CrossRef] [PubMed]
  7. Belyazid, S.; Westling, O.; Sverdrup, H. Modelling changes in forest soil chemistry at 16 Swedish coniferous forest sites following deposition reduction. Environ. Pollut. 2006, 144, 596–609. [Google Scholar] [CrossRef]
  8. Nilsson, S.I.; Miller, H.G.; Miller, J.D. Forest Growth as a Possible Cause of Soil and Water Acidification: An Examination of the Concepts. Oikos 1982, 39, 40–49. [Google Scholar] [CrossRef]
  9. Van Breemen, N.; Mulder, J.; Driscoll, C.T. Acidification and alkalinization of soils. Plant. Soil 1983, 75, 283–308. [Google Scholar] [CrossRef]
  10. Riek, W.; Russ, A.; Martin, J. Soil acidification and nutrient sustainability of forest ecosystems in the northeastern German lowlands—Results of the national forest soil inventory. Folia For. Pol. Ser. A 2012, 54, 187–195. [Google Scholar]
  11. Iwald, J.; Löfgren, S.; Stendahl, J.; Karltun, E. Acidifying effect of removal of tree stumps and logging residues as compared to atmospheric deposition. For. Ecol. Manag. 2013, 290, 49–58. [Google Scholar] [CrossRef]
  12. Lucas, R.W.; Holmström, H.; Lämås, T. Intensive forest harvesting and pools of base cations in forest ecosystems: A modeling study using the Heureka decision support system. For. Ecol. Manag. 2014, 325, 26–36. [Google Scholar] [CrossRef]
  13. Akselsson, C.; Belyazid, S. Critical biomass harvesting—Applying a new concept for Swedish forest soils. For. Ecol. Manag. 2018, 409, 67–73. [Google Scholar] [CrossRef] [Green Version]
  14. Palviainen, M.; Finér, L. Estimation of nutrient removals in stem-only and whole-tree harvesting of Scots pine, Norway spruce, and birch stands with generalized nutrient equations. Eur. J. For. Res. 2012, 131, 945–964. [Google Scholar] [CrossRef]
  15. Clarke, N.; Kiær, L.P.; Janne Kjønaas, O.; Bárcena, T.G.; Vesterdal, L.; Stupak, I.; Finér, L.; Jacobson, S.; Armolaitis, K.; Lazdina, D.; et al. Effects of intensive biomass harvesting on forest soils in the Nordic countries and the UK: A meta-analysis. For. Ecol. Manag. 2021, 482, 118877. [Google Scholar] [CrossRef]
  16. Reid, W.V.; Ali, M.K.; Field, C.B. The future of bioenergy. Glob. Chang. Biol. 2020, 26, 274–286. [Google Scholar] [CrossRef] [PubMed] [Green Version]
  17. The Swedish Forest Agency’s Statistics Database. Available online: http://pxweb.skogsstyrelsen.se/pxweb/en/ (accessed on 9 February 2021).
  18. Börjesson, P.; Hansson, J.; Berndes, G. Future demand for forest-based biomass for energy purposes in Sweden. For. Ecol. Manag. 2017, 383, 17–26. [Google Scholar] [CrossRef]
  19. Sverdrup, H.; De Vries, W. Calculating critical loads for acidity with the simple mass balance method. WaterAir Soil Pollut. 1994, 72, 20. [Google Scholar] [CrossRef]
  20. Fölster, J.; Bringmark, L.; Lundin, L. Temporal and Spatial Variations in Soil Water Chemistry at Three Acid Forest Sites. WaterAirSoil Pollut. 2003, 146, 171–195. [Google Scholar] [CrossRef]
  21. Pihl Karlsson, G.; Akselsson, C.; Hellsten, S.; Karlsson, P.E. Reduced European emissions of S and N—Effects on air concentrations, deposition and soil water chemistry in Swedish forests. Environ. Pollut. 2011, 159, 3571–3582. [Google Scholar] [CrossRef] [Green Version]
  22. Warfvinge, P.; Sverdrup, H. Critical Load of Acidity to Swedish Forest Soils. Methods, Data and Results; Lund University, Department of Chemical Engineering II: Scania, Sweden, 1995. [Google Scholar]
  23. Karlsson, P.E.; Pihl Karlsson, G.; Hellsten, S.; Akselsson, C.; Ferm, M.; Hultberg, H. Total deposition of inorganic nitrogen to Norway spruce forests—Applying a surrogate surface method across a deposition gradient in Sweden. Atmos. Environ. 2019, 217. [Google Scholar] [CrossRef]
  24. Posch, M.; de Smet, P.; Hettelingh, J.-P.; Downing, R. Calculation and Mapping of Critical Thresholds in Europe. Status Report 1995; Coordination Center of Effects, Rijksinstituut voor Volksgezondheid en Milieu RIVM: Bilthoven, The Netherlands, 1995. [Google Scholar]
  25. Galloway, J.N. Acid deposition: Perspectives in time and space. WaterAirSoil Pollut. 1995, 85, 15–24. [Google Scholar] [CrossRef]
  26. Sverdrup, H.; Warfvinge, P. Calculating field weathering rates using a mechanistic geochemical model PROFILE. Appl. Geochem. 1993, 8, 273–283. [Google Scholar] [CrossRef]
  27. Posch, M.; Kurz, D. A2M—A program to compute all possible mineral modes from geochemical analyses. Comput. Geosci. 2007, 33, 563–572. [Google Scholar] [CrossRef]
  28. Persson, C.; Roos, E.; Lövblad, G. Meso-Scale Modelling of Base Cation Deposition in Sweden; Springer: Boston, MA, USA, 2000; pp. 117–125. [Google Scholar] [CrossRef]
  29. Lövblad, G.; Persson, C.; Klein, T.; Ruoho-Airola, T.; Hovmand, M.; Tarrason, L.; Tørseth, K.; Moldan, F.; Larssen, T.; Rapp, L. The Deposition of Base Cations in the Nordic Countries; IVL Swedish Environmental Research Institute: Stockholm, Sweden, 2004. [Google Scholar]
  30. Futter, M.N.; Ring, E.; Högbom, L.; Entenmann, S.; Bishop, K.H. Consequences of nitrate leaching following stem-only harvesting of Swedish forests are dependent on spatial scale. Environ. Pollut. 2010, 158, 3552–3559. [Google Scholar] [CrossRef]
  31. Akselsson, C.; Olsson, J.; Belyazid, S.; Capell, R. Can increased weathering rates due to future warming compensate for base cation losses following whole-tree harvesting in spruce forests? Biogeochemistry 2016, 128, 89–105. [Google Scholar] [CrossRef] [Green Version]
  32. Swedish Forest Agency. Skogliga Konsekvensanalyser 2008: SKA-VB 08; Swedish Forest Agency: Jönköping, Sweden, 2008. [Google Scholar]
  33. Sverdrup, H.; Warfvinge, P.; Rabenhorst, M.; Janicki, A.; Morgan, R.; Bowman, M. Critical loads and steady-state chemistry for streams in the state of Maryland. Environ. Pollut. 1992, 77, 195–203. [Google Scholar] [CrossRef]
  34. Braun, S.; Tresch, S.; Augustin, S. Soil solution in Swiss forest stands: A 20 year’s time series. PLoS ONE 2020, 15, e0227530. [Google Scholar] [CrossRef]
  35. Pihl Karlsson, G.; Hellsten, S.; Akselsson, C.; Karlsson, P.E. Försurning och Övergödning i Skåne län Resultat från Krondroppsnätet till och med 2018/19; IVL Swedish Environmental Research Institute: Stockholm, Sweden, 2020. [Google Scholar]
  36. Ågren, A.; Löfgren, S. pH sensitivity of Swedish forest streams related to catchment characteristics and geographical location—Implications for forest bioenergy harvest and ash return. For. Ecol. Manag. 2012, 276, 10–23. [Google Scholar] [CrossRef]
  37. Jonard, M.; Fürst, A.; Verstraeten, A.; Thimonier, A.; Timmermann, V.; Potočić, N.; Waldner, P.; Benham, S.; Hansen, K.; Merilä, P.; et al. Tree mineral nutrition is deteriorating in Europe. Glob. Chang. Biol. 2015, 21, 418–430. [Google Scholar] [CrossRef]
  38. Jonard, M.; Legout, A.; Nicolas, M.; Dambrine, E.; Nys, C.; Ulrich, E.; van der Perre, R.; Ponette, Q. Deterioration of Norway spruce vitality despite a sharp decline in acid deposition: A long-term integrated perspective. Glob. Chang. Biol. 2012, 18, 711–725. [Google Scholar] [CrossRef]
  39. Schulze, E.D. Air Pollution and Forest Decline in a Spruce (Picea abies) Forest. Science 1989, 244, 776–783. [Google Scholar] [CrossRef] [PubMed]
  40. De Jong, J.; Akselsson, C.; Egnell, G.; Löfgren, S.; Olsson, B.A. Realizing the energy potential of forest biomass in Sweden—How much is environmentally sustainable? For. Ecol. Manag. 2017, 383, 3–16. [Google Scholar] [CrossRef] [Green Version]
  41. Stendahl, J.; Akselsson, C.; Melkerud, P.-A.; Belyazid, S. Pedon-scale silicate weathering: Comparison of the PROFILE model and the depletion method at 16 forest sites in Sweden. Geoderma 2013, 211–212, 65–74. [Google Scholar] [CrossRef] [Green Version]
  42. Brandtberg, P.-O.; Olsson, B.A. Changes in the effects of whole-tree harvesting on soil chemistry during 10years of stand development. For. Ecol. Manag. 2012, 277, 150–162. [Google Scholar] [CrossRef]
Figure 1. The 26 sites within the Swedish Throughfall Monitoring Network (SWETHRO) included in the study, and the borders delineating the three regions of Sweden: North (Norrland), Central (Svealand) and South (Götaland), (a) and the average S deposition in Sweden for the years 2001–2006, created by interpolation of SWETHRO data [21] from those years (b).
Sustainability 13 02395 g001
Figure 2. ANC in soil solution at a 50 cm depth in the mineral soil as medians for the years 2014–2018, with three sampling occasions per year.
Sustainability 13 02395 g002
Figure 3. Exceedance of CBH if whole-tree harvesting is applied.
Sustainability 13 02395 g003
Figure 4. The sites divided into risk classes based on ANC in soil solution and exceedance of critical harvesting, shown as a graph (a) and a map (b).
Sustainability 13 02395 g004
Table 1. Characteristics for the 26 SWETHRO sites included in the study. The sites are organized from north to south.
SiteLatLongSite Index 1Moisture Class 6Stoni-ness, %Data Period 7BC Dep OF 8No of LysimetersRegion
BD0666.06621.468G18 24202016–2018Yes5North
AC3465.94516.314G17 43202014–2018No4–5North
AC0465.40818.112G16 34202014–2018Yes5North
AC3564.54221.086G20 23202014–2018Yes5North
Y0762.28416.348G20 33202014–2018Yes5–6North
U0659.94116.524G22 33602014–2018No5–6Central
S2259.82112.902G32 3352014–2018Yes5Central
S0559.00813.110G22 5452014–2016Yes5Central
R0958.62513.777G30 33152014–2018No5South
O3558.44111.731G26 3452014–2017Yes3–5South
E2158.15615.435G32 3352014–2018No3–5South
P9557.86612.673G26 53152014–2018Yes5South
F2257.83915.000G28 33352014–2018No5South
F1257.82514.394G28 3352014–2018No5South
F2357.50915.341G32 32102014–2018Yes4South
F1857.14913.594G26 33102014–2018No5South
G2257.06114.374G28 3452014–2018Yes5South
N1256.95312.816G30 32502014–2018No4–5South
H0356.85316.316G28 33302014–2018Yes5South
N1356.77213.158G30 53202014–2018Yes5South
H2256.63815.629G32 33202014–2018No4South
N1956.35512.993G32 53102014–2018No5South
K1356.27015.453G34 33102014–2016No3–4South
L1856.17713.521G30 53102014–2018Yes5South
L1555.62014.094G34 33202014–2018No5South
M1666.06621.468G36 5352014–2018Yes5South
1 Site index is directly linked to site productivity (m3 ha−1 y−1) and is a measure of the optimal growth of a stand. The letter “G” means that the tree species is Norway spruce and the number is the projected tree height when the stand is 100 years old. 2 Field assessments in 2020. 3 From the ICP level II database (International Co-operative Programme on Assessment and Monitoring of Air Pollution Effects on Forests, http://www.icp-forests.org (accessed on 19 February 2021)). 4 Assessment based on satellite data and information from a nearby wood-land key habitat. 5 From forest owner/forest manager/Forest Agency. 6 Class 2: Dry (0.15 m3 m−3), Class 3: Moderately moist (0.20 m3 m−3), Class 4: Moist (0.25 m3 m−3). Translation to volumetric water content is based on [22]. 7 Years available in the period 2014–2018. 8 Information on whether there is an open field site close by, where base cation (BC) wet deposition is measured.
Table 2. Main input data used for weathering modelling (Weath), calculation of critical biomass harvesting (CBH), and exceedance (Exc).
ParameterUseSource
Deposition
Deposition S, ClWeath, CBHField measurements
Deposition of NWeathBased on field measurements
Deposition of Ca, Mg, KWeath, CBHBased on field measurements and modelling
Deposition of NaWeath, CBHBased on Cl deposition
Leaching
NH4-NleachCBHBased on field measurements and runoff
NO3-NleachCBHBased on field measurements, runoff, and an empirical function
Climate
TemperatureWeathEstimated by SMHI 1, based on measurements
PrecipitationWeathEstimated by SMHI 1, based on measurements
RunoffWeath, CBHEstimated by SMHI 1, based on measurements
Soil properties
Mineral compositionWeathModelled with A 2M 2, based on field measurements
Specific surface areaWeathEstimated based on field measurements
StoninessWeathField observations
MoistureWeathField observations
Soil bulk densityWeathEstimated based on field measurements
Forest data
Net harvest loss of BC 3Weath, ExcEstimated based on site index from sites (Table 1)
Net harvest loss of N 3WeathEstimated based on site index from sites (Table 1)
1 Swedish Meteorological and Hydrological Institute. 2 The A2M program [27]. 3 Net loss at harvesting of biomass (stems, branches, and tops).
Table 3. Soil solution chemistry, medians for the period 2014–2018 (meq L−1). The sites are arranged from north to south. The last column “n” is the number of samples.
SiteSClNO3-NNH4-NCaMgNaKANCn
BD060.030.020.000.000.040.030.050.010.076
AC340.090.050.000.000.420.030.070.010.3915
AC040.030.020.000.000.030.020.050.010.0615
AC350.120.020.000.000.040.050.060.020.0510
Y070.020.020.000.000.030.020.060.000.0513
U060.050.070.000.000.050.040.100.010.092
S220.080.120.000.000.070.020.120.00−0.00314
S050.070.150.000.000.030.030.190.000.029
R090.280.310.000.000.040.110.430.010.0214
O350.070.450.000.000.010.070.370.01−0.0711
E210.150.020.000.000.100.040.040.040.059
P950.110.340.000.000.030.080.400.010.0435
F220.100.260.000.000.040.030.220.01−0.068
F120.130.230.000.000.100.030.210.00−0.0059
F230.280.480.000.000.070.080.390.01−0.2014
F180.090.260.000.000.020.020.220.00−0.0512
G220.170.400.000.000.070.100.410.020.0212
N120.100.370.000.000.020.070.460.02−0.0314
H030.590.880.000.000.230.240.850.01−0.018
N130.140.520.010.000.010.040.530.00−0.1312
H220.120.130.000.000.040.040.140.00−0.0111
N190.090.590.000.000.010.040.400.01−0.0412
K130.260.460.000.000.030.060.510.01−0.1118
L180.190.780.170.000.020.080.760.01−0.2916
L150.120.410.000.000.010.020.390.00−0.1311
M160.150.740.450.000.130.180.350.02−0.2211
Table 4. Risk classes for whole-tree harvesting sustainability, based on present acidification status (acid neutralizing capacity (ANC) in soil solution) and exceedance of CBH.
ClassOutcome for the Two Risk FactorsRisk Related to Acidification from Whole-Tree Harvesting
1ANC < 0 and ExcCBH > 0High
2ANC < 0 and ExcCBH < 0 or ANC > 0 and ExcCBH > 0Medium
3ANC > 0 and ExcCBH < 0Low
Table 5. CBH and its exceedance on the 26 sites, along with the different components in the calculations (meq m−2 y−1). The sites are arranged from north to south.
SiteWeath-eringCa + Mg + K dep.S dep.NO3-N LeachingNH4-N LeachingBC Removal at HarvestingCBHExc.
BD0652.65.34.11.50.3119.151.9−32.7
AC3416.56.23.11.40.5917.717.10.6
AC0416.96.03.31.20.4416.218.0-1.8
AC3515.28.211.91.90.3722.08.713.4
Y077.76.74.81.90.4722.06.515.5
U063.914.05.54.20.2334.86.628.2
S2215.910.412.48.00.4960.20.959.3
S0554.118.412.53.60.3330.747.5−16.8
R0918.421.110.27.70.2458.513.045.6
O3512.933.332.78.40.6645.8−22.768.5
E2125.721.86.98.90.2065.528.137.4
P9519.330.728.95.90.6245.8−9.555.2
F2210.822.38.86.80.2552.112.839.4
F1210.825.09.26.80.2752.112.439.7
F2313.919.611.28.70.2465.57.757.7
F1858.133.716.45.90.5145.853.6−7.8
G2263.024.911.96.80.3752.161.5−9.3
N125.344.243.47.80.7958.5−44.2102.7
H0317.025.911.56.80.1952.118.433.7
N1322.252.632.911.50.8158.54.653.9
H2230.226.112.58.70.2565.529.735.7
N1920.238.833.38.80.6165.5−5.671.0
K1324.028.119.49.90.2673.013.359.7
L1812.232.931.488.60.5258.5−96.6155.1
L154.134.437.09.90.4073.0−23.496.4
M164.934.150.9135.60.3080.5−169.0249.5
Table 6. Distribution of the different risk classes among sites in the three regions.
RegionNumber of Sites
Class 1Class 2Class 3
North032
Central111
South1341
Publisher’s Note: MDPI stays neutral with regard to jurisdictional claims in published maps and institutional affiliations.

